INTRODUCTION 1.1 Background and the Objectives of the Review
←
→
Page content transcription
If your browser does not render page correctly, please read the page content below
Policy Discussion Paper 2013-01
             AFRICAN HERITAGE INSTITUTION

INTRODUCTION

1.1     Background and the Objectives of the Review
Getting rid of poverty and other social inequalities and undoing the damage to the
environment is, of course, a long-term undertaking. One of the functions that people
routinely expect governments to perform is to reduce inequality and poverty. According
to Sahn and Younger (2000)1, these goals sit somewhat uncomfortably beside the more
traditional concerns among economists for economic efficiency, including the provision
of public goods. Nevertheless, it is possible to gauge the extent to which governments are
moving in the direction of meeting their commitments to social and economic aims,
through a scrutiny of their policy and budgetary activities. Public budgeting is at its
essence about the generation and use of public resources. Examination of public budgets
tells us whether governments’ allocation of public resources is in line with the
commitments they have made in terms of policy pronouncements. Budgets matter
precisely because they are powerful policy tools with profound implications for social
equity outcomes. Budget is equally important politically and socially, perhaps more so
than issues of economic efficiency. Even the most neo-classical policymaker is adhering
to the policy’s consequences for the poor. In a similar vein, debates about developing
massive poverty alleviation which is the general objective of the Millennium
Development Goals (MDGs) are currently dominated by many issues especially
development finance (budget), gender, democracy, etc.

Budget all over the world is an important tool of governance and the second most
important document after the constitution. It is the translation in financial terms of the
action programme of the state, coordinating planned expenditures with expected revenue
and proposed borrowing operations. Going by the words, of Agbakoba & Emelonye
(2001)2, the budget is a national plan that cuts across departmental boundaries and ties
together all plans and projects.
Current literature has shown that one of the observed development efforts where people
at the lower quintiles benefits can be felt very fast is the issue of development financing
through the budgets. It has been observed that why progress towards achieving most of
the Millennium Development Goals (MDGs) is so slow is in part a failure to attach
money to policy commitments. Whilst government budgets have allocated resources in a
way that has perpetuated biases, budgets also offer the potential to transform inequalities.
Nigeria’s economic growth indices since the return to democracy in 1999 have recorded
mixed results. The performance of the economy during the period 1999-2009 was mixed

1
 Sahn, D., & S. Younger. 2000. “Expenditure Incidence in Africa: Microeconomic Evidence.” Fiscal Studies
21(3):329-48.

2
 Agbakoba, O. & U. Emelonye 2001. “Test of Progressive Realization of Economic, Social and Cultural
Rights in Nigeria (1990 – 1999 Budget Analysis)”, Lagos, HURILAWS, pp. 11

                                                                                                      1
Policy Discussion Paper 2013-01
AFRICAN HERITAGE INSTITUTION
with Gross Domestic Product (GDP) growth at average of 6.5%, partially driven largely
by non-oil sectors. Domestic price level was fairly stable with inflation declining
marginally from an average of 11.9 % in 1999 – 2003 to 11.6% in the 2004 – 2009
periods. The growth of the GDP for the period was above the 3.2% average population
growth rate but below the 7% bound mark suggested for breaking the shackles of poverty
in any developing and less-developed economy. Also agriculture was the dominant sector
during the period. Therefore, while the economic growth potential was improving in the
period, the attributes of economic development was still far from being achieved.
The external sector recorded current account balance surplus during 1999 –2008, except
2009 due to lagged effects of the global financial crisis. Nigeria exited the Paris club in
2006 and maintained low debt/GDP ratio during the period. The period also recorded a
stable exchange rate.
The Federal Government of Nigeria (FGN) in trying to move on the path of sustainable
economic development that can solve the problems of poverty and inequality in 2009
came up with a perspective plan called Vision 20:2020 emanating from the questions
posed by an interesting piece of research conducted by the leading US investment bank,
Goldman Sachs and his team where they asked “which other countries can join the
Brazil, Russia, India and China (BRIC) along the G7 countries in becoming the leading
global economies by the year 2020”. Their research produced some interesting results.
They estimated that by the year 2025, the top 20 global economies will be comprised of:
The G-7 countries, namely: US, Japan, Germany, UK, France, Italy and Canada; plus the
BRIC: Brazil, Russia, India and China making a total of 11 countries. The remaining 9
countries were predicted as: Korea, Mexico, Indonesia, Turkey, Iran, Vietnam, Pakistan,
Philippines and Nigeria. The FGN based on the above study decided to move from
research to reality by coming up with an economic development blueprint and a
perspective plan: Vision 20:2020.
It is noteworthy that medium-term, rolling planning and perspective planning are no
longer new in Nigeria because Nigeria has had a relatively long planning experience,
starting with the Colonial Development Plan for Economic Development and Welfare
(1958-1968) to the five-year fixed medium-term development plans that were adopted
after independence in 1960. Medium-term development plans adopted after independence
are 1970-1974, 1975-1980 and 1981-1985 development plans while the Structural
Adjustment Programme (SAP) which was introduced in 1986 and lasted to 1988.
Thereafter, three-year National Rolling Plans were adopted and implemented until the
return to democratic governance in 1999. The first Rolling Plan covered the period 1989-
1991. This was followed by the 1990-1992, 1991-1994, 1992-1995 respectively before
they were truncated for a period of nearly 10 years, 1995-2004.
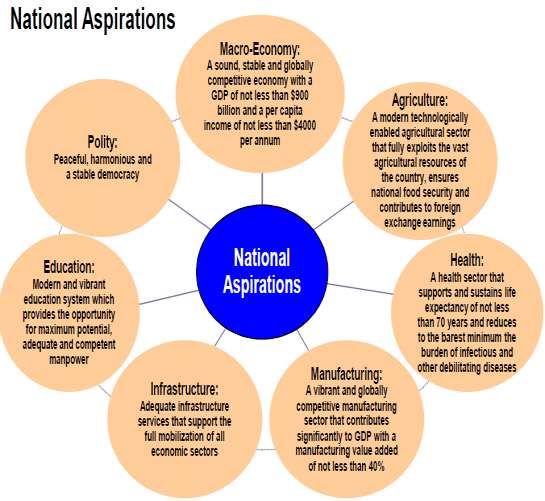
Vision 20:2020 just as other previous plans contains macroeconomic and strategic
framework which encompass the vision statement, strategic objectives, plan and
programme thrusts, national investment priorities, macro-economic policy thrusts,
projections and outlook that will drive the development of the economy. In pursuance of
the goal set in the Vision20:2020, NV 2020 is to be implemented through three medium
term development plans as presented in figure 1 below thus:
2Policy Discussion Paper 2013-01
AFRICAN HERITAGE INSTITUTION
Figure 1: Nigeria Vision 20:2020 and the three medium term development plans
Source: Extract from the Presentation of Shamsuddeen Usman, Minister of National Planning at the
Validation Workshop on the First Four-Year Implementation Plan for NV 20:2020, Eko Hotel and Suites,
Lagos, 5 August, 2010
Based on the three medium term development plans (2010-2013; 2014-2017; and 2018-
2020), Medium Term Expenditure Frameworks (MTEFs) and annual budgets for various
years will be drawn.
The current administration in line with the tenets of NV 20:2020 came up with an agenda
called the Transformation Agenda that will help correct lack of continuity, consistency
and commitment (3Cs) to agreed policies, programmes and projects as well as an absence
of a long-term perspective. The Transformation Agenda draws its inspiration from the
NV 20:2020 and the First National Implementation Plan (NIP) of 2010-2013, with the
aim of deepening the effects and providing a sense of direction for the current
administration over the next four years. The agenda is based on a set of priority policies
and programmes which when implemented will transform the Nigerian Economy to meet
the future needs of the Nigerian people.
The year 2013 is the last year for the implementation of the NIP and economic and social
indicators in Nigeria have still not improved significantly hence the need for a review of
the key federal level strategic documents vis, Vision 20: 2020 and its First National
Implementation Plan (founding documents), the Transformation Agenda, MTEF 2013-
2015, the SURE-P and budgets 2010-2013 (later documents) etc. The objective of this
review is to highlight major infrastructural and capital programme commitments. The
posers to be resolved through the review are:
a. What are the major infrastructure or capital projects identified by these
documents?
b. How realistic are the projections in these documents in terms of the realisability
of its goals on capital projects?
c. Is there harmony or consistency between the provisions of the founding
documents such as Vision 20: 2020 and its Implementation Plan and the later
documents such as the Transformation Agenda and the MTEF?
d. What are the challenges posed by any identified inconsistencies?
3Policy Discussion Paper 2013-01
AFRICAN HERITAGE INSTITUTION
e. Are there funding gaps between the founding and later documents?
f. What are the implementation issues and challenges in the founding and later
documents?
2.0 THE REVIEW OF FOUNDING AND LATTER DOCUMENTS
2.1 Vision 20: 2020 and the First National Implementation Plan (NIP)
The NV 20:2020 economic transformation blueprint is a long term plan for stimulating
Nigeria’s economic growth and launching the country into a path of sustained and rapid
socio-economic development. The blueprint articulates Nigeria’s economic growth and
development strategies for the eleven-year period between 2009 and 2020, and is
expected to be implemented using a series of medium term national development plans.
The first of such plan is the FIP that covers the period 2010-2013. The vision statement
of Vision 20:2020 is hinged on the recognition of the enormous human and natural
endowments of the nation, hence the vision is an expression of Nigeria’s intent to
improve the living standards of her citizens and place the country among the Top 20
economies in the world with a minimum GDP of $900 billion and a per capita income of
no less than $4000 per annum by the year 2020. The vision statement reads thus:
By 2020, Nigeria will have a large, strong, diversified, sustainable and
competitive economy that effectively harnesses the talents and energies of
its people and responsibly exploits its natural endowments to guarantee a
high standard of living and quality of life to its citizens.
In summary the vision anchored on two specific targets, by 2020: GDP of not less than
US$ 900 billion and a per capita income of not less than US$ 4,000. From here on
deriving the plan is almost mechanical while growth is aimed at improvement in the
quality of life of Nigerians. Vision 20:2020 sees people as the fundamental reason for
growth hence its efforts towards achieving inclusiveness, equity and balanced
development. The six main policy thrust of Vision 20:2020 are:
Bridging the Infrastructural gap to unleash economic growth and wealth creation;
Optimising the sources of economic growth to increase productivity and
competitiveness;
Building a productive, competitive and functional human resource base, for
economic growth and social advancement;
Developing a knowledge-based economy;
Improving governance, security, law and order and engendering more efficient
and effective use of resources to promote social harmony and conducive business
environment for growth; and
Fostering accelerated, sustainable social and economic development in a
competitive and environmentally friendly manner.
4Policy Discussion Paper 2013-01
AFRICAN HERITAGE INSTITUTION
Both NV 20:2020 and the NIP observed that public sector funding have been insufficient
hence the need for critical compliment from the private sector funding (domestic and
foreign) as well as improvement in the financial sector’s role in mobilizing funding. This
is the only way Nigeria will have a large, strong, diversified, sustainable and competitive
economy that effectively harnesses the talents and energies of its people and responsibly
exploits its natural endowments to guarantee a high standard of living and quality of life
to its citizens.
NV 20:2020 and the NIP also observed some key development challenges as:
inadequacy of critical infrastructure; high level of youths and graduate unemployment;
weak research for development and innovation; subsistence agriculture; minimal
contribution of the manufacturing sector to employment; fiscal sector continuous
constrained by dominance of oil revenue; concerns with the growth of sub-national (state-
level) debt; etc. These key challenges were used to develop the various national
aspirations that can help the economy develop sustainably as presented in figure 2 below:
Figure 2: Nigeria’ s Aspirations by 2020
Source: Extract from the Presentation of Shamsuddeen Usman, Minister of National Planning at the
Validation Workshop on the First Four-Year Implementation Plan for NV 20:2020, Eko Hotel and Suites,
Lagos, 5 August, 2010.
Against the background of the numerous challenges and constraints obstructing the
growth and development of the country, the first National Implementation Plan (NIP)
5Policy Discussion Paper 2013-01
AFRICAN HERITAGE INSTITUTION
identifies some of the actions that will ensure the successful realisation of the vision as
follows:
Expansion of investments in critical infrastructure;
Fostering private sector-led non-oil growth to build the foundation for economic
diversification;
Investing in human capital development to enhance national competitiveness;
Changing the value system to encourage honesty, industry and eliminating the
culture of worshipping money;
Entrenching merit as a fundamental principle and core value;
Addressing threats to national security;
Deepening reforms in the social sector and extending reforms to the states and
local governments;
Correcting the weaknesses inherent in the revenue allocation framework;
Intensifying the war against corruption; and
Establishing the process for free and fair elections.
The NIP recognizes the adverse effects of the well-known major constraints to growth
and sustainable national development. It accordingly provides for the achievement of
double digit economic growth rate by 2013 as a basis to overcome the challenges and lay
a solid foundation for national development for the next two medium terms (2014-2017;
and 2018-2020).
The programmes and projects contained in the first NIP are those considered vital or
priority projects for the purpose of realizing the goals of the Vision and the first NIP.
These are physical infrastructure (power, energy, transportation, water, housing, etc);
human capital development; productive sector; regional development; governance and
security, knowledge-based economy and general administration with shares of 3 per cent,
respectively. Thus, public sector investment priorities will be on the rehabilitation and
expansion of the nation’s stock of infrastructure and on those areas critical for growing
private sector investment. A good example of such target is in the power sector where the
goal of NV20:2020 is to generate, transmit and distribute 35,000MW of electricity by
2020, and to ensure that the power sector is able to efficiently deliver sustainable,
adequate, qualitative, reliable and affordable power in a deregulated market. It is
expected that the power sector will ultimately be private sector-driven. The overall target
for the plan period is to increase electricity generation, transmission and distribution from
the 3,700MW capacity in December 2009 and to increase per capita consumption from
the current 125KWH to 500KWH over the plan period.
In line with the above objectives, the NIP has the following main policy thrusts:
Addressing the infrastructure problems to promote economic growth and wealth
creation;
Making the best use of the sources of economic growth to increase productivity
and competitiveness;
Building a productive, competitive and functional human resource base;
Developing a knowledge-based economy;
6Policy Discussion Paper 2013-01
AFRICAN HERITAGE INSTITUTION
Improving governance, security, law and order and engendering a more efficient
and effective use of resources; promoting social harmony and a conducive
business environment for growing the economy; and
Fostering accelerated, sustainable social and economic development in a
competitive and environmentally friendly manner.
The programmes and projects of the NIP are grouped under the following six thematic
areas viz: Physical Infrastructure Development (power, transport, oil and gas
infrastructure, housing and water resources); Productive Sector; Human Capital
Development; Governance and General Administration; Regional Development; and
Developing a Knowledge-based Economy. In summary, Nigeria’s Vision and the first
NIP recognise that a total capital allocation of approximately N10 trillion will be
distributed to different sectors in the period 2010-2013.
2.2 Identified Infrastructure Need and Key Initiatives, Projects and
Programmes (Vision 20:2020 and the First NIP Sectoral Plans and Projects)
Power
According to NIP, Nigeria requires 1,773 million standard cubic feet per day (MMscfd)
of gas to generate 6,000MW of electricity and 4,787MMscfd to generate 16,000MW of
electricity by 2013 from gas-fired thermal power generation plants. However, completion
of on-going government and joint venture gas infrastructure projects will increase the
available generation capacity to 9,089MW of electricity with 2,685MMscfd of gas
resulting in a shortfall of 6,911MW of electricity and 2,102MMscfd of gas by 2013.
The key initiatives, projects and programmes that will facilitate the realization of the gas
supply shortfall by 2013 include the development of gas resources from Obiafu/Obrikom
fields held by Nigeria Agip Oil Company (NAOC); the construction of a 100km 48”
pipeline to evacuate gas through the East-West interconnector gas pipeline from
Obiafu/Obrikom in the East to Oben node in the West. The total project estimate is N33
billion, and is expected to be completed over a one year period. The other project is the
construction of a 30km gas pipeline from the existing export line. There is also the need
to extend the Gas Transmission System (GTS1) to Obigbo North Spur line in Rivers State
to evacuate gas to the Afam thermal power plant. The pipeline was to be completed by
2011 and expected to feed gas directly from the LNG export line once the Domestic Gas
Obligation (DGO) is implemented. There is also the construction of a 400km gas pipeline
through Calabar-Umuahia-Ajaokuta to supply gas to the power plants in the Eastern part
of Nigeria such as Alaoji, Geometric power plant, etc. The phase I of the project will be
completed by 2013. The total proposed investment in the sector, during the plan period is
N880.98billion. This will cover investments in four major areas: power generation;
transmission; distribution; and alternative energy.
The Transport Sector
At present, the transport system is characterised by a moribund rail system, large sections
of impassable inland waterways, inadequate port infrastructure, poor and badly
maintained road networks, poor interconnectivity of all transport systems, inadequate and
poorly maintained airports. In view of these challenges, Nigeria now aspires to evolve a
7Policy Discussion Paper 2013-01
AFRICAN HERITAGE INSTITUTION
multimodal, integrated and sustainable transport system, with greater emphasis on rail
and inland waterways transportation.
Roads and Bridges
Nigeria has a total road network of 193,200 kilometres, comprising 34,123 km federal
roads, 30,500 km state roads, and 129,577 km local government roads. The Nigerian road
network is characterized by inadequate routine and emergency maintenance coupled with
poor initial construction and design. The inadequate maintenance and neglect of roads
implies a loss of network value of N80 billion per year and an additional operating costs
of N35 billion per year.
Railways
Nigeria’s rail network consists of 3,505 km, narrow gauge (1.067 m) single track rail
lines running from Lagos to Kano and Port Harcourt to Maiduguri and the uncompleted
349 km of standard gauge from Itakpe to Warri via Ajaokuta. The highest number of
passengers carried was 15.5 million in 1984 and the highest volume of freight was 2.4
million metric tonnes in 1977, and by 2000/1 traffic had fallen to two million passengers
and less than 300,000 metric tonnes of freight due to the bad condition of the railway
system in the country. To reposition the rail system, government has, therefore, embarked
on a programme of rehabilitation, reactivation and modernisation of the railways.
Inland Waterways
Nigeria has 12 major inland navigable rivers of about 3,800 km. The country also has an
extensive coastline of about 852 km. This offers great potential for the movement of
goods and passengers from the coast to the hinterland, since these waterways traverse 20
out of the 36 states of the country. But the waterways are buffeted by various
inefficiencies. Government is, however, set to tackle these inefficiencies. For instance,
government has embarked on the dredging of the lower river Niger from Warri in Delta
State to Baro in Niger State to enhance all year navigability. The dredging project, which
spans eight states namely: Niger, Kogi, Anambra, Imo, Edo, Delta, Rivers and Bayelsa,
has been divided into five lots to ensure timely completion.
Air Transport
Nigeria has a total of 21 airports and 62 airstrips. Among these are four international
airports in Abuja, Lagos, Port Harcourt and Kano, and one airport in Calabar with
connections to the West African sub-region. Also, there are several privately owned
airstrips. The Federal Airports Authority of Nigeria (FAAN) owns and operates all but
three of the 21 airports. The National Airspace Management Agency (NAMA) is in
charge of air traffic control, regulations and navigational aids for aircrafts. Safety
oversight and all other civil aviation issues are the responsibility of the Nigerian Civil
Aviation Authority (NCAA). Passenger and cargo traffic has been growing steadily in
recent years. However, many of the airports are in need of major repair and only three of
them (Lagos, Abuja and Kano) cover their operating costs.
National Security
8Policy Discussion Paper 2013-01
AFRICAN HERITAGE INSTITUTION
One of the key objectives of NV20:2020 is to develop an economically – prosperous,
politically – stable and socially – just society where the security of lives and properties is
guaranteed and underpinned by a constitutionally independent judicial system that
ensures respect for the rule of law and promotes equal rights to justice. Nigeria aspires to
build an economically - prosperous, politically -stable and socially – just society, where
security of life and property of the generality of the people is guaranteed against
victimization, from both external and internal threats or attacks in all places and at all
times, be it military, economic, political or social.
2.2 The Transformation Agenda
The Transformation Agenda is a Summary of Federal Government’s Key Priority
Policies, Programmes and Projects for the years 2011-2015. Nigerians were meant to
believe that the prioritized policies, programmes and projects contained in the
Transformation Agenda were properly scrutinized by a Presidential Committee set up for
this purpose. It was assisted by technical experts drawn from the public and private
sectors. The agenda was in response to continuity, consistency and commitment (3Cs) to
agreed policies, programmes and projects as well as an absence of a long-term
perspective. It covers issues such as macroeconomic framework and economic direction,
governance, sector priority policies, programmes and projects of the following key
thematic areas. (i) Real sector, (ii) Infrastructure, (iii) Human Capital, (iv) Enablers
(which include private investment, finance mobilization, external economic relations and
diplomacy, etc.) and (v) Monitoring and Evaluation.
The key priority programmes and projects to drive the Transformation Agenda were
selected from 20 Ministries Departments and Agencies (MDAs) and sectors of
government. A total of 1,613 projects were identified; out of which 385 (about 22 per
cent) were new while 1,361 (about 78 per cent) were on-going. After thorough scrutiny
and on the basis of the selection criteria adopted, 685 projects (about 39 per cent of the
total projects considered) were admitted into the programme during the 2012-2015
period. The number and cost of these projects in respect of each MDA/Sector were
carefully done to drive government spending for the period 2012-2015. The
transformation agenda in its drive to tackle public sector investment on the rehabilitation
and expansion of the nation’s stock of infrastructure and on those areas critical for
growing private sector investment provided for sector by sector capital expenditure as
follows:
Transportation including Roads, Bridges, Waterways and Airways
An estimated total investment of approximately N4.465 trillion is required for the sector
for the period 2011-2015 covering roads and bridges, railways, inland waterways, ports
and airports development. The main policy thrust during the Plan period is to evolve a
multimodal, integrated and sustainable transport system, with greater emphasis on rail
and inland waterways transportation. An enabling environment for Public-Private
Partnership (PPP) is being created by designing new policies, legislation and institutional
framework that would support the envisaged transformation of the sector. Under this
sector the Vision 20:2020 and NIP in the first phase of the implementation plan, is
moving towards achieving the following objectives:
9Policy Discussion Paper 2013-01
AFRICAN HERITAGE INSTITUTION
Provision of adequate transport infrastructure and services for balanced socio-
economic development of the country; provision of safe,
Efficient and cost-effective transport services for the country; development of the
capacity to sustain and continuously improve the quality of transport
infrastructure and service delivery in the country.
Other objectives are creation of an enabling environment for private sector participation
in the provision of transport infrastructure; and development of a seamless intermodal
transport system. Under the NIP, it is hoped that by the end of 2013 the following
projects and will be achieved under Rail, Road, Aviation, etc.
Niger Delta
The proposed investment in the Niger Delta region for the period 2012-2015 is N335.05
billion with a main policy thrust of entrenching peace and stability to drive sustainable
socio-economic development in the Niger Delta Region aimed at reducing the high
incidence of poverty, high rate of unemployment and high level of insecurity.
Power
The agenda recognised that power is a critical infrastructure for sustainable economic
growth and development. This is because most economic activities are dependent on
affordable and adequate energy for effective operation. It is critical for reducing the cost
of doing business, enhancing productivity and quality of life. Due to such recognition the
agenda proposed a total investment of about N1.896 trillion in the sectors for the period
2011-2015. This will cover investments in four major areas of power generation,
transmission, distribution and alternative energy. This expenditure aims at increasing
generation, transmission and distribution capacity, in order to provide adequate and
sustainable power; intensifying rural electrification efforts in a more efficient manner;
and achieving optimal energy mix using the most appropriate technology.
2.3 The 2013-2015 Medium Term Expenditure Framework (MTEF) and
Fiscal Strategy Paper (FSP)
The 2013-2015 MTEF as widely known is a key component of the annual budget
documentation because it ensures that the budget lies within a medium-term plan in order
to achieve consistency with Government's overall economic plan. The FSP outlines the
fiscal strategy, analyses expenditure and revenue figures for the years under review,
details the assumptions underlying these projections, reviews the previous budget and
gives an overview of consolidated debt and possible fiscal risks. Just like the previous
MTEFs, the 2013-2015 MTEF presented the previous budgets (2011) performance with
aggregate expenditure of N4.485 trillion as initial step towards fiscal consolidation as it
improved the total level of deficit to 2.85% of GDP which is a significant reduction from
the 6.06 percent of GDP in 2010. It also showed that about N857.49 billion was released
out of the appropriated capital budget in 2011 with N811.28 billion cash-backed while
MDAs utilized N713.3 billion after the capital year was extended to 31st March, 2012.
This represents an average capital utilisation of 87.9%.
10Policy Discussion Paper 2013-01
AFRICAN HERITAGE INSTITUTION
The MTEF also pointed to the fact that the 2012 budget was a further fiscal consolidation
budget with an implied deficit of 2.85% of GDP; a reduction from the 2.96 percent of
GDP budgeted in 2011 with an approved capital expenditure of N1.340 trillion.
According to the 2013-2015 MTEF, as at the end of the second quarter of 2012, total
releases for capital projects stood at N404 billion, while actual utilization as at 20th July,
2012 was 56 percent of the N324 billion cash-backed. The pace of implementation
according to the MTEF has picked up sharply since the end of May, and the tempo is
expected to be sustained going forward. The document highlighted on the Federal
Government towards streamlining the management of the subsidy scheme, including
strengthening the audit and verification process in order to improve its governance,
transparency and accountability. These are expected to yield full results in 2013, while
the Subsidy Reinvestment and Empowerment Programme (SURE-P) instrument will
continue to be used as an intervention window to mitigate the impact of the partial
subsidy removal.
The 2013-2015 MTEF put the FGN budget revenue inflow at N3.891, N4.257 and
N4.573 trillion while the total capital expenditure for MDAs is put at N1.544, N1.652 and
N1.704 trillion for 2013, 2014 and 2015 respectively.
2.4 Subsidy Reinvestment and Empowerment Programme (SURE-P)
The programme (SURE) is focused on utilisation of the Federal Government’s share from
the Premium Motor Spirit (PMS) subsidy by channelling it into a combination of
programmes to stimulate the economy and alleviate poverty through critical infrastructure
and safety net projects. In summary, SURE-P was introduced:
To mitigate the immediate impact of the petroleum subsidy on the population, but
particularly the poor and vulnerable segments;
To accelerate economic transformation through investments in critical
infrastructure projects, so as to drive economic growth and achieve the Vision
20:2020; and
To lay a foundation for the successful development of a national safety net
programme that is better targeted at the poor and the most vulnerable on a
continuous basis.
Special Target Areas: The SURE-P has seven (7) target areas as follows:
A. Social Safety Net Programmes including Maternal and Child Health; Public
Works/Women and Youth Employment Programme; Urban Mass Transit
Scheme; and Vocational Training Schemes.
B. Niger Delta Development Projects (East-West Road) including Section 1:Warri-
Kaiama (87km); Section 2.1:Port-Harcourt – Ahoada (47km); Section 2.2:
Ahoada – Kaima (54km); Section 3: East-West Road (99km); and Section 4: East-
West Road (51km).
C. Road Infrastructure Projects including Abuja-Abaji-Lokoja Dual Carriageway
(200km); Benin-Ore-Sagamu Dual Carriageway (295km); Onitsha-Enugu-Port-
11Policy Discussion Paper 2013-01
AFRICAN HERITAGE INSTITUTION
Harcourt Dual Carriageway (317km); Kano-Maiduguri Dual Carriageway
(510km); Construction of Oweto Bridge (2km); and the Construction of Second
Niger Bridge (2km).
D. Rail Transport Projects including Lagos-Ibadan Standard Dual Guage (174km);
Abuja-Kaduna Standard Guage (187km); Port-Harcourt-Umuahia-Enugu-
Makurdi-Lafia- Kuru-Kafanchan-Jos-Bauchi-Gombe-Maiduguri (2,119km);
Zaria-Funtua-Gasua-Kaura Namoda (221km); Lagos-Ibadan-Ilorin-Jebba-Minna-
Kaduna-Zaria-Kano (1,124km); and Abuja Light Rail (52km).
E. Water and Agriculture Projects including Irrigation Projects of 28,850 Hectarage
with 422,000 tons/year scattered all over the country; Urban Water Supply
Projects including: Aba/Umuahia, Greater Onitsha, Abakaliki/Ishiagu,
Okirika/Port-Harcourt, Central Ogbia, Fugar-Okpella, Illesha/Ile-Ife, Abeokuta,
Little Osse, Biu and Damaturu.
F. Rural water supply.
G. Selected Power Projects with their respective generation capacities include:
Mambilla Hydropower Project (2,600MW); Waya Small Hydropower Plant
(0.15MW); Mbowo Small Hydropower Dam (0.125MW); Ikere Gorge Small
Hydropower Dam (9MW); Oyan Small Hydropower Dam (9MW); Bakolori
Small Hydropower Dam (3MW); Tiga Dam (6MW); Chalawa Dam (6MW);
Jibiya Dam (3MW); Doma Dam (5MW); Owena Dam (3MW); Goronyo Dam
(6MW); Kampe Dam (2MW); Zobe Dam (3MW); Kashimbilla Dam (40MW);
Dadin Kowa Small Plant (34MW); Ogwashiukwu Dam (1MW); and Galma
(10MW).
H. Petroleum/NNPC Projects (Refineries) include: Bayelsa (100,000 bbls/day); Kogi
(100,000 bbls/day); and Lagos (200,000 bbls/day).
In summary, SURE-P is a programme targeted at Agriculture, Education, Health, ICT,
Petroleum, Power, Water Supply, Road and Rail transportation sectors to enhance the
socio-economic well-being of the people. The implementation began in 2012.
3.0 KEY POLICY DOCUMENTS INVESTMENT PROPOSALS
AND ACTUAL BUDGET ALLOCATION
3.1 Key Policies and Proposed Investments
An analysis of both the founding documents (Vision 20:2020 and the NIP) and later
documents (Transformation Agenda, MTEF, Annual Budgets and SURE-P) shows there
is one thing in common which is the identification of the key problems of the Nigerian
economy as inadequacy of critical infrastructure. The founding documents identified
other problems as high level of youths and graduate unemployment; weak research for
development and innovation; subsistence agriculture; minimal contribution of the
manufacturing sector to employment; fiscal sector continuous constrained by dominance
of oil revenue; concerns with the growth of sub-national (state-level) debt; etc. The
Transformation Agenda came into place in response to continuity, consistency and
commitment (3Cs) to agreed policies, programmes and projects as well as an absence of a
12Policy Discussion Paper 2013-01
AFRICAN HERITAGE INSTITUTION
long-term perspective in addition to the already identified problems hence both the
founding documents and later documents are interested in solving same problems.
Expansion of investments in critical infrastructure in order to foster private sector-led
non-oil growth to build the foundation for economic diversification as well investment in
human infrastructure and capital development to enhance national competitiveness were
the rudiments of all these policy documents reviewed.
Both the founding and later documents identified the same broad sectors and sub-sectors
for fixing the country’s problem and they are broadly grouped as Productive or Real
Sector; Regional Development: Governance & Security; Human Capital Development;
and Physical Infrastructure. The key policy documents also have proposed capital
expenditure for fixing the Nigerian economic and infrastructural problems. While Vision
20:2020 and the First NIP have such expenditure proposal for the period 2010-2013, the
Transformation Agenda has for the period 2012-2015. Also key sub sectors in both the
founding documents and later documents are the same just as there is a consensus on
vigorous investments in the power, transportation including roads, bridges, railway,
airways and waterways subsectors as well as housing, FCT and the Niger Delta region.
Similarly, the human infrastructure or human capital development component for both
the founding and later documents comprises education, health, women and social
development, youth development, labour and productivity sectors. A comparison between
the two key policies investment proposals for the period 2012 and 2013 is presented in
Table 1 below.
13Policy Discussion Paper 2013-01
AFRICAN HERITAGE INSTITUTION
Table 1: Vision 20:2020 & the first NIP vis-à-vis Transformation Agenda Investment Proposal (Naira in Millions) 3
Vision 20:2020 & First NIP Transformation Agenda Deviation
Key Sectors 2012 2013 Total 2012 2013 Total 2012 2013 Total
Productive/Real Sector 427,937.82 538,253.39 966,191.21 228,519.80 251,450.73 479,970.53 199,418.02 286,802.66 486,220.68
Regional Development 251,858.25 269,315.43 521,173.68 229,113.71 243,315.74 472,429.45 22,744.54 25,999.69 48,744.23
Governance & Security 235,037.73 238,511.04 473,548.77 169,846.06 188,791.21 358,637.27 65,191.67 49,719.83 114,911.50
Human Capital
Development 583,319.18 602,864.30 1,186,183.48 89,420.75 186,140.51 275,561.26 493,898.43 416,723.79 910,622.22
Physical Infrastructure 930,482.44 949,544.41 1,880,026.85 419,550.00 479,680.00 899,230.00 510,932.44 469,864.41 980,796.85
Grand Total 2,428,635.4 2,598,488.57 5,027,123.99 7,625,612.6 12,652,736.6 20,278,349 ( 5,196,977.14) ( 10,054,247.9) ( 15,251,225.1)
Source: Vision 20: 2020; First NIP and the Transformation Agenda
3
Numbers enclosed in parenthesis are in the negative region.
14Policy Discussion Paper 2013-01
AFRICAN HERITAGE INSTITUTION
A look at the above table reveals that the policy documents have different investment
proposals for different sectors in the same period. Consistently across all sectors, the
founding documents have by far higher investment proposition for all period than the
later documents as can be seen from the last row (grand total) in the last three columns.
Some analysts may attribute this deviation to inability to forecast the future properly or
simply over ambitious investment proposition while another school of thought may
believe that the investment projections in the later documents were produced with the
revenue profile and generation capacity in mind. It is also noteworthy that subsequent
proposed investments (2014-2015) in the Transformation Agenda are on the high
increasing trend across all sectors which may imply lower investment propositions at the
earlier stages (2012-2013) of the agenda.
3.2 Key Sectoral Policy Investment Recommendations and Approved
Allocations
A look at Table 1 above shows different investment proposals for different broad sectors
which means that they are not the same with the perspective plan (Vision 20:2020) and
its first NIP is always by far higher than that of the Transformation Agenda. Economic
projection and forecasts must be done in an organised way to avoid misleading the
economy. According to McCallum (2000)4, Today’s missed economic trend is
tomorrow’s falling market share or squandered opportunity which means that an absolute
must for reliable and consistent economic forecasting is an underlying theoretical model
of how the economy fits together and works. Evaluating the FGN response in terms of
financial provisions towards meeting with the sectoral investment projections of the
Vision 20:2020 and its first NIP for the period is presented in Table 2 below.
Table 2: Sectoral Policy Recommendations and Approved5 Allocations for the period 2010-2013 (Naira in
Millions)6
Vision 20:2020 & First NIP Sectoral Investment Recommendations
2010 2011 2012 2013 Total % Share
Productive/Real Sector 209,060.89 381,809.98 427,937.82 538,253.39 1,557,062.08 17.66
Regional Development 255,393.79 225,813.61 251,858.25 269,315.43 1,002,381.08 11.37
Governance & Security 342,338.17 226,952.30 235,037.73 238,511.04 1,042,839.24 11.83
Human Capital
Development 195,131.05 512,731.79 583,319.18 602,864.30 1,894,046.32 21.49
Physical Infrastructure 599,874.06 838,596.51 930,482.44 949,544.41 3,318,497.42 37.65
Grand Total 1,601,797.96 2,185,904.19 2,428,635.42 2,598,488.57 8,814,826.14 100.00
FGN Sectors Approved
Budgets 2010 2011 2012 2013 Total % Share
403,845.30
Productive Sector 171,770.20 57,614.53 79,632.66 94,827.91 6.55
4
McCallum, J. S (2000), “Economic Forecasts: Executives Beware”
http://www.iveybusinessjournal.com/topics/strategy/economic-forecasts-executives-beware#.UJ0YtIYbPIU
5
The 2013 Budget is yet to be approved by the time of the study.
6
Numbers enclosed in parenthesis are in the negative region.
15Policy Discussion Paper 2013-01
AFRICAN HERITAGE INSTITUTION
Regional Development 231,512.61 114,652.06 122,730.52 135,150.00 604,045.19 9.79
Governance & Security 726,513.61 727,430.74 921,910.00 793,531.66 3,169,386.02 51.39
Human Capital
Development 184,432.95 72,896.39 120,711.32 127,006.49 505,047.16 8.19
Physical Infrastructure 609,244.11 299,145.93 352,102.54 313,473.10 1,484,846.31 24.08
Grand Total 1,923,473.49 1,271,739.66 1,507,967.67 1,463,989.15 6,167,169.97 100.00
Sectoral Shortfall/Overshoot
FGN Approved Budgets 2010 2011 2012 2013 Total % Share
Productive Sector (37,290.7) (324,195.4) (348,305.2) (443,425.5) (1,153,216.8) 43.56
Regional Development (23,881.2) (111,161.6) (129,127.7) (134,165.4) (398,335.9) 15.04
Governance & Security 384,175.4 500,478.4 686,872.3 555,020.6 2,126,546.8 (80.32)
Human Capital
Development (10,698.1) (439,835.4) (462,607.9) (475,857.8) (1,388,999.2) 52.46
Physical Infrastructure 9,370.1 (539,450.6) (436,687.8) (538,386.9) (1,505,155.3) 56.85
Grand Total 321,675.5 (914,164.5) (920,667.7) (1,134,499.4) (2,647,656.2) 100.00
Source: Vision 20: 2020 & First NIP; FGN Approved Budgets various years (Federal Ministry of
Finance)
Analysis of the above table reveals that the FGN approved capital budgets for the period
2010-2013 for the productive/real; regional development; human capital development;
and physical infrastructure sectors were by far lower than the proposed investment of the
founding documents. The only broad sector that has its approved allocation higher than
the proposed investment recommendation of the founding documents is the governance
and security sector. It should also be noted that this sector approved FGN budget is for
both recurrent and capital expenditure as the sector requires humans to carryout out most
of its functions hence the only sector that records an overshoot as against other sectors
with serious shortfalls.
The review looked at the proposed investments across key infrastructures (physical,
human, real/productive and regional development) as against the proposition of the
Transformation Agenda for the period 2012 and 2013 and the detailed analysis is
presented in Table 3 below.
16Policy Discussion Paper 2013-01
AFRICAN HERITAGE INSTITUTION
Table 3: Size and Structure of the Federal Government Transformation Agenda Sectoral Investments and Commitments for 2010-2013 (Naira in Millions)
Transformation Agenda Provisions FGN Approved Budgetary Provisions Shortfalls/Overshoot from the Approved Budgets
2012 2013 2010 2011 2012 2013 2012 2013 Total
Real/Productive sector 228,519.80 251,450.7 171,770 57,615 79,633 94,828 -130,137.14 -134,122.82 -264,259.96
Agriculture & rural Development 112,007.72 120,841.7 87,517 29,463 44,670 48,730 -67,337.73 -72,111.69 -139,449.42
Water Resources 70,325.41 77,612.0 62,383 24,755 29,857 39,876 -40,468.76 -37,735.66 -78,204.42
Commerce & Industry 14,534.90 16,156.2 14,699 1,154 2,152 3,222 -12,383.00 -12,934.60 -25,317.61
Mines & Steel Development 12,901.77 14,340.9 7,171 2,242 2,954 3,000 -9,947.64 -11,340.87 -21,288.51
Physical Infrastructure 419,550.0 479,680.0 609,244 299,146 305,662 313,473 -436,687.83 -38,386.90 -928,634.36
Transport 322,800.00 372,180.0 6,685 2,688 14,384 19,326 -308,416.00 -352,853.82 -586,534.45
Roads & Bridges 150,000.00 170,000.0 144,868 128,966 135,171 136,536 -14,829.10 -33,464.00 -48,293.10
FERMA (for Maintenance of Roads) 45,300.00 55,150.00 46,364 5,260 7,604 9,502 -37,696.00 -45,647.93 -83,343.93
Waterways and Ports 2,750.00 2,980.00 20,820 15,115 10,889 11,969 8,139.00 8,988.62 6,238.62
Aviation (excluding BASA Funds) 35,000.00 45,850.00 71,311 20,742 42,827 47,000 7,826.81 1,150.00 8,976.81
Railways 89,750.00 98,200.00 100,043 29,851 17,406 10,640 -72,344.00 -87,559.78 -177,309.78
Oil & Gas 18,750.00 22,500.00 29,370 10,273 8,224 8,500 -10,525.60 -14,000.00 -24,525.60
189,783
Power 78,000.00 85,000.00 86,251 69,157 70,000 -8,842.94 -15,000.00 -23,842.94
Regional Development 229,113.71 243,315.8 231,513 114,652 122,731 135,150 106,383.19 -108,165.74 -1,782.55
Housing 41,647.71 47,615.74 2,244 17,068 19,714 19,150 21,933.71 -28,465.74 -6,532.03
Federal Capital Territory 142,466.00 105,700.0 138,360 44,184 45,807 55,000 96,658.53 -50,700.00 45,958.53
Niger Delta 45,000.00 90,000.00 90,909 53,400 57,209 61,000 -12,209.04 -29,000.00 -41,209.04
Human Capital Development 89,420.75 186,140.5 910,947 800,327 1,042,621 920,538 783,354.51 545,606.43 1,328,960.9
Education 9,850.00 100,000.0 97,208 35,089 54,650 60,141 44,800.33 -39,859.41 4,940.92
Health 45,310.00 54,000.0 67,277 33,528 55,903 55,753 10,592.57 1,753.40 12,345.97
Women & Social Development 7,103.45 7,519.03 4,782 750 2,350 3,300 -4,753.45 -4,219.03 -8,972.48
Youth Development 11,833.61 10,270.42 7,888 3,064 5,332 5,950 -6,501.69 -4,320.92 -10,822.61
Labour & Productivity 15,323.69 14,351.06 7,277 466 2,477 1,863 -12,847.18 -12,488.06 -25,335.24
17Policy Discussion Paper 2013-01
AFRICAN HERITAGE INSTITUTION
Transformation Agenda Provisions FGN Approved Budgetary Provisions Shortfalls/Overshoot from the Approved Budgets
2012 2013 2010 2011 2012 2013 2012 2013 Total
Defence & Security 169,846.06 188,791.2 726,514 727,431 921,910 793,532 752,063.94 604,740.45 1,356,804.4
Grand Total 966,604.26 1,160,586.9 1,923,473.5 1,271,739.7 1,550,646.7 1,463,989 369,353.11 -235,069.04 134,284.07
Source: Transformation Agenda and the FGN Approved Budgets various years (Federal Ministry of Finance)
18Evidence from the table above reveals that capital investment projections were only met for
defence and security; health and women social development; education; waterways and ports
aviation subsectors.
3.3 Key Physical Infrastructure Investment Recommendations and Approved
Allocations
The review focused on key infrastructures such as power, transportation including roads,
bridges, railway, airways and waterways subsectors as well as housing, power, FCT and the
Niger Delta region. These key sectors have been identified by both the founding and later
documents as key to economic growth and development.
Transportation
There is a prevalent belief among decision-makers and transport analysts that transport
development plays a vital role in enhancing economic growth by lowering production and
distribution costs, improving labour productivity, stimulating private investments and
technological innovations. Underlying this conviction is the theory that the availability of
fast, reliable and affordable transport historically has been the building block around which
cities and regions have developed and flourished. The ability to move people and goods
easily and economically is still used to explain the relative economic advantage of regions
and states. Transport infrastructure investments, can engender economic development at the
regional level, or merely facilitate its attainment when it transpires.
Transport investment therefore was defined as a capacity expansion or addition to an existing
network of roads, rail, waterways, hub terminals, tunnels, bridges, airports and harbours by
Banister & Berechman (2000)7. Transport capital improvements are carried out
incrementally, project-by-project over many years, and that each new facility constitutes but a
segment of a larger network. Hence, while each new project needs to meet evaluation criteria,
its primary transport impacts are appraised relative to the in-place network in terms of
improved travel times, costs and traffic volumes over the network.
The founding and later documents proposed investments in the transportation infrastructure
for the country to evolve into a multimodal, integrated and sustainable transport system, with
greater emphasis on rail and inland waterways transportation. The later documents proposed
that a total investment of approximately N4.465 trillion is required for the sector for the
period 2011-2015 covering roads and bridges, railways, inland waterways, ports and airports
development. Using the Transformation Agenda benchmark, Nigeria is expected to spend at
least N320 billion on roads and bridges construction and rehabilitation; N100.4 billion for
roads and bridges maintenance; N187.95 billion on railway; N5.73 billion on sea ports and
N80.85 billion on airports development for the period 2012-2013. It is unfortunate to note
that not all the sub-sectors investment recommendations were adhered to in the period 2012-
2013. Evidence from table 3 above reveals a shortfall of N48.29 billion; N83.343 billion;
N177.309 billion in the roads and bridges construction and rehabilitation, roads and bridges
maintenance and railways respectively. The other two sub-sectors aviation and waterways
recorded an overshoot in the policy recommendations but more detailed analysis as presented
in Table reveals that none went for seaports but other aspects of waterways. It is noteworthy
that the amounts used for the analysis were all budgetary allocations and not actual spending.
7
Banister, D. and Berechman, Y. (2000) “The Economic Development Effects of Transport Investments” Paper
presented at the TRANS-TALK Workshop, Brussels, November, 2000.Policy Discussion Paper 2013-01
AFRICAN HERITAGE INSTITUTION
The study further analyzed the budget items looking at the recommended priority items in the
key policy documents. This is because the key policy documents (founding and later)
identified projects that should be invested on during the period under the transportation
sector. The study went through all the capital line items in the approved budgets (2010-2012)
and the 2013budget to see how these budgets allocations are in line with policy priorities as
reflected in the key identified projects in the sector looking at rail, roads and bridges,
waterways, airways and seaport projects. Details are presented below in Table 4.
Table 4: Identified transportation projects in the key policy documents vis-à-vis budgetary provisions (2010-
2013)
Identified Projects in Transportation Sector Total Budgetary Provision 2010-2013 (Naira in Billion)
Rail Priority Projects 2010 2011 2012 2013 Total
The rehabilitation of the existing narrow gauge
railway network from Lagos to Kano 18.200 3.780 2.976 1.400 26.357
The rehabilitation of the existing narrow gauge
railway network from PH to Maiduguri 14.583 10.224 3.624 28.431
The rehabilitation of the existing narrow gauge
railway network from Zaria - Kaura-Namoda 0.999 0.999
Completion of the of 22 km standard gauge from
Ovu-Warri - - - - -
Completion of the standard gauge from Ajaokuta-
Warri 1.250 - 4.073 5.535 10.859
Construction of 187.15 km standard gauge from
Abuja to Kaduna 19.550 - 3.950 - 23.500
Construction of 6 stations between Itakpe - - - - -
Construction of modern coastal line from Benin to
Calabar across 6 Niger Delta states - - - 0.153 0.153
Construction of the standard gauge line from Itakpe to
Abuja - - - - -
Construction of standard gauge line from Minna to
Abuja - - - - -
Construction of standard gauge line from Kafanchan
to Abuja - - - - -
Roads and Bridges Priority Projects 2010 2011 2012 2013 Total
Dualisation of Onitsha – Owerri Road and Onitsha
Eastern by-pass 6.000 2.025 1.000 2.300 11.325
Dualisation of Ibadan – Ilorin road section 1 3.147 4.375 3.200 3.000 13.722
Dualisation of the Abuja – Abaji – Lokoja road 5.600 6.375 8.000 10.000 29.975
Dualisation of the Kano – Maiduguri road 42.000 16.500 10.200 12.500 81.200
Dualisation on the East – West road. Warri to Oron
via Port Harcourt - - - - -
Construction of Kano western by-pass 2.500 0.750 0.600 3.000 6.850
Construction of Panyam – Bokkos Wamba Road 1.000 0.1875 0.300 - 1.487
Key proposed projects and programmes for PPP 1.250 50.000 - 0.090 51.340
Lagos-Ibadan Express Way concession. Upgrading of
existing road by expansion to 8 lanes between Lagos
– Shagamu and 6 lanes between Shagamu – Ibadan
with construction of bridges. - 0.150 0.0917 0.0105 0.2523
Concession of 1.35 km Guto-Bagama bridge across
River Benue & Completion of 1.35 km with
adjourning roads as expected to reduce travel time
between Enugu and Abuja by 2 hours - 0.00375 0.02356 0.0138 0.0412
Construction of 2nd Niger Bridge across River Niger
at Onitsha / Asaba. Completion of 1.75 km bridge 14
km road with 3 No. Flyover bridges and 3 other 7.500 1.650 2.200 0.0443 11.39435
20Policy Discussion Paper 2013-01
AFRICAN HERITAGE INSTITUTION
Identified Projects in Transportation Sector Total Budgetary Provision 2010-2013 (Naira in Billion)
bridges.
Rehabilitation and expansion of Shagamu – Benin,
Benin-Asaba 5.972 2.523 2.487 1.500 12.482
Rehabilitation of Abuja-Kaduna, Kaduna, Kaduna –
Kano dual carriageways - 0.04116 0.015 - 0.05616
Rehabilitation of Lagos – Badagry (Seme Border) - 0.03726 0.517 - 0.55426
Waterways Priority Projects 2010 2011 2012 2013 Total
Rehabilitate and construct key river ports, jetties and
wharfs (Baro, Lokoja, Onitsha, Oguta, Degema and
Yenagoa) by 2013 9.450 4.402,5 4.680 2.090 20.622
Dredge and reclaim the rivers Niger and Benue 9.000 6.389 1.800 0.564 17.754
Concession routes to the private sector - - - - -
Airways Priority Projects 2010 2011 2012 2013 Total
To upgrade and maintain the four (Lagos, Kano,
Abuja and Port Harcourt) major international airports
to ICAO standards and recommended practices 2.130 4.282 13.299 3.094 22.805
To transfer all other airports to state governments 4.209 3.394 18.708 6.214 32.525
To concession the four international airports - - - -
Seaports Priority Projects 2010 2011 2012 2013 Total
Develop new deep seaports at Epe/Lekki, Brass,
Bonny and Badagry - - - - -
Dredge the harbours in Lagos and Bonny to
accommodate large ocean liners and provide standard
facilities, including RORO facilities in Bonny by
2011. - - - -
Develop Calabar Port to support free trade zone - - - - -
Source: Key Policy Documents and the FGN Approved Budgets various years (Federal Ministry of
Finance)
Analysis of the table 4 above shows that under the railways subsector priority projects, a total
of N26.3 billion, N28.4 billion and N998 million have been allocated to the rehabilitation of
the existing narrow gauge railway network from Lagos to Kano; the rehabilitation of the
existing narrow gauge railway network from PH to Maiduguri; and the rehabilitation of the
existing narrow gauge railway network from Zaria to Kaura-Namoda respectively while
nothing has been allocated to the completion of the of 22 km standard gauge from Ovu-Warri
which has been identified as one of the key priorities of the subsector. Similarly, construction
of 6 stations between Itakpe; construction of the standard gauge line from Itakpe to Abuja;
construction of standard gauge line from Minna to Abuja; and construction of standard gauge
line from Kafanchan to Abuja failed to attract any budget allocation for the entire period
(2010-2013). Construction of modern coastal line from Benin to Calabar across 6 Niger Delta
states attracted N153 million in the 2013 budget and this amount is for Feasibility
Studies/Consultancy services for Coastal Rail Line in Niger Delta Region (Benin-Sapele;
Warri-Yenagoa; PH-Aba-Uyo-Calabar).
Nigeria has a total road network of 193,200 kilometres, comprising 34,123 km federal roads,
30,500 km state roads, and 129,577 km local government roads. The Nigerian road network
is characterized by inadequate routine and emergency maintenance coupled with poor initial
construction and design. According to founding documents, the inadequate maintenance and
neglect of roads implies a loss of network value of N80 billion per year and an additional
operating costs of N35 billion per year.
21Policy Discussion Paper 2013-01
AFRICAN HERITAGE INSTITUTION
Under the roads and bridges construction and rehabilitation, it is interesting to note that the
dualisation of Onitsha – Owerri Road has attracted the sum of N11.235 billion budget
allocation and the project still have a sum of N2.3 billion in the 2013 budget when the project
seem to have actually been completed in 2012. Priority projects such as dualisation of Ibadan
– Ilorin road section 1; dualisation of the Abuja – Abaji – Lokoja road; dualisation of the
Kano – Maiduguri road and the construction of Kano western by-pass have consistently
attracted capital vote during the period (2010-2013) while the dualisation of Warri to Oron
via Port Harcourt is yet to attract a single capital vote.
A thorough observation around the country have shown that tangible work on most of the
identified priority projects under the roads and bridges including the 2nd Niger Bridge which
has attracted a total sum of N11.394 billion during the period 2010-2013 are yet to
commence. One is also curious with the sum of N51.340 billion allocated to the key proposed
projects and programmes for Public-Private Partnership (PPP) for the period 2010-2013 as
the item needs to be unbundled. It is noteworthy that the total capital budgets for all the line
items for the period 2010-2013 do not add up to the capital amount approved for the sector.
During the period under review (2010-2013), the total line items under roads and bridges
were never less than N200 billion. This implies that most of the line items were only included
for the sake of inclusion as they never counted in the approved budget.
In the waterways subsector, two out of the three priority projects (rehabilitate and construct
key river ports, jetties and wharfs in Baro, Lokoja, Onitsha, Oguta, Degema and Yenagoa by
2013 as well as the dredging and reclaiming of the rivers Niger and Benue). These projects
have attracted a total capital vote of N20.622 billion and N17.754 billion respectively in the
period 2010-2013 but no vote has been attached to the third item in the subsector which is
concession routes to the private sector for the period. This can be attributed to fact that
concession of a particular item can only be most attractive to the private sector when it is
fully completed and operational.
Three major priority projects in the airways subsector are to upgrade and maintain the four
(Lagos, Kano, Abuja and Port Harcourt) major international airports to ICAO standards and
recommended practices; to transfer all other airports to state governments; and to concession
the four international airports. The first two have attracted the total sum of N22.805 billion
and N32.525 billion respectively. The N32.525 billion is the total amount allocated to the
airports other than the four major international airports (Lagos, Kano, Abuja and Port
Harcourt) in the country.
Finally, a thorough analysis of table 9 also reveals that even the two sub-sectors of airways
and waterways that have exhausted their key policy investment recommendations still have
some of the key priorities unattended to in the period 2010-2013 while the seaport subsector
is yet to attract any fund for the period (2010-2013). The three key priorities of the seaport
subsector are the development of new deep seaports at Epe/Lekki, Brass, Bonny and
Badagry; dredging of the harbours in Lagos and Bonny to accommodate large ocean liners
and provide standard facilities, including Roro facilities in Bonny by 2011; as well as the
development of Calabar Port to support free trade zone. Such important priorities are yet to
receive attention in the FGN budget for the period 2010-2013.
Niger Delta
Vision 20: 2020 and the first NIP have attributed the lacklustre performance of the oil and gas
sector to a myriad of constraints, which include not just high level of foreign content and the
22You can also read