TURKEY ECONOMIC MONITOR - DECEMBER 2018 STEADYING THE SHIP
←
→
Page content transcription
If your browser does not render page correctly, please read the page content below

Public Disclosure Authorized    Public Disclosure Authorized   Public Disclosure Authorized       Public Disclosure Authorized

                                                                                               TURKEY

                                                                                               MONITOR
                                                                                               ECONOMIC

                                                                               DECEMBER 2018

                               THE SHIP
                               STEADYING
World Bank Group

TURKEY ECONOMIC MONITOR,
     DECEMBER 2018:
   STEADYING THE SHIP

                                          I
TEM, December 2018: Steadying the ship

© 2018 International Bank for Reconstruction and Development / The World Bank
1818 H Street NW
Washington DC 20433
Telephone: 202-473-1000
Internet: www.worldbank.org

Standard Disclaimer:
This volume is a product of the staff of the International Bank for Reconstruction and Development/ The World Bank.
The findings, interpretations, and conclusions expressed in this paper do not necessarily reflect the views of the Executive
Directors of The World Bank or the governments they represent. The World Bank does not guarantee the accuracy of the
data included in this work. The boundaries, colors, denominations, and other information shown on any map in this work do
not imply any judgment on the part of The World Bank concerning the legal status of any territory or the endorsement or
acceptance of such boundaries.
Copyright Statement:
The material in this publication is copyrighted. Copying and/or transmitting portions or all of this work without permission
may be a violation of applicable law. The International Bank for Reconstruction and Development/ The World Bank
encourages dissemination of its work and will normally grant permission to reproduce portions of the work promptly.
For permission to photocopy or reprint any part of this work, please send a request with complete information to the
Copyright Clearance Center, Inc., 222 Rosewood Drive, Danvers, MA 01923, USA, telephone 978-750-8400, fax 978-750-
4470, http://www.copyright.com/.
All other queries on rights and licenses, including subsidiary rights, should be addressed to the Office of the Publisher, The
World Bank, 1818 H Street NW, Washington, DC 20433, USA, fax 202-522-2422, e-mail pubrights@worldbank.org.

II

World Bank Group

                                                                                                                                               Contents

EXECUTIVE SUMMARY...............................................................................................................................................1
I. TAKING STOCK.........................................................................................................................................................3
    Uneven global growth and increased headwinds for Emerging Markets.........................................................................3
    Declining capital inflows and high external vulnerability in Turkey...............................................................................4
    Price pressures forcing supply side corrections in non-tradable sectors.........................................................................12
    Financial shock in 2018 has caused a rise in corporate stress.......................................................................................20
    Banks face volatility with strong buffers but cracks begin to appear.............................................................................26
    Complex economic situation with acute policy trade-offs............................................................................................32
II. LOOKING AHEAD.................................................................................................................................................35
    Downward correction to economic growth.................................................................................................................35
    Inflation and slower growth will substantially impact households................................................................................36
    A good foundation in the New Economic Program.....................................................................................................39
    Consistent and credible package of reforms to ensure orderly adjustment...................................................................41

Appendix: Corporate financial distress and the Altman Z-score.......................................................................................45
Annex 1: Medium-Term Outlook...................................................................................................................................46
Annex 2: Medium-Term Outlook...................................................................................................................................47
Annex 3: Gross Domestic Product...................................................................................................................................48
Annex 4: Gross Domestic Product...................................................................................................................................49
Annex 5: Prices................................................................................................................................................................50
Annex 6: Balance of Payments.........................................................................................................................................51
Annex 7: Monetary Policy...............................................................................................................................................52
Annex 8: Monetary Policy...............................................................................................................................................53
Annex 9: Fiscal Operations..............................................................................................................................................54
Annex 10: Banking Sector Balance Sheet.........................................................................................................................55
Annex 11: Banking Sector Ratios....................................................................................................................................56
Annex 12: Doing Business Index (2019).........................................................................................................................57
Annex 13: Logistics Performance Index (2016)...............................................................................................................62
Annex 14: Health Statistics (2016)..................................................................................................................................63
Annex 15: Education Statistics (2015).............................................................................................................................64
References.......................................................................................................................................................................65

List of Figures
Figure 1: Slowdown in portfolio flows to EMDEs.............................................................................................................4
Figure 2: Increased bond yields over the summer...............................................................................................................4
Figure 3: Sharp contraction in capital inflows....................................................................................................................5
Figure 4: Driven by outflow of portfolio debt....................................................................................................................5
Figure 5: Significant slowdown in capital flows but not a sudden stop...............................................................................5
Figure 6: High external vulnerability relative to other EMDEs..........................................................................................6
Figure 7: REER declining with free float...........................................................................................................................8
Figure 8: Rapid recovery in Lira........................................................................................................................................8
Figure 9: Equity markets contracted sharply......................................................................................................................8
Figure 10: Big drop in gross reserves..................................................................................................................................8
Figure 11: Increase in ST debt/reserves..............................................................................................................................8
Figure 12: Current account adjustment.............................................................................................................................8
Figure 13: Gross reserves decline due to RR policy............................................................................................................9

                                                                                                                                                                                      III
TEM, December 2018: Steadying the ship

Figure 14: Exchange rate volatility high in Turkey.............................................................................................................9
Figure 15: Reserves have started to recover........................................................................................................................9
Figure 16: Market perceptions of risk high in Turkey........................................................................................................9
Figure 17: Drivers of the current account balance in Turkey............................................................................................10
Figure 18: Jump in inflation after market volatility..........................................................................................................12
Figure 19: Broad-based increase in prices.........................................................................................................................12
Figure 20: Large divergence between PPI and CPI..........................................................................................................13
Figure 21: Due to declining consumer demand...............................................................................................................13
Figure 22: With contracting retail sales............................................................................................................................13
Figure 23: Precipitated by falling real wages.....................................................................................................................13
Figure 24: Composite output indicator already negative in run up to 2008-2009............................................................14
Figure 25: PMI is showing some signs of improvement in 2018......................................................................................14
Figure 26: Capacity utilization adjusting down from a period of overheating..................................................................14
Figure 27: Unemployment levels rising gradually, though from a higher base than 2008-2009........................................14
Figure 28: Real turnover contracting in non-tradable sectors...........................................................................................15
Figure 29: GVA and employment growth negative in non-tradable sectors......................................................................15
Figure 30: House price correction in Turkey....................................................................................................................16
Figure 31: House price changes linked to construction permit application......................................................................16
Figure 32: Demand falling below trend...........................................................................................................................17
Figure 33: House prices in line with income....................................................................................................................17
Figure 34: Change in house price-to-rent ratio................................................................................................................17
Figure 35: Low global rental yields..................................................................................................................................17
Figure 36: Housing is a big source of savings...................................................................................................................17
Figure 37: With high propensity for reinvestment...........................................................................................................17
Figure 38: Government incentives provide short-term boost to house sales......................................................................18
Figure 39: Divergence between construction costs and house prices................................................................................19
Figure 40: Developments in the construction sector have strong spillover effects.............................................................19
Figure 41: Increase in financial leverage of corporates......................................................................................................20
Figure 42: ICR drops below critical threshold.................................................................................................................20
Figure 43: Share of DAR above 2009 peak......................................................................................................................21
Figure 44: DAR associated with finance cost and REER..................................................................................................21
Figure 45: Financial distress peaks in 2018 Q3................................................................................................................22
Figure 46: Financial distress indicator below threshold....................................................................................................22
Figure 47: More corporates in distressed zone..................................................................................................................22
Figure 48: Daily index shows rise in corp. vulnerability...................................................................................................22
Figure 49: Sources of FX debt for Turkish corporates......................................................................................................23
Figure 50: Lower cost of FX debt....................................................................................................................................24
Figure 51: Large external debt service obligations............................................................................................................24
Figure 52: FX leverage vs. export ratios across sectors......................................................................................................25
Figure 53: FX leverage vs. export ratios within manufacturing.........................................................................................25
Figure 54: Banks dominate financial sector in Turkey......................................................................................................26
Figure 55: Sharp deceleration in credit growth................................................................................................................26
Figure 56: Banks’ external borrowing risen sharply..........................................................................................................27
Figure 57: Use of swaps to close short FX positions.........................................................................................................27
Figure 58: Widening liquidity gap...................................................................................................................................27
Figure 59: LT loans funded out of ST deposits................................................................................................................27
Figure 60: Declining FX deposits in Turkish banks..........................................................................................................28
Figure 61: Banks’ rollovers have fallen to 70 percent........................................................................................................28
Figure 62: Rising TRY Loan to Deposit ratio..................................................................................................................29
Figure 63: Liquidity cov. ratio within prudential norm....................................................................................................29
Figure 64: Breakdown of NPLs by borrower types...........................................................................................................30
Figure 65: Rising sale of NPLs.........................................................................................................................................30
Figure 66: Banks’ exposure to construction Co’s..............................................................................................................30
Figure 67: Construction NPLs declining slightly.............................................................................................................30
Figure 68: Consumer loans/GDP relatively low...............................................................................................................31
IV
World Bank Group

Figure 69: Small mortgage market...................................................................................................................................31
Figure 70: Limited NPLs in mortgage market.................................................................................................................31
Figure 71: Mortgages relatively short-term tenor.............................................................................................................31
Figure 72: Two episodes of monetary tightening..............................................................................................................32
Figure 73: Declining FX deposits....................................................................................................................................32
Figure 74: Liquidity boost to financial sector...................................................................................................................33
Figure 75: Aug-Sept spike in M3 expansion....................................................................................................................33
Figure 76: Moderate increase in budget deficit................................................................................................................34
Figure 77: Driven by capex and revenue slowdown..........................................................................................................34
Figure 78: Slowdown in tax collections............................................................................................................................34
Figure 79: Sharp rise in lending and capex.......................................................................................................................34
Figure 80: Sharp slowdown in 2019................................................................................................................................36
Figure 81: Consensus forecast is negative for 2019..........................................................................................................36
Figure 82: Household debt low and falling......................................................................................................................38
Figure 83: Household deposits rising faster than loans.....................................................................................................38
Figure 84: Unemployment projected to rise.....................................................................................................................38
Figure 85: Most employment growth in services..............................................................................................................38
Figure 86: Growth-led poverty reduction is expected to slow in the baseline....................................................................39
Figure 87: NEP projects negative output gap over medium-term....................................................................................40
Figure 88: NEP assumes adjustment in public consumption and investment..................................................................40
Figure 89: Projected recovery in tax revenue is ambitious................................................................................................40
Figure 90: Turkey lags most on labor markets, innovation, financial sector, human capital..............................................43
Figure 91: Gaps between Turkey and EU average greatest for human capital and labor market........................................43

List of Tables
Table 1: Breakdown of distressed assets............................................................................................................................27
Table 2: Expenditure shares by decile of per capita expenditure distribution....................................................................35
Table 3: Simulated poverty impacts of inflation...............................................................................................................35
Table 4: NEP fiscal consolidation....................................................................................................................................39

List of Boxes
Box 1: Drivers of the current account balance in Turkey..................................................................................................10
Box 2 Real estate sector developments.............................................................................................................................15
Box 3: Corporate debt in Turkey.....................................................................................................................................21
Box 4: Financial sector vulnerabilities from the construction sector.................................................................................28

                                                                                                                                                                          V
TEM, December 2018: Steadying the ship

     The Turkey Economic Monitor (TEM) periodically analyzes economic developments, policies and prospects
     in Turkey. The TEM was prepared under the guidance of Johannes Zutt (WB Country Director, Turkey),
     John Panzer (Acting Senior Director, Macroeconomics Trade and Investment) and Lalita M. Moorty
     (Practice Manager, MTI GP) by Habib Rab (Program Leader, EFI Turkey), David Knight (Senior Country
     Economist, MTI GP), Pinar Yasar (Country Economist, MTI GP), Erdem Atas (Research Analyst, MTI
     GP), and Alper Ahmet Oguz (Senior Financial Sector Specialist, Finance, Competitiveness and Innovation
     GP).

     The team is very grateful to the following colleagues (in alphabetical order): (i) Alexander Pankov (Lead
     Financial Sector Specialist, FCI GP), Karlis Bauze (Senior Financial Sector Specialist, FCI GP), and Mario
     Guadamillas (Practice Manager, FCI GP) for their inputs and guidance on the financial sector; (ii) Aysenur
     Acar (WB Consultant), Efsan Ozen (WB Consultant), Facundo Cuevas (Senior Economist, Poverty GP),
     Metin Nebiler (Research Analyst, POV GP), Sirma Demir Seker (Economist, Social Protection and Jobs
     GP) and Ximena Del Carpio (Program Leader, Social Inclusion) for their inputs and guidance on poverty
     and the labor market; and (iii) the WBG Global Economic Prospects team for discussions on economic
     prospects.

     The team is very grateful to: Ivailo Izvorski (Lead Economist, MTI GP) and William G. Battaile (Lead
     Economist, MTI GP) for peer review comments and advice; colleagues from the IMF Turkey team for their
     comments; Pinar Baydar (Senior Program Assistant, WB) and Selma Karaman (Program Assistant, WB) for
     administrative support; and Tunya Celasin (Senior Communications Officer) on external communication.

     The team is very grateful to colleagues from the Central Bank of the Republic of Turkey, the Ministry of
     Treasury and Finance, and the Presidency of Strategy and Budget for very helpful discussions on economic
     developments and policy priorities. The team greatly appreciates insights provided by business associations
     and the private sector during the preparation of the TEM.

     The TEM is a product of the staff of the World Bank Group. The findings, interpretations, and conclusions
     expressed in this report do not necessarily reflect the views of the Executive Directors of the World Bank (or
     the governments they represent), or the Government of the Republic of Turkey.

VI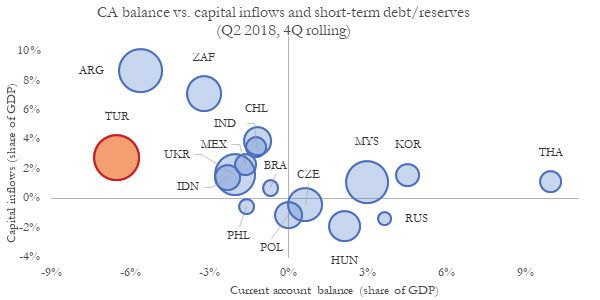
World Bank Group

EXECUTIVE SUMMARY
TAKING STOCK
Mid-2018 was a period of intense market volatility             Supply side corrections combined with elevated
and rising economic stress in Turkey that was                  corporate debt, including FX exposure, have raised
precipitated by existing macroeconomic imbalances              corporate solvency and liquidity concerns in Turkey.
and elevated political tensions with the US.                   An analysis of the balance sheets of listed corporates in
A confluence of burgeoning domestic economic                   Turkey points to a rapid increase in financial leverage
imbalances and a more challenging external environment         in 2018 Q2-Q3, even relative to other EMDEs. In
led to a dent in investor confidence in Turkish assets and     addition, starting 2018 Q3, corporates have come under
a sharp slowdown in capital flows to Turkey in 2018            increased liquidity pressures, including stress on debt
Q2-Q3. Though this did not technically amount to a             servicing capacity. A combination of the above has led to a
sudden stop, Turkey was particularly badly affected by         general increase in corporate vulnerabilities as measured
a general move away from emerging markets (EMDE)               by the share of debt-at-risk. Energy, telecommunication
due to its accumulated macro imbalances (high current          and real estate investment trust corporates are under
                                                               most pressure. A composite measure of financial distress
account deficit, high inflation, overheating economy)
                                                               further indicates a deterioration in the overall financial
and perceived policy weaknesses.
                                                               conditions of listed non-financial corporates in 2018.
Market volatility in Turkey has subsided since the
                                                               Though the financial sector entered the recent
turbulence in August, but the economic situation
                                                               period of turbulence with adequate buffers, cracks
remains fragile. Turkey’s large external exposure leaves
                                                               are beginning to appear because of real sector
it vulnerable to further market jitters and external
                                                               developments and tighter international finance.
monetary tightening. The external shock in the summer
                                                               Structural imbalances including maturity and currency
of 2018 also translated into significant real sector
                                                               mismatches persist and expose Turkish banks to external
impacts, including a sharp acceleration in inflation
                                                               market volatility risks. Exchange rate and interest rate
from already elevated levels. The gap between consumer         developments have further dented banks’ balance sheets
and producer price inflation widened significantly             through recalculation of risk-weighted assets, mark to
since July, reflecting suppliers’ inability to pass on price   market security portfolios and on-balance sheet open
increases to consumers due to declining demand. High           positions. Banks to date have been able to weather
production costs together with slowing demand have             liquidity pressures thanks in part to Central Bank
prompted supply side adjustments.                              liquidity injection and continued access to external
Supply side indicators suggest that the correction in          loans. The growing challenge, however, is with the
2018 Q2-Q3 is more gradual compared to the run up              deterioration in asset quality, which goes beyond the
to the last major recession in Turkey (2008-2009),             reported Non-Performing Loans; NPLs are around 3.7
when output fell much more sharply. This does not              percent of outstanding loans whereas distressed assets
preclude a more serious supply correction in 2018-             are closer to 13 percent.
2019, particularly as corporates exhibit increased stress      Fiscal policy has been mildly expansionary with
from falling demand and credit, though an important            automatic stabilizers helping to cushion some of
difference with the 2008-2009 crisis is the role of            the economic slowdown. Early indications are that
external demand. In 2008-2009, both domestic and               social insurance outlays will increase in late 2018 as
external demand had collapsed. In 2018, employment             more people have become eligible for unemployment
and turnover numbers point to a rebalancing towards            insurance, whilst the seasonally adjusted unemployment
tradable sectors as exchange rate depreciation has             rate has risen to 11.2 percent in the third quarter from
boosted external competitiveness. Non-tradable sectors,        10.7 percent in 2018Q2. Central government debt
particularly construction and energy, on the other hand        outstanding as a ratio to GDP jumped up by nearly
are highly vulnerable.                                         three percentage points in the third quarter of 2018,

                                                                                                                        1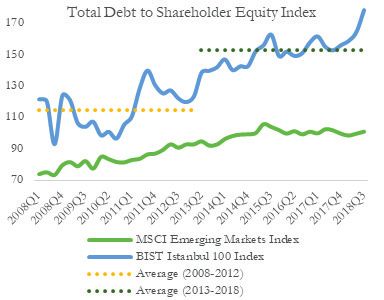
TEM, December 2018: Steadying the ship

driven by the revaluation effects of FX-denominated             forecasts. Growth-led poverty reduction is expected to
debt. At 31.4 percent or US$56bn equivalent, central            slow in the baseline, and there is a risk of higher poverty
government debt remains manageable though the                   should downside risks materialize.
realization of contingent liabilities, the full extent of
which is difficult to estimate, could dent this fiscal space.   The authorities’ New Economic Program released in
                                                                September provides a good foundation for gradually
LOOKING AHEAD                                                   restoring macro stability. The NEP’s headline growth
                                                                projections are at the upper end of the range of forecasts,
The economic outlook is subject to higher levels                though also the most conservative ever presented in an
of uncertainty than usual given high domestic and               NEP/Medium-Term Program. That said, the demand
external vulnerabilities. Growth is projected to slow           side drivers of medium-term projections in the NEP
to a 10-year low of 1.6 percent in 2019 followed by             assume that much of the downward correction to
a medium-term recovery. Private domestic demand                 growth arises from the public sector, whereas given
is projected to drop sharply in 2019, offset in part            the outlook for the economy, countercyclical fiscal
by public consumption and external demand. Most                 policy is expected to play a big role. This is particularly
analysts project a sharper correction for 2019 with a           important as a big challenge for policy makers in 2019
consensus mean of -0.1 percent (Consensus Economics             is the prospect of stagflation – a combination of high
Inc., November 2018). Investment is projected to                unemployment and high inflation.
contract, though a significantly higher budget deficit
is expected. Monetary tightening and commitments in             Building on the NEP, a consistent package
the New Economic Program (NEP) signal important                 of economic policies could ensure an orderly
policy adjustment, though any uncertainty or inaction           adjustment for the Turkish economy. Monetary
could tip the economy into a more difficult situation.          policy should remain tight while inflation is well-
The lack of progress on an orderly deleveraging in the          above the target and inflation expectations are elevated.
private sector could precipitate this tipping point.            Continuation of an appropriate monetary policy
                                                                should be complemented by a financial sector response
The projected economic slowdown poses multiple                  that supports gradual deleveraging and enhances
challenges for households. Food inflation, at close to          financial risk monitoring and management. Critical
30 percent compared to a year ago, has a far greater            to supporting the deleveraging process is a strong
negative incidence for the poor than the non-poor. The          corporate debt restructuring framework, the absence
poverty rate is very sensitive to such price increases,         of which could spell the difference between an orderly
although the net effect may be offset by nominal                adjustment for the economy and a hard landing. An
wage or income growth. Neither household debt nor               upwards fiscal adjustment led by automatic stabilizers
net financial equity are expected to be significant             and essential support for households will be necessary
stress factors for most households. Minimum wage                to help the economy tide over the period ahead, while
adjustment in early 2019 and government employment              also laying the ground for a gradual fiscal consolidation
support programs may help to stem the decline in real           as a recovery becomes entrenched to maintain a strong
wages but overall the outlook suggests that both wages          fiscal anchor across the cycle. Clear communication of
and employment will be depressed, and unemployment              such a package of economic and fiscal policies is central
is expected to rise over the next three years based on          to avoiding a short-term challenge becoming a longer-
estimated employment elasticities and sectoral growth           term problem.

2
World Bank Group

I. TAKING STOCK
    Over the past six months Emerging Markets and Developing Economies (EMDEs) have faced headwinds from declining
    capital flows, slowing global trade, and commodity price volatility. In Turkey, these factors combined with macro imbalances,
    perceived policy weaknesses, and international tensions to trigger a Lira sell-off and capital outflows. Market volatility has
    subsided since August; the Lira has rebounded and external imbalances have narrowed. But Turkey’s external financial
    situation remains fragile and market perceptions of risks are high. Market volatility has also affected the real sector through
    high inflation, falling demand, and a big supply side correction. Supply side adjustments combined with elevated corporate debt,
    including FX exposure, has raised corporate solvency and liquidity concerns. Impacts vary across sectors; non-tradable sectors
    are the worst affected whilst outward oriented manufacturing sectors remain buoyant. Rising corporate stress has exacerbated
    banking sector vulnerabilities. Timely policy actions including liquidity management, a tightening of monetary policy, and
    addressing corporate debt vulnerabilities have helped prevent a sharper correction.

Uneven global growth and increased                                             2). These developments were linked to US monetary
                                                                               tightening (June saw the 7th increase in policy rates since
headwinds for Emerging Markets1                                                December 2015) and higher Treasury yields from the
1. Global growth in the first three quarters of 2018                           fiscal stimulus in the US, a combination of which led to
has remained strong though more uneven across                                  a general appreciation of the US dollar. Nevertheless,
regions compared to 2017. The US economy has been                              other investment flows to EMDEs have held up and
expanding rapidly thanks to procyclical fiscal policy;                         portfolio flow reversals did not amount to a sudden
adding an average of 200,000 jobs per month, which                             stop.
contributed to unemployment falling to 3.7 percent in
                                                                               3. Rising trade policy uncertainty and a slowdown
September, its lowest level since 1969. Growth in the
                                                                               in global trade further contributed to rising risk
Euro area on the other hand moderated in 2018 Q3,
                                                                               premia in EMDEs and a sell-off in EMDE equity
coming in at 0.2 percent (q/q, sa), its slowest pace since
                                                                               markets over the summer. International trade
2014 Q2. The Japanese economy contracted in two
                                                                               tensions have been mounting with the United States
out of three quarters in 2018, whilst China and many
                                                                               imposing tariffs on around $300 billion of its imports,
other Emerging Market and Developing Economies
                                                                               and other countries retaliating with tariffs on similar
(EMDEs) are exhibiting signs of slowdown. 1
                                                                               levels of US exports. There was some reduction in
2. EMDEs experienced financial pressure in                                     uncertainty with the announcement of a new trade
2018 Q2-Q3 though, apart from a few countries                                  agreement with Mexico and Canada on October 1st
including Turkey, not as severe as other recent                                and a temporary agreement between the US and China
episodes of global financial tightening. Portfolio                             to deescalate the ongoing trade war on December 2nd.
flows to EMDEs in the first 8 months of 2018                                   Nevertheless, global goods trade stagnated for the first
dropped by 40 percent compared to the same period                              time in two years in 2018 Q2, reflecting weakening trade
in 2017, turning negative in Q2 (Figure 1) and Q3.                             in and out of Asia and decelerating imports from some
From June to August, EMDE issuances of sovereign                               major advanced economies. Moreover, by September
and corporate debt were down 65 percent from the                               global new export orders has declined for 8 consecutive
same period in 2017. Bond yields in EMDEs increased                            months, falling just below the threshold that indicates
over the summer, reflecting higher risk premia (Figure                         contraction.

1   This section draws on WBG, “Global Economic Monitor,” May-November 2018.

                                                                                                                                        3
TEM, December 2018: Steadying the ship
Figure 1: Slowdown in portfolio flows to EMDEs Figure 2: Increased bond yields over the summer
Sources: International Finance Statistics, WB Staff estimates Source: Haver Analytics
Note: Emerging Market countries according to MSCI classification;
OI: Other Investment
4. Volatility in commodity markets has further Declining capital inflows and high
exacerbated economic uncertainties around
EMDEs. Crude oil prices reached a 4-year high in
external vulnerability in Turkey
October, hitting $86 per barrel amid reports that Iranian 5. A difficult external environment together with
oil exports had fallen ahead of the reintroduction of domestic economic challenges combined into a
US sanctions and rising international tensions with sharp slowdown in portfolio and other investment
Saudi Arabia. Since then, however, oil prices have flows to Turkey in 2018 Q2-Q3. In the first three
been declining rapidly, averaging $70 per barrel in quarters of 2018, portfolio and other investment flows
November compared to $80 in October with reports averaged a third of inflows over the same period in the
of increased production in Russia and Saudi Arabia. previous 5 years, turning negative in Q3 for the first
Metal prices on the other hand have been on a steady time since 2016 Q3 (Figure 3). A very small part of this
decline throughout 2018, reflecting concerns over trade contraction was driven by a sell-off in portfolio equity,
tensions and growth prospects in China. Economic in line with a rebalancing away from emerging markets
activity across several commodity-exporting EMDEs more generally. Most of the contraction in capital
has stalled, with more severe stress among metal flows however was due to an outflow of portfolio debt
exporters. Turkey, whose energy imports amount to the (Figure 4), linked to repayment of securitized debt,
equivalent of 6 percent of GDP, stands to benefit from particularly as some banks and corporates chose not to
the recent fall in oil prices and is particularly sensitive refinance due to escalating interest rate and currency
to oil price volatility. pressures. FDI inflows remained stable whilst net
errors and omissions increased sharply, amounting to
nearly twice the level of portfolio and other investment
flows in 2018 Q1-Q3.
4World Bank Group
Figure 3: Contraction in capital inflows Figure 4: Driven by outflow of portfolio debt
Sources: International Finance Statistics, WB Staff estimates Sources: International Finance Statistics, WB Staff estimates
Note: Excludes FDI, Net Errors and Omissions Note: Excludes currency and deposits
6. Whilst the slowdown in capital flows to Turkey was significant, it did not technically amount to a
sudden stop.2 Turkey experienced two sudden stop episodes in the past 20 years, namely during the 2000-2001
and 2008-2009 crises (Figure 5).3 The decline in capital inflows in 2018 was milder than those earlier episodes and
the capital flow shocks in 2014 and 2016. Moreover, non-residents’ portfolio flows in October and November
turned positive,4 and large Turkish banks’ rollover of more than $5 billion in external debt, albeit at higher costs,
Figure 5: Significant slowdown in capital flows but not a sudden stop
Sources: IFS, WB Staff estimates
2 The sudden stop analysis in this section is based on the framework in Eichengreen, B, and Gupta P. “Managing Sudden Stops,” WBG Policy Research Working Paper (April
2016).
3 Eichengreen and Gupta classify an episode as a sudden stop when: (i) non-resident portfolio and other investment inflows decline below the average in the previous 20 quarters
by at least one standard deviation; (ii) when the decline lasts for more than one quarter; (iii) and when flows are two standard deviations below their prior average in at least
one quarter. Episodes end when capital flows recover to the prior mean minus one standard deviation.
4 See CBRT: Securities Portfolio of Non-Residents (Market Value, Stock, Flow, Million USD).
5TEM, December 2018: Steadying the ship
Figure 6: High external vulnerability relative to other EMDEs
Sources: International Finance Statistics, WB Quarterly External Debt Statistics, Haver Analytics, WB Staff estimates
between September and November, signals recovery in 8. The situation came to a head in August
other investments. when rising international tensions combined with
Turkey’s macro imbalances and perceived policy
7. Nevertheless, the slowdown in capital flows weaknesses to trigger a Lira sell-off and capital
happened when Turkey was already facing high outflows. The severity of the shock and the potential
external vulnerability, indicating weaker defenses adjustment path are benchmarked below (Figure 7 to
against the effects of market volatility. As discussed Figure 12) against a range of financial effects (i.e. on
in the previous TEM,5 Turkey’s external buffers against exchange rate, reserves, capital markets, short-term
tightening financial conditions had declined relative debt) from 28 sudden stop episodes in emerging
to 2007 (before the onset of the Global Financial markets between 1990 and 2016.6 A few points are
Crisis) and 2012 (before the Taper Tantrum following worth noting:
announcement of US monetary policy normalization).
Turkey’s external vulnerability was also high compared (i) The recovery of the Lira since August has been
to other emerging markets, as reflected by its relatively sharper and more rapid relative to the sample of
large current account deficit; considerable dependence sudden stops (Figure 7, Figure 8).7 Most currencies in
on volatile, debt-creating flows; and elevated short- the sample had some form of exchange rate peg, unlike
term debt to reserve ratio (Figure 6). the Lira which is a free float, making their drop more
akin to traditional currency crises including adjustment
of exchange rate to a much lower equilibrium.
5 WBG, “Turkey Economic Monitor: Minding the External Gap,” May 2018.
6 Countries in the sample include Argentina, Brazil, Chile, Czech Republic, Hungary, India, Indonesia, Korea, Malaysia, Mexico, Philippines, Poland, Russia, South Africa,
Thailand, Turkey and Ukraine. Quarterly capital flow data includes non-resident portfolio and other investment flows accessed from the IMF’s International Financial Statistics.
Data period is 1990-2018. Sudden stop classification is based on Eichengreen and Gupta (2016).
7 The precipitous drop in August likely reflects overshooting linked to a rapid deterioration in international relations.
6World Bank Group
The degree of downward adjustment in the falling domestic consumption and investment have
currency directly affects pressures on the real and contributed to a sharp deceleration in import demand,
financial sectors, which are discussed in the next whilst exports have accelerated. These developments
sections. In Turkey, prolonged currency weakness after helped shift the current account deficit to surplus in
the August shock would have been even more troubling August, September and October 2018, reducing to
for the economy given the high exposure of corporates some extent pressures on external financing needs.
to forex debt, dependence on imports of energy and
A detailed analysis of the drivers of current
intermediate inputs, and exchange rate pass through to
account balances (Box 1) finds that credit to the
inflation.
private sector has contributed most in recent years to
(ii) The impact of the 2018 Q3 capital flow shocks on Turkey’s current account deficit. The sharp drop in
the Turkish stock market valuation seems in line with credit growth therefore should help to contain current
the impact during sudden stop episodes (Figure 9). account imbalances going forward.
However, equity markets in Turkey are generally quite
9. Market volatility in Turkey has subsided since
shallow, and portfolio equity (hot money) is less than
the turbulence in August. The Lira has recovered
a quarter of external financial inflows. Therefore, the
and stabilized for now (Figure 14), averaging TRY 5.4/
real sector impacts of this are likely to be more limited.
USD in November, after bottoming out in August
(iii) The impact on reserves and short-term debt to at TRY 7.2/USD. Though reserves remain slightly
reserves has been more severe and closer to the upper below prudential threholds (5.6 months of imports in
bound of sudden stop episodes (Figure 10, Figure 11). November), they are starting to pick up; the Central
Gross international reserves declined by just over 20 Bank’s net international reserves have risen from a
percent between 2018 Q1 and Q4. Given Turkey’s large 2018 low of $25 billion in October to $28 billion in
external financing requirements on the one hand (see November, whereas gross reserves have increased from
below) and tightening capital flows on the other, the big $86 billion to $91 billion over the same period (Figure
drop in reserves prompted concerns from some about 15).
external financing gaps and a balance of payments 10. Nevertheless, Turkey’s external financial
crisis. situation remains fragile whilst market perceptions
But a big part of the decline in reserves was of risks are high. CDS spreads have declined from 560
driven by the Central Bank’s decision to lower forex bp in August to 370 bp in November (only Argentina
reserve requirements of banks, including under the is higher among emerging/frontier markets) (Figure
Reserve Options Mechanism (ROM) (Figure 13); this 16). Short-term treasury bond yields have come down
was introduced to provide greater forex liquidity to from a high of 27 percent in August though remain
banks at a time of tightening external finance and forex elevated at 20 percent in November. At the same time,
liabilities coming due. The increase in short-term debt Turkey has close to $40 billion in external debt service
to reserves is linked to the decline in gross reserves due between December and June 2019. Though it has
rather than an increase in short-term debt. successfully covered a spike in refinancing requirements
in October and reduced its current account financing
(iv) Current account imbalances have started to need, its ability to raise external finances will depend on
shrink, in line with the adjustment in past sudden stop global monetary conditions and soundness of domestic
episodes (Figure 12). Exchange rate depreciation and policies.
7TEM, December 2018: Steadying the ship
Figure 7: REER declining with free float Figure 8: Rapid recovery in Lira
Figure 9: Equity markets contracted sharply Figure 10: Big drop in gross reserves
Figure 11: Increase in ST debt/reserves Figure 12: Current account adjustment
Sources: International Financial Statistics, WB Quarterly External Debt Statistics, Haver Analytics, WB Staff estimates
Notes: t = quarter in which sudden stop started (for Turkey it is 2018 Q3 when capital flows turned negative).
8World Bank Group
Figure 13: Gross reserves decline due to RR policy Figure 14: Exchange rate volatility high in Turkey
Sources: CBRT, WB Staff estimates Sources: Haver Analytics, WB Staff estimates
Notes: Annualized volatility estimate. EDMEs in range include Argentina, Brazil,
Russia, RSA, Malaysia, Indonesia, India, Mexico
Figure 15: Reserves have started to recover Figure 16: Market perceptions of risk high in Turkey
Sources: CBRT, WB Staff estimates Source: Bloomberg Terminal
9TEM, December 2018: Steadying the ship
Box 1: Drivers of the current account balance in Turkey
Turkey over the past 20 years has experienced large and persistent current account deficits relative to its peers.
Ongoing World Bank research looks to econometrically assess the drivers of current account imbalances in
Turkey. The results aim to inform policy discussions on external sustainability, an issue that has come into
focus with recent external shocks.
Drivers of current account imbalances in Turkey
Large and persistent CAD: Increased domestic investment and consumption in Turkey post 2000s
contributed to a widening current account deficit (CAD). This was further accelerated by FDI-related imports
(Figure 17). Ongoing analysis finds that Turkey’s CAB has a low level of persistence by comparison with
other countries, which suggests that the CAB in Turkey adjusts more quickly in response to shocks.
Figure 17: Drivers of the current account balance in Turkey
Sources: International Finance Statistics, Haver Analytics, WB Staff estimates
Credit expansion and CAD: The biggest single driver of Turkey’s CAD post 2001 was a rapid expansion of
credit to households. Private credit accelerated further between 2007 and 2012 with global monetary easing
though this time led by corporates. Between 2013 and 2017, compensating factors came into play to lower the
CAD, most notably the pull-back in credit to households. But the deficit persisted due to continued expansion
of credit to corporates, while a deterioration in openness relative to other countries also contributed more
substantively to the CAD in this period.
Large negative Net Foreign Assets (NFA) perpetuated CAD: The hangover from successive CADs
began to be felt in earnest as the servicing costs of foreign liabilities exerted a larger negative pull on the
current account. NFA reached 50 percent of GDP at the end of 2017, a threshold level which has been found
to be associated with a higher risk of external crisis.8
8 Catao, L. and G.M. Milesi-Ferretti (2014), “External Liabilities and Crises”, Journal of International Economics, Volume 94, Issue 1.
10World Bank Group
Policy implications
Link between growth and CAD: Strong macro fundamentals in the early 2000s resulted in domestic
investment expanding more rapidly than domestic savings. The resulting gap was financed by foreign sources,
which led to a negative NFA position. A high CAD and growing exposure to volatile capital flows implies that
Turkey would need to move to a growth model that breaks the link between growth and the CAD through
higher domestic savings.
Depth of financial markets and credit booms: Credit to corporates more than doubled over the past
10 years, growing from a relatively low base. Turkey has a strong suite of macro-prudential regulations to
maintain financial stability and rapid credit growth does not necessarily imply risks to sustainability. But
capital inflows and private credit have been highly procyclical in recent years, including an elevated credit-to-
GDP gap. These trends can exacerbate external risks.
Openness and CAD: CAD expansion is linked to some decline in openness relative to other countries.
Agricultural trade is subject to restrictive tariff quotas and price regulation, though import barriers on grains,
cereals, pulses and meat have been reduced in the past two years. Protectionist and localization hurdles have
also arisen in sectors such as pharmaceuticals, medical devices, apparel and e-commerce. But openness varies
across sectors, with some sectors more open than in other countries. This will be discussed further in the
upcoming paper on drivers of CA imbalances.
Foreign Direct Investment: While FDI inflows had a negative effect in the past, FDI is generally associated
with increased productivity in the domestic economy, increased diversification and sophistication of the
production and export bundles, thus reducing vulnerabilities associated with current account deficits, as well
as benefiting the economy beyond its impact on the current account balance.
11TEM, December 2018: Steadying the ship
Price pressures forcing supply side in part by the effects of exchange rate depreciation on
imported intermediates. Private consumption in Q3
corrections in non-tradable sectors
moderated (1.1 percent yoy growth) whilst investment
11. The financial effects of market volatility contracted (-3.8 percent yoy growth). Retail sales, which
in Turkey translated into significant real sector map closely to private consumption developments,
impacts, including a sharp acceleration in inflation contracted in 2018 Q3 for the first time since 2016
from already elevated levels. Year-on-year consumer Q3, whilst consumer confidence was its lowest level
prices increased by 25 percent in September (Figure 18), since end 2008. Rising inflation has contributed to a
following a 6 percent jump that month, levels not seen broad-based decline in real wages in 2018 Q3, further
since the 2001 crisis in Turkey. Despite the big jump in depressing demand (Figure 21, Figure 21, Figure 23).9
food and energy prices, there is little divergence between
headline and core inflation, pointing to a broad-based 13. Declining demand, among other factors,
increase in prices across all major components of the contributed to the first monthly deflation in
CPI basket. This is further illustrated by the distribution November since June 2017. Consumer prices in
of price increases across the CPI basket (Figure 19); November fell by 1.5 percent, whilst year-on-year
whilst in January 2017, prices across 70 percent of the inflation fell by 3.62 percentage points in November to
CPI basket rose in the 0-10 percent range, in September 21.6 percent – the first time it has fallen since March and a
2018, 70 percent of the basket rose in the 20-40 percent better-than-expected outturn. The biggest contribution
range.8 to declining CPI stemmed from the durable goods,
falling by 15 percentage points in one month thanks to
12. The gap between consumer and producer recent tax cuts on vehicles, furniture and white goods.
price inflation widened significantly since July, The domestic PPI also fell in November, from 45 to
reflecting suppliers’ inability to pass on price 38.5 percent last month. Aside from declining demand
increases to consumers due to declining demand and tax cuts, a partial rebound in the Lira and softer oil
and more direct exposure of producer prices
prices helped reduce inflation.
to exchange rate shocks. Producer price inflation
peaked at 46 percent in September (Figure 20), driven
Figure 18: Jump in inflation after market volatility Figure 19: Broad-based increase in prices
Sources: Haver Analytics, WB Staff estimates Sources: Haver Analytics, WB Staff estimates
8
9 All sectors have seen declining real wages in Q3, but construction stands out the worst hit. Construction sector real wages (SWDA, q-o-q) contracted by 7.8 percent in Q3
while manufacturing and retail trade sectors recorded 4.6 percent and 5.0 percent contractions, respectively.
12You can also read