BULLETIN MONTHLY ECONOMIC - May 2019

Page created by Steve Lynch
 
CONTINUE READING
BULLETIN MONTHLY ECONOMIC - May 2019
MONTHLY ECONOMIC
BULLETIN      May 2019

        Krungsri Research
BULLETIN MONTHLY ECONOMIC - May 2019
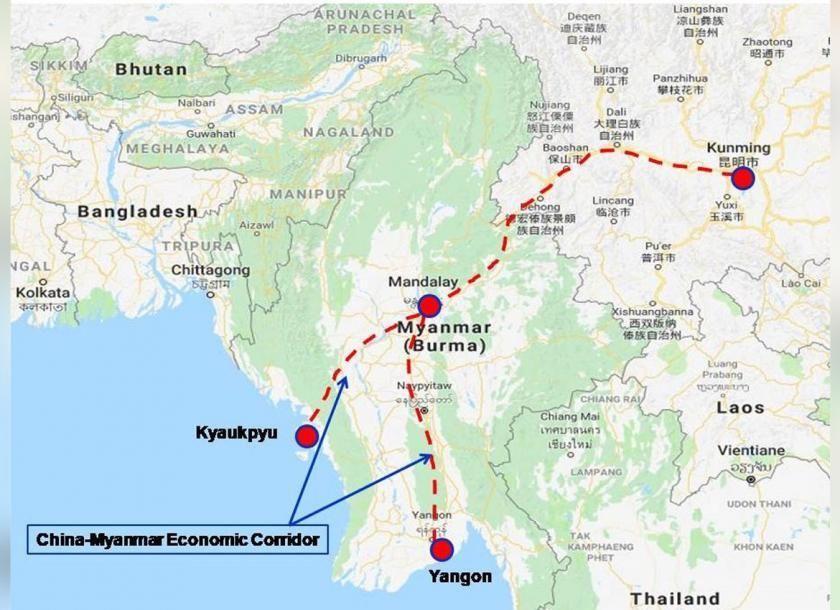
Global: Darkening sentiment

                                                                            China
                                                                              GDP data was steady in 1Q19 but growth composition
                                                                               was less impressive and momentum is slowing.
                                                                              Business activity and credit growth slowed in April,
                                                                               underlining need for further monetary policy easing.
                                                                              PBOC continues to provide more liquidity to banks to
                                                                               lend to the economy while controlling lending rates.

                                            Europe
                                              Precarious recovery as activity surveys
US
                                               and labour market conditions cross paths.   Japan
    Growth composition was weak in
                                              Potential US auto tariffs – major             Trump urged Abe to end tariffs on US
     1Q19, but surge in productivity
                                               headwinds for EU auto industry but             farm goods, but this is unlikely to
     growth lifts long-term upside
                                               limited impact on GDP as a whole.              happen ahead of Upper House Election.
     potential.
                                              Spain election: Results point to a Hung       Overall minimal impact from US hiking
    Fed shows no bias towards rate hikes
                                               Parliament but this did not stop the           tariff on vehicles, but sizable impact on
     or cuts, upbeats on growth as
                                               economy from outperforming Eurozone.           activities in auto sector.
     downside risks moderate, downplays
                                                                                             BOJ strengthens clarification on
     muted inflation.
                                                                                              forward guidance, shifting to ‘date-
                                                                                              contingent’ from ‘data-dependent’
                                                                                              approach.

                                                                                                                     Krungsri Research   2
BULLETIN MONTHLY ECONOMIC - May 2019
IMF cuts global growth forecast for the fourth time, even
before trade tensions worsen

              6.6 (6.6)                                              6.3 (6.2)
                                                                                    6.1 (6.2)

                                                                     4.4 (4.5)      4.8 (4.9)         EMs
              4.5 (4.6)

              3.6 (3.7)                                              3.3 (3.5)      3.6 (3.6)

              2.9 (2.9)                                              2.3 (2.5)

                                                                                    1.9 (1.8)
              1.8 (1.8)
                                                                     1.3 (1.6)
                                                                                    1.5 (1.7)
              0.8 (0.9)
                                                                     1.0 (1.1)      0.5 (0.5)

                          2018E                                      2019F       2020F
Note: ( ) previous forecast  Unit: %
Source: IMF World Economic Outlook (April 2019), Krungsri Research

                                                                                                Krungsri Research   3
BULLETIN MONTHLY ECONOMIC - May 2019
Trade tensions re-escalate
The US recently announced it would raise tariffs on USD200bn in Chinese goods from 10% to 25% effective 10 May, and has threatened to impose
25% tariffs on additional USD300bn in Chinese goods. There will be a public hearing on the latter on 17 June. In response, China is hiking tariffs on
USD60bn in US goods from 5-10% to 5-25% effective 1 June. China said it will retaliate if the US imposes the fourth round of tariff hikes.

                                Round 1                                     Round 2                                  Round 3            Round 4
                          Affected                                               Affected                              Latest                       Potential
                                                                                                                     25% tariffs
      • $34bn effective                 • $16bn effective                5-10% tariffs,                              US 10 May 19        25% tariffs after this round US
      • 6 Jul 18                        • 23 Aug 18                      effective 24 Sept 18                        China 1 June        has $40bn left to impose tariff

   US tariffs on Chinese goods                                            Additional                                                    Additional
                                                                                                                        Tariff rates
                   $34bn                  $16bn                                      $200bn                               rise to                     $300bn
                 25% tariff                 25%                                     10% tariff                             25%                        25% tariff
  China tariffs on US goods
                                                                                                                        Tariff rates
                   $34bn                  $16bn                               $60bn                                       rise to         $44bn
                 25% tariff                 25%                                5-10%                                      5-25%             25%

   Affected Chinese goods:                Chemicals, plastics and         Several kinds of Chinese goods ranging from                  Consumer products: garment and leather,
   Aircraft, vehicles and parts,          rubbers, electronics            agricultural products such as fruit, to consumer             toys, milk, animal product, electronics e.g.
   industrial machinery,                  (IC, semiconductor),            goods such as furniture and luggage, industrial and          mobile phone, laptop, steel and
   semiconductor, electrical              metal product, electric         intermediate goods such as chemicals.                        aluminum, excluding pharmaceuticals,
   appliances                             equipment (e.g.                                                                              selected medical goods, rare earth
                                          electric motor).                                                                             materials and critical minerals

   Affected US products:                  Chemicals, fuel (Oil and        Food, chemicals, LNG, machinery, telecom,                    The rest of US products imported by
   agricultural products                  gas and coals),                 semiconductor devices, machinery, mechanical                 China. The list will be updated later.
   (soybean and beef, frozen              petroleum, plastic              appliances, lasers, wood, optical and medical
   meats and fish, seafood,               product, medical                instruments
   vegetable and fruit), vehicles         device,
Source: USTR, FMPRC, MOFCOM, EU, CNBC, Nikkei Asian Review, The Japan Times, Reuters, Bloomberg, Krungsri Research

                                                                                                                                                            Krungsri Research   4
BULLETIN MONTHLY ECONOMIC - May 2019
China and US growth hit by tariff hikes; Asia may see long-
 term gain from trade diversion and production relocation
                                                                Impact of US-China tariffs (round 1 to 3) on World GDP
                                                                              (% deviate from baseline)
0.20                                                                                                                                                                                                                                            0.14
0.10                                                                                                         0.03 0.03 0.03 0.04
                                       0.00 0.00 0.00 0.00 0.01 0.01 0.01 0.01 0.01 0.02 0.02 0.02 0.03 0.03
0.00
-0.10                        -0.04
-0.20                -0.11

-0.30
           -0.28
-0.40
                                                       Impact of US-China tariffs (round 1 to 3) on World Exports
                                                                      (% deviate from baseline)
 2.00                                                                                                                                                     1.06                                              1.11 0.74
 1.00                                  0.20 0.24 0.02 0.28 0.01                                          0.33 0.29 0.10 0.09 0.39                                   0.23 0.27 0.42                                               0.22
 0.00
-1.00                        -0.41                                                               -0.14                                                                                                                                          -0.12
-2.00
-3.00                -2.47
-4.00      -3.50
-5.00

                                                                                                                                                           Mexico
                                                                                                                                EU

                                                                                                                                                                                                    India

                                                                                                                                                                                                                                  South Korea
                      USA

                                                                                         Japan

                                                                                                                    Indonesia

                                                                                                                                                                                                                        Canada
             China

                               World

                                                                  Philippines

                                                                                                                                     Oceania
                                        Hong Kong

                                                                                Taiwan

                                                                                                  Laos

                                                                                                         Malaysia

                                                                                                                                                                                                                                                 Vietnam
                                                    Singapore

                                                                                                                                                                     Latin America

                                                                                                                                                                                     South Africa
                                                                                                                                               Thailand

                                                                                                                                                                                                             Cambodia
Note: The database incorporates the updated tariff for all countries.
Source: Global Trade Analysis Project (GTAP), Krungsri Research

                                                                                                                                                                                                                        Krungsri Research                  5
BULLETIN MONTHLY ECONOMIC - May 2019
Thailand’s most export destinations hurt by supply chain
  disruption and global slowdown, except the US
  Although the net impact on Thai exports would be positive at +0.39%, most would come from opportunities to export to the US. This would be
  driven by substitution effect and relocation of production to Thailand, although there is no certainty in these factors and it would take time to bear
  fruit. Indeed, due to supply chain disruption and economic slowdown in China and the US, there could be adverse impact on Thailand’s shipments
  to most of its trading partners, led by South Korea, Japan, Hong Kong, China, and Taiwan.

                                                                 Impact of US-China tariff (round 1 to 3) on Thai exports by destination                                                                                                                                                                                                           10.87
 4.00                                                                                 (% deviate from baseline)
 3.50
 3.00
 2.50
 2.00
 1.50
 1.00
                                                                                                                                                                                                                                                                                                                     0.39
 0.50                                                                                                                                                                                                                                                                                                      0.21 0.28
 0.00
-0.50                                                                                                                                                                                                                                                                -0.11 -0.06
-1.00                                                                                                                        -0.64 -0.57
                                                                                         -0.93 -0.84 -0.82 -0.79 -0.75 -0.73
-1.50                                                                              -1.07
                                                                 -1.28 -1.24 -1.15
-2.00     -1.76 -1.69 -1.61
-2.50

                                                                                                                                                                                                                                                                                                                                           World
                                                                                                                              EU (10.0)

                                                                                                                                                                                                                                                                                                                                                    USA (11.2)
                                                                                                                                          Oceania (4.9)

                                                                                                                                                                       South Africa (1.1)

                                                                                                                                                                                            Malaysia (4.6)

                                                                                                                                                                                                                                                                                                           Mexico (1.1)

                                                                                                                                                                                                                                                                                                                          Cambodia (3.0)
                                 Japan (9.9)

                                                                                 Taiwan (1.6)

                                                                                                              Vietnam (5.1)

                                                                                                                                                                                                             Singapore (3.7)

                                                                                                                                                                                                                               Philippines (3.1)
                                               Hong Kong (5.0)

                                                                  China (11.9)

                                                                                                                                                          Laos (1.6)

                                                                                                                                                                                                                                                   Indonesia (4.0)

                                                                                                                                                                                                                                                                      Latin America (3.2)
             South Korea (1.9)

                                                                                                India (3.0)

                                                                                                                                                                                                                                                                                            Canada (6.0)
 ( ) % Share of Thai exports in 2018
 Note: The database incorporates the updated tariff for all countries.
 Source: GTAP, Krungsri Research

                                                                                                                                                                                                                                                                                                                                       Krungsri Research         6
Thai exports would benefit in only few countries, but
      losses would be broad-based by sector and destination
         Impact of US-China tariffs (round 1 to 3) on Thai exports by sector and destination (% deviate from baseline)

                                                                                                                                                                                                                      Latin America
                                                 South Korea

                                                                                                                                                 South Africa

                                                                                                                                                                                          Philippines
                                                                         Hong Kong

                                                                                                                                                                             Singapore

                                                                                                                                                                                                                                                           Cambodia
                                                                                                                                                                                                         Indonesia
                                                                                                                                                                 Malaysia
                                                                                                         Vietnam

                                                                                                                             Oceania

                                                                                                                                                                                                                                       Canada

                                                                                                                                                                                                                                                 Mexico
                                                                                      Taiwan
                                        China

                                                                Japan

                                                                                                India

                                                                                                                                        Laos

                                                                                                                                                                                                                                                                       USA
                                                                                                                    EU
                   Sector

Electronic & computer equipment        -0.840   -0.670         -0.280   -0.405       -0.751    -0.275   -0.064     -0.288   -0.191     -0.132   -0.104          -0.092      -0.139       -0.098         -0.031       -0.096           -0.005    -0.009    -0.039      5.379

Chemical, rubber, plastic products     -0.413   -0.377         -0.243   -0.251       -0.167    -0.456   -0.286     -0.042   -0.139     -0.066   -0.122          -0.240      -0.062       -0.168         -0.118       -0.017           -0.009    -0.006    0.137       0.430

Machinery and equipment                -0.191   -0.163         -0.487   -0.263       -0.096    -0.247   -0.361     -0.071   -0.170     -0.505   -0.111          -0.228      -0.261       -0.137         -0.264       -0.102           0.007     -0.076    -0.304      1.034

Textiles, apparel and leather          -0.116   -0.154         -0.202   -0.181       -0.067    -0.137   -0.246     -0.159   -0.100     -0.061   -0.174          -0.056      -0.062       -0.117         -0.079       -0.111           -0.102    0.020     -0.188      1.034

Wood products                          -0.100   -0.043         -0.025   -0.007       0.023     -0.015   -0.015     -0.009   -0.019     -0.009   -0.014          -0.024      -0.004       -0.006         -0.013       -0.003           0.016     0.009     -0.011      0.291

Other non-metallic mineral products    -0.017   -0.004         -0.004   -0.001       -0.001    0.016    0.035      0.000    -0.003     0.025    -0.007          -0.004      -0.007       -0.007         0.004        0.001            0.001     0.003     0.134       0.023

Manufacturing nec.                     -0.010   -0.037         -0.070   -0.057       -0.009    0.063    -0.002     -0.123   -0.064     -0.001   -0.013          -0.008      -0.008       -0.018         -0.005       -0.018           -0.041    -0.002    0.006       1.993

Fabricated metal products              -0.008   -0.016         -0.081   -0.008       -0.011    -0.062   -0.190     -0.009   -0.071     -0.113   -0.050          -0.033      -0.014       -0.045         -0.021       -0.009           0.001     0.007     -0.029      0.388

Basic metals                           -0.006   -0.090         -0.026   -0.016       -0.068    -0.036   -0.050     -0.002   -0.064     -0.005   -0.026          -0.020      -0.029       -0.045         -0.018       -0.001           0.008     0.003     0.000       0.033

Motor vehicles                         -0.003   0.001          -0.005   -0.002       -0.004    0.012    0.043      0.006    0.071      -0.023   -0.019          0.034       -0.001       0.061          0.063        0.269            0.014     0.077     0.050       0.036

Other transport equipment              -0.002   -0.027         -0.012   -0.010       -0.003    -0.006   0.011      -0.017   -0.015     -0.044   -0.022          -0.015      -0.003       -0.035         -0.065       -0.027           -0.017    -0.002    -0.052      -0.009

Energy                                 0.000    0.003          0.000    0.000        0.000     0.000    0.000      0.000    0.000      0.000    0.000           0.000       0.000        0.000          0.000        0.000            0.000     0.000     0.000       0.000

Paper products                         0.014    -0.005         -0.003   -0.029       -0.007    -0.001   0.001      -0.001   -0.009     -0.003   -0.005          -0.011      -0.010       -0.014         -0.003       0.001            0.001     0.000     0.003       0.013

Food & beverages                       0.020    -0.082         -0.203   -0.143       -0.035    0.011    0.039      -0.016   -0.038     0.098    -0.052          -0.015      -0.024       0.010          0.001        0.013            -0.037    0.015     0.460       0.341

Petroleum                              0.035    -0.002         -0.001   -0.010       -0.002    0.000    0.007      0.001    0.001      0.021    0.001           -0.013      -0.038       -0.016         0.002        0.000            0.002     0.001     0.100       0.003

Agriculture                            0.493    -0.002         -0.018   -0.112       -0.027    0.000    -0.006     -0.006   0.000      0.005    -0.011          -0.017      -0.011       -0.008         -0.020       -0.002           -0.024    -0.010    0.011       -0.004

                   Total               -1.282   -1.762         -1.691   -1.612       -1.238    -1.148   -1.068     -0.932   -0.841     -0.819   -0.785          -0.745      -0.732       -0.645         -0.572       -0.106           -0.060    0.209     0.283       10.873

     Source: GTAP, Krungsri Research                                                                                                                                Note: The database incorporates the updated tariff for all countries.

                                                                                                                                                                                                                                           Krungsri Research           7
Potential US auto tariffs: Another risk to global economy,
hinder growth at major automakers, e.g. EU and Japan
                                                                                        Timeline
                                           Timeline for Section 232 process for US Auto import restrictions

           18 May 18:                                                                                              After president
       Under Section 232                        17 Feb 19:                           18 May 19:                  decides on action,                         14 Nov 19:
          of the Trade                                                                              Approve    extension is possible
                                             Department of                        President must                if the White House                          Impose
         Expansion Act                        Commerce
            1962, an                                                             make a decision                holds negotiations                       restriction on
                                               privately                         on tariff - when                    with the EU                       imports if there is
        investigation on
                                            submitted to US                      and what action                                                         no new trade
          Automobile                                                                                Rejected
                                               president                             to take                                                              agreement
          imports was                                                                                           No further action
           launched
                                                                                                                    required

                       270 day later                                  90 day later                  Decide                          180 day later

   Recent development
      Section 232 of the Trade Expansion Act 1962 is a US law that allows the President to impose import
                                                                                                                            Share of auto exports to US market
       restrictions if there is a threat to national security, without needing approval from congress. It was                           in 2018 (%)
       invoked on 23 Mar 2018 to propose tariffs on all steel and aluminium imports into the US.
                                                                                                                                        China Other
      The latest investigation is focused on US Auto imports as that contribute to half of US trade deficit. It                South                 3.7
       was launched on 18 May 2018 by the US Department of Commerce to study whether the imports                                Korea          5.9
       were a threat to US national security. On 18 Feb 2019, a report was submitted to President Trump                                  6.2
                                                                                                                                                            Mexico
       indicating that automobile & parts imports were potentially a threat to national security and
                                                                                                                                                              30.6
       recommended the action to be taken. The details were not disclosed, but it is believed the                                      Japan
       recommended action was to impose 10-25% tariff on auto imports.                                                                  17.1
      President has until 18 May to decide whether to approve the recommendation, and what action to
                                                                                                                                          Canada              EU
       take. Once Trump decides to act, his counterpart would have 180 days to negotiate a trade agreement
                                                                                                                                               17.5          19.1
       with the US to receive exemption.
      Mexico and Canada are likely to be exempt from tariffs due to the USMCA agreement. Other largest
       importers of US cars that will be affected by tariffs are EU, Japan, South Korea and China.
Source: Federation of American Scientists (FAS), Bloomberg, Krungsri Research

                                                                                                                                                             Krungsri Research   8
Spillover is limited as world output will drop by only
   0.01%, while the US will be hardest hit
  We calculated the impact of higher tariffs on automobiles & parts imported into the US - 25% (worse case) and 10% (likely case). We maintain tariffs
  for Canada and Mexico due to the USMCA agreement. Our results suggest limited impact on world GDP in the worst case scenario, at 0.012%. US
  would be hit most by the tariff hike because raising prices of imported automobiles & part would raise prices of final goods in the US. This would
  affect domestic consumption by lowering real purchasing power for other products. Imported parts contribute to final goods in the automobile
  sector, at about 47%. For other countries, Japan, Korea, Malaysia and EU would see the largest (albeit also limited) impact on GDP and exports
  because of large exposure to the US market. However, we would monitor the impact of falling market confidence triggered by trade uncertainties.

                               Marginal effect of an increase in US auto tariff on GDP and exports (% deviate from baseline)
 0.02                                                                                                                                               10% tariff increase         25% tariff increase
            GDP
 0.01
 0.00
-0.01
-0.02
-0.03
-0.04
-0.05
            World        USA         Japan       Korea       Malaysia     EU_28   Tiwan   Philippines      Thailand     Singapore     Indonesia        Laos     Cambodia      China     Vietnam
          Exports
0.00
-0.10
-0.20
-0.30
-0.40
-0.50
-0.60
                                                                          EU

                                                                                                                                                        Laos

                                                                                                                                                                              China
             World

                                                                                             Philippines
                         USA

                                                               Malaysia

                                                                                                                          Singapore

                                                                                                                                        Indonesia

                                                                                                                                                                                         Vietnam
                                                     Korea

                                                                                  Tiwan

                                                                                                             Thailand
                                     Japan

                                                                                                                                                                  Cambodia
  Source: GTAP, OECD, Bloomberg, Krungsri Research

                                                                                                                                                                             Krungsri Research     9
US: Growth composition was weak in 1Q19, but surge in
productivity growth lifts long-term upside potential
%, ppt                                  GDP growth QoQ saar                                                                             % YoY             Nonfarm Business Productivity
                                       PCE
 6.0                                                                                                                                     7.0
                                       Business Fixed Investment                                                                                       Productivity growth           5-year moving average
                                       Government consumption                                                                            6.0
                                       Inventories                                                                                       5.0
 4.0
                                       Net exports
                                                                                                                                         4.0
 2.0                                                                                                                                     3.0
                                                                                                                                         2.0
                                                                                                                                         1.0
 0.0
                                                                                                                                         0.0
                                                                                                                                        -1.0
-2.0

                                                                                                                                               Mar-95
                                                                                                                                               Mar-96
                                                                                                                                               Mar-97
                                                                                                                                               Mar-98
                                                                                                                                               Mar-99
                                                                                                                                               Mar-00
                                                                                                                                               Mar-01
                                                                                                                                               Mar-02
                                                                                                                                               Mar-03
                                                                                                                                               Mar-04
                                                                                                                                               Mar-05
                                                                                                                                               Mar-06
                                                                                                                                               Mar-07
                                                                                                                                               Mar-08
                                                                                                                                               Mar-09
                                                                                                                                               Mar-10
                                                                                                                                               Mar-11
                                                                                                                                               Mar-12
                                                                                                                                               Mar-13
                                                                                                                                               Mar-14
                                                                                                                                               Mar-15
                                                                                                                                               Mar-16
                                                                                                                                               Mar-17
                                                                                                                                               Mar-18
                                                                                                                                               Mar-19
           1Q15
                  2Q15
                         3Q15
                                4Q15
                                       1Q16
                                               2Q16
                                                      3Q16
                                                             4Q16
                                                                    1Q17
                                                                           2Q17
                                                                                  3Q17
                                                                                         4Q17
                                                                                                1Q18
                                                                                                       2Q18
                                                                                                              3Q18
                                                                                                                     4Q18
                                                                                                                             1Q19
                                                                                                                                    Krungsri Research’s view
   Strong growth                GDP components (% QoQ saar)
   Modest/Moderate                                                                                                                     1Q19 GDP growth rose to 3.2% saar from 2.2% in 4Q18, beating 2%
                                       2Q18               3Q18         4Q18              1Q19                                           consensus estimate. The surprise strong reading was led by net trade
   Contraction
                                              8.7                                        9.3                         9.3                (added 1.03ppt to GDP), inventories (+0.65ppt) and the unusual surge in
                                                                                                                                        highway & street construction spending, which will all reverse in the coming
                                                          5.4
 3.8 3.5                                                                                              3.7                               quarters. Consumption only grew 1.2%. Business investment grew 2.7% led
           2.51.2                                   2.5      2.7 2.5 2.6          2.4              1.8                     2.0          by investment in intellectual property products.
                                                                                                                                       Growth composition was weak but long-term potential growth is decent.
                                                                            -0.4                              -0.6                      Business productivity growth surged 2.4% YoY in 1Q19, the strongest since
                    -1.3
                        -3.6-4.7-2.8                                                                                         -3.7       the financial crisis and much higher than 1.0% average over the past five
                                                                                            -4.9
                                                                                                                                        years. We may be witnessing a broader transformation in the supply side of
                                                                                                                                        the economy, reflecting tight labour markets. We are more optimistic of the
   Private   Residential                         Non-     Government                        Exports              Imports                potential for a sustainable recovery in productivity growth driven by the
 Consumption Investment                       Residential Consumption                                                                   adoption of a new wave of technologies that will increase efficiency across
                                              Investment                                                                                large swathes of the economy.

Source: Bureau of Economic Analysis (BEA), Bureau of Labor Statistics (BLS), Bloomberg, Krungsri Research

                                                                                                                                                                                              Krungsri Research   10
Fed shows no bias to rate hikes or cuts, upbeats on growth
as downside risks moderate, downplays muted inflation
  %                                  Fed policy rates                                                Key notes from FOMC Meeting on 30 April – 1 May
2.50                                                                                                    The FOMC voted unanimously to leave target fed funds rate at 2.25-2.50%,
                      Effective fed funds rate                                                           as widely expected. The committee also cut interest rate on excess reserves
2.25                  Mid-point of target range                                                          (IOER) by 5bps to 2.35%.
                      IOER                                                                              While the accompanying statement was dovish, Fed Chair Jerome Powell
2.00
                                                                                                         sounded more upbeat during the press conference. The statement
                                                                  In past weeks, the effective fed       downgraded descriptions for household spending and business fixed
1.75                                                               funds rate exceeded the mid-          investment growth as “slowed”, and acknowledged that headline and core
                                                                     point of the target range.          inflation “have declined and are running below 2%”.
1.50
                                                                                                        Powell noted the FOMC does not see a strong case for moving rates in
1.25                                                                                                     either direction. Three notable elements were:
                                                                                                         ▪ (i) He described the economy as “on a healthy path” and supported by
        Jan-18

                                                                        Jan-19
                 Feb-18
                 Mar-18

                          May-18
                                   Jun-18
                                    Jul-18
                                             Aug-18

                                                               Dec-18
                                                      Sep-18

                                                                                 Feb-19
                                                                                 Mar-19

                                                                                          May-19
                          Apr-18

                                                      Oct-18
                                                               Nov-18

                                                                                          Apr-19
                                                                                                           “solid underlying fundamentals”. He also noted downside risks to the
                                                                                                           outlook from earlier in the year “have moderated somewhat”.
                                                                                                         ▪ (ii) He emphasized that core inflation “actually ran pretty close to 2% for
 %                                     PCE inflation                                                       much of 2018” and attributed the recent decline largely to “transitory
2.2                                                                                                        factors” influencing categories such as portfolio management and
                                         Dallas Fed trimmed mean                                           apparel. To overlook these transitory factors, Powell pointed to the
2.0                                                                                                        Dallas Fed trimmed mean measure, currently at around 2%, which is a
                                                                                                           much better guide to the underlying inflation trend.
1.8
                                                                                                         ▪ (iii) He noted that the IOER cut was a “small technical adjustment” and
1.6                                                                                                        does not reflect a loosening of the policy stance. This should bring
                                                                                                           effective fed funds rate closer to the mid-point of the target range again.
1.4
                                                               Core PCE inflation                       The Fed is downplaying weak inflation, which reduces the chance of a rate
1.2                                                                                                      cut. We typically follow the Fed’s guidance, which means we do not see a
                                                                                                         rate hike this year. Although the Fed continues to signal its intended
1.0                                                                                                      normalization is underway (one more hike in 2020), renewed trade tensions
      Oct-13

      Oct-14

      Oct-15

      Oct-16

      Oct-17

      Oct-18
      Jan-13

       Jul-13

      Jan-14

       Jul-14

      Jan-15

       Jul-15

      Jan-16

       Jul-16

      Jan-17

       Jul-17

      Jan-18

       Jul-18

      Jan-19
      Apr-13

      Apr-14

      Apr-15

      Apr-16

      Apr-17

      Apr-18

      Apr-19

                                                                                                         could take rate hikes off the table, and we now expect fed funds rate to
                                                                                                         stand pat up to the end of 2020.

Source: Board of Governors of the Federal Reserve System, Federal Reserve Bank of Dallas, Bloomberg, Krungsri Research

                                                                                                                                                                  Krungsri Research   11
Europe: Precarious recovery as activity surveys and labor
market conditions cross paths
The latest GDP data and labour market indicators are encouraging but the timelier survey indicators remain weak, suggesting recovery will be unsustainable.
Eurozone GDP growth ticked up more than expected to +0.4% QoQ sa from +0.2% previously. The expenditure breakdown of the national data suggests
domestic demand was the key growth driver in Eurozone. Germany’s GDP grew by 0.4%. Italy’s recession has ended as GDP grew by 0.2%. Growth inched up
in Spain to +0.7% (from +0.6%), and was stable in France at +0.3%. Meanwhile, the region’s unemployment rate fell to 7.7% in March, the lowest since
September 2008. Given these, the trend of income creation – a product of average wage growth and employment – is favourable. On the other hand,
Composite PMI data fell again in April, while sentiment indicators continued to deteriorate.
                                        Eurozone GDP growth                                                                        DI                                 Eurozone GDP vs Business Surveys                                                                                    % YoY
 3.0                                                                                                                               60                                                                                                                                                       4.0
                         % QoQ sa                           % YoY
 2.5                                                                                                                                                                                                    GDP growth (RHS)
 2.0                                                                                                                               55                                                                                                                                                      2.0
 1.5
                                                ECB “potential growth”
 1.0                                                                                                                               50                                                                                                                                                      0.0
 0.5                                                                                                                                                                                              Composite PMI (LHS)

 0.0                                                                                                                               45                                                                                                                                                      -2.0

                                                                                                                                        Jan-10
                                                                                                                                         Jul-10
                                                                                                                                        Jan-11
                                                                                                                                         Jul-11
                                                                                                                                        Jan-12
                                                                                                                                         Jul-12
                                                                                                                                        Jan-13
                                                                                                                                         Jul-13
                                                                                                                                        Jan-14
                                                                                                                                         Jul-14
                                                                                                                                        Jan-15
                                                                                                                                         Jul-15
                                                                                                                                        Jan-16
                                                                                                                                         Jul-16
                                                                                                                                        Jan-17
                                                                                                                                         Jul-17
                                                                                                                                        Jan-18
                                                                                                                                         Jul-18
                                                                                                                                        Jan-19
           1Q15
                  2Q15
                         3Q15
                                4Q15
                                       1Q16
                                              2Q16
                                                     3Q16
                                                            4Q16
                                                                   1Q17
                                                                          2Q17
                                                                                 3Q17
                                                                                        4Q17
                                                                                               1Q18
                                                                                                       2Q18
                                                                                                              3Q18
                                                                                                                     4Q18
                                                                                                                            1Q19
    Strong growth                      GDP growth (% QoQ sa)                                                                        %                                 Eurozone labor market conditions                                                     % YoY
    Modest/Moderate                                                                                                                 6            Negotiated                                                                            Unemployment rate     4.0
     Contraction
                                       2Q18           3Q18            4Q18              1Q19
                                                                                                                                    7            wage (RHS)                                                                                (reverse order)   3.5
                                                                                                                            0.7
                                                                                                      0.6            0.6            8                                                                                                                        3.0
    0.5                                                                                                       0.5
                         0.4                                                                                                        9                                                                                                                        2.5
                                          0.3 0.3 0.3
                                  0.2                                                    0.2                                       10                                                                                                                        2.0
                                                                   0.1
                  0.0                                                                                                              11                                                                                                                        1.5
                                                                                                                                   12                                                                                                                        1.0
                                                                          -0.1 -0.1                                                13                                                                                                                        0.5
          -0.2
                                                                                                                                        Jan-04
                                                                                                                                                  Jan-05
                                                                                                                                                           Jan-06
                                                                                                                                                                    Jan-07
                                                                                                                                                                             Jan-08
                                                                                                                                                                                      Jan-09
                                                                                                                                                                                               Jan-10
                                                                                                                                                                                                        Jan-11
                                                                                                                                                                                                                 Jan-12
                                                                                                                                                                                                                          Jan-13
                                                                                                                                                                                                                                   Jan-14
                                                                                                                                                                                                                                            Jan-15
                                                                                                                                                                                                                                                     Jan-16
                                                                                                                                                                                                                                                               Jan-17
                                                                                                                                                                                                                                                                        Jan-18
                                                                                                                                                                                                                                                                                 Jan-19
          Germany                         France                             Italy                            Spain

Source: Eurostat, Markit, Bloomberg, Krungsri Research

                                                                                                                                                                                                                                                              Krungsri Research               12
Potential US auto tariffs – major headwinds for EU auto
industry but limited impact on GDP as a whole
                         Impact of 10% tariff on EU                                                                     Share of auto exports to US market in 2018 (%)
                        (% deviation from baseline)                                                                                        France
                                                                                                                                                  1.3          4.3
                                                                                                                                                                     Other
                                  0.13      ROW                                                                                      Austria 1.5
                                                                                                                                Finland 2.2
                                                        -0.12                -0.005                                          Hungary 2.5
                                 -4.00      US                                                                               Spain 2.7
                                                                                                                          Slovakia 3.7
                                                                                                                                                                 Germany
                                                                                                                          Sweden 4.4
                                 -0.25                                                                                                                                 49.1
                                            EU                                                                                               Italy
                                                                                                                                             10.9
          -36.89                                                                                                                                        UK
                                                                                                                                                        17.5
    Auto exports to           Total auto          Total exports               GDP
          US                   exports
                                                                                                  Krungsri Research’s view
                                                                                                      To quantify the impact of auto tariffs, we outline two plausible scenarios:
                      Impact of 25% tariff on EU                                                       imposing 10% or 25% tariff on EU auto imports.
                      (% deviation from baseline)                                                     Our study shows 10% and 25% tariffs would shave off one-third and two-
                                  0.25      ROW                                                        thirds of EU auto exports to the US. The impact is sizable but moderate in
                                                                                                       terms of total EU auto exports (-4% and -7.25%, respectively). The US
                                                        -0.21                -0.009                    market accounted for 11% of EU auto exports in 2018. Germany would be
                                                                                                       hurt most because half of EU auto exports to the US comes from there.
                                 -7.25      US                                                        Meanwhile, there is small negative spillover effect: car and parts trade
                                                                                                       within the EU could drop by 0.25% and 0.45%, while EU auto exports to
                                                                                                       ROW would rise by 0.13% and 0.25%. All in, the net impact on total EU
                                                                                                       exports would be only -0.12% and -0.21%.
                                 -0.45      EU                                                        As for the impact on GDP, the tariffs would have limited impact in the
          -66.78
                                                                                                       longer term (-0.005% and -0.009%). However, the long-run equilibrium
    Auto exports to           Total auto          Total exports               GDP                      would involve shifting resources from auto industry to other sectors of the
          US                   exports                                                                 economy, a process that would take time. Thus, the near-term impact
                                                                                                       would be substantial for the EU economy, especially now when the
                                                                                                       economy is slowing and affected by Germany’s car policy.

Source: ITC trade map, Global Trade Analysis Project (GTAP), Federation of American Scientists (FAS), Capital economics, Krungsri Research

                                                                                                                                                                              Krungsri Research   13
Spain election: Results point to a Hung Parliament but this
did not stop the economy from outperforming Eurozone
                                                                                                                          Parliamentary seats won by party
 # Seats 0                           25                       50                  75                  100                     125                 150             175        200       225        250        275        300        325         350

      2019                         42                                                                       123                                                         38                 57                         66                  24

      2016                              57                                                             85                                                39                  32                                 137

        Unidas Podemos (Far-left)                                       Socialist Party (Centre-left)                                  Smaller parties              Ciudadanos (Centrist)       People's Party (Centre-right)     VOX (Far-right)

% YoY                               2019 GDP Growth consensus forecast                                                                                        Krungsri Research’s view
2.4                                                                                                                                                               Spain’s general election results were in line with expectations. No party won a
                                                                                                                                 Spain                             majority, and a centre-left coalition seems the most likely outcome. While the
2.2                                                                                                                                                                Socialists and Podemos together only won 165 seats in parliament, they could
2.0                                                                                                                                                                secure the 176 needed for a majority with support from smaller parties –
                                                                                                                                                                   including moderate nationalists from the Basque Country. That means acting
1.8                                                                                                                                                                PM Pedro Sánchez and his centre-left coalition would not need to rely on the
1.6                                                                                                                                                                two Catalan pro-independence groups and a radical Basque separatist group.
                                                                                                                        Eurozone                                   This likely scenario could reduce the risk of Catalan secession. So it seems more
1.4                                                                                                                                                                likely that there could be an arrangement to grant Catalonia greater autonomy
                                                                                                                                                                   rather than a push for another independence referendum.
1.2
                                                                                                                                                                  On the other hand, if a government is not formed after two months, there
1.0                                                                                                                                                                could be another election. Even if coalition negotiations drag on, this is unlikely
                                                               Jul-18

                                                                                                                                       Mar-19
        Jan-18
                 Feb-18
                          Mar-18

                                            May-18
                                                     Jun-18

                                                                        Aug-18
                                                                                 Sep-18

                                                                                                   Nov-18
                                                                                                            Dec-18
                                                                                                                     Jan-19
                                                                                                                              Feb-19
                                   Apr-18

                                                                                          Oct-18

                                                                                                                                                Apr-19

                                                                                                                                                                   to have much economic impact. Spain has experienced persistent political
                                                                                                                                                                   uncertainty in recent years but the economy still registered strong growth.
                                                                                                                                                                   Despite a series of growth downgrades for Eurozone as a whole, economists
                                                                                                                                                                   remain confident Spain would be resilient as growth outlook is relatively stable.
Source: POLITICO, Capital Economics, Bloomberg, Krungsri Research

                                                                                                                                                                                                                                Krungsri Research    14
China: GDP data steady in 1Q19 but growth composition
was less impressive and momentum is slowing
 %                                                      GDP growth                                                                             Strong growth           Growth by major sectors (% YoY)
8.0                                                                                                                                            Modest/Moderate
                                                                                                                                                Contraction
                                                                                                                                                                             2Q18              3Q18           4Q18              1Q19
                                                                             % YoY                           % QoQ saar
7.5                                                                                                                                                                        8.7
                                                                                                                                                                 8.1 8.0
                                                                                                                                                                             7.3                                     7.0                                      7.0
7.0                                                                                                                                           6.4                                  6.8
                                                                                                                                                    5.9 5.76.1                           6.3                      6.3                                   6.3
                                                                                                                                   6.4                                                         5.86.0
6.5                                                                                                                                                                                                     4.3 4.0            4.2 4.1            4.3 4.0

6.0                                                                                                                                5.6                                                                                               2.0
                                                                                                                                                                                                                                        2.5

5.5

5.0                                                                                                                                              Manu-             Trans-            Hotels &           Wholesale &            Real             Financial
                                                                                                                                                facturing         portation          Catering           Retail Trade          Estate            Services
          1Q15
                   2Q15
                           3Q15
                                  4Q15
                                          1Q16
                                                 2Q16
                                                        3Q16
                                                               4Q16
                                                                      1Q17
                                                                              2Q17
                                                                                     3Q17
                                                                                             4Q17
                                                                                                      1Q18
                                                                                                              2Q18
                                                                                                                     3Q18
                                                                                                                            4Q18
                                                                                                                                   1Q19
                                  Contribution to GDP growth (ppt)                                                                        Krungsri Research’s view
          Final consumption                             Gross capital formation                               Net exports                    1Q19 GDP data paints a complicated picture. On one hand, real GDP growth
                                                                                                                                              was steady at 6.4% YoY. But there are signs of trouble. First, sequential
                                            0.1         0.1     0.1                                                                           growth was 5.6% QoQ saar, the lowest since 1Q16, suggesting economic
                                  2.7                                                                                  0.5                    momentum continues to weaken. Second, growth was led by net exports
  2.5                                       1.3                                      2.1        2.1          2.1
                      3.0                                       2.4          2.0                                                   1.5        which contributed 1.5ppt to growth, the largest since 4Q17. The increase is
           3.3                                          3.3                                                            1.3
                                                                                                                                   0.8        almost entirely due to falling imports. Third, domestic demand remained
                                                                             1.7                                                              weak. Consumption expenditure contributed less to overall growth than in
  5.2                             5.1       5.5                                      5.3        5.3          5.0                              the previous quarter (at 4.2ppt from 4.6ppt). Investment was also subdued
           3.8        3.9                                       4.3                                                    4.6         4.2
                                                        3.5                  3.1                                                              as gross fixed capital formation contributed sub-1ppt to growth.
                                                                                                                                             On the other hand, supply-side GDP data was firmer than demand suggests.
  -1.0 -0.4 -0.3 -1.0                                                                -0.6 -0.7 -0.6                                           Manufacturing is picking up, growing 6.1% YoY. The services industry
                                                                                                                                              remains the fastest growing sector at 7% YoY, albeit slowing from 7.4%. But
   1Q16

            2Q16

                          3Q16

                                   4Q16

                                             1Q17

                                                        2Q17

                                                                 3Q17

                                                                             4Q17

                                                                                      1Q18

                                                                                                    2Q18

                                                                                                              3Q18

                                                                                                                        4Q18

                                                                                                                                   1Q19

                                                                                                                                              most of the slowdown was attributed to Transportation sector. Financial
                                                                                                                                              Services and Wholesale & Retail Trade continued to recover.
Source: National Bureau of Statistics (NBS), Bloomberg, CEIC, Krungsri Research

                                                                                                                                                                                                                                     Krungsri Research          15
Business activity and credit growth slowed in April,
underlining the need for further monetary policy easing
  DI                                                         Official PMI data                                                                                             % YoY                             Aggregate Financing (Outstanding)                                                                              % YoY
                                                                                                                                       Construction
  64                                                                                                                                                                      15                                                                                                                           Bank loan                  60
  62
  60                                                                                                                                                                                                                                                                                          Total financing
                                                                                                                                                                          10                                                                                                                                                      50
  58
  56                                                                                                                                                                                                                                                                                    Corporate bond &
                                                                                                                                                  Services                                                                                                                               Equity financing
  54                                                                                                                                                                          5                                                                                                                                                   40
  52
  50
                                                                                                                                                                                                                                                  Local government bond issuance (RHS)
  48       Above 50 = expansion, below 50 = contraction                                                                           Manufacturing                               0                                                                                                                                                   30

                                                                                                                                                                                  Jan-18

                                                                                                                                                                                                                                                                                     Dec-18
                                                                                                                                                                                                                                                                                              Jan-19
                                                                                                                                                                                           Feb-18
                                                                                                                                                                                                    Mar-18

                                                                                                                                                                                                                      May-18
                                                                                                                                                                                                                               Jun-18
                                                                                                                                                                                                                                        Jul-18
                                                                                                                                                                                                                                                 Aug-18
                                                                                                                                                                                                                                                          Sep-18

                                                                                                                                                                                                                                                                                                       Feb-19
                                                                                                                                                                                                                                                                                                                Mar-19
                                                                                                                                                                                                             Apr-18

                                                                                                                                                                                                                                                                   Oct-18
                                                                                                                                                                                                                                                                            Nov-18

                                                                                                                                                                                                                                                                                                                         Apr-19
       Jan-15

                         Jul-15

                                           Jan-16

                                                             Jul-16

                                                                               Jan-17

                                                                                                 Jul-17

                                                                                                                    Jan-18

                                                                                                                                      Jul-18

                                                                                                                                                        Jan-19
                Apr-15

                                  Oct-15

                                                    Apr-16

                                                                      Oct-16

                                                                                        Apr-17

                                                                                                          Oct-17

                                                                                                                             Apr-18

                                                                                                                                               Oct-18

                                                                                                                                                                 Apr-19
  DI                                         Official Manufacturing PMI                                                                                                   Krungsri Research’s view
  54                                                                                                                                                                         Official PMI data for all three sectors – Manufacturing, Services and
                                                                                                                                                                              Construction – rose above the 50-threshold concurrently for the second
  52                                                                                                                                               Large firms                straight month. Expansion moderated except for small manufacturers
                                                                                                                   Medium firms
                                                                                                                                                                              (improving towards 50), likely responding to the targeted monetary
  50                                                                                                                                                                          easing implemented earlier.
                                                                                                                                                                             In line with this, credit growth has levelled off. Aggregate financing
  48                                                                                                                                                                          growth dropped to 10.3% in April from 10.6% in March. Bank loan
                                                                                                                                                                              growth edged down to 13.5% (from 13.8%). Other forms of credit
  46                                                                                                                                                                          growth also slowed, e.g. corporate bond issuance and equity financing.
                                                                                                                                                 Small firms                 On the other hand, local government special bond issuance continued
  44
                                                                                                                                                                              to rise, but we remain cautious that the front-loading will fade later this
                Apr-15

                                  Oct-15

                                                    Apr-16

                                                                      Oct-16

                                                                                        Apr-17

                                                                                                          Oct-17

                                                                                                                             Apr-18

                                                                                                                                               Oct-18

                                                                                                                                                                 Apr-19
       Jan-15

                         Jul-15

                                           Jan-16

                                                             Jul-16

                                                                               Jan-17

                                                                                                 Jul-17

                                                                                                                    Jan-18

                                                                                                                                      Jul-18

                                                                                                                                                        Jan-19

                                                                                                                                                                              year. Overall, the slowdown in credit growth underlines the need for
                                                                                                                                                                              further monetary policy easing in order to keep credit expanding fast
Source: NBS, People’s Bank of China (PBOC), Krungsri Research
                                                                                                                                                                              enough to provide a floor to economic growth.

                                                                                                                                                                                                                                                                                                 Krungsri Research                16
PBOC continues to provide more liquidity to banks to lend
to the economy while controlling lending rates
  %                               Required Reserve Ratio (RRR)                                                                                      CNY, trn                  Credit flow (12-month rolling sum)
 22                                                                                                                                                 10
                                                                                                                                                                                                                            Non-Financial Corporate
 20                                                                                                                                                  9

                                                                                                                Major banks                          8
 18
                                                                                                                                                     7
 16                                                                                                                                                                                                                                                Household
                                                                                                                                                     6
 14                                                                                                             Small banks                          5
 12                                                                                                                                                  4
 10                                                                                                                                                  3

                                                                                                                                                                           Jul-16

                                                                                                                                                                                                               Jul-17

                                                                                                                                                                                                                                                   Jul-18
                                                                                                                                                         Jan-16

                                                                                                                                                                                             Jan-17

                                                                                                                                                                                                                                 Jan-18

                                                                                                                                                                                                                                                                     Jan-19
                                                                                                                                                                  Apr-16

                                                                                                                                                                                    Oct-16

                                                                                                                                                                                                      Apr-17

                                                                                                                                                                                                                        Oct-17

                                                                                                                                                                                                                                          Apr-18

                                                                                                                                                                                                                                                            Oct-18

                                                                                                                                                                                                                                                                              Apr-19
      Jan-08

               Jan-09

                         Jan-10

                                    Jan-11

                                                 Jan-12

                                                               Jan-13

                                                                                 Jan-14

                                                                                              Jan-15

                                                                                                          Jan-16

                                                                                                                     Jan-17

                                                                                                                              Jan-18

                                                                                                                                       Jan-19
  %                      Bank lending rate vs Interbank rate                                                                                    Krungsri Research’s view
 10                                                                                                                                                The People’s Bank (PBOC) lowered required reserve ratio (RRR) for
                                                                                                                                                    selected small banks (around 1,000 rural banks) to 8% effective 15
  8                                                                                                                                                 May. The PBOC said the move will release RMB280bn of bank reserves,
                                                                                                   Average bank lending rate                        one third of the net liquidity injection during the last RRR cut in
  6                                                                                                                                                 January.
                                                                                                                                                   This should feed through and further reduce average bank lending
  4                                                                                                                                                 rates. Loan demand, which has started to recover, will probably pick up
                                                                                                                                                    as a result. Combined with a relaxation in loan quotas, this will push up
  2                                                                                                                                                 bank lending in the coming months.
                                                                                                                       7-day repo rate
                                                                                                                                                   The PBOC had hinted that RRR cuts for small banks were on the horizon
  0
                                                                                                                                                    even when trade talks were going well. Given renewed US-China trade
      Jan-09

                Jan-10

                           Jan-11

                                        Jan-12

                                                      Jan-13

                                                                        Jan-14

                                                                                          Jan-15

                                                                                                       Jan-16

                                                                                                                   Jan-17

                                                                                                                              Jan-18

                                                                                                                                       Jan-19

                                                                                                                                                    tensions and support from fiscal front-loading likely to wane, the PBOC
                                                                                                                                                    will continue to launch ‘targeted RRR cuts’ later this year.
Source: PBOC, Bloomberg, Krungsri Research

                                                                                                                                                                                                                                                   Krungsri Research              17
Japan: Trump urge Abe to end tariffs on US farm goods,
but this is unlikely ahead of Upper House Election
Trump has urged Abe to end tariffs on US agricultural imports while threatening to raise tariffs on Japanese vehicles & part. Meanwhile, Abe has
continued to negotiate by highlighting the rising number of jobs created in the US by Japanese investment and attempted to push US to return to TPP
which gives more benefits to Japan. We see Japan will not soften its stance to lower tariffs ahead of the Upper House elections set for July. Moreover,
our calculation suggests modest positive impact from ending tariffs on US agricultural products. GDP and total production would only rise 0.01% in
the long-term due to better resource allocation. However, agricultural production would drop by 2.31% because consumers would switch to US
imports from domestic products.
                      Political and Diplomatic calendar                          Effect of reduction in import tariff for US agricultural products (%)
15-16 Apr          Minister of State for Economic and Fiscal policy visit           Household demand
                                                                                                                                                       14.06
                   to US to meet with USTR Representative                           for imports
                                                                                    Household demand
21 Apr             Second round of local elections                                  for domestic
                                                                                                               -1.17

26-27 Apr          PM Abe visits US to discuss trade negotiations                Agricultural production     -2.31

18 May             Deadline for President Trump's trade policy decision
                   based on Article 232 (180 days extension if                                     GDP                            0.012
                   negotiation is in progress)
26 May             President Trump visits Japan to meet the new                        Total production                               0.019
                   emperor
28 Jun             President Trump visits Japan to attend G20 Summit                                      US imports from Japan (2015)
                                                                                                            Others, 10
                                                                                        Petroleum & Coal , 2                          Chemical,
21 Jul             Upper House Election                                                   Basic metal, 2                               Rubber,
                                                                                             Paper , 2                                Plastic, 20

                             “The agricultural levies are unfair because we             Transport
                             don’t tariff their cars”                                  equipment, 7
                             Trump hoped trade talks would “go quickly” and
                                                                                         Electronic                                       Food & Berverages
                             enable him to sign a deal when he visits Japan in          equipment, 8                                             , 20
                             late May.
                                                                                         Agricultural
                                                                                        and fishing, 11           Machinery &
Source: GTAP, OECD, Bloomberg, Krungsri Research
                                                                                                                 Equipment , 18
                                                                                                                                           Krungsri Research   18
Overall impact of US tariff hike on vehicles will be
  minimal, but sizable impact on activities in auto sector
  Trump has threatened to raise tariffs on Japanese vehicles & parts to 25% because that forms the third-highest share of US imports. Moreover, vehicles
  imported from Japan were mostly final products which generate limited domestic value-add in the US, at only 7.18%. We calculated the impact of a tariff
  hike to 25% (worse case) and 10% (likely case). Our results show the worse case had limited impact on GDP, total production and total exports, reducing
  those by -0.01%, -0.1%, -0.5%, respectively. But sector-wise, production and exports of vehicles & parts would drop more severely, by 7% and 13.5%,
  respectively.
                US automobile & parts imports (2015)                                     Origin of value-add in final demand for US
                                       Tiwan, 0.85                                               automobiles & parts (2015)
                          OTH, 1.91                                                                              Oth, 5.3 ASEAN, 1.3
                                            Sub-Saharan Africa, 1.16
                                                China, 2.44                                                                  Korea, 3.7
                                                      Korea, 6.25                                                               Canada, 4.1
    Canada,                                                                                                                        Mexico,
     25.17                                                                                                                           6.59

                                                          EU28, 18.49
                                                                                                                                        Japan, 7.18
                                                                                                  USA, 52.78
                                                                                                                                       China , 7.37
  Mexico, 24.03
                                                     Japan, 19.25
                                                                                                                            EU28, 11.68
                         Marginal effect of an increase in US auto tariff on variables (% deviate from baseline)
     25% tariff increase           10%                                                    Automotive
                 GDP                  Total production         Total export               production            Automotive export
                                                                                     0
-0.05                       -0.005                    -0.039
                            -0.006                                                  -2                 -3.150
                                                                          -0.230
-0.15                                                -0.084                         -4                                        -6.100
                                                                                    -6                 -3.850
-0.25
                                                                                    -8
-0.35                                                                     -0.300   -10
-0.45                                                                              -12                                        -7.390
-0.55                                                                              -14
  Source: GTAP, OECD, Bloomberg, Krungsri Research

                                                                                                                                            Krungsri Research   19
BOJ strengthens clarification on forward guidance, shifts to
    ‘date-contingent’ from ‘data-dependent’ approach
%
               GDP growth
                                                      %                      Core CPI                                Krungsri Research’s view
1.4                                                   1.7                                                             The BOJ has nudged down GDP growth forecast for 2019
                     Oct' 18
                                                                                                                       and 2020 to 0.8% and 0.9%, respectively. Meanwhile, the
                     Jan' 19
                                                      1.5                                                              first provision of GDP forecast in 2021 is 1.2%.
1.2                  Apr' 19
                                                                                                                      Also, the BOJ cut its inflation outlook for the fourth time.
                                                      1.3                                                              Looking ahead, inflation is projected at 1.6%, suggesting it
1.0                                                                                                                    will not meet the 2% target through 2021.
                                                      1.1
                                                                                                                      While keeping policy rate, BOJ tweaked the wording of its

0.8
                                                      0.9
                                                                                                                       forward guidance. Previously, it pledged to keep rate at
                                                                                                                       current low level for an “extended period” due to concerns
0.6                                                   0.7                                                              about overseas economies and the effect of tax hike set
          2019          2020          2021                          2019            2020         2021                  for October. It added “least through around spring 2020”
                                                                                                                       to its statement, reflecting a change from state-contingent
        Economists’ forecast for policy                     ETF & REIT Purchase over 12 months                         guidance to date guidance. However, the tweaked
                  rate (%)                                                                                             guidance meant little to markets. Economists already
                                                       110                                                       7
0.02                                   0.01                             REIT (bn)                                      forecast BoJ would maintain policy rate until 2020 before
                                                       100
0.00                                                                                                             6     this latest meeting.
                                                          90
                             Median                                                                                   Recently, BOJ’s REIT purchases have slowed significantly.
-0.02                                                     80                                                     5
                                                          70
                                                                                                                       This reflects its concerns about risk of overheating in the
-0.04                         -0.04 -0.05     -0.05                                                              4     property market, in line with our view.
                                                          60                           ETF
-0.06                                                                                  (tn,RHS)                       To support efficient monetary easing, the BOJ expanded
                         -0.08                 -0.06
                                                          50                                                     3
-0.08                                                                                                                  eligible collateral for bank credit (for example, company
                     -0.09                                40               BOJ introduced more
        -0.1
                                                                           flexible approach in                  2     debts which have obtained external credit ratings must be
-0.10                                                     30
                                                                           pace of purchases                           rated ‘BBB’ or higher by an eligible rating agency),
                             Average                      20                                                     1
-0.12                                                                                                                  promote use of the fund-Provisioning Measure and relax
                                                               Jan-15

                                                                           Jan-16

                                                                                     Jan-17

                                                                                              Jan-18

                                                                                                        Jan-19

                                                                                                                       terms and conditions for Securities Lending Facility. The
         2Q19
         3Q19
         4Q19
         1Q20
         2Q20
         3Q20
         4Q20
         1Q21
         2Q21
         3Q21

                                                                                                                       BOJ also introduced ETF lending facility which allows it to
  Source: BOJ, Bloomberg, Krungsri Research                                                                            temporarily lend its ETF holdings to market participants.
                                                                                                                                                                Krungsri Research   20
Thailand: Roaring headwinds
Economic conditions eased in March, pressuring 1Q19 growth
   Private consumption growth slowed for the second consecutive month in March. Spending on non-durable goods reversed to a
    contraction, possibly due to a marked drop in farm income. Other spending categories continued to expand. Private investment
    shrank for the second month. Investment categories registered declines except imports of capital goods.
   On external demand, exports fell more than expected in March as China-bound shipments slumped again. The tourism sector was
    also subdued. Foreign tourist arrivals fell in March. The major drag was inbound tourists from Europe and the Middle East, and to
    a lesser extent, Chinese tourists. Tourist arrivals from India continued to show a promising trend.
1Q19 GDP growth likely below 3%; we are trimming full-year growth forecast
   Given the noticeable slowdown in January-March data, we expect 1Q19 GDP growth to slip below 3% YoY, posing substantial
    downside risk to our full-year forecast of 3.8%. Political uncertainty after the election had affected domestic activity – this is likely
    to persist until a new government is in place, possibly in June. We will trim growth projections after 1Q19 GDP readings are
    released on 21 May.
Inflation was stable in April as easing food inflation offset rising transportation cost
   Headline inflation was steady in April. Food & Beverage inflation eased and snapped a 3-month streak of rise. All sub-indices for
    food subsided, except prices of Vegetables & Fruits which surged driven by the ongoing drought. Energy prices continued to rise.
   Core inflation picked up for the first time in three months. Key driver was CPI for Public Transportation Services which jumped
    because of an increase in bus fares in Bangkok. Coupled with rising energy inflation, these lifted Transportation & Communication
    inflation to a 5-month high. Meanwhile, CPI for other core components were relatively unchanged.
BOT holds rates steady as growth stutters; we do not see a strong case for rates to move in either
direction this year
   As universally anticipated, the Monetary Policy Committee (MPC) has voted unanimously to keep policy rate at 1.75%, citing
    economic growth would be “slower than previously expected” as global and domestic uncertainties “remain high”.
   Intensified global and domestic uncertainties, weaker growth outlook, and muted inflation, will take hikes off the table for the
    next 12 months. Meanwhile, it is not appropriate to raise rates when other central banks in emerging economies have started to
    unwind previous tightening measures. On the other hand, the MPC’s continued concerns over risks in the financial sector means
    it is unlikely to cut rates this year. Hence, we maintain that rates will be stable the rest of the year.

                                                                                                                             Krungsri Research   21
Krungsri Research Forecast

                Krungsri Research Forecast                                                                    2016                       2017    2018         2019F

    GDP growth                                                                    YoY (%)                      3.4                        4.0     4.1           3.8
    Private Consumption Expenditure                                               YoY (%)                      2.9                        3.0     4.6           4.1
    Government Consumption Expenditure                                            YoY (%)                      2.2                        0.1     1.8           2.2
    Private Investment                                                            YoY (%)                      0.6                        2.9     3.9           4.6
    Public Investment                                                             YoY (%)                      9.5                       -1.2     3.3           5.5
    Nominal Exports in USD (f.o.b.) *                                             YoY (%)                      0.1                        9.8     7.2           3.5
    Nominal Imports in USD (f.o.b.)                                               YoY (%)                     -5.1                       13.2    14.3           6.0
    Current Account Balance                                                       USD, bn                     48.2                       50.2    35.2           30.7
    Tourist Arrivals                                                              YoY (%)                      8.9                        8.8     7.5           7.5
    Headline Inflation                                                            YoY (%)                      0.2                        0.7     1.1           1.1
    Core Inflation                                                                YoY (%)                      0.7                        0.6     0.7           0.9
    Exchange rate (end of period)                                                THB/USD                     35.25                       32.66   32.42         31.00
    Policy Interest rate (end of period)                                             (%)                      1.50                       1.50    1.75           1.75
    Dubai crude price - period average                                            USD/bbl                     41.5                       53.1    69.3           66.5
  * Our 2019 growth forecast for customs-based exports is 3.7%

Source: NESDC, Bank of Thailand (BOT), Ministry of Commerce (MOC), Ministry of Tourism and Sports (MOTS), Bloomberg, Krungsri Research

                                                                                                                                                         Krungsri Research   22
Domestic demand is losing momentum as mounting
political uncertainty weighs on sentiment
 % YoY                                           Private spending indicators                                                                                                                         Private spending: categories
  8.0                                                                                                                                    Consumption                         Private spending indicators                       2018                                     2019
                                                                                                                                                                                      (% YoY) *                   J    F M A M J J               A   S      O N D   J     F M
  6.0                                                                                                                                                                    Private consumption
                                                                                                                                                                          Non-durables
  4.0                                                                                                                                                                     Semi-durables
                                                                                                                                                                          Durables
  2.0                                                                                                                                                                     Services
                                                                                                                                                                          Non-residents expenditure
  0.0                                                                                                                                                                    Private investment
                                                                                                                                                                          Construction area permitted
 -2.0                                                                                                                          Investment                                 Construction material sales
                                                                                                                                                                          Imports of capital goods
 -4.0                                                                                                                                                                     Machinery sales
          Jan-16

                                   Jul-16

                                                               Jan-17

                                                                                        Jul-17

                                                                                                             Jan-18

                                                                                                                                Jul-18

                                                                                                                                                       Jan-19
                      Apr-16

                                                 Oct-16

                                                                            Apr-17

                                                                                                   Oct-17

                                                                                                                      Apr-18

                                                                                                                                           Oct-18

                                                                                                                                                                Apr-19
                                                                                                                                                                          Newly registered vehicles
                                                                                                                                                                         * Green > 0%, Red < 0% / Darker green (red) indicates stronger (weaker) momentum

 Index                                                    Sentiment indicators                                                                               Index         Krungsri Research’s view
 84                                                                                  Consumer confidence (LHS)                                                  54            Private consumption growth slowed for the second
 82                                                                                                                                                             53             consecutive month, to +2.57% YoY in March (vs +3.51% in
                                                                                                                                                                               February). Spending on non-durable goods reversed to a
 80                                                                                                                                                             52             contraction (-0.77% YoY from +2.65% in February) possibly
 78                                                                                                                                                             51             due to a marked drop in farm income (-4.0% YoY). Other
 76                                                                                                                                                             50             spending categories continued to expand. Private investment
                                                                                                                                                                               shrank for the second month, by 2.12% YoY. All investment
 74                                                                                                     Business sentiment                                      49             categories registered declines except imports of capital goods
 72                                                                                                                                                             48             which jumped 8.45% YoY after falling 5.48% in February.
 70                                                                                                                                                             47            Political uncertainty after the election had affected private
        Jan-16

                               Jul-16

                                                      Jan-17

                                                                               Jul-17

                                                                                                    Jan-18

                                                                                                                      Jul-18

                                                                                                                                         Jan-19
                   Apr-16

                                            Oct-16

                                                                   Apr-17

                                                                                          Oct-17

                                                                                                             Apr-18

                                                                                                                               Oct-18

                                                                                                                                                    Apr-19

                                                                                                                                                                               sector sentiment and hence, domestic activity – this is likely
                                                                                                                                                                               to persist until a new government is in place, possibly in June.

Source: BOT, University of the Thai Chamber of Commerce (UTCC), Krungsri Research

                                                                                                                                                                                                                                                         Krungsri Research   23
Less favourable household income conditions will
pressure domestic demand in 2Q19
Farm income and non-farm wage data are highly seasonal, so it is best to focus on 12-month moving average data to gauge the underlying trend.
On this basis, farm income growth edged down to +1.05% YoY in March (from +1.55% in February), driven by falling prices and slower output
growth (especially rice). Non-farm wage growth dropped to +1.46% YoY from +1.52% previously, dragged by sectors related to exports and
tourism (Manufacturing, Accommodation and Food Services). The less favourable income conditions could pressure domestic demand growth in
2Q19, which is consistent with our expectation that economic growth will be stuck at around 3%.
 % YoY                               Farm income (12mma)                                                       Farm income growth         Weight                  2018                                   2019
                                                                                                                (% YoY, 12mma)*                       J   F M A M J J              A S O N D         J     F M
  15                                                                                                          Rubber                        16.27%
                                                                                                              White rice                     9.97%
   10                                                                                                         Mango                          7.66%
                                                                                                              Swine                          7.27%
    5                                                                                                         Hommali                        7.03%
                                                                                                              Sugarcane                      7.03%
                                                                                                              Fowl                           6.57%
    0
                                                                                                              Glutinous rice                 6.41%
                                                                                                              Cassava                        5.40%
   -5                                                                                                         Shrimp                         3.97%
        Mar-17

          Jul-17

        Mar-18

          Jul-18
         Jan-17
        Feb-17

        May-17
        Jun-17
        Aug-17
        Sep-17
        Nov-17
        Dec-17
         Jan-18
        Feb-18

        May-18
        Jun-18
        Aug-18
        Sep-18
        Nov-18
        Dec-18
         Jan-19
        Feb-19
        Mar-19
        Apr-17

        Oct-17

        Apr-18

        Oct-18

        Apr-19
                                                                                                              Oil palm                       3.68%
                                                                                                              Maize                          3.02%
                                                                                                             * Green > 0%, Red < 0% / Darker green (red) indicates stronger (weaker) momentum

 % YoY                             Non-farm wage (12mma)                                                         Average monthly wage                Share               2018           2019
 2.0                                                                                                                (% YoY, 12mma)*                            J F M A M J J A S O N D J F M
                                                                                                            Wholesale & retail trade                 16.70%
  1.5                                                                                                       Manufacturing                            16.51%
                                                                                                            Accommodation & food service              7.55%
  1.0                                                                                                       Construction                              5.55%
                                                                                                            Transportation & storage                  3.32%
  0.5
                                                                                                            Financial & insurance                     1.39%
  0.0                                                                                                       Information & communication               0.56%
                                                                                                            Real estate                               0.51%
 -0.5                                                                                                       Electricity, gas, steam                   0.31%
        Mar-17

          Jul-17

        Mar-18

          Jul-18
         Jan-17
        Feb-17

        May-17
        Jun-17
        Aug-17
        Sep-17
        Nov-17
        Dec-17
         Jan-18
        Feb-18

        May-18
        Jun-18
        Aug-18
        Sep-18
        Nov-18
        Dec-18
         Jan-19
        Feb-19
        Mar-19
        Apr-17

        Oct-17

        Apr-18

        Oct-18

        Apr-19

                                                                                                            Water supply                              0.23%
                                                                                                            Mining & quarrying                        0.18%
                                                                                                            * Green > 0%, Red < 0% / Darker green (red) indicates stronger (weaker) momentum

Source: BOT, Office of Agricultural Economics (OAE), National Statistical Office (NSO), Krungsri Research

                                                                                                                                                                                            Krungsri Research    24
Fresh stimulus to shore up growth during a Hung
    Parliament, but we see modest impact from tax perk
                                    State Welfare Card Scheme (Budget approved: THB13.2bn)
                                    Services or products through EDC App or cash withdraw from ATM

                    1,160,000                                      4,100,000                              2,700,000                      14,500,000
                    Disabled persons:                              farmers:                               parents:                       low income:
                     THB1.16bn                                     THB4.1bn                               THB1.35bn                      THB6.6bn

      Additional allowance for all                    To purchase fertilizer,             To purchase school uniforms,      Increase ceiling of welfare
       disabled persons of THB200                       pesticide, and other farm            educational material (on top       scheme to purchase
       per month for five months                        input.                               of current free education          necessary goods.
       (May – Sep 19).                                 One-time cash aid of                 scheme).                          Additional THB200-300 aid,
                                                        THB1,000 per person                 One-time cash aid of THB500        to take total to THB500 per
                                                                                             per child.                         month for two months.

Uniforms, sports               Otop products             Books and e-           Domestic tourism       Houses or condos     Double
equipment,                     (30 Apr – 30              books (1 Jan –         Main cities (up to     worth up to 5        deduction for
textbooks for                  Jun 19)                   31 Dec 19)             THB15,000 and          million baht (Apr    investment at
students                                                                        second-tier            30 – 31 Dec)         point of sale, e-
                                                                                provinces (up to                            tax
Up to THB15,000              Up to THB15,000            Up to THB15,000         THB20,000)             Up to THB200k

                                            Tax measures (Budget approved: THB8.62bn)
    Source: Cabinet resolution, Krungsri Research

                                                                                                                                                Krungsri Research   25
Exports slump in March after temporary tailwinds fade,
pressuring full-year export growth forecast
   Strong growth        Exports by major destination (% YoY)
   Modest/Moderate                                                                                                       Krungsri Research’s view
    Contraction
                                                                 Jan-19           Feb-19               Mar-19
                                                                                                                         Exports slumped in March after temporary tailwinds fade
                  8.3                                     7.4
        5.9             5.0                                                                                                 Merchandise exports tumbled 4.9% YoY after surging 5.9% in
                                                   0.9                                   2.8          0.6          0.3       February, taking YTD growth down by 1.6% YoY. March reading was
                                                                                                                             weaker than our and market expectations (-0.6% and -3.3%,
                                                                        -1.5                                -0.4             respectively). Shipments to major destinations, especially China and
                          -1.4             -2.8
          -4.9                      -3.7                                                                                     ASEAN5, saw steeper declines, adding to evidence the global
 -5.7
                                                                           -9.0 -7.4                                         slowdown is intensifying. Shipments to the US fell for the first time in
                                       -10.6          -11.4                                                                  eight months, probably because the benefits of trade diversion
                                                                -16.7                      -15.6                             triggered by the US-China trade dispute have waned as the two
                                                                                                                             countries are close to signing a trade deal.
   Total            *US               EU27          Japan          China ASEAN5 CLMV                                        Electronics exports continued to decline as the sector is feeling the
  exports         (11.1%)            (9.9%)         (9.9%)        (12.0%) (15.5%) (11.6%)                                    effects of both cyclical and structural headwinds (US tariff hike; SSD is
                                                                                                                             gradually replacing HDD). Exports of oil-related products continued to
* Exports to the US exclude arms and military weapons                                                                        drop. Meanwhile, exports of rubber products continued to surge due
                                                                                                                             to accelerating shipments before USMCA takes effect. Motor vehicle
                              Exports by major product (% YoY)                                                               and parts exports showed promising growth driven by rising demand
                                                                 Jan-19           Feb-19               Mar-19                from Vietnam. Exports of frozen chicken remained robust, supported
                                                                                                                             by rising demand from Japan and the EU (after granting larger import
                                                                                                               14.8          quota), which pushed up exports of processed food.
                              9.7                                                                            9.0
              5.6 5.2 6.7                                  5.2                                                           Weak export performance YTD is pressuring full-year export and
                                                                        1.5                                              GDP growth forecasts
                                                                 -1.3      -0.2                       -0.8                  The slump in March data proved us correct – we had said the surprise
 -2.0                                                                                    -3.4
        -5.6                                                                      -5.8                                       surge in February export data was driven by temporary factors and the
                                    -8.6-10.2      -9.6                                        -7.2
                                                                                                                             underlying trend for exports remained weak. Looking ahead, we
                                                       -15.3                                                                 expect Thai exports to recover the rest of the year, notably in 2H19.
                                           -17.1
                                                                                                                             Signs of a global recovery are piling up as sentiment has improved
 Agricultural Processed Electronics Automobile Electrical                           Plastic             Rubber               substantially following significant progress in US-China trade
  products       foods    HDD, IC     & parts appliances                           products            products              negotiations and a remarkable dovish turn by central banks around
   (9.7%)       (8.4%)    (15.5%)    (14.5%)    (9.9%)                              (5.4%)              (4.3%)               the world. However, the weak YTD performance and expected gradual
                                                                                                                             recovery could pose downside risks to our 2019 growth forecasts for
Note: ( ) share in 2018                                                                                                      customs-based exports (+3.7%) and GDP (+3.8%).
Source: MOC, Krungsri Research

                                                                                                                                                                                  Krungsri Research   26
Opportunities for Thai swine exports following ASF
      outbreaks overseas
 Thailand is at high risk of a African Swine Fever (ASF) outbreak after cases were reported in many areas in China, Vietnam and Cambodia. On April 9, the
 cabinet approved THB148.54m budget to implement measures to prevent and prepare for an outbreak; it is that the top of the national agenda to
 strengthen disease prevention strategies and increase exports of pork and related products to countries that are experiencing shortages.

  ASF outbreaks and backyard pig distribution                                                                                 Negative Impact on Thailand
                                                                                         Hazard : ASF is a fatal                         (Broad Infection and
                                                                                                                                           Severe Damage )
                                                                                         animal disease that
                                                                                         affects pigs and wild         Swine          If there is an ASF outbreak in Thailand, the Department
                                                                                         boars with up to 100%         Industry       of Livestock Development, Ministry of Agriculture and
                                                                                         mortality rate                               Cooperatives estimate damage will be as follows:
                                                                                   Transboundary : can be                             - Swine industry:
                                                                                   spread by live or dead pigs,                           ➢ 30% output loss: THB21.17bn
                                                                                   pork products, feed or                                 ➢ 50% output loss: THB35.28bn
                                                                                   contaminated objects                                   ➢ 80% output loss: THB56.45bn
                                                                                                                                          ➢ 100% output loss: THB70.56bn
                                                                                   Damage : serious production                        - Exports of swine and related products: THB50bn
                                                                                   and economic losses.
                                                                                                                       Supply         - Animal food industry: THB40bn
                                                                                   Affected countries :                Chain          - Swine medical supplies industry: THB2.1bn
                                                                                   - China (31 provinces, 1.02m        Industry       - Wholesale & retail and other supply chains
                                                                Outbreak
                                                                Point                pigs culled)
                                                                                                                       Government     - Budget for disease prevention and control: THB15.9bn
                                                                                   - Mongolia (6 provinces, 3,115
                                                                                                                       Expense        - Other damages (such as cost of professional
                                                                                     pigs culled)
USD, m               Thai swine exports                        USD, th             - Vietnam (24 provinces,                           rehabilitation and well-being of farmers): THB19.6bn
                                                                                     89,600 pigs culled)
3.0                                                                    60                                              Krungsri Research’s view
                                                                                   - Cambodia (1 province, 2,400
                    2016        2017        2018
2.5                                                                    50            pigs culled)                         Because the ASF outbreak is under control in Thailand, the
                                1Q18        1Q19                                   New outbreaks reported by               Kingdom has enjoyed rising demand from countries that are
2.0                                                                    40          the FAO during 12 - 25 April            suffering from supply shortage, especially Hong Kong and
                                                                                   2019, in Ratanakiri province in         Cambodia. We expect the situation to be contained and
1.5                                                                    30          Cambodia.                               Thailand should still benefit from rising exports and higher pork
                                                                                                                           prices. Pork prices are expected to rise to THB70-80 per kg
1.0                                                                    20                                                  (from THB60-70 normally), which would generate THB47bn
                                                                                   Thailand : In April, the cabinet        revenue annually for farmers.
0.5                                                                    10          approved Bt148.54m budget to
                                                                                   implement measures to                  If an outbreak occurs in Thailand, which is not our base
0.0                                                                    0           prevent an ASF outbreak                 assumption, the probability of damage would be slim (only 10-
         Hong Kong           Myanmar          Cambodia (RHS)                                                               20%) because most products come from large producers which
                                                                                                                           farms are provided with the EVAP system (high security).
  Source: FAO, OAE, Department of Livestock Development, Ministry of Agriculture and Cooperatives, Krungsri Research

                                                                                                                                                                       Krungsri Research    27
Murky export outlook driven by shrinking imports of raw
materials and continued destocking
   Strong growth            Imports by major destination (% YoY)
   Modest/Moderate
                                                                                    Jan-19             Feb-19                Mar-19        Krungsri Research’s view
    Contraction
                                                                                                                                              Imports rebounded in most categories, except raw materials.
                                17.8                                                                                                           Headline imports dipped 7.6% YoY in March. However, core imports
 14.0
                                                                         8.5
                                                                                                                                               (excluding gold, aircraft, ship, arms) shrank only 1.3% YoY. Raw
                          4.8                                  4.7                                                                             material imports (excluding gold) continued to dip, suggesting the
                                      1.5 2.4                                                   4.0             4.4 4.8 4.4 3.5
                                                                                                                                               near-term export outlook is dim. Imports of core capital goods and
                                                                                                                                               consumer goods rebounded swiftly, while vehicle imports continued to
                                                                                                                                               rise, suggesting domestic demand is still rising. Meanwhile, trade
                                                      -5.1                                             -7.4                                    surplus narrowed sharply to USD2.01bn from USD4.03bn in February,
                                                                                   -8.0-8.6
      -10.0-7.6                                                                                                                                after the temporary effects of weapon exports waned.
                                                                                                                                              Industrial output continued to shrink. The Manufacturing Production
    Total                    Fuel                 *Capital                **Raw Consumer                                 Vehicles              Index slipped 2.54% YoY in March (vs -1.26% in February), following
   imports                lubricants               goods                 materials  goods                                 (5.9%)               overall weakness in both domestic and external demand. In line with
                           (16.9%)                (24.2%)                (35.6%)   (11.1%)                                                     this, seasonally-adjusted Capacity Utilization dropped by 0.5ppt to
Note: ( ) share in 2018             * Capital goods exclude aircraft, ship                    ** Raw materials exclude gold                    67.8%, the lowest since October 2017.

 % sa                       Manufacturing production indicators                                                                   % YoY     Manufacturing Production Weight           2018           2019
 72                       Capacity utilization (LHS)                                                                                8.0               (% YoY) *             J F M A M J J A S O N D J F M
                          Industrial production                                                                                            All industry              100.0%
 70                                                                                                                                 6.0
                                                                                                                                           Food & Beverages          19.9%
 68                                                                                                                                 4.0    Automotive                13.9%
                                                                                                                                           Petroleum                  9.6%
 66                                                                                                                                 2.0    Chemicals                  9.2%
                                                                                                                                           Rubbers & Plastics         8.9%
 64                                                                                                                                 0.0
                                                                                                                                           Cement & Construction      5.5%
 62                                                                                                                                 -2.0   IC & Semiconductors        5.5%
                                                                                                                                           Electrical Appliances      3.8%
 60                                                                                                                                 -4.0   Textiles & Apparels        3.5%
                           Jul-16

                                                                Jul-17

                                                                                                       Jul-18
        Jan-16

                                             Jan-17

                                                                                     Jan-18

                                                                                                                         Jan-19
                 Apr-16

                                    Oct-16

                                                      Apr-17

                                                                          Oct-17

                                                                                              Apr-18

                                                                                                                Oct-18

                                                                                                                                           HDD                        3.4%
                                                                                                                                           * Green > 0%, Red < 0% / Darker green (red) indicates stronger (weaker) momentum

Source: MOC, Office of Industrial Economics (OIE), Krungsri Research

                                                                                                                                                                                                               Krungsri Research   28
Tourism sector was also subdued but extending visa-on-
arrival measure triggers hopes of a recovery
                                        Foreign tourist arrivals                                                                                 Krungsri Research’s view
4.0                                                                                                                                   25            Foreign tourist arrivals fell 0.7% YoY to 3.47m in March, while
                     Million (LHS)                              % YoY
3.5                                                                                                                                   20             there was a larger drop in tourism receipts (-1.3% YoY to
                                                                                                                                                     THB184.45bn). The major drag was inbound tourists from
3.0                                                                                                                                   15             Europe, Australia and the Middle East, and to a lesser extent,
2.5                                                                                                                                   10             Chinese tourists. Tourist arrivals from India continued to show
2.0                                                                                                                                   5
                                                                                                                                                     a promising trend, rising 34.7% YoY to 163K.
                                                                                                                                                    Meanwhile, the government has extended fee waiver for visa-
1.5                                                                                                                                   0
                                                                                                                                                     on-arrival (VOA) by six months to end of October. Based on
1.0                                                                                                                                   -5             past experience, this measure should be successful in
0.5                                                                                                                                   -10            attracting globetrotters, especially those from countries
                                                                                                                                                     where visa application process takes time and there are
                         Jul-16

                                                                 Jul-17

                                                                                                        Jul-18
       Jan-16

                                            Jan-17

                                                                                     Jan-18

                                                                                                                           Jan-19
                Apr-16

                                   Oct-16

                                                       Apr-17

                                                                           Oct-17

                                                                                              Apr-18

                                                                                                                  Oct-18
                                                                                                                                                     logistical difficulties in reaching embassies, such as in India.

      Strong growth                                                                                              Foreign tourist arrivals (% YoY)
      Modest/Moderate                                                                                                                                                                   Jan-19        Feb-19            Mar-19
                                                                                                                                                               34.7
      Contraction                                                                                                                                24.9
                                        13.7                                                           15.3                                             14.1
   10.3                                                                                       9.3                                                                                       6.5 3.8 2.9
                                  4.3                4.7                                                                            6.1
                                                                          0.3                                     0.4      1.2                                        1.2

                   -1.9                                         -2.6                                                                      -0.4                              -1.9 -1.3                 -1.5 -2.1                 -4.1
                                                                                    -7.8
        -12.3                                                                                                                                                                                                     -14.1 -13.7
                                                                                                                                                                                                                                       -22.3

       China                       ASEAN5                         Europe*                     North Asia**                       CLMV                 India             Russia               US        Australia         Middle East
      (27.5%)                      (16.3%)                        (13.8%)                       (13.5%)                         (10.5%)              (4.2%)             (3.8%)             (2.9%)       (2.1%)             (1.9%)

Note: ( ) share in 2018                              * Europe excludes Russia ** North Asia excludes China
Source: MOTS, Krungsri Research

                                                                                                                                                                                                                     Krungsri Research         29
Inflation was stable in April as easing food inflation offset
rising transportation cost
  %                                                                                    Consumer Price Index: major categories
                                   CPI Inflation
 2.0
                                                                             Consumer Price Index                      Weight                2018            2019
 1.5                                                                                (% YoY)*                                       J F M A M J J A S O N D J F M A
                      Core inflation                                   Headline CPI                                   100.00%
 1.0                                                                    Food & beverages                               36.13%
 0.5                                                                    Apparel & footwear                              2.88%
                                                                        Housing & furnishing                           23.25%
 0.0                                                                    Medical & personal care                         6.22%
                                                                        Transportation & communication                 24.02%
-0.5                                                                    Recreation & education                          6.13%
                            Headline inflation                          Tobacco & alcoholic beverages                   1.38%
-1.0
                                                                        Prepared food                                  17.02%
-1.5                                                                    Raw food                                       15.69%
        Jan-15

         Jul-15

        Jan-16

         Jul-16

        Jan-17

         Jul-17

        Jan-18

         Jul-18

        Jan-19
        Apr-15

        Oct-15

        Apr-16

        Oct-16

        Apr-17

        Oct-17

        Apr-18

        Oct-18

        Apr-19
                                                                        Energy                                         11.75%
                                                                       Core CPI                                        72.56%
                                                                       * Green > 0%, Red < 0% / Darker green (red) indicates stronger (weaker) momentum

  Krungsri Research’s view
      Headline inflation was steady at 1.23% in April (vs 1.24% in March), in line with our expectation (1.26%) and median consensus
       estimate (1.20%). Food & Beverage inflation edged down to 2.20% YoY (vs 2.38% in March), snapping a 3-month streak of rise. All
       sub-indices for food subsided, except prices of Vegetables & Fruits which surged 4.26% YoY (the largest rise since January 2017)
       driven by the ongoing drought. Energy prices continued to rise by 2.33% YoY (vs 2.07% in March).
      Core inflation (excluding volatile Raw Food and Energy components) picked up for the first time in three months to 0.61% (vs
       0.58% in March), in line with our and market expectations. Key driver was CPI for Public Transportation Services which jumped
       1.91% YoY (vs +0.29% in March) because of an increase in bus fares in Bangkok. Coupled with rising energy inflation, these lifted
       Transportation & Communication inflation to a 5-month high of +1.06% YoY (vs +0.79% in March). Meanwhile, CPI for other core
       components were relatively unchanged.
      Looking ahead, we expect inflation to rise gradually supported by growing consumption and recent government measures to
       nurture economic growth in mid-2019. The government has allocated a total budget of THB21.8bn, comprising THB13.1bn to help
       Welfare Card holders and THB8.6bn in personal income tax deductions, to support domestic tourism and household consumption.
       Hence, we are keeping our forecast for 2019 headline inflation at 1.1%.

Source: MOC, Krungsri Research

                                                                                                                                                          Krungsri Research   30
BOT holds rates steady as growth stutters; we do not see a
  strong case for rates to move in either direction this year
# Votes                MPC policy rate decisions and voting results                                                             %         Krungsri Research’s view
  8                                                                                                                             2.00         As universally anticipated, the BOT’s Monetary Policy Committee (MPC)
                                                                                                                                              has voted unanimously to keep policy rate at 1.75%, citing economic
  6                                                                                                                                           growth would be “slower than previously expected” as global and domestic
  4                                                                                                                             1.75          uncertainties “remain high”. MPC minutes will be published on 22 May.
                                                                                                                                             MPC sees weaker growth outlook and inflation running close to lower
  2                                                                                                                                           bound of target range. The accompanying statement remains dovish,
                                                                                                                                              noting economic growth would be “softer than previously expected”.
  0                                                                                                                             1.50          Descriptions for merchandise exports, investment, and public spending
                            Votes for Action                                                                                                  have been downgraded. The statement kept the characterization of
 -2
                            Votes Against Action                                                                                              household consumption at “continued expanding” but was more cautious
 -4                         Policy rate (RHS)                                                                                   1.25          on job creations, saying employment in the construction and export-
             29-Mar-17
            24-May-17

             28-Mar-18

             12-Dec-18

             20-Mar-19
              8-May-19
               8-Feb-17

                5-Jul-17

            *20-Dec-17
             14-Feb-18

           *16-May-18
            *20-Jun-18
              8-Aug-18
             19-Sep-18
           *16-Aug-17
            *27-Sep-17

             *6-Feb-19
              8-Nov-17

             14-Nov-18
                                                                                                                                              oriented manufacturing sectors showed “signs of moderation”. Inflation
Meeting

                                                                                                                                              assessment was “largely unchanged” as rising energy inflation offset a
 date

                                                                                                                                              muted increase in food inflation. Given this, inflation was projected to be
                                                                                                                                              “around” the lower bound of target range.
                            Note: * At least one MPC member was absent from the meeting                                                      MPC signals it would step up macroprudential measures. On financial
  %                                                                                                                                           instability risks, the committee pointed that “auto-related loans” had
                                                Policy interest rates                                                                         largely contributed to the rising household debt, which warrants closer
 7.0         India
                                                                                                                                              monitoring, on top of the frequently mentioned “saving cooperatives” and
 6.0         Indonesia                                                                                                                        “the real estate sector”. To address these risks, the committee reiterated
                                                                                                                                              “targeted” micro/macroprudential measures, while placing greater
 5.0                                                                                                                                          emphasis on “debt serviceability of borrowers”.
             Philippines
 4.0                                                                                                                                         We do not see a strong case for MPC to cut or raise rates this year. The
                                                                                                                                              MPC retained its “state-contingent guidance” but the guidance is less
 3.0                                                                                                                                          substantive than before. That said, the committee would like to have
             Malaysia
 2.0                                                                                                                                          maximum flexibility to move in either direction. Intensified by global and
                                                                                                                                              domestic uncertainties, weaker growth outlook and muted inflation will
 1.0         South Korea                                                                                                                      take hikes off the table for the next 12 months. Meanwhile, it is not
                                                                                                                                              appropriate to raise rates when other central banks in emerging
 0.0
                                                                                                                                              economies have started to unwind previous tightening measures. On the
          Jan-16

                             Jul-16

                                               Jan-17

                                                                 Jul-17

                                                                                   Jan-18

                                                                                                     Jul-18

                                                                                                                       Jan-19
                   Apr-16

                                      Oct-16

                                                        Apr-17

                                                                          Oct-17

                                                                                            Apr-18

                                                                                                              Oct-18

                                                                                                                                 Apr-19

                                                                                                                                              other hand, the MPC’s continued concerns over risks in the financial sector
                                                                                                                                              means it is unlikely to cut rates this year. Hence, we maintain that rates
  Source: BOT, Krungsri Research
                                                                                                                                              will be stable the rest of the year.

                                                                                                                                                                                                      Krungsri Research   31
You can also read