Research on the Environment, Health, Consumer Behaviour and the Economy: ESRI Environment Research Programme 2018-2020
←
→
Page content transcription
If your browser does not render page correctly, please read the page content below

Report No.358

           Research on the Environment, Health,
     Consumer Behaviour and the Economy: ESRI
    Environment Research Programme 2018-2020
      Editor: Anne Nolan. Authors: Achim Ahrens, Peter Barlow, Brian Broderick, Philip Carthy, Aoife Donnelly, Tom
Gillespie, Martina Hennessy, Ronan Lyons, Seán Lyons, Pete Lunn, Ciarán Mac Domhnaill, Finn McLaughlin, Stefano
       Meneto, Frank Moriarty, Owen Naughton, Anne Nolan, Aonghus O´Domhnaill, Margaret O’Mahony, Deirdre
                               Robertson, Iulia Siedschlag, Shane Timmons, Manuel Tong Koecklin and Weijie Yan

       www.epa.ie
ENVIRONMENTAL PROTECTION AGENCY                                     Monitoring, Analysing and Reporting on the
The Environmental Protection Agency (EPA) is responsible for        Environment
protecting and improving the environment as a valuable asset        • Monitoring air quality and implementing the EU Clean Air for
for the people of Ireland. We are committed to protecting people      Europe (CAFÉ) Directive.
and the environment from the harmful effects of radiation and
                                                                    • Independent reporting to inform decision making by national
pollution.
                                                                      and local government (e.g. periodic reporting on the State of
                                                                      Ireland’s Environment and Indicator Reports).
The work of the EPA can be
divided into three main areas:                                      Regulating Ireland’s Greenhouse Gas Emissions
                                                                    • Preparing Ireland’s greenhouse gas inventories and projections.
Regulation: We implement effective regulation and environmental     • Implementing the Emissions Trading Directive, for over 100 of
compliance systems to deliver good environmental outcomes and         the largest producers of carbon dioxide in Ireland.
target those who don’t comply.

Knowledge: We provide high quality, targeted and timely             Environmental Research and Development
environmental data, information and assessment to inform            • Funding environmental research to identify pressures, inform
decision making at all levels.                                        policy and provide solutions in the areas of climate, water and
                                                                      sustainability.
Advocacy: We work with others to advocate for a clean,
productive and well protected environment and for sustainable       Strategic Environmental Assessment
environmental behaviour.                                            • Assessing the impact of proposed plans and programmes on the
                                                                      Irish environment (e.g. major development plans).
Our Responsibilities
                                                                    Radiological Protection
Licensing                                                           • Monitoring radiation levels, assessing exposure of people in
We regulate the following activities so that they do not endanger     Ireland to ionising radiation.
human health or harm the environment:                               • Assisting in developing national plans for emergencies arising
• waste facilities (e.g. landfills, incinerators, waste transfer      from nuclear accidents.
  stations);                                                        • Monitoring developments abroad relating to nuclear
• large scale industrial activities (e.g. pharmaceutical, cement      installations and radiological safety.
  manufacturing, power plants);                                     • Providing, or overseeing the provision of, specialist radiation
• intensive agriculture (e.g. pigs, poultry);                         protection services.
• the contained use and controlled release of Genetically
  Modified Organisms (GMOs);                                        Guidance, Accessible Information and Education
• sources of ionising radiation (e.g. x-ray and radiotherapy        • Providing advice and guidance to industry and the public on
  equipment, industrial sources);                                     environmental and radiological protection topics.
• large petrol storage facilities;                                  • Providing timely and easily accessible environmental
• waste water discharges;                                             information to encourage public participation in environmental
• dumping at sea activities.                                          decision-making (e.g. My Local Environment, Radon Maps).
                                                                    • Advising Government on matters relating to radiological safety
National Environmental Enforcement                                    and emergency response.
• Conducting an annual programme of audits and inspections of       • Developing a National Hazardous Waste Management Plan to
  EPA licensed facilities.                                            prevent and manage hazardous waste.
• Overseeing local authorities’ environmental protection
  responsibilities.                                                 Awareness Raising and Behavioural Change
• Supervising the supply of drinking water by public water          • Generating greater environmental awareness and influencing
  suppliers.                                                          positive behavioural change by supporting businesses,
• Working with local authorities and other agencies to tackle         communities and householders to become more resource
  environmental crime by co-ordinating a national enforcement         efficient.
  network, targeting offenders and overseeing remediation.          • Promoting radon testing in homes and workplaces and
• Enforcing Regulations such as Waste Electrical and Electronic       encouraging remediation where necessary.
  Equipment (WEEE), Restriction of Hazardous Substances
  (RoHS) and substances that deplete the ozone layer.               Management and structure of the EPA
• Prosecuting those who flout environmental law and damage the      The EPA is managed by a full time Board, consisting of a Director
  environment.                                                      General and five Directors. The work is carried out across five
                                                                    Offices:
                                                                    • Office of Environmental Sustainability
Water Management
• Monitoring and reporting on the quality of rivers, lakes,         • Office of Environmental Enforcement
  transitional and coastal waters of Ireland and groundwaters;      • Office of Evidence and Assessment
  measuring water levels and river flows.                           • Office of Radiation Protection and Environmental Monitoring
• National coordination and oversight of the Water Framework        • Office of Communications and Corporate Services
  Directive.                                                        The EPA is assisted by an Advisory Committee of twelve members
• Monitoring and reporting on Bathing Water Quality.                who meet regularly to discuss issues of concern and provide
                                                                    advice to the Board.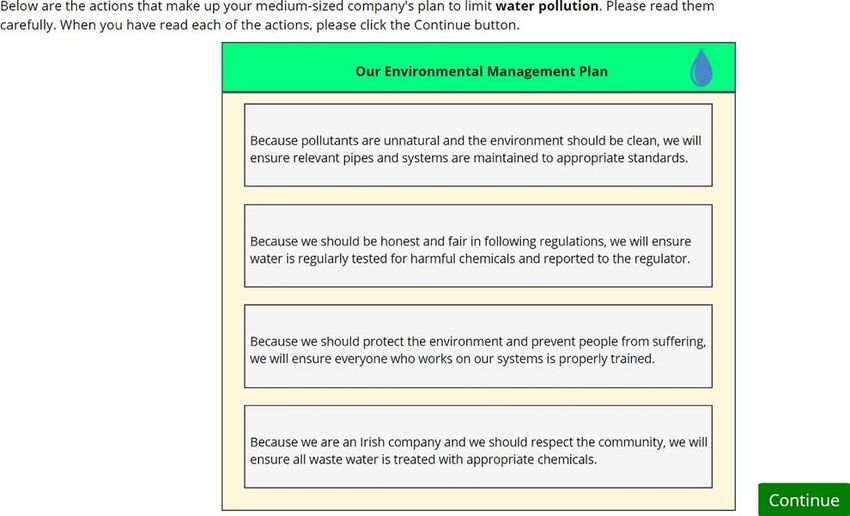
EPA RESEARCH PROGRAMME 2014–2020

Research on the Environment, Health, Consumer
Behaviour and the Economy: ESRI Environment
       Research Programme 2018–2020

                             (2019-HW-MS-15)

                           EPA Research Report

                     Prepared for the Environmental Protection Agency

                                           by

                          Economic and Social Research Institute

                                         Editor:

                                       Anne Nolan

                                        Authors:

Achim Ahrens, Peter Barlow, Brian Broderick, Philip Carthy, Aoife Donnelly, Tom Gillespie,
    Martina Hennessy, Ronan Lyons, Seán Lyons, Pete Lunn, Ciarán Mac Domhnaill,
    Finn McLaughlin, Stefano Meneto, Frank Moriarty, Owen Naughton, Anne Nolan,
    Aonghus O´Domhnaill, Margaret O’Mahony, Deirdre Robertson, Iulia Siedschlag,
                Shane Timmons, Manuel Tong Koecklin and Weijie Yan

                    ENVIRONMENTAL PROTECTION AGENCY
                     An Ghníomhaireacht um Chaomhnú Comhshaoil
                   PO Box 3000, Johnstown Castle, Co. Wexford, Ireland

                    Telephone: +353 53 916 0600 Fax: +353 53 916 0699
                          Email: info@epa.ie Website: www.epa.ie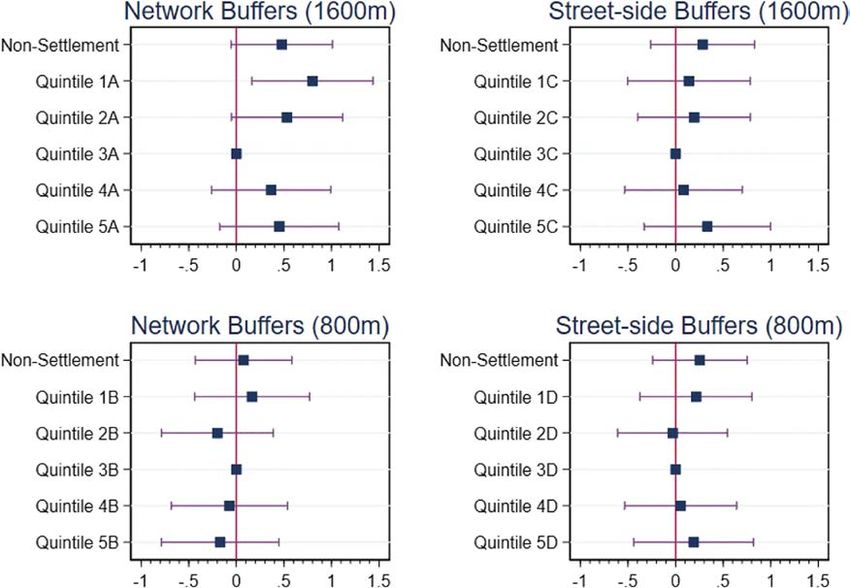
© Environmental Protection Agency 2020

                                 ACKNOWLEDGEMENTS
This report is published as part of the EPA Research Programme 2014–2020. The EPA Research
Programme is a Government of Ireland initiative funded by the Department of the Environment,
Climate and Communications. It is administered by the Environmental Protection Agency, which
has the statutory function of co-ordinating and promoting environmental research.

The authors would like to acknowledge the members of the project steering committee, namely Shane
Colgan, Jonathan Derham, Matthew Crowe and Micheál Lehane from the Environmental Protection
Agency and John Curtis from the Economic and Social Research Institute; as well as Rachel Clarke,
Aisling O’Connor and Alice Wemaere (EPA Research) for their efficient management of the project.

                                        DISCLAIMER
Although every effort has been made to ensure the accuracy of the material contained in this
publication, complete accuracy cannot be guaranteed. The Environmental Protection Agency, the
authors and the steering committee members do not accept any responsibility whatsoever for loss
or damage occasioned, or claimed to have been occasioned, in part or in full, as a consequence of
any person acting, or refraining from acting, as a result of a matter contained in this publication.
All or part of this publication may be reproduced without further permission, provided the source is
acknowledged.

This report is based on research carried out/data from July 2018 to June 2020. More recent data may
have become available since the research was completed.

The EPA Research Programme addresses the need for research in Ireland to inform policymakers
and other stakeholders on a range of questions in relation to environmental protection. These reports
are intended as contributions to the necessary debate on the protection of the environment.

                         EPA RESEARCH PROGRAMME 2014–2020
                    Published by the Environmental Protection Agency, Ireland

ISBN: 978-1-84095-963-5                                                            November 2020

Price: Free                                                                         Online version

                                                 ii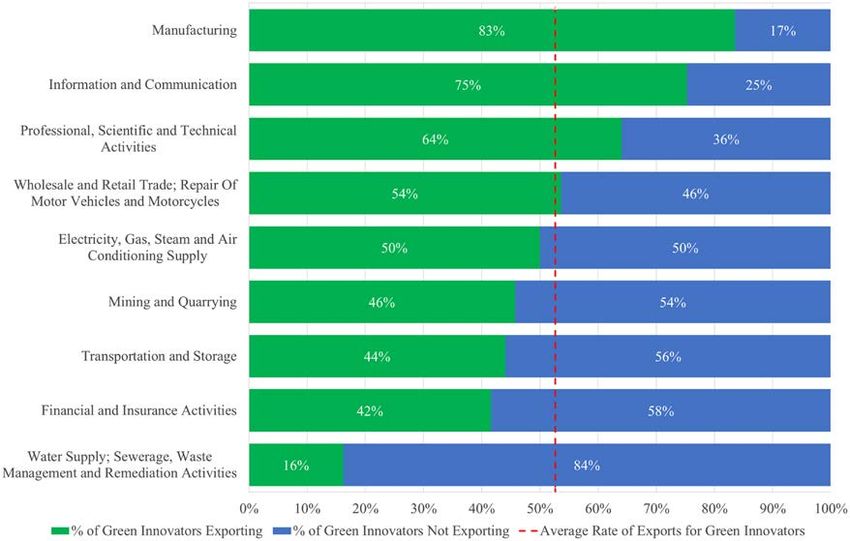
Project Partners

Anne Nolan
Economic and Social Research Institute
Whitaker Square
Sir John Rogerson’s Quay
Dublin
Ireland
Tel.: + 353 (0)1 863 2022
Email: anne.nolan@esri.ie

                                         iii
Contents

Acknowledgementsii
Disclaimerii
Project Partners                                                                               iii
List of Figures                                                                               vii
List of Tables                                                                               viii
Executive Summary                                                                              ix
1      Introduction                                                                             1
2      Health and Wellbeing Effects of the Environment                                          3
       2.1        Introduction                                                                  3
       2.2        Walkable Green Spaces and Obesity                                             3
       2.3        Air Pollution and Asthma                                                      4
       2.4        Objective and Subjective Green Space                                          6
3      Characteristics of Biodiversity Data Recorders                                           9
       3.1        Introduction                                                                  9
       3.2        Data and Methods                                                              9
       3.3        Results of the Baseline Biodiversity Recorder Survey                        10
       3.4        Conclusions, Policy Implications and Further Research Plans                 10
4      Designing and Testing Behaviourally Informed Regulatory Communications                 13
       4.1        Introduction                                                                13
       4.2        Testing for Radon in High-risk Areas                                        13
       4.3        Framing Strategies for Pollution Communication                              14
5      Examining the Drivers and Consequences of Green Innovations and Green
       Investments19
       5.1        Introduction                                                                19
       5.2        The Effects of Environmental Regulations and Other Factors on the
                  Propensity of Firms to Introduce Green Innovations                          19
       5.3        Do Green Innovations Improve Firms’ Export Performance?                     22
       5.4        Factors That Influence Firms’ Decisions to Spend on Environmental Protection 24
       5.5        The Effects of Green Investments on Firm Performance                        24

                                                   v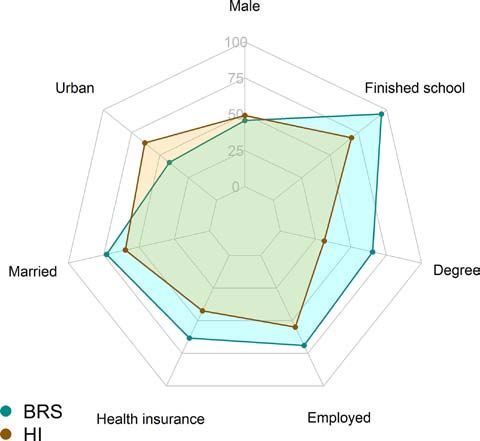
ESRI Environment Research Programme 2018–2020

6   Land Use and Spatial Planning Issues                                  28
    6.1   Introduction                                                    28
    6.2   Urban Rents and Commuting                                       28
    6.3   The Impact of Urban Green Space on Property Values in Ireland   29
7   Recommendations                                                       35
References37
Abbreviations39

                                            vi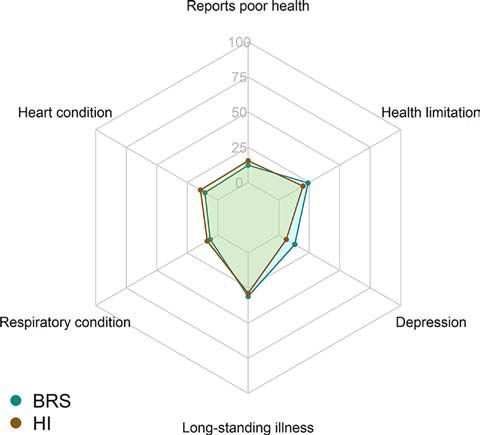
List of Figures

Figure 2.1.   Marginal effects of footpath-accessible green space quintile on BMI,
              comparing street-side and network buffers at 800 m and 1600 m4
Figure 2.2.   Frequency distribution of NO2 exposure among TILDA participants                5
Figure 2.3.   Proportion of those who perceive a problem with open space by green space
              quintile7
Figure 3.1.   Demographic characteristics: comparison of biodiversity recorders and the
              adult population in Ireland using the Healthy Ireland survey                   10
Figure 3.2.   Age distribution: comparison of biodiversity recorders and the adult
              population in Ireland using the Healthy Ireland survey                         11
Figure 3.3.   Environmental issues of concern: comparison of biodiversity recorders and
              the adult population in Ireland using Eurobarometer                            11
Figure 3.4.   Health and wellbeing characteristics: comparison of biodiversity recorders
              and the adult population in Ireland using the Healthy Ireland survey           11
Figure 3.5.   International Physical Activity Questionnaire score distribution: comparison
              of biodiversity recorders and the older adult population in Ireland using the
              Healthy Ireland survey                                                         12
Figure 4.1.   Example management plan presented as part of the experiment                    15
Figure 4.2.   Ranks assigned to each moral frame                                             16
Figure 5.1.   The proportion of firms with green innovations by firm size, 2012–2014         20
Figure 5.2.   The proportion of firms with green innovations by sector, 2012–2014            21
Figure 5.3.   Export participation of green innovators by sector                             23
Figure 5.4.   Green investment rates by industry, 2008–2016                                  26
Figure 5.5.   Green investment rates by region, 2008–2016                                    26
Figure 5.6.   The effects of green investments on firm performance, all firms, 3- and
              5-year average effects                                                         26
Figure 6.1.   Map of bilateral commuting flows in Ireland in 2016                            28

                                               vii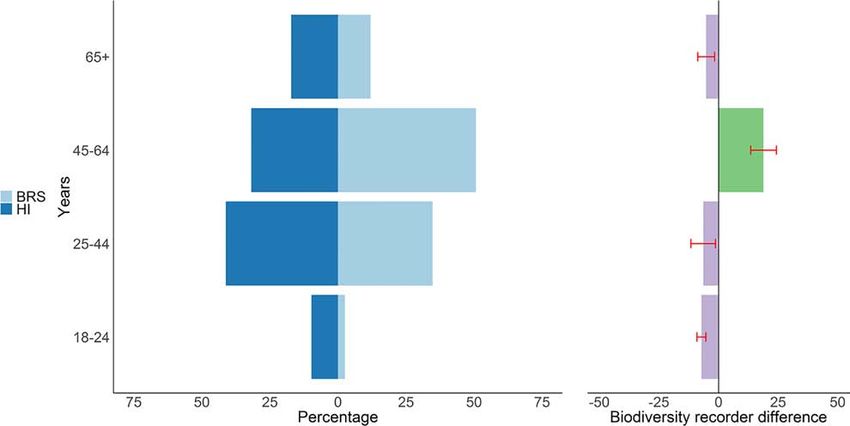
List of Tables

Table 2.1.   Marginal effects from logistic regression of objective green space on
             perceived open space problem                                                   7
Table 4.1.   Experimental conditions for the RCT to improve radon testing rates            13
Table 4.2.   Example moral frames and regulatory actions                                   15
Table 4.3.   Mixed effects ordered logistic regressions of action rankings and ratings by
             frame and environmental concern                                               17
Table 4.4.   Chi-square tests of coefficients for the interaction between frame and
             environmental concern in model 1                                              17
Table 5.1.   Differential effects of green investments on firm performance by firm group,
             5-year average                                                                27
Table 6.1.   Regression results for models of house prices including green space density
             variables and other characteristics                                           32

                                              viii
Executive Summary
Continuing the partnership established between not participation in biodiversity recording activities has
the Economic and Social Research Institute (ESRI) any effects on health and wellbeing.
and the Environmental Protection Agency (EPA) in
phase I (2016–2018) of the programme, this report Using Behavioural Science to Design and
summarises the findings from the second phase of the Test Behaviourally Informed Regulatory
programme (2018–2020). A diverse set of research Communications
topics was examined, broadly grouped under five
Two studies employed techniques from behavioural
thematic areas.
science to design and test regulatory communications
for use by the EPA:
Examining the Impact of the Environment on
Health and Wellbeing 1. Testing for radon in high-risk areas. The first study
will use a randomised controlled trial (RCT) to
The influence of environmental conditions on health examine how to increase uptake of radon testing.
was examined using a spatially linked survey and The trial (postponed on account of the coronavirus
environmental data in three studies. disease 2019 – COVID-19 – pandemic) will test
1. Walkable green spaces and obesity. Living in an three manipulations of the standard letter issued
area with the lowest amount of urban green space, to residents in high radon risk areas (envelope
as measured within a 1600 m footpath-accessible design, simplification, personalisation).
network buffer, was associated with a slightly 2. Framing strategies for pollution communication.
higher body mass index (BMI) in those aged 50 The second study used a controlled experimental
and over. However, no association was found approach to identify general framing strategies
related to other characterisations of walkable for pollution communications. The results suggest
green space. that communications should emphasise the role
2. Local air pollution and asthma. Living in an area of regulations in protecting the environment and
with higher nitrogen dioxide concentrations was preventing related harms to people, rather than
associated with an increase in the probability other moral appeals (e.g. to respect the local area).
of reporting an asthma diagnosis and/or using
asthma medication in those aged 50 and over. Examining the Drivers and Consequences of
Green Innovations and Green Investments
3. Objective and subjective green space. Relative
to those living in rural areas, those with the least Using firm-level data, four studies were carried out
amounts of urban green space were more likely to under this theme.
report an open space problem, as were those who 1. The effects of environmental regulations on the
reported problems with service provision, safety propensity of firms to introduce green innovations.
and cleanliness in their local area. The results indicated that environmental
regulations incentivised firms to introduce green
Characteristics of Biodiversity Data Recorders innovations. Other major drivers included in-house
research and development activity, investment in
In partnership with the National Biodiversity Data
tangible and intangible assets, and firm size.
Centre (NBDC), data from a specially designed
online questionnaire showed that biodiversity data 2. Do green innovations improve firms’ export
recorders were more socioeconomically advantaged, performance? Green innovations with benefits
environmentally aware and physically active, but more for the consumer and product innovations with
likely to have depression, than the general population. environmental benefits were positively associated
A follow-up survey in late 2020 will examine whether or with firms’ export participation.
ixESRI Environment Research Programme 2018–2020
3. Factors that influence firms’ decisions to spend 1. Urban Rents and Commuting. A positive
on environmental protection. The results indicated relationship between the difference in rents
that larger firms, importers and firms that were part between pairs of areas and the commuting time
of an enterprise group were more likely to invest in between them was found, consistent with the
equipment for pollution control and in equipment idea that high housing costs tend to push those
linked to cleaner technologies. working in urban areas into commuting greater
distances.
4. The effects of green investments on firm
performance. The results showed that, in the 2. Value of Urban Green Space. This study
medium term, green investments had positive examined the impact that urban green space
effects on firms’ performance. The effects were amenities have on the sale price of housing in
stronger for firms that were larger, foreign owned, Dublin during the period 2010–2018. The results
more productive and in low-tech industries. showed a positive price premium for dwellings in
the vicinity of parks, implying a capitalised value of
Land Use and Spatial Planning Issues approximately €3.4 billion in 2019.
The final two studies focused on land use and spatial
planning issues.
x1 Introduction
The Environmental Protection Agency (EPA)/Economic First, by combining individual-level survey data with
and Social Research Institute (ESRI) Environment administrative data on environmental conditions, we
Research Programme brings together a diverse set can better understand the impact of environmental
of research topics with the objective of assessing conditions on health and wellbeing. This approach
the ways in which the environment interacts with allows us to identify inequalities in environmental
economic and social processes. The programme has exposures across the population (e.g. in access
at its core the ambition to produce fast and focused to green space, air pollution) and to assess the
policy-relevant analyses that employ publicly available implications of these environmental conditions for
data in new ways and through the generation of policy- health and wellbeing. In this phase of the programme,
relevant behavioural insights. Lyons (2019) provides we continued to use survey data from the Irish
a detailed summary of the topics examined in the first Longitudinal Study on Ageing (TILDA) and we also
phase of the programme, which covered the period obtained access to a survey of the adult population
2016–2018. In this report we synthesise the results aged 15 and over, namely Healthy Ireland. The use of
from the second phase of the programme, which individual-level data means that confounding factors,
comprised 12 studies, carried out between 2018 and such as socioeconomic status, can be taken into
2020. These studies can be grouped into five broad account. This allowed the research team to generate
themes: more robust insights into the relationship between the
environment and health and wellbeing.
1. examining the impact of the environment on health
and wellbeing; Second, where survey data are not available, new
data collection can provide insights into hitherto
2. characteristics of biodiversity data recorders; underresearched population groups. In collaboration
3. using behavioural science to design and with the National Biodiversity Data Centre (NBDC), we
test behaviourally informed regulatory designed an online questionnaire to collect information
communications; on the demographic, health, social and attitudinal
characteristics of newly recruited biodiversity data
4. examining the drivers and consequences of green recorders in Ireland. To our knowledge, this is the first
innovations and green investments; study to characterise a group of people engaged in
5. investigating land use and spatial planning issues. environmental citizen science activities in terms of
their health, wellbeing and physical activity. This allows
These research topics were selected through a us to establish a baseline for investigating effects of
process of dialogue with the EPA. In some cases, for participation in citizen science activities on participants’
example on the health and environment theme, the health and wellbeing using a follow-up survey, which
work further developed the research carried out in will be conducted in the next phase of this ongoing
phase I. Other themes, for example research on green project (starting at the end of 2020).
innovations and green investments, involved entirely
Third, the research team analysed a range of firm-
new research, using new data sources and methods.
level datasets from Ireland’s Central Statistics Office
Throughout, as in phase I, the partners sought to
(CSO) (e.g. the Community Innovation Survey, the
identify research questions and themes that offered
Census of Industrial Production and the Annual
both policy relevance and scope for robust empirical
Services Enquiry) to provide novel evidence on (1) the
analysis.
effect of environmental regulations and other factors
It is worth summarising the diversity of data and on the propensity of firms to introduce innovations
methodological approaches used in the research with environmental benefits and the impact of
programme, as it highlights the uses of different these innovations on their export performance; and
approaches for policy analysis and development. (2) determinants of firms’ investments in environmental
1ESRI Environment Research Programme 2018–2020
protection and the impact of these investments on a report; additional material can be found in the full
broad range of firm performance outcomes, including publications, which are referenced in each section.
output, employment, productivity, export intensity and In other cases, research has only recently been
energy intensity. completed and is awaiting publication, so this report
contains a more detailed account of the work. For one
Finally, the use of behavioural science techniques,
topic, on the health and wellbeing impacts of engaging
such as laboratory experiments and field trials, which
in biodiversity-recording activities, only the first phase
involve the collection of new data, offers an opportunity
of the research is summarised here (the second
to influence the design of policy interventions. In
phase of that research involves further data collection,
this phase of the programme, we focused on two
which is scheduled for the end of 2020/beginning of
areas of current policy concern: (1) the design of
2021). For the two behavioural science topics, the
communications with householders in high radon risk
impact of the public health restrictions introduced as
areas (to encourage higher testing rates) and (2) the
a result of the coronavirus disease 2019 (COVID-19)
design of general communication strategies for the
pandemic has meant that some data collection has
presentation of environmental information.
been delayed; in these cases, the summary reflects
Much of the research carried out under the programme progress up to June 2020. The remainder of the report
has been published in peer-reviewed journal articles. discusses each of the topics in turn, before setting out
In these cases, we summarise the research in this some recommendations for policy.
22 Health and Wellbeing Effects of the Environment
Research by Peter Barlow, Philip Carthy, Seán Lyons 2.2 Walkable Green Spaces and
and Anne Nolan. Obesity
2.2.1 Background
2.1 Introduction
Although exposure to urban green spaces has been
The natural and built environment is an important
associated with various physical health benefits, the
component of the “social determinants of health”, i.e.
evidence linking these spaces to lower body mass index
the non-medical factors that determine our health
(BMI) and obesity risk, particularly among older people,
and wellbeing throughout the life course. In phase I
is mixed. In a study conducted for phase I of the EPA/
of the EPA/ESRI research programme, the research
ESRI research programme, we found evidence of a
team pioneered the use of linked environment–
U-shaped relationship between urban green space
health data at the individual level to examine the
availability and obesity (Dempsey et al., 2018b). One
impact of radon risk on lung cancer (Dempsey et
potential explanation for the counterintuitive results at
al., 2018a), the impact of urban green spaces on
the higher quintiles of green space exposure was that
obesity (Dempsey et al., 2018b) and the impact of
the study focused only on the amount of green space
coastal blue spaces on mental health (Dempsey et
available in an individual’s local area and not on the
al., 2018c). For these analyses, individual-level data
accessibility of that green space. The aim of this study
on health and socioeconomic characteristics from
was therefore to add to the literature on the association
TILDA were matched with spatially coded data on
between urban green space and BMI by considering
environmental exposures from a variety of sources,
alternative measures of urban green space that
such as the EPA, the European Environment Agency
incorporate measures of footpath availability.
(EEA) Urban Atlas and the Ordnance Survey Ireland
(OSI). A key challenge in this area of research is
establishing causality, as poor health, poor ambient
2.2.2 Data and methods
environmental conditions and low socioeconomic
status are often correlated. The use of individual- Survey data from TILDA were used in this study.
level data allows us to control for many confounding TILDA is a nationally representative survey of over
factors, such as socioeconomic status, and thus 8000 individuals aged 50 and over, who were first
come up with more robust estimates of the impact surveyed in 2010. Participants are followed up every
of selected environmental exposures on health and 2 years, with five waves of data collection completed to
wellbeing. date. In addition to extensive information on household
structure and socioeconomic characteristics, TILDA
In phase II of the EPA/ESRI research programme,
contains detailed information on numerous doctor-
we extended the research carried out in phase I in a
diagnosed health conditions (e.g. cardiovascular
number of ways. First, we carried out further research
diseases, respiratory diseases and cancer), use of
on the impact of green spaces on obesity in order
prescribed and over-the-counter medications, and
to try to understand the mechanisms underlying the
validated indicators of wellbeing and mental health.
relationship established in Dempsey et al. (2018b).
The dataset also includes objective indicators of health
Second, we examined the impact of additional
collected as part of an extensive nurse-led health
environmental exposures, such as air pollution.
assessment (e.g. blood pressure, height and weight).
Third, we used an additional source of survey data
– Healthy Ireland – to broaden our focus to the full Respondents’ exposure to urban green spaces at their
adult population. Sections 2.2–2.4 describe research residential addresses was assessed using street-side
findings for the three phase II studies that further and area buffers that take account of the presence
developed our understanding of the links between the of footpaths. Data on green spaces and the footpath
environment and health. network were sourced from the OSI’s Prime 2 model.
3ESRI Environment Research Programme 2018–2020
Generalised linear models were used to test the green space. Our results suggest that there are some
association between exposure to several measures of unobserved factors other than footpath availability
urban green space accessibility and BMI. that mediate the relationship between urban green
space and weight status. Future work should, subject
to data availability, consider factors that may impede
2.2.3 Results the use of green spaces, such as inadequate lighting,
Relative to the third quintile, living in an area with the restricted opening hours and the presence of anti-
lowest quintile of urban green space, as measured social behaviour.
within a 1600 m footpath-accessible network buffer, The research underpinning this study has been
was associated with a slightly higher BMI [marginal published in a peer-reviewed academic journal (see
effect: 0.80; 95% confidence interval (CI): 0.16–1.44]. Carthy et al., 2020a).
The results, however, were not robust to small
changes in how green space was measured and no
statistically significant association between urban 2.3 Air Pollution and Asthma
green space and BMI was found under other variants
of the regression model (see Figure 2.1). 2.3.1 Background
Asthma affects over 300 million people worldwide. A
growing body of research suggests that air pollution
2.2.4 Conclusions and policy implications
can contribute to the risk of developing asthma and
The results of this analysis show that the relationship the severity of the condition for those who suffer from
between urban green spaces and BMI among older it. However, the evidence of links between local air
adults is highly sensitive to the characterisation of local pollution and asthma is stronger for young people than
Figure 2.1. Marginal effects of footpath-accessible green space quintile on BMI, comparing street-side
and network buffers at 800 m and 1600 m. Generalised linear model regression results. The values along
the x-axis refer to marginal effects. Horizontal bars represent 95% CIs. Quintile 1 refers to the lowest
quintile of footpath-accessible green space, whereas quintile 5 refers to the highest. Source: Figure 4 in
Carthy et al. (2020a).
4A. Nolan et al. (2019-HW-MS-15)
for older adults. In this study we examined whether to test whether or not individuals living in areas with
or not asthma rates were higher among people aged higher NO2 exposures were likely to have a higher
over 50 years in Ireland who lived in areas with higher risk of asthma than those living in areas with less air
levels of local nitrogen dioxide (NO2) air pollution. NO2 pollution. These models controlled for many other
is one of several pollutants emitted by motor vehicles factors that might affect the likelihood of having
and is often used as an indicator of transport-related asthma, including socioeconomic characteristics, age,
air pollution more generally. sex, history of smoking and education level.
2.3.3 Results
2.3.2 Data and methods
Overall, 9% of the sample aged 50 and over reported
This study used survey data from TILDA (described
an asthma diagnosis and 6.9% reported using relevant
previously in section 2.2.2). Information on participants’
medications (e.g. inhalers). Living in an area with higher
demographic characteristics, socioeconomic
NO2 concentrations was associated with an increased
background and asthma status were linked to
probability of asthma. For example, a 1 ppb increase
estimates of annual average NO2 concentrations
in local NO2 was associated with a 0.24 percentage
around their home addresses. Data on NO2 exposure
point increase in the probability of reporting an asthma
at TILDA participants’ home addresses were based
diagnosis, and the effect size was similar for the
on a model developed for Ireland in previous research
probability of using asthma medication (0.21 percentage
(Naughton et al., 2018). Figure 2.2 shows how the
points). To put these results in context, the average
average NO2 concentration varied across the TILDA
exposure to NO2 in this sample was 4.8 ppb, with 95% of
sample; 95% of participants had levels of NO2 below
the sample exposed to NO2 levels below 13 ppb.
13 parts per billion (ppb).
Respondents with asthma were identified in two
2.3.4 Conclusions and policy implications
ways: from a self-reported diagnosis or from the
individual’s use of medications normally prescribed This study adds to the evidence that there is an
for this condition. Regression models were then used association between NO2 exposure and asthma
Figure 2.2. Frequency distribution of NO2 exposure among TILDA participants. Source: Figure 3 in
Carthy, P., O’Domhnaill, A., O’Mahony, M., Nolan, A., Moriarty, F., Broderick, B., Hennessy, M., Donnelly,
A., Naughton, O. and Lyons, S. Local NO2 concentrations and asthma among over-50s in Ireland: a
microdata analysis. International Journal of Epidemiology, dyaa074, 2020, by permission of Oxford
University Press.
5ESRI Environment Research Programme 2018–2020
among older adults, a group for which pollution 2.4.2 Data and methods
exposures have received less research attention
Healthy Ireland is an annual survey of the health and
than for younger people. The study used a novel
wellbeing of the population aged 15 and over. The first
approach to identify asthma cases, taking account
round of the survey was conducted in 2015, and five
of both respondents’ own reports of having asthma
further rounds have been carried out to date. Different
and separate evidence on their use of relevant
samples of approximately 7500 individuals are surveyed
medications. The results using the two methods were
each year. A core set of demographic, socioeconomic
similar. Although levels of air pollution are relatively
and health and wellbeing characteristics are collected
low in Ireland compared with many other countries
in face-to-face interviews each year, and each round
and standard regulatory limits are rarely exceeded
also includes additional modules on selected topics of
(EPA, 2019), we still found significant links between
interest (e.g. parental health in round 5).
pollution and asthma rates. Finally, the individual-level
data used in this study allowed us to control for many Wave 2 of Healthy Ireland (carried out in 2016) asked
socioeconomic factors that might influence asthma respondents “How much of a problem are each of the
rates and lead to misleading results if not taken into following in your neighbourhood?”, with nine problems
account. specified (such as “rubbish or litter lying around” and
“vandalism and deliberate damage to property”).
The research underpinning this study has been
Respondents were asked to state whether each
published in a peer-reviewed academic journal (Carthy
problem was “a big problem”, “a bit of a problem” or “not
et al., 2020b).
a problem”. The problem “lack of open public spaces”
is our key dependent variable. Principal components
analysis (PCA) on the remaining eight problems was
2.4 Objective and Subjective Green employed to ascertain whether or not individuals
Space perceived underlying problems with area-level safety,
cleanliness and services provision in their local area.
2.4.1 Background Objective urban green space was measured using
Although exposure to urban green spaces has a geographic information system (GIS) and data on
been associated with various physical health green space from the Urban Atlas produced by the
benefits, the mechanisms underlying the association EEA. Individuals were divided into five quintiles that
between urban green space and health are less well represented the quantity of green space within 1.6 km
understood. This study examines the relationship (20-minute walking distance) of their residence. Those
between perceptions of an open space problem in the for whom no urban green space data are available (as
local area and the amount of green space in that area, they were not in a major urban area) were placed in a
derived from objective measurements. The aim of the separate “rural” category.
study is to provide further evidence for policymakers We examined the association between objective
and practitioners on the features of green space that green space and perceived open space problems
may encourage its use for physical activity, general using logistic regression. We also controlled for other
recreation and social engagement, and thereby lead to perceptions of area-level problems (area-level safety,
better health. cleanliness, services) to examine whether or not these
Perceived and objective measures of green space factors also partly explained perceptions of open
provide an insight into the green space experienced by space problems in an area. A full set of demographic
residents of an area. However, the perceptions may be and socioeconomic controls was also included.
influenced by wider factors such as area safety, area
cleanliness and the availability of other services (e.g.
2.4.3 Results
access to public transport) in an area. By examining
the impact of these factors, we can develop an Overall, just under 10% of the sample reported that
understanding of the factors affecting the efficacy of they had “a bit of a problem” or “a big problem” with
green space in an area. the lack of open spaces. Figure 2.3 illustrates how
6A. Nolan et al. (2019-HW-MS-15)
100%
8.7 9.8 9.6 8.3 11.8
90% 17.3
80%
70%
% of population
60%
50%
40%
30%
20%
10%
0%
Rural Quintile 1 Quintile 2 Quintile 3 Quintile 4 Quintile 5
No Problem Problem
Figure 2.3. Proportion of those who perceive a problem with open space by green space quintile.
Quintile 1 refers to those living in urban areas with the smallest amount of green space, whereas
quintile 5 refers to those living in urban areas with the largest amount of green space.
the distribution of responses to this question varied
depending on the level of urban green space in the
local area. Table 2.1. Marginal effects from logistic regression
of objective green space on perceived open space
In general, a higher proportion of those in areas with problem
lower amounts of urban green space reported an
open space problem (e.g. nearly 20% of those living Variable Marginal effect
in urban areas with the least amount of green space Rural area Reference category
reported an open space problem). This relationship Green space quintile 1 0.117
was consistent except in the case of the quintile (0.030)a
with the highest objective urban green space; the Green space quintile 2 0.062
proportion of respondents who perceived problems (0.023)a
with open space was higher in this quintile than in Green space quintile 3 0.024
some lower objective urban green space quintiles. (0.017)
Green space quintile 4 0.000
Table 2.1 presents the marginal effects from logistic (0.015)
models of the probability of perceiving a problem with Green space quintile 5 0.034
“lack of open space”. In addition to the measure of (0.019)
objective green space, this model included controls Area-level safety 0.037a
for other area-level problems (grouped into three (0.004)
categories relating to area-level safety, cleanliness Area-level cleanliness –0.044a
and services), and it also controls for demographic (0.005)
and socioeconomic characteristics. Relative to those Area-level services 0.046a
living in rural areas, those living in urban areas with (0.004)
the least amount of green space were 11.7 percentage n 7347
points more likely to report that “lack of open space”
Standard errors in parentheses. Quintile 1 has the least
was a problem. Those living in quintile 2 (with the next
amount of urban green space and quintile 5 has the most
lowest level of urban green space) were also more amount of urban green space.
likely to report an open space problem. Perceptions of a
Significant at 1% level.
7ESRI Environment Research Programme 2018–2020
area-level safety, cleanliness and services provision service provision, safety and cleanliness in their local
were also important; for example, those perceiving area were also more likely to perceive a problem with
a problem with safety (e.g. crime, vandalism) in their “lack of open space” in their local area, highlighting the
local area were 3.7 percentage points more likely to importance of these factors for individuals’ propensity
report a problem with “lack of open space” in their local to use their local green space. This suggests that,
area. for any health benefits of green space to be realised,
it must exist in the context of a safe, clean and well-
serviced environment. Therefore, any investment in
2.4.4 Conclusions and policy implications green space to improve health and wellbeing in an
area should recognise the importance of the area’s
The analysis shows that, overall, less than 10% of
safety, cleanliness and service provision in facilitating
Irish adults reported that they experienced a “lack
the use of that green space.
of open space” in their local area. Relative to those
living in rural areas, those with the least amounts of A draft of this paper has been completed and is
urban green space were more likely to report such currently being finalised for submission to a peer-
a problem. Individuals who reported problems with reviewed journal.
83 Characteristics of Biodiversity Data Recorders
Research by Ciarán Mac Domhnaill, Seán Lyons and The survey was sent by the NBDC to biodiversity
Anne Nolan. recorders by email in February 2019. The survey
was closed in April 2019, having received 438 valid
responses with the sample size varying between
3.1 Introduction
questions. The survey was sent only to biodiversity
Citizen science gives members of the public an recorders who had registered with the NBDC in the
opportunity to engage in scientific research and is an past year, allowing us to focus our study on a relatively
increasingly important tool for addressing conservation homogeneous group of newly recruited citizen scientists.
issues. In the first phase of this project, we contributed
to the evidence base on who participates in
environmental citizen science activities by examining 3.2.2 Population data sources
the demographic, socioeconomic, attitudinal and Population data were sourced from the third wave
health characteristics of biodiversity recorders in of TILDA and the first wave of the Healthy Ireland
Ireland. survey, both of which have been described in detail
A better understanding of the demographic previously in this report. We also utilised data on
and attitudinal characteristics of environmental Irish participants from Special Eurobarometer 468
citizen scientists could help researchers to target (European Commission, 2017), a public opinion survey
recruitment campaigns and to design research on the attitudes of European citizens towards the
activities that maximise the potential for involving environment, which involved face-to-face interviews
citizen scientists. To our knowledge, this was the first with 1002 participants from Ireland.
study to characterise a group of people engaged in
environmental citizen science activities in terms of their
3.2.3 Methodology
health, wellbeing and physical activity. This allows us
to establish a baseline for investigating the effects of To compare the characteristics of our sample of
participation in citizen science activities on participants’ biodiversity recorders with the population data
health and wellbeing using a follow-up survey, which sources, for each characteristic we tested the
will be conducted in the next phase of this ongoing hypothesis that there was a statistically significant
project (starting at the end of 2020). difference between the proportions of the two
groups in variable categories. In the case of health,
wellbeing and physical activity variables, however,
3.2 Data and Methods
any differences may have been at least partly the
result of differences in demographic characteristics,
3.2.1 Biodiversity Recorder Survey
for example biodiversity recorders tended to be more
We collaborated with the NBDC to carry out an online highly educated. Therefore, to help filter out such
survey of a group of people engaged in voluntary discrepancies explained by demographic differences,
biodiversity observation and monitoring activities who we employed a Blinder–Oaxaca decomposition. This
had recently registered as biodiversity data recorders. statistical technique can determine the proportion of
We designed a new survey instrument, the Biodiversity any gap in mean outcomes that can be explained by
Recorder Survey, employing questions drawn from group differences in observed characteristics and the
existing large-scale socioeconomic surveys in proportion that remains unexplained. In other words,
Ireland. This allowed us to compare the demographic, this revealed any innate differences in outcomes
socioeconomic, attitudinal and health characteristics between our sample of biodiversity recorders and the
of biodiversity recorders with the attributes of the general population that would have existed even if
wider population and to test for statistically significant our sample was endowed with the same demographic
differences between these groups. characteristics as the population.
9ESRI Environment Research Programme 2018–2020
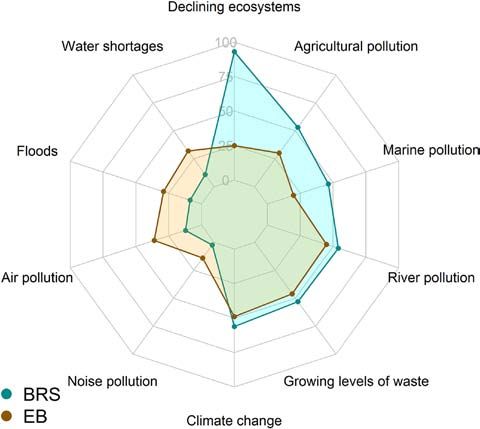
3.3 Results of the Baseline biodiversity, such as the pollution of rivers and lakes,
Biodiversity Recorder Survey marine pollution and agricultural pollution. Conversely,
issues that may affect biodiversity and natural
As illustrated in Figures 3.1 and 3.2, we found
ecosystems less directly, such as noise pollution, air
biodiversity recorders to be more highly educated, less
pollution and shortages of drinking water, were less
urban based, better off, more active in the labour force
likely to be selected by biodiversity recorders.
and more middle-aged than the general population.
These findings were in broad agreement with previous We found mixed results in terms of health, wellbeing
research on the demographic characteristics of and physical activity, as shown in Figure 3.4.
environmental citizen scientists. Accounting for observed differences in demographic
characteristics between biodiversity recorders
As expected, given the nature of their voluntary
and the wider population using a Blinder–Oaxaca
conservation work, we found biodiversity recorders
decomposition, we found that biodiversity recorders
to be significantly more engaged in environmental
were 4 percentage points less likely to report either
protection. Recorders were more likely to regard
“good” or “very good” general health.
environmental issues as having a direct impact on
daily life and health and they were also more likely to Meanwhile, as depicted in Figure 3.5, biodiversity
perceive that they, as individuals, could play a role in recorders appeared to be more physically active
protecting the environment in Ireland. We also asked than the general population. Even if our sample of
respondents to choose up to four environmental issues biodiversity recorders was endowed with the same
that were most important to them, and responses demographic characteristics as the population, they
among biodiversity recorders and the wider population would still be 13 percentage points more likely to
are compared in Figure 3.3. Unsurprisingly, almost achieve the minimum recommended level of physical
all biodiversity recorders identified the decline or activity. Decomposition results also suggested that
extinction of species and ecosystems as one of biodiversity recorders were 10 percentage points
the issues most important to them. Recorders also more likely to report having received a professional
appeared more likely to select issues that could diagnosis of depression than the population,
be regarded as having a more direct impact on accounting for demographic differences.
3.4 Conclusions, Policy Implications
and Further Research Plans
The study that forms the first phase of this project
contributes to a growing evidence base that details
the characteristics of people who engage in citizen
science activities. Our findings suggest that younger
people, people who live in urban areas, people who
are unemployed and people with lower levels of
education are all underrepresented in our sample of
biodiversity recorders.
An objective of some environmental citizen science
projects may be to foster enthusiasm for environmental
protection. However, our results suggest that newly
recruited biodiversity recorders are already extremely
Figure 3.1. Demographic characteristics: concerned about the decline or extinction of species
comparison of biodiversity recorders and the adult and ecosystems. The scope for attitudinal change
population in Ireland using the Healthy Ireland appears limited on account of the high rates of
survey. BRS, Biodiversity Recorder Survey; HI, environmental concern reported during the early
Healthy Ireland. stages of participation.
10A. Nolan et al. (2019-HW-MS-15)
Figure 3.2. Age distribution: comparison of biodiversity recorders and the adult population in Ireland
using the Healthy Ireland survey. BRS, Biodiversity Recorder Survey; HI, Healthy Ireland.
Figure 3.4. Health and wellbeing characteristics:
Figure 3.3. Environmental issues of concern: comparison of biodiversity recorders and the adult
comparison of biodiversity recorders and the adult population in Ireland using the Healthy Ireland
population in Ireland using Eurobarometer. BRS, survey. BRS, Biodiversity Recorder Survey; HI,
Biodiversity Recorder Survey; EB, Eurobarometer. Healthy Ireland.
11ESRI Environment Research Programme 2018–2020
Figure 3.5. International Physical Activity Questionnaire score distribution: comparison of biodiversity
recorders and the older adult population in Ireland using the Healthy Ireland survey. BRS, Biodiversity
Recorder Survey; HI, Healthy Ireland.
This first phase study also establishes baseline relative to control groups from population surveys.
health and wellbeing characteristics of biodiversity Further evidence on the benefits to participants of
recorders in the early stages of their engagement environmental citizen science activities could help
with recording activities. In the next phase of this support recruitment to such projects.
project, we hope to resurvey this sample of biodiversity
The research underpinning this study has been
recorders to examine whether or not participation
published in a peer-reviewed academic journal
in biodiversity recording activities is associated with
(Mac Domhnaill et al., 2020).
different trajectories in terms of health and wellbeing,
124 Designing and Testing Behaviourally Informed
Regulatory Communications
Research by Shane Timmons, Deirdre Robertson and agreed in January 2020. Previous research indicates
Pete Lunn. that simplifying the letter has the best chance
of resulting in a positive effect, but there is also
evidence to suggest that altering envelope designs
4.1 Introduction
and personalising communications can be effective.
International research in applied behavioural science Hence, the logic is to test three manipulations
shows that regulatory compliance can be improved (envelope design, simplification, personalisation).
by behaviourally informing and testing aspects of The design is “nested”, with each experimental group
regulatory delivery (e.g. Sunstein, 2011). The aim building on the previous. This approach allows groups
of this component of the programme was to employ to be pooled to increase the sample size and permit a
techniques from behavioural science to design and stronger statistical test of simplification (i.e. the control
test regulatory communications for use by the EPA. group and group 1 could be pooled and compared
Following discussion with enforcement officers from the against the combined effect of groups 2 and 3), while
EPA between November 2018 and May 2019, it was still permitting tests of the other two behavioural
agreed that the project would comprise two strands levers.
of research. The first would employ a randomised
In order to maximise the cost efficiency of the trial
controlled trial (RCT) to increase the uptake of radon
and the potential for positive tests, the focus will be
testing kits in high-risk areas. The second would use
on households with the highest risk (> 20%) of radon
a controlled experimental approach to identify general
exposure. Given that previous trials suggest a testing
framing strategies for pollution communications.
rate of 20% from delivered letters, the trial will initially
target c.3500 houses. The aim of this sample size is
4.2 Testing for Radon in High-risk to compare four forms of communications (including
Areas the standard letter), with 700 houses for each type
of communication, allowing for a non-delivery rate of
A trial design for the RCT to improve testing rates for
approximately 20% (as per previous trials).
radon in high-risk areas, as outlined in Table 4.1, was
Table 4.1. Experimental conditions for the RCT to improve radon testing rates
Group Description
Control Issued standard letter
One-quarter of households will be reissued a letter used in previous trials in order to provide a baseline response rate for
the experimental groups to be compared against
1 Redesigned envelope
Previous research has found that simply altering the branding of envelopes can increase response rates (Tyers, 2017).
One-quarter of households will be issued the same letter as the control group but in a redesigned envelope, in order to test
whether or not simply opening the letter is a key barrier to remediation
2 Simplified letter + redesigned envelope
In other RCTs run by the ESRI’s Behavioural Research Unit, simplifying letters based on behavioural science led to
significant increases in regulation compliance among previously non-compliant farmers. One-quarter of households will be
issued a redesigned letter that uses similar behavioural principles to simplify the communication of relevant information.
The letter will be issued in the same redesigned envelope as used in group 1
3 Simplified letter + area map + redesigned envelope
Other research suggests that personalisation of regulatory communications can have a significant effect on response rates
(Revenue Commissioners, 2019). In order to personalise radon risk information, the remaining households will receive the
same letter and envelope as group 2, but with an image included of the risk map for the area their household is in
13ESRI Environment Research Programme 2018–2020
The implementation of the trial had been scheduled concern for the environment), whether or not people
for late April 2020, although the COVID-19 pandemic respond differently to moral frames depending on if
has required that the trial be postponed. This delay the regulations pertained to different types of pollution
has been used to inform the design of new radon risk and whether a small company or a larger one was
area maps. ESRI has joined a steering group for the expected to adhere to the regulations.
development of the new area maps, which will be
tested as part of the trial in place of pre-existing maps.
4.3.2 Methods
The current schedule is to implement the trial in late
2020, assuming that the trajectory of the COVID-19
Participants
pandemic and the Roadmap for Reopening Society
and Business permits this. Participants (n = 1001) were recruited by market
research agencies to be nationally representative. In
total, 800 people took part online and 201 completed
4.3 Framing Strategies for Pollution
the study on individual laptops “in the lab” at ESRI
Communication
and were paid according to their recruitment platform
norms. Responses from six participants were
4.3.1 Background
removed prior to analysis on account of issues with
How information is presented or “framed” affects the experimental software for the main task, leaving a
extent to which people attend to that information and total sample of 995 for analysis. Within this sample,
also the choices they make (Tversky and Kahneman, 183 people were employed in managerial roles, and
1981). The use of moral language can be an especially they might be expected to make decisions similar to
effective way to frame information, as moral words tend that required in the main task. This subsample showed
to be highly salient and less susceptible to biases of the same pattern of responses as the general sample
inattention (Gantman and Van Bavel, 2015; Brady et and so are not distinguished in the main analyses
al., 2020). However, people differ in the extent to which reported below.
they hold particular moral concerns. Survey research
shows that people who hold socially liberal views tend
Materials, design and procedure
to highly value fairness and the prevention of harm,
whereas people with more socially conservative views For the main experimental task, participants were
also moralise respect for loyalty and purity (Graham et asked to make decisions about a hypothetical
al., 2009). An emerging body of research in behavioural company’s environmental management plan. They
science shows that aligning the presentation or were told the environmental management plan helps
framing of information with a recipient’s concerns and the company to follow the relevant environmental
values can be an especially effective way to improve regulations but that, since each action on the plan
engagement with that information (Feinberg and costs time and money, decisions need to be made
Willer, 2019). For example, in the USA, framing pro- about which actions are the most important to try to
environmental policies as concerns about the sanctity achieve. Participants were informed that the company
of nature rather than highlighting the importance of was small or medium-sized and that the kind of
preventing harm to the planet increases support among pollution at risk was either water or air pollution.
conservatives (Feinberg and Willer, 2012).
The plan consisted of the following four actions,
Hence, the aim of this experiment was to test the which were selected to have broad application to the
moral frames that might be effective at improving enforcement areas under the EPA’s remit:
engagement with pollution communications in Ireland.
1. ensuring personnel are appropriately qualified and
In particular, the aim was to determine whether or not
trained;
regulatory actions under the EPA’s remit are judged to
be more important when framed using specific moral 2. appropriate treatment of waste;
concerns. Additional aims included testing whether
3. maintenance of equipment and systems;
or not specific frames might be more effective among
subgroups of individuals (e.g. among those with less 4. monitoring and reporting of emissions.
14You can also read