SHOW SHared automation Operating models for Worldwide adoption - SHared automation ...
←
→
Page content transcription
If your browser does not render page correctly, please read the page content below
SHared automation Operating models for
                Worldwide adoption
                                         SHOW

                    Grant Agreement Number: 875530

                          D9.1 Evaluation Framework

This report is part of a project that has received funding by the European Union’s Horizon 2020
        research and innovation programme under Grant Agreement number 875530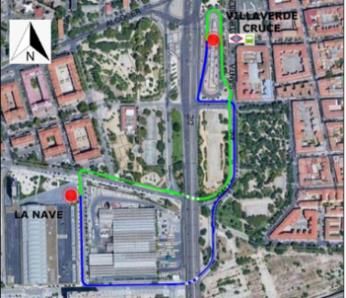
Legal Disclaimer
The information in this document is provided “as is”, and no guarantee or warranty is
given that the information is fit for any particular purpose. The above-referenced
consortium members shall have no liability to third parties for damages of any kind
including without limitation direct, special, indirect, or consequential damages that may
result from the use of these materials subject to any liability which is mandatory due to
applicable law. © 2020 by SHOW Consortium.
This report is subject to a disclaimer and copyright. This report has been carried out
under a contract awarded by the European Commission, contract number: 875530.
The content of this publication is the sole responsibility of the SHOW project.

D9.1 Evaluation Framework                                                              2
Executive Summary
One important part of the SHOW ecosystem evaluation framework is the framework of
the evaluation of the demonstrations. Deliverable 9.1 - evaluation framework is the first
version of the common parametric evaluation framework for SHOW demonstrations
and includes a description of the methodological approach including horizontal
descriptions of vehicles, users and environments to be included in the pre-
demonstrations and real life demonstrations.
The methodological approach for the demonstration evaluation is described in Chapter
2. In SHOW, a methodology has been created for this denoted M3ICA (multi-impact,
multi-criteria, and multi-actor). It allows for the consistent analysis and evaluation of
pilots and simulations within the ecosystem of electric connected automated vehicles
(e-CAV). Specifically, for the pre-demonstration and demonstrations data collections,
the Field opErational teSt support methodology (FESTA) is used as the starting point
for setting up the framework. Chapter 3 provides an overview of the pre-
demonstrations and real-life demonstrations that will take place in 5 Mega Pilots and
6 Satellite Pilots in 18 cities across Europe. The pilots will cover various geographical
areas, city sizes, weather conditions, socioeconomic and cultural issues. The functions
and systems to be evaluated at the pilot sites are defined and described in Chapter 4
and an overview of vehicles and infrastructure to be included in demonstrations at each
pilot site are provided. Preliminary use cases and a description of the target groups
for the evaluation are provided in Chapter 5. Thereafter, the research questions
connected to the use case groups are given in Chapter 6. These will be updated in the
next version of the evaluation framework as the Use Cases are finalized. Chapter 7
describes the method employed for the evaluation to be performed at the pilot sites
across Europe. Evaluation tools will be developed for this purpose as described in
Chapter 8. Chapter 9 introduces the procedure to be followed by the pilot sites when
performing the data acquisition during their demonstrations. Related to this, ethics,
data handling and approval processes are addressed in Chapter 10-12. In Chapter 13,
the pilot sites are presented more in detail. Chapter 14 describes roles and
responsibilities and Chapter 15 provides the conclusion.
The main outcome of this deliverable is the evaluation framework that will be used for
the demonstration sites both for the pre-demonstrations and the real-life
demonstrations. Those all start with identifications of the target users, use cases and
its priorities scenarios. Based on this the research questions will be possible to
formulate, to which the KPIs used for impact analysis can be correlated. When this is
clear the design of the data collection can be made, and tools be developed and used.
The framework will be updated twice to cover the full experimental design for pre-demo
evaluation in D9.2 (M11) and for the final demonstrations in D9.3 (M23).

D9.1 Evaluation Framework                                                              3
Document Control Sheet
 Start date of project:                  01 January 2020

 Duration:                               48 months

 SHOW Del. ID & Title:                   Deliverable 9.1 Evaluation Framework

 Dissemination level:                    CO
                                         WP9
 Relevant Activities:

 Work package:                           WP9

 Lead authors:                           Anna Anund (VTI) and Anna Sjörs
                                         Dahlman (VTI)

 Other authors involved:                 Katerina      Touliou    (CERTH/HIT),
                                         Alexander Fuerdoes (AIT), Joachim
                                         Hillebrand (v2c2), Evy Rombaut (VUB),
                                         Kristina Andersson (RI), Lena Nilsson
                                         (VTI)
 Internal Reviewers:                     Isabel Wilmink, TNO
 External Reviewers:                     N/A
 Actual submission date:                 30/06/2020

 Status:                                 SUBMITTED

 File Name:                              SHOW_D9.1_Evaluation
                                         Framework_SUBMITTED

Document Revision History
       Version                 Date            Reason          Editor
         0.1                15/062020    Draft for review Anna Anund, VTI
                                                          and Anna
                                                          Dahlman, VTI
           2.0              30/06/2020   Updated based on Anna Anund, VTI
                                         reviewers’
                                         comments.

D9.1 Evaluation Framework                                                       4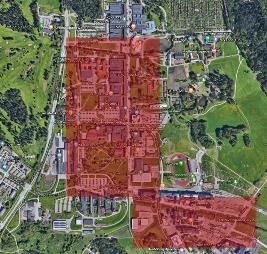
Table of Contents
Executive Summary .................................................................................................. 3
Table of Contents ...................................................................................................... 5
List of Tables ............................................................................................................. 7
List of Figures............................................................................................................ 9
Abbreviation List...................................................................................................... 10
1     Introduction ...................................................................................................... 11
    1.1       Purpose of the document ......................................................................... 14
    1.2       Intended Audience ................................................................................... 15
    1.3       Interrelations ............................................................................................ 15
2     Methodological Approach ................................................................................. 17
    2.1       Evaluation of the SHOW eco system ....................................................... 17
    2.2       Evaluation framework for demonstration activities ................................... 17
3     Pre-demonstration and real-life Demonstration sites – an overview ................. 22
4     Function and system identification.................................................................... 24
    4.1       Systems ................................................................................................... 24
      4.1.1       Vehicles ............................................................................................... 24
      4.1.2       Environment ......................................................................................... 26
      4.1.3       Digital infrastructure ............................................................................. 29
    4.2       Functions ................................................................................................. 30
      4.2.1       Public Transport (PT) ........................................................................... 30
      4.2.2       Demand Responsive Transport (DRT) ................................................. 30
      4.2.3       Mobility as a Service (MaaS)................................................................ 30
      4.2.4       Logistics as a Service (LaaS) ............................................................... 30
    4.3       Type of automated transport .................................................................... 30
5     Use Cases and target groups ........................................................................... 32
    5.1       Use cases ................................................................................................ 32
    5.2       End users ................................................................................................ 33
6     Evaluation aims and research questions .......................................................... 35
7     Evaluation methods .......................................................................................... 36
    7.1       Key Performance Indicators ..................................................................... 36
    7.2       Study design ............................................................................................ 37
8     Evaluation tools ................................................................................................ 39

D9.1 Evaluation Framework                                                                                                   5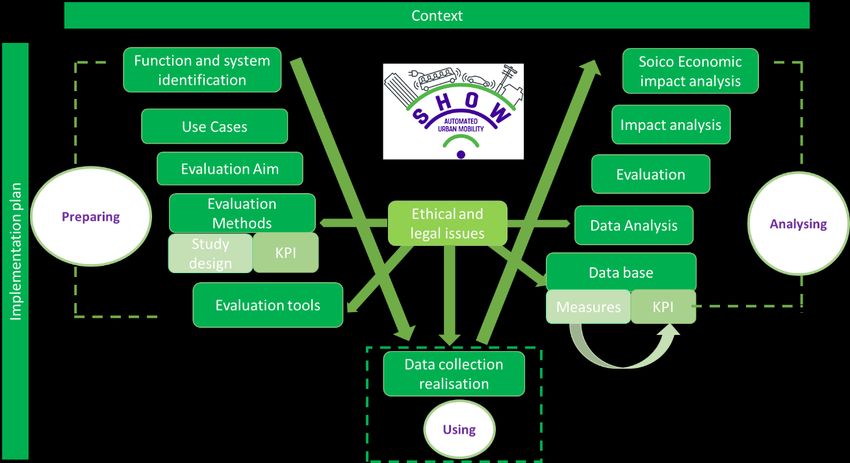
9 Realisation of Data Acquisition ......................................................................... 40
10 Ethics ....................................................................................................... 42
11 Data and information exchange ............................................................... 44
12 Overview on approvals needed at each site ............................................. 45
13 Pilot Site Description ................................................................................ 47
13.1 Mega site France ..................................................................................... 47
13.1.1 Rouen .............................................................................................. 47
13.1.2 Rennes ............................................................................................ 49
13.2 Mega site Spain ....................................................................................... 50
13.2.1 Carabanchel depot ........................................................................... 50
13.2.2 La Nave Boetticher........................................................................... 51
13.3 Mega site Austria ..................................................................................... 52
13.3.1 Graz ................................................................................................. 53
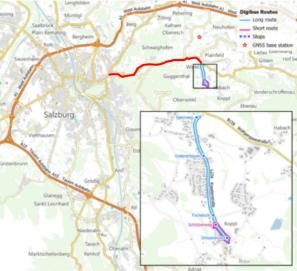
13.3.2 Salzburg ........................................................................................... 54
13.3.3 Vienna.............................................................................................. 55
13.4 Mega site Germany.................................................................................. 56
13.4.1 Karlsruhe.......................................................................................... 57
13.4.2 Mannheim (Franklin) ........................................................................ 58
13.4.3 Aachen............................................................................................. 59
13.5 Mega site Sweden ................................................................................... 60
13.5.1 Linköping.......................................................................................... 60
13.5.2 Kista ................................................................................................. 62
13.6 Satellite sites............................................................................................ 63
13.6.1 Finland - Tampere ............................................................................ 63
13.6.2 Denmark - Copenhagen ................................................................... 64
13.6.3 Italy - Turin ....................................................................................... 66
13.6.4 Greece - Trikala ............................................................................... 67
13.6.5 Netherlands - Brainport .................................................................... 70
13.6.6 Czech Republic - Brno ..................................................................... 71
14 Roles and responsibilities ........................................................................ 73
Conclusions ............................................................................................................ 75
References.............................................................................................................. 76
Appendix I – Main contact persons at each pilot site ............................................... 77
D9.1 Evaluation Framework 6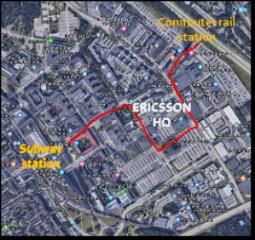
List of Tables
Table 1. Vehicles per site ........................................................................................ 24
Table 2. Overview of the environment at different sites. .......................................... 26
Table 3. Overview of digital infrastructure at different sites ...................................... 29
Table 4. Overview of use cases in focus at each site. ............................................. 33
Table 5. Overview of target end user groups at each site. ....................................... 34
Table 6. Indicative list of KPIs in the Grant Agreement ............................................ 36
Table 7. Overview Rouen ........................................................................................ 48
Table 8. Rouen Time Line ....................................................................................... 48
Table 9. Overview Rennes ...................................................................................... 49
Table 10. Rennes Time Line ................................................................................... 50
Table 11. Overview of the Carabanchel depot ......................................................... 51
Table 12. Electric bus, Madrid, Time Line................................................................ 51
Table 13. Overview La Nave Boetticher, Madrid...................................................... 52
Table 14. La Nave Boetticher, Madrid, Time Line .................................................... 52
Table 15. Overview Graz ......................................................................................... 54
Table 16. Graz Time Line ........................................................................................ 54
Table 17. Overview Salzburg .................................................................................. 55
Table 18. Salzburg Time Line.................................................................................. 55
Table 19. Overview Vienna ..................................................................................... 56
Table 20. Vienna Time Line..................................................................................... 56
Table 21. Overview Karlsruhe ................................................................................. 57
Table 22. Karlsruhe Time Line ................................................................................ 58
Table 23. Overview Mannheim ................................................................................ 58
Table 24. Mannheim Time Line ............................................................................... 59
Table 25. Overview Aachen .................................................................................... 59
Table 26. Aachen Time Line.................................................................................... 60
Table 27. Overview Linköping ................................................................................. 61
Table 28. Linköping Time Line ................................................................................ 61
Table 29. Overview Kista ........................................................................................ 62
Table 30. Kista Time Line ........................................................................................ 62
Table 31. Overview Tampere .................................................................................. 64
Table 32. Tampere Time Line ................................................................................. 64

D9.1 Evaluation Framework                                                                                           7
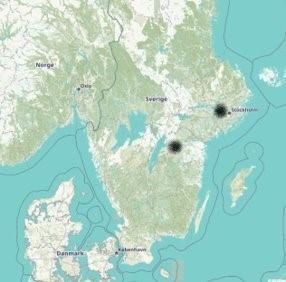
Table 33. Overview Copenhagen ............................................................................ 65
Table 34. Copenhagen Time Line ........................................................................... 65
Table 35. Overview Turin ........................................................................................ 67
Table 36. Turin Time Line ....................................................................................... 67
Table 37. Overview Trikala ...................................................................................... 69
Table 38. Trikala Time Line ..................................................................................... 69
Table 39. Overview Eindhoven (Brainport) .............................................................. 71
Table 40. Time line - Eindhoven (Brainport) ............................................................ 71
Table 41. Overview Brno ......................................................................................... 72
Table 42. Brno Time Line ........................................................................................ 72
Table 43. Main contact person/s at each pilot site ................................................... 77

D9.1 Evaluation Framework                                                                                         8
List of Figures
Figure 1. ShowCasing the Automated city of tomorrow. .......................................... 11
Figure 2. Interrelations between A9.1 (Amber) and other WP/A, different color per SP
(Yellow= SP1, Green=SP2 and Blue for SP3). ........................................................ 16
Figure 3. High-level description of the layers of the SHOW eco system evaluation
framework ............................................................................................................... 17
Figure 4. The pre and real-life demonstration evaluation framework. ...................... 18
Figure 5. V-diagram modified from the FESTA handbook........................................ 20
Figure 6. Classification of simulation activities in SHOW (according to D10.1) ........ 21
Figure 7. Mega Sites and Satellites in SHOW. ........................................................ 22
Figure 8. SHOW demonstration time plan ............................................................... 23
Figure 9. Automated transport systems classification modified from CityMobil2 project.
................................................................................................................................ 31
Figure 10. Illustration of the Swedish application process for trials with self-driving
vehicles ................................................................................................................... 46
Figure 11. The sites Rouen and Rennes ................................................................. 47
Figure 12. Madrid, Carabanchel Depot and La Nave Boetticher, Madrid ................. 50
Figure 13. The Sites Graz, Salzburg and Vienna ..................................................... 53
Figure 14. The Sites Karlsruhe, Mannheim and Aachen .......................................... 57
Figure 15. The Linköping and Kista sites, Sweden. ................................................. 60
Figure 16. Site Tampere, Finland ............................................................................ 63
Figure 17. Site Copenhagen, Danmark ................................................................... 64
Figure 18. The Site Turin ......................................................................................... 66
Figure 19. The Site Trikala ...................................................................................... 68
Figure 20. The Site Brainport .................................................................................. 70
Figure 21. The Site Brno ......................................................................................... 71

D9.1 Evaluation Framework                                                                                                        9
Abbreviation List
 Abbreviation               Definition

 AaaS                       Automation as a Service

 AI                         Artificial Intelligence

 AV                         Autonomous Vehicle

 AVP                        Automated Valet Parking

 DRT                        Demand Responsive Transport

 CAV                        Connected and Autonomous Vehicle

 CCAM                       Cooperative, Connected & Automated Mobility

 CCAV                       Cooperative Connected Automated Vehicle

 e-CAV                      Electric connected automated vehicles.

 FESTA                      Field operational test support methodology

 GDPR                       General Data Protection Regulation

 LaaS                       Logistics as a Service

 MaaS                       Mobility as a service

 MAMCA                      Multi-Actor Multi-Criteria Analysis

 M3ICA                      Multi-Impact, Multi-Criteria, and Multi-Actor).

 OEM                        Original Equipment Manufacturer

 PT                         Public transport

 SoS                        System of systems

 SMU                        Soft Mobility Users

 VEC                        Vulnerable to Exclusion

 WoZ                        Wizard of Oz

D9.1 Evaluation Framework                                                     10
1 Introduction
The SHOW project aims to support the migration path towards effective and
persuasive sustainable urban transport through technical solutions, business models
and priority scenarios for impact assessment, by deploying shared, connected,
electrified fleets of autonomous vehicles in coordinated Public Transport (PT), Demand
Responsive Transport (DRT), Mobility as a Service (MaaS) and Logistics as a Service
(LaaS) operational chains in real-life urban demonstrations. The SHOWcasing of the
Automated City of tomorrow is presented in Figure 1.

Figure 1. ShowCasing the Automated city of tomorrow.

Each system mentioned above (e.g. PT, DRT) and presented in Figure 1 , is a system
within the eco system and as such will be represented and evaluated. The ecosystem
involves the dynamic interactions among the different stakeholder groups (e.g. the fleet
operator, the leader in a platoon and passengers) and therefore it’s not the same as
the addition of its systems, but something different.
SHOW aims to demonstrate and evaluate a complex System of Systems (SoS). The
SHOW ecosystem includes 8 different systems: the Traffic Management Control
(TMC) controlling AV fleet, Advanced Logistic vehicles, Connected bike sharing,
Automated charging and parking depot, Roadside charging, Automated MaaS,
Automated Maas Stations, Automated DRT.

D9.1 Evaluation Framework                                                            11
Comprehensive frameworks to be used for evaluations of such an ecosystem, with
layers of safety, energy and environmental impact, societal impact, logistics and user
experience, awareness and acceptance are not yet available. Especially when taking
into consideration several stakeholder perspectives described in SHOW D1.1
“Ecosystem actors needs, wants & priority users experience exploration tools”. The
indicative list of stakeholders for SHOW consists of the following groups:
OEMs and transport/mobility operators, Tier 1 suppliers, telecom operators,
technology providers, SMEs
Research & academia,
Passengers and other road users encompassing VEC,
Umbrella associations,
Road operators, Authorities (Cities, Municipalities, Ministries) & policy
makers.
Already 50 years ago, the insight of a need for multifaceted approach for evaluations
of, in this case, safe traffic was identified by researchers (Hughes, Newstead, Anund,
Shu, & Falkmer, 2015). Different types of road safety strategies were developed like
the three Es - Enforcement, Engineering and Education (Damon, 1958) or the User-
Machine-environment, that was the starting point for the work by Haddon (1972).
Haddon included phases of a crash in time (pre-crash, crash and post˗crash) and
factors or components that affect crashes (e.g. drivers, vehicles, road environment,
and social-economic environment), but did not include the broader physical
environment and socio-economic environment components. It has been argued that a
system approach is needed to understand what is good or bad and Peden et al. (2004)
stated that “making a road traffic system less hazardous requires a “system approach”
– understanding the system as a whole and the interaction between its elements, and
identifying where there is potential for intervention”.
Such a reasoning is most likely relevant for other areas of impact than safety, and
useful to consider also evaluating the complexity of the automated systems of
tomorrow. Developments of Cooperative, Connected and Automated Mobility are
happening fast and hold the promise of further increased safety and more inclusive
mobility solutions. To be successful however, there is a need to carefully assess the
integration in both existing traffic and existing infrastructure.
To this end, the European Commission has initiated a discussion within the ITS
Committee. The goal is to establish a European roadmap with short-term and long-
term targets for testing and deployment of Cooperative, Connected and automated
mobility (CCAM)1. CCAM initiatives focus to find possible frameworks to rely on.
The SHOW project has eight identified objectives, among those nr 5 and 6 are the
main targeted in the evaluation framework, but the outcome of the evaluation results
will be used to cover more or less all other objectives.
1. To identify and specify priority urban automated mobility Use Cases (UCs) that
guarantee high user acceptance, true user demand and cost-efficiency under
realistic operational conditions, respecting the legal, operational and ethical
limitations.
1 https://ec.europa.eu/transport/themes/its/c-its_en
D9.1 Evaluation Framework 122. To identify novel business roles and develop innovative business models and
exploitable products/services for sustainable automated fleet operations in
urban and peri-urban environments.
3. To develop an open, modular, and inclusive system architecture, and the
enabling tools for it, supporting all UCs and allowing cross-site, cross-vehicle
and cross-operator data collection, analysis and meta services realisation.
4. To improve the necessary functionalities of all vehicle types (shuttles and pods,
buses and cars) to allow the demonstration UCs to be realized, taking into
account the local physical and digital infrastructure (5G, G5, …), weather and
traffic conditions, improving the vehicles’ energy efficiency and safeguarding
the safety of vulnerable and non-connected traffic participants through
appropriated interfaces.
5. To deploy demonstration fleets, infrastructure elements and connected
services (DRT, MaaS, LaaS, etc.) to realise and validate seamless,
personalized and shared electric Cooperative Connected Automated Vehicle
(CCAV) services for all travellers in real urban and peri-urban traffic
environments across Europe and, through a vast international collaboration at
global level.
6. To assess the impact of shared automated cooperative and electric fleets at
city level through holistic impact assessment.
7. To transfer the outcomes through proof of alternative operational schemes and
business models to replication sites across Europe and beyond.
8. To support evidence-based deployment of urban traffic automation, through
replication guidelines, road-mapping, reskilling, and training schemes for the
future workforce as well as through input to certification and standardization
actions and policy recommendations.
One of the objectives of the SHOW project (#5) is to deploy demonstration fleets,
infrastructure elements and connected services (DRT, MaaS, LaaS, etc.) to realise
and validate seamless, personalized and shared electric CCAVs for all travellers in
real urban and peri-urban traffic environments. Demonstrations will take place in 5
Mega Pilots and 6 Satellite sites. A Mega pilot site is a site in a country where different
cities or part of a city are working together addressing the SHOW use cases. A satellite
is a demonstration site that is more focused and is not covering all use cases. In total
demonstrations will take place in 18 cities across Europe. In Chapter 13 an overview
of each site is presented. In addition, there are and 3 Follower Pilot sites, those will not
do demonstrations but are used as replication sites, adopting business models,
selected technologies, and tools from SHOW.
The evaluation framework provides a common methodology for these demonstrations,
to harmonize the experimental procedures across all Demonstration sites.
The evaluation framework for the demonstrations needs to guarantee that data is
collected for the impact analysis, hence a strong link to the KPIs and the
measurements is needed.
Several other project-wide objectives are also related to the evaluation framework.
One objective is to identify and specify priority urban automated mobility use cases
(UC) that will be covered in the Pilot sites (#2). To allow the demonstration UCs to be
realized, necessary functionalities of all vehicle types used in SHOW demonstrations
D9.1 Evaluation Framework 13(shuttles and pods, buses, and cars) will be improved (#4). Another objective is related to the development of a big data collection platform and data management portal, being able to collect and analyse all pilot site data (#3). Data collected at the Pilot sites will also contribute to the objective of assessing the impact at city level of shared automated cooperative and electric fleets through a holistic impact assessment (#6). 1.1 Purpose of the document The purpose of this deliverable is to present a generic framework for the evaluation of the demonstrations sites. This deliverable is named D9.1 Evaluation Framework and is the first version of the common evaluation framework the demonstrations. When the licensing and approvals and technical verifications are done, a first pre-demonstration will happen, this is to be considered as rehearsal. After that the real life demonstrations will take place with real users. The framework covers the details of all planned evaluations of Pre-demonstration and real life Demonstrations, including a description of the methodological approach. A consolidation of of vehicles, users and environments to be included in the pre-demos and real-life demonstrations are also presented with the aim to get an overview of all demonstrations sites that will perform evaluations. In D9.1 the indicative KPIs are described in Chapter 7.1. The deliverable will be updated twice over the course of the project and will cover the full experimental design for pre-demo evaluation (D9.2 in Month 11 and the same but for the real life demonstrations in D9.3 (Month 24). Both D9.2 and D9.3 will include the full experimental design of the project encompassing clear definitions of research hypotheses (for each test site), liaison to KPIs defined in A9.4 “Impact assessment framework, tools & KPIs definition”, objective (i.e. logging tools) and subjective measuring tools (questionnaires, focus groups, etc.) to be used (fed by A9.2 “Capturing and monitoring tools”), timetables, but also allocation of responsibilities and definition of all operational conditions for the realisation of the demonstrations. All experimental plans will abide to a common parametric evaluation framework that will be defined to reflect clear liaisons to the impact assessment framework of A9.4 Ethical and privacy issues (D3.2) will be instantiated herein in each test site context. The framework will be common in the sense that it will target the same objectives and satisfy the same key impact assessment targets as defined in A9.4. Still, it will be parametric in the sense that not all use cases will be demonstrated and tested in all sites or not in the exact same configuration. As such, the framework will make evident from the beginning and through the association of the KPIs with demonstration cases, which outcomes will emerge from each site, and which of them and to which extent they will be comparable. Still, the framework, used by the pilot sites, will ensure that the key priority use cases and impacts targeted will be answered by all test sites of the project. The detailed experimental plans will define and associate carefully the varying testing contexts – in particular the type of roads, the size of penetration, the automation readiness of the region/city, the tests’ seasonality, the type of vehicles involved, the passenger volumes, etc. – identifying the common and changing parameters in each case. This will further on be used to define the impact assessment (WP13) and the projections done by simulations (WP10). This will allow the definition of the level of the later consolidation and comparison of the outcomes and, finally, the derivation of both generic but also context-specific conclusions. D9.1 Evaluation Framework 14
1.2 Intended Audience
This deliverable has two groups of intended audience, people outside the SHOW
consortium and SHOW partners working with the pilot. The deliverable is public and is
seen as the first deliverable where people from outside the project consortium, but with
experience in the topic of automation, can get an overview of the framework for the
evaluation of the SHOW ecosystem, and also a consolidated view on Pre-demos and
Real-life Demonstrations that will happen. At the same time, this deliverable aims to
define the first version of the evaluation framework covering both pre-demos and real-
life demonstrations. The audience is therefore the pilot site partners that will use this
as the first step towards the planning of the oncoming preparations.

1.3 Interrelations
The Evaluation Framework (D9.1) is closely related to several activities, not only to the
WP9 Pilot plans, tools and eco-system engagement. In Figure 2 the main
interrelationships are highlighted.
The work in WP1 (A1.2, A1.3) sets up the core of what to demonstrate in terms of Use
Cases and scenarios. In addition, WP2 (A2.1) will provide the input about existing
models and best practices to make sure the focus is on innovations, that is also
important for the selection of the final UCs and scenarios to be evaluated. WP3 (A3.2)
then provides the guidance for the demonstration sites to be able to follow and consider
the requirements defined by the General Data Protection Regulation (GDPR), but also
other legal and ethical regulations that need to be considered when humans are
involved in testing and demonstration activities. The demonstration sites will use
different physical infrastructure and the work in WP8 (A8.1) will provide the input about
what to consider. Moreover, the evaluation framework of the SHOW ecosystem is not
only about the performance of the single demonstrations’ sites. To understand the full
concept, there is a need to also use simulation to get the system perspective on the
future city concept and this will be done in WP10/A10.1. The Demonstration sites will
be carefully described within the system architecture work in WP4 (A4.1) and before
realisation of the pre-demonstrations and demonstrations, this will be the starting point
for the technical validation process in WP11 (A11.1).
The update of D9.1 is the D9.2 that will include all the details on Pilot plans, KPIs and
impact assessment per demonstration site for the pre-demonstrations of WP11 (A11.3)
and D9.3 will cover the real-life demonstrations of WP12 (A12.2-A12.7). The results
from the demonstrations will then be consolidated in A12.8, but also be fed into the big
data collection platform in WP5 (A5.1) that will be used for result analysis and
consolidation. The connection between A5.1 and the evaluation framework and the
development of capturing and monitoring tools (A9.2) and the impact assessment
framework in A9.4 is strong and the activities depend on each other to make the
evaluation of the SHOW ecosystem a success. The results from the demonstration
sites will then be used for analysis of business models in WP2 (A2.3), for enhancement
of user experience in WP7 (A7.3), for HMI development in WP7 (A7.4), for dynamic
personalised services in WP6 (A6.5) and for impact analysis in WP13 (A13.1, A13.2,
A13.3 and A13.5). All data collected will be included in the Data Management plan
(D14.2 and its update D14.3).

D9.1 Evaluation Framework                                                             15
Figure 2. Interrelations between A9.1 (Amber) and other WP/A, different color per SP
(Yellow= SP1, Green=SP2 and Blue for SP3).

D9.1 Evaluation Framework                                                        16
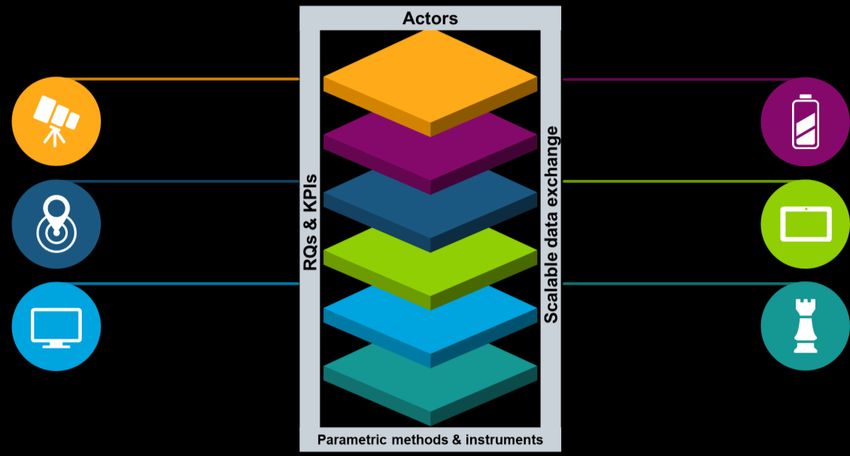
2 Methodological Approach
2.1 Evaluation of the SHOW eco system
In this section the evaluation methods adopted per evaluation type in the project are
briefly addressed to highlight the multi-faceted nature of evaluation activities in the
project. However, even if the evaluation of the SHOW ecosystem is outside the scope
of WP9 it is relevant to describe since it sets the scope of all evaluation-oriented WPs
(WP9, WP11, WP12) together in the project.
In SHOW the high-level depiction of the evaluation framework and its layers is shown
in Figure 3. The framework encompasses several layers, that to some degree are
overlapping or integrated, that start with the investigation of the expectations of
travellers and stakeholders (layer 1) and are completed with the final evaluation of the
ecosystem (System of Systems; SoS) that results from the triangulation of the findings
from the user tests (WP11 and WP12) (FESTA implemented methodology), the impact
assessments (M3ICA methodology; WP13) and the simulations conducted within
WP10. Each method (i.e. sub-framework) addresses the common denominators, of
which some are common (e.g. actors and data sources as well as some RQs and KPIs)
and others will be diverse (i.e. the methods, the indicators, the instruments and the
analyses).

Figure 3. High-level description of the layers of the SHOW eco system evaluation
framework

2.2 Evaluation framework for demonstration activities
For the evaluation framework addressing the pre demonstrations and the real life
demonstrations a methodology denoted M3ICA (multi-impact, multi-criteria, and multi-
actor) will be used. The M3ICA methodology was specifically developed for SHOW and
an overview is presented in Figure 4. . It allows a consistent analysis and evaluation
of pilots and simulations within the ecosystem of electric connected automated
vehicles (e-CAV). The M3ICA has two main aspects to it. On one hand, it incorporates
the Multi-Actor Multi-Criteria Analysis (MAMCA) which evaluates the use cases and
scenarios directly by stakeholders. Maximising participation of stakeholders ensure a
policy that is well-balanced and will support a broad acceptance by society. The
stepwise MAMCA approach quantifies stakeholder objectives and a criteria-based

D9.1 Evaluation Framework                                                            17
evaluation of scenarios that delineate rollout strategies of AV mobility and logistics.
The approach considers stakeholder objectives. It starts with identifying stakeholder
groups and establishing their objectives into a decision tree (which is an outcome of
A1.3 “SHOW Use cases). Groups of objectives (that are linked to a stakeholder) are
then weighted. They are in turn associated to one or more measurable indicators. An
overall ranking of the scenarios follows using a multi-criteria tool, and results can then
be visualised, allowing a comprehensive understanding of the essential stakeholder
trade-offs.
On the other hand, a performance indicator framework that considers scenarios of AV
development and its impact on various socio-economic facets is developed based on
a thorough review of literature. For example, (Milakis, Bart, & Bert, 2017) defines order
of impacts on broad clusters of indicators (e.g. mobility or safety) and differentiates it
in terms of direct (1st order), indirect (2nd order) and societal/land-use (3rd order)
impacts. For each criterion and impact area, one or more indicators are constructed
e.g. direct quantitative.
The M3ICA can be summarized in 6 iterative steps, which are presented in Figure 4.

Figure 4. The pre and real-life demonstration evaluation framework.

Steps 1 and 2
Actors (or stakeholders) are identified (1a, A15.2 - Stakeholder forum, major events
and demo events organisation), and key objectives of each stakeholder group are
defined and referred to as criteria (1b) which are in turn given a weight by relevant

D9.1 Evaluation Framework                                                              18
stakeholders (1c). Scenarios of the f AV mobility and logistics systems are defined in
consultation with stakeholders and will be aligned to pilot projects (A1.3).
Step 3
Following a literature review on AV deployment, effects and the outcomes of
Cooperative, Connected & Automated Mobility (CCAM) are delineated by impact
areas and order of impacts and will support defining KPIs (step 5) The work on the
KPIs is done in A9.4 - Impact assessment framework, tools and KPIs definition.
Steps 4 and 5
In step 4, a pilot specific performance indicator framework will be introduced, see also
the ‘V-diagram’ in Figure 5. This work is mainly done in A9.1 - Plans for pilot
evaluations.
More in detail, in step 4 the focus is on demonstrations and simulations.
Data collections will be done under real life conditions in the demonstrations, and in
simulations. The evaluation of the Demonstrations in SHOW uses the methodology
developed for Field Operational Tests (FOTs) by the European union funded project
FESTA (Field opErational teSt supporT2 and the Trilateral Impact Assessment
Framework 3. The FESTA project developed a handbook on FOT methodology to
improve comparability and significance of results at national and European levels.
A FOT is here defined as a study undertaken to evaluate a function, or functions, under
normal operating conditions in road traffic environments typically encountered by the
participants to identify real world effects and benefits. FOTs were introduced as an
evaluation method for driver support systems and functions with the aim of proving that
such systems can deliver real-world benefits. Although the FESTA methodology was
originally developed for other types of systems and functions than the transport
systems evaluated in SHOW, the FESTA methodology provides a way of harmonizing
the preparations and testing across pilot sites to facilitate a consolidated evaluation.

Figure 5 shows a modified version of the FESTA methodology, i.e. the steps that will
be carried out during the evaluations in SHOW presented as a V-diagram. This version
of the demonstration evaluation framework (D9.1) will focus on the preparation part on
the left-hand side of the diagram.

2http://fot-net.eu/wp-content/uploads/sites/7/2017/04/FOT-Net-D5.4-Updated-Version-of-the-FESTA-
Handbook-v1-1.pdf
3https://connectedautomateddriving.eu/wp-
content/uploads/2017/05/Trilateral_IA_Framework_Draft_v1.0.pdf

D9.1 Evaluation Framework                                                                          19
Figure 5. V-diagram modified from the FESTA handbook.

Step 4 also includes simulations. They are done in WP10 “Operations simulation
models platform and tools” and will cover various kinds of simulations associated with
urban mobility. This includes traffic simulations on different levels, pedestrian
simulation, public transport simulation and many other related simulations. Since it is
not easy to combine so many different simulation methods under one roof, a
classification of simulations was elaborated in WP10, which reflects the focus in
SHOW. As shown in Figure 6, the main distinction is made between “City/district level”
simulations and “street level” simulations. The former is a more aggregated level with
focus on larger areas, whereas the latter deals with individual movements of
participants. The terms macro- and micro-simulation were deliberately not chosen as
these are defined for traffic simulations and SHOW has a wider focus, which includes
mobility of persons. On street level, simulations mainly cover three aspects: 1.
Automated driving to simulate movements of automated vehicles, 2. Walking to
simulate pedestrians and passengers, and 3. Taking a ride to simulate the behaviour
of DRT and public transport.

D9.1 Evaluation Framework                                                           20
Automated Shuttle        Freight Position
                                                             Test Route
                                                                                      Other car
 City / District Level                                       Automated DRT vehicle
                                                             Charging station         Public Transport
                                                                                      Position
                                                              Public Transport Stop     …

                                                                      ③ Taking
                                                                       a ride

                                     V2X
 Street Level        ① (Automated)
                        Driving               Intersection

                                              ② Walking

Figure 6. Classification of simulation activities in SHOW (according to D10.1)

The simulation methodology includes several stages and refinements. First, a small
set of simulations will be carried out that covers all the main classifications of
simulations as described above. These simulations will be linked to selected, concrete
pilot sites of SHOW. In a second round, the simulations will be refined and extended
to a higher number of pilot sites. The simulations will be aligned to the KPIs developed
in WP9 and the simulation results will be fed to the impact assessment being
conducted in WP13. More detailed information on the simulation framework will be
found in deliverable D10.1 (to be published in October 2020).
Step 6
The M3ICA is the evaluation framework of the demonstrations (pre and real life) and
FESTA is used as the framework for the Demonstration evaluation that will provide
data to use together with the simulations. The systems that will be evaluated are
incorporated in the scenarios. In step 6 the analysis takes place that will serve as input
for the understanding of the use cases.

D9.1 Evaluation Framework                                                                                21
3 Pre-demonstration and real-life Demonstration
sites – an overview
The SHOW project includes Mega Sites, Satellite Sites and Follower Sites, see Figure
7. In total 18 areas will be involved in Demonstrations activities. In Chapter 13 an
overview of each demonstration site is presented.
The Mega Sites include the following The Satellites include the following
countries and cities: countries and cities:
France: Rouen and Rennes Finland: Tampere
Spain: Madrid (2 areas) Denmark: Copenhagen
Austria: Graz, Salzburg, Italy: Torino
Vienna
Greece: Trikala
Germany: Karlsruhe,
Mannheim and Aachen. Netherlands: Eindhoven
(Brainport)
Sweden, Linköping and Kista
Czechia: Brno
In addition, three followers are identified, where Post-demo services replication will
take place. These are not addressed in D9.1 but will be included in next versions of
the framework.
Belgium, Brussels
Greece, Thessaloniki
Switzerland, Geneva
Mega Sites Satellite Sites Follower Sites Technical verification
and commissioning Site
Tampere
Copenhagen
Brainport/ SWEDEN
Eindhoven
GERMANY
Belgium
Brno
FRANCE AUSTRIA
Ispra
SPAIN
Thessaloniki
Trikala
Torino
Geneva
Figure 7. Mega Sites and Satellites in SHOW.
D9.1 Evaluation Framework 22The SHOW piloting and demonstration plan consists of 5 distinctive phases:
Licensing/Authorisation where the respective permissions, if required, for
real-life demonstrations will be acquired. This will be handled in WP3 Ethical
and legal issues.
Technical verification & Commissioning that will be held either in OEM labs
or at the JRC site in Ispra. This will be done in WP11 Technical verification and
pre-demo evaluations.
Pre-demo evaluation that will be held in real traffic but with no passengers
(only internal Consortium representatives from demo sites will participate in this
phase). Those evaluations can be seen as rehearsals for the Real-life
demonstrations. The planning work of the evaluations will be done in WP 9 Pilot
plans, tools and ecosystem engagement and the realisation will take place in
WP 11 Technical verification and pre-demo evaluations.
Real-life demonstration is where the actual real-life demonstrations will take
place at the demo sites. This will be done in WP12 Real-life Demonstrations,
and the evaluation framework will be defined and described in WP 9 Pilot plans,
tools and ecosystem engagement.
Post-demo services replication with follower sites (existing and those
connected during the project, including extra-European ones). This will be done
in WP12 Real-life Demonstrations.
The Pre-demonstrations and Real-life demonstrations will take place during roughly 24
months; the first 9 months as pre-demonstrations to secure the safe and reliable
operation and commit relevant services in a modular manner, followed by full-scale
Real-life Demonstrations taking place for almost 18 months in total. The pre-
demonstrations are considered as “rehearsals” for the Real-life Demonstrations. The
generic time plan for the period when the preparations, pre-demonstrations, real-life
demonstrations and post-demos will take place is presented in Figure 8.
SHOW time duration M1 M6 M12 M18 M24 M30 M36 M42 M48
SHOW project S M1 – M48 E
Licensing/
Authorisation S M1 – M15 E
Technical verification &
commissioning
S M11 – M20 E
Pre-demo
evaluation
S M14 – M24 E
Real-life E
demonstration
S M24 – M42
Post-demo services S
replication
M43 – M48 E
S Start E End
Figure 8. SHOW demonstration time plan
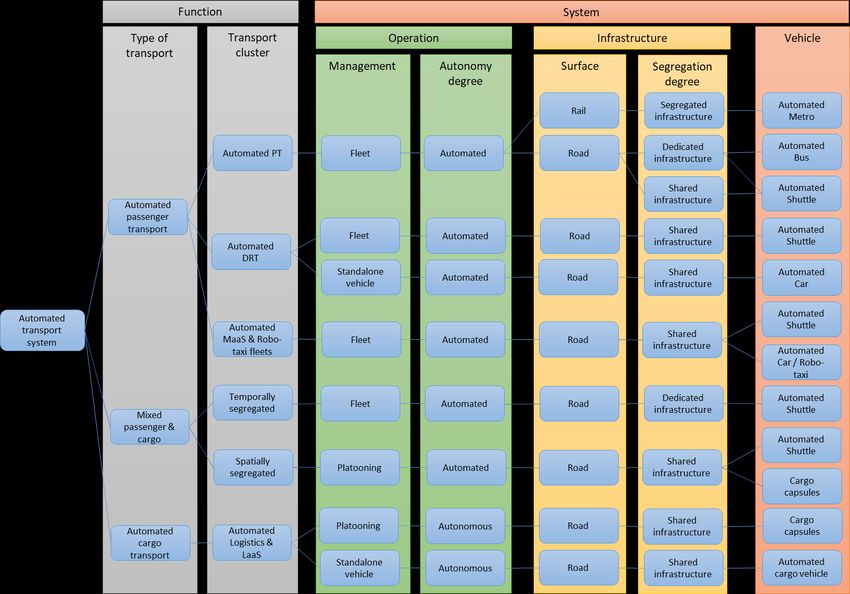
D9.1 Evaluation Framework 234 Function and system identification
In Step 4 and Step 5 in M3ICA analysis, Figure 4 data collections in demonstrations
and simulations will take place.
SHOW will cover a wide range of coordinated shared automated vehicle systems.
Thus, the SHOW Pilots will include automated Public Transportation (PT) (buses and
metros), automated shuttles for Demand Response Traffic (DRT) services and
automated Mobility as a Service (MaaS) fleets for passenger transport as well as AVs
for pure cargo delivery and for mixed passenger/ cargo transport. Combined
automated transport of people and goods will be tested in spatial (same vehicle -
different compartments) and temporal (different times of day) forms.
At several sites, there are integrated MaaS services with automated, non-automated
and multi-modal chains, and the connected automated fleets operation is being
integrated at the actual city TMC, including interfaces to other car sharing solutions, e-
bike and bike rental, etc. Feeder services to peri-urban and low-density urban areas
also take place with automated fleets operating fully autonomously or (for longer
distances between the urban and peri-urban area) utilizing urban platoons.
The pilot sites will support a mix of both fixed time-table solutions and on-demand
solutions with flexible bus stops along the road-side. Connected MaaS solutions will
integrate not only motorised solutions but also prioritised infrastructure for pedestrians
and cyclists. The technical aspects of these automated functions and systems will be
described below.
4.1 Systems
4.1.1 Vehicles
SHOW will utilize an overall fleet of over 70 AVs of all types (buses, shuttles, pods,
cars) operated as PT, DRT or as MaaS/LaaS. They are on SAE L4 or L5 and based
on existing vehicle concepts that are being further elaborated (TRL7) as well as on
novel concepts (of initial TRL5-6); that are brought to TRL8 (i.e. automated cargo
vehicle of UNIGENOVA). All test vehicles to be used at demonstration sites are electric
and are presented in Table 1.
Table 1. Vehicles per site
Megasite/ City
Vehicles
satellite
5 I-Cristal (Shuttle)
Rouen 4 Renault Zoe (Robo-taxi)
France
3 Navya (Shuttle)
Rennes
3 Easymile (Shuttle)
1 IRIZAR - i2eBus – (Coach
Electric L3)
Madrid, Depot 2 TECNOBUS - EMT -
Spain
Gulliver (Electric Minibus L2)
2 RENAULT - TECNALIA -
Madrid Twizzy (Passenger car – L2)
D9.1 Evaluation Framework 241 Ford Fusion (Passenger
Graz car)
1 Kia e-Soul (Passenger car)
1 EasyMile EZ10, Gen 3
(Shuttle)
Salzburg
1 PT bus/shuttle (subject to
Austria negotiations)
2 Navya ArmaDL4 (Shuttle)
Vienna 1 Navy Autonomous Cab
(Robo-taxi)
2 EasyMile EZ10, gen 2
(Shuttle) Audi Q5 (Passenger
Karlsruhe car)
1 modular vehicle from DLR
(in planning)
5 (brand tbd) (Shuttles)
Mannheim
Germany
1 BMW i3, 2 vehicles -
retrofitted for ADF / V2V testing.
Aachen, DE 2 e.GO Movers
Quelle: e.GO MOOV
GmbH
1 Navya Autonomous DL4
(Shuttle)
1 EasyMile EZ10 gen 2
Linköping
(Shuttle)
Sweden 1 tbd (hopefully - large
electrified AV bus)
1 t-engineering CM7
Kista 2 state of the art AV (Shuttle)
2-3 Sensible 4 (Shuttle
buses)
Finland Tampere
2-3 Pods (alternatively all
vehicles may be shuttles)
3 brand tbd (Shuttles)
Denmark Copenhagen 2 brand tbd (City mid-sized
Buses)
1 AV Shuttle - NAVYA DL4
1 retrofitted tele-operated car
Italy Turin
(still to be defined, provided
by the Municipality of Turin)
2 AMANI Swiss Cyprus
Limited (iDriverPlus,
Zhongtong Bus)
Greece Trikala 1 FURBOT cargo vehicle
UNIGENOVA
2 BMW i3 (Passenger cars –
Platooning)
D9.1 Evaluation Framework 251 tbd (E-Bus)
Netherland Eindhoven 3 Renault Scenic (Passenger
cars)
1 EasyMile (Shuttle)
1 tbd (Shuttle)
Czechia Brno
1 Hyundai i40 Retrofitted
(Robo-Taxi)
4.1.2 Environment
The SHOW Pilots will take place in dedicated lanes but also in mixed flows, under real-
life conditions. All urban traffic environments are represented, from dense city traffic to
remote peri-urban areas and neighbourhoods, specific environments (University
campus, hospital areas, business districts, cargo depot, link to key multi-modal hubs
as airports or rail stations). The first draft of type of environment to use is seen in Table
2. This will be revised in the updated deliverable (D9.2) using the work of WP8
“Infrastructure and functions”.
Table 2. Overview of the environment at different sites.
Mega site/ City
Environment Map
Satellites
Four different solutions
will be demonstrated: 1.
Automated Vehicles on
open road in complex
situations (thin blue line)
2. Automated PT line
connecting activity zone
Rouen
to the centre (bold blue
line) 3. Robo-taxi service
within the historic area
France (green area) 4.
Connected to the biggest
multi-modal hub of the city
(dotted line)
A hospital area with
Rennes transportation of patients.
D9.1 Evaluation Framework 26Restricted area - a
modern depot with
different bus technologies
(CNG, Hybrid, Electric).
Madrid, Depot
Semi-Controlled Area
Interaction with other non-
autonomous buses and
vehicles.
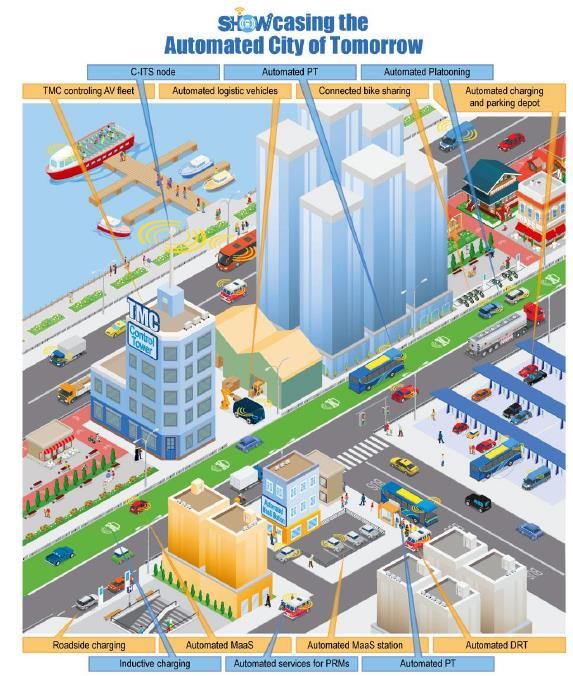
Urban and suburban: La
Spain
Nave (Madrid City
Innovation Hub)
Villaverde Bajo-Cruce
Metro Station
Madrid
800 m per journey (1,6 km
line), driving in open
traffic, including
roundabouts. Maas
concept will be used.
An automated shuttle
service between a
suburban train station of
Graz and a destination
with high traffic demand
(shopping centre) will be
Graz established with two
automated vehicles.
With help from traffic
infrastructure (e.g. guiding
through traffic lights),
vehicles will perform
Austria actions automated.
From the City of Salzburg
to the peri-urban regions
for leisure and recreation
Salzburg
activities as well as for
commuters, all in mixed
traffic on public roads.
Urban quarter in the city
of Vienna travelling to
Vienna
industrial/commercial
park.
Urban and peri-urban city
areas and quarters with
digital and connected
Karlsruhe infrastructure and HD-
mapping. Final route choice
currently being evaluated.
Germany
Peri-urban housing area,
calmed traffic zone,
Mannheim subordinate access roads,
barrier-free access to
AVs.
D9.1 Evaluation Framework 27Peri-urban Campus.
Aachen
Urban Campus area (the
red area at the top) and a
residential area (bottom
right red area).
Linköping
Sweden
An urban area with mainly
office buildings.
Kista
The new automated light
rail between Hervanta
suburb and TAYS
Finland Tampere University Hospital
Campus area will be
connected with automated
buses.
The test area is at
Denmark Copenhagen Lautrupgaard site, in
Ballerup.
The demonstration will
take place in the City of
Italy Turin
Turin at the Health and
Science area.
Trikala site is 330 km from
Athens and includes both
Greece Trikala a suburban and an urban
part. The same site as in
City Mobile 2 will be used.
Urban area. A part of the
city that is one of the
Netherland Eindhoven
front-runner cities for C-
ITS deployment.
Urban area. The setting
from the former project C-
Czechia Brno
ROADS CZ will be partly
used.
D9.1 Evaluation Framework 284.1.3 Digital infrastructure
All types of digital infrastructure and communications are employed at project sites of
SHOW; among others 4G to 5G, LTE/IoT/ C-ITS G5 based interfaces for
communication with non-equipped traffic participants, utilizing EGNOS/Galileo
advanced positioning technologies, “Open message definitions” for all C-ITS
stakeholders and relevant protocols and extended TM2.0 standard protocols are used,
see Table 3.
Table 3. Overview of digital infrastructure at different sites
Country City/Site Digital Infrastructure/sensors and systems
ITS 5G networks, secure telecommunication networks,
4G+/5G, lidars, connected cameras, connected traffic
lights. A supervision center integrated in the PT control
Rouen
room in Rouen. A user app to request transportation,
France smart infrastructure and secure telecommunications
networks.
ITS 5G networks, secure telecommunication networks,
Rennes 4G+/5G, lidars, connected cameras, connected traffic
lights.
Madrid, Depot RSU ETSI-G5, 4G, EGNOS/Galileo OBU Lidar.
C- ITS (CCAM concept): Hybrid communication (RSU-
Spain
Madrid ETSI ITS G5 – 5G), V2V, V2I. DGPS, Cameras, Radars,
Lidars.
Graz ITS-G5, 4G or 5G
RSU ETSI-G5, 3GPP 4G (LTE)
ITS G5, 4G or 5G:
GNSS correction system
Austria Salzburg
RSUs (related and not related to TLC) and OBU:
Sensors: LiDARs, IMU, radar, odometry (all part of the
EZ10 Gen 3 shuttle); cameras
Vienna V2X will use ITS G5
Roadside units (WLAN 802.11p ITS-G5), e.g. CAM,
Karlsruhe
DENM, SPaT and MAP messages; LTE
Germany
Mannheim LTE network. 5G, Cellular V2X required
Aachen 4.5G network
SAFE platform: connected Traffic Tower with remote
Linköping
monitoring & tele-operation
Sweden
Scalable 5G Connected Traffic Tower with remote
Kista
monitoring & tele-operation
LTE/5G and ITS G5. 5G & 4G network, intelligent lighting
Finland Tampere systems etc. will be complemented whenever required.
LoRaWAN
Denmark Copenhagen C-ITS, 5G
TM system (TOC operated by 5T): traffic sensors,
Intelligent Traffic Light Systems (51Centralised TLs; 39
Italy Turin TLSwith PT Priority; 7 existing TLA-Traffic Light Assistant
Enbled; 10 planned TLA Enabled), PMVs and 5G to be
deployed completely by 2021.
4G, 5G, optic fibers network, Proximity sensors on traffic
Greece Trikala
lights
L5 technology enhanced by hybrid ITS G5/cellular C-ITS
Netherland Eindhoven services, full 4G coverage, early 5G deployment and IoT
service networks.
Czechia Brno 4G. 6 Roadside units for C-ITS infrastructure
D9.1 Evaluation Framework 29You can also read