The development of scenario analysis tools to help IKEA set and follow up climate footprint goals
←
→
Page content transcription
If your browser does not render page correctly, please read the page content below
The development of scenario analysis
tools to help IKEA set and follow up
climate footprint goals
Master’s thesis in Industrial Ecology

Marcus Bernhard

DEPARTMENT OF TECHNOLOGY MANAGEMENT AND ECONOMICS
DIVISION OF ENVIRONMENTAL SYSTEMS ANALYSIS

CHALMERS UNIVERSITY OF TECHNOLOGY
Gothenburg, Sweden 2021
www.chalmers.se
Report No. E2021:057
REPORT NO. E 2021:057

The development of scenario analysis tools to help
 IKEA set and follow up climate footprint goals
 Marcus Bernhard

 Department of Technology Management and Economics
 Division of Environmental Systems Analysis

 CHALMERS UNIVERSITY OF TECHNOLOGY

 Gothenburg, Sweden 2021
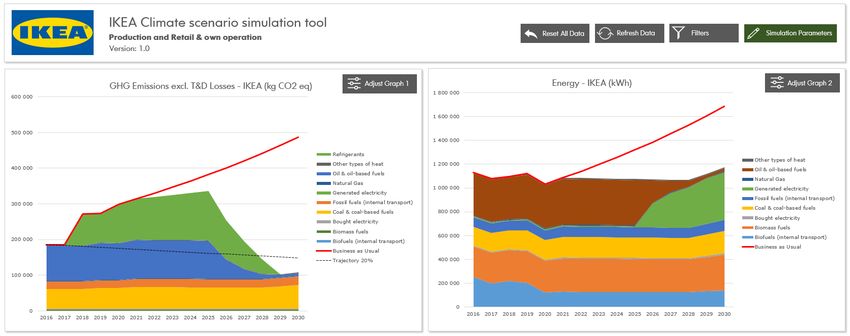
The development of scenario analysis tools to help IKEA set and follow up climate footprint goals
Marcus Bernhard

© Marcus Bernhard, 2021.

Report no. E2021:057
Department of Technology Management and Economics
Chalmers University of Technology
SE-412 96 Göteborg
Sweden
Telephone + 46 (0)31-772 1000

Cover:
The dashboard of the simulation tool developed in this project (dummy data used).

Gothenburg, Sweden 2021
The development of scenario analysis tools to help IKEA set and follow up climate footprint goals

Marcus Bernhard

Department of Technology Management and Economics
Chalmers University of Technology

SUMMARY

IKEA has joined the Science Based Target initiative in an effort to stay in line with what the latest
science says is necessary to limit global warming to 1.5 °C. To enable a fact-based approach for
setting and evaluating climate targets within IKEA, tools are necessary. The use of scenario analysis
has been recognised as a good way to evaluate alternative options for setting climate targets and
plans. Scenario analysis can for example be used to evaluate what will be the impact if a supplier
purchases electricity from renewable energy sources instead of fossil based. Several scenario analysis
simulation tools have already been developed at IKEA. This project has continued the development of
these tools.

To understand the needs of the organization and how the existing simulation tool has been used,
stakeholder interviews were conducted. The main identified concerns were that the tool was not
always available with the latest data, it was perceived as hard to use, it did not always fulfil the need
of a certain user, and it was sometimes unclear who had the responsibility of running the simulations.

Based on the interviews, two simulation tools have been developed as part of this project. One will be
used to set and evaluate climate targets for tier 1 suppliers and the IKEA stores, and the other tool is
intended to be used for food ingredients. The main efforts have been put at creating a standardised
data structure to allow for a simpler process of updating the simulation tool with new data. The
usability of the tool has also been improved.

The project has also investigated the implications of using Attributional Life Cycle Assessment data
in a tool for decision making. It was identified as a good approach for improving the environmental
performance of the value chain. To make sure unintended consequences are avoided outside the value
chain, a number of principles are suggested that should be used in conjunction with the simulation
tool.

Keywords: scenario analysis tool, simulation tool, corporate climate targets, decision making,
attributional life cycle assessment, consequential life cycle assessment, greenhouse gas emissions,
climate footprint.
Acknowledgement
This master's thesis has been written as a final part of my education in Industrial Ecology at Chalmers
University. The project has been carried out at IKEA where I have investigated the needs of the
organisation and developed scenario analysis tools to set and evaluate climate footprint targets. I
would like to express my greatest gratitude to IKEA for letting me take part of your journey of
becoming climate positive. It has been such an inspiring experience. All the people I have met at
IKEA has been very welcoming and helpful with their knowledge and time.

I would like to direct a special thank you to my supervisor at IKEA, Andreas Ahrens as well as to
Patrik Sander. You have devoted a lot of time and effort in providing guidance and expertise to create
the best possible outcome.

Furthermore, I would also like to express my greatest gratitude to my supervisor at Chalmers, Tomas
Ekvall for providing valuable feedback along the project. I have highly appreciated the discussions we
have had on life cycle assessments and sustainability.

Gothenburg, June 2021

Marcus Bernhard
Glossary
Attributional LCA Determines who and to what extent an actor is considered
 responsible for environmental impact.
Consequential LCA Evaluating the environmental consequences of a decision.
Excel UserForm UserForm is used to build user interfaces within Excel to be able
 to collect and process user input. Used in conjunction with VBA
Excel VBA VBA (Visual Basic Application) is the programming language
 used in Excel to automate tasks and calculations.
Gross biogenic CO2 emissions The instant CO2 emissions occurring when for example burning
 biofuels. The natural carbon cycle not included.
IKEA climate team The team within IKEA responsible for the overall climate
 positive agenda at Inter IKEA Group and the total IKEA value
 chain, including collecting and reporting the total IKEA climate
 footprint. More formally called the climate positive team.
Net biogenic CO2 emissions The CO2 emissions when expected absorption is included.
Scenario analysis Scenario analysis is looking into and evaluating images of the
 future, or alternative futures.
Scope 1 emission Direct GHG emissions from sources that are owned and
 controlled by the reporting company.
Scope 2 emission Emissions that come from the generation of purchased electricity,
 steam, and heating/cooling.
Scope 3 emission All other indirect emissions from sources not owned by the
 reporting company.
Simulation The technique of imitating the behaviour of some situation or
 process.
Tier 1 suppliers Suppliers who deliver parts and products directly to the company
 without any middle hand.

Abbreviations
ALCA Attributional Life Cycle Assessment
BA Business Area (within IKEA)
BI Business Intelligence
BOM Bill Of Material
CA Category Area (within IKEA)
CHP Combined Heat and Power
CLCA Consequential Life Cycle Assessment
CO2-eq Carbon dioxide equivalent
GHG Greenhouse gas emissions
GO Guarantees of Origin
IEA International Energy Agency
IPCC Intergovernmental Panel on Climate Change
LCA Life Cycle Assessment
REC Renewable Energy Certificates
SBTi Science Based Target initiate
VBA Visual Basic Application
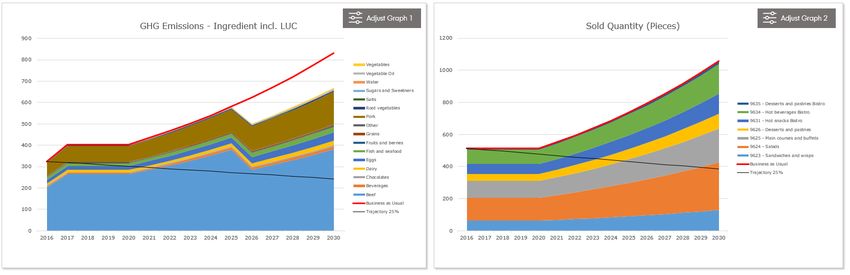
Table of Contents
1 Introduction .................................................................................................................................... 1

 1.1 Background ............................................................................................................................. 1

 1.1.1 Emission areas at IKEA .................................................................................................. 2

 1.2 Related work ........................................................................................................................... 4

 1.3 Aim and research questions .................................................................................................... 4

 1.4 Scope and limitations .............................................................................................................. 5

2 Theoretical background .................................................................................................................. 7

 2.1 Scenario analysis and simulation for decision support ........................................................... 7

 2.1.1 The simulation modelling process .................................................................................. 8

 2.2 Science based target initiative ................................................................................................. 9

 2.3 Greenhouse Gas Protocol ...................................................................................................... 10

 2.4 The use of attributional LCA data in a decision-making tool ............................................... 11

3 Method ......................................................................................................................................... 14

 3.1 Literature review ................................................................................................................... 14

 3.2 Stakeholder interviews .......................................................................................................... 14

 3.3 Implementation, usability testing and verification ................................................................ 16

4 IKEA priorities - results from the stakeholder interviews............................................................ 19

 4.1 Findings from the stakeholder interviews ............................................................................. 19

 4.2 Requirements for the production and retail & other operations simulation tool ................... 21

 4.3 Requirements for the food ingredients simulation tool ......................................................... 22

 4.4 Defining a standardised data format for production, IKEA retail & other operations .......... 23

 4.4.1 Requirements for the standardised data collection format ............................................ 25

5 Implementation and result ............................................................................................................ 26

 5.1 The standardised data format for production, IKEA retail & other operations ..................... 26

 5.2 Development and results of tools to update the simulation tools.......................................... 31

 5.2.1 Production, IKEA retail & other operations ................................................................. 32

 5.2.2 Food ingredients............................................................................................................ 34

 5.3 Selection of platform for the development of simulation capabilities .................................. 35
5.4 Development of the simulation tools .................................................................................... 39

 5.4.1 Production, IKEA retail & other operations ................................................................. 39

 5.4.2 Food ingredients............................................................................................................ 43

 5.5 The result of the simulation tools .......................................................................................... 45

 5.5.1 Production, IKEA retail & other operations ................................................................. 45

 5.5.2 Food ingredients............................................................................................................ 55

 5.6 Findings from the user testing ............................................................................................... 63

6 Discussion .................................................................................................................................... 64

 6.1 Usability and user competence ............................................................................................. 64

 6.2 Technical issues and solutions .............................................................................................. 65

 6.2.1 Uncertainties of the simulation model .......................................................................... 67

 6.3 Governance ........................................................................................................................... 68

 6.4 Further user needs ................................................................................................................. 69

 6.5 The implications of using attributional LCA data as a basis for decision-making ............... 69

7 Conclusion.................................................................................................................................... 71

 7.1 Further recommendations ..................................................................................................... 72

References ............................................................................................................................................. 73

Appendix A – Occasions and participants of the stakeholder interviews and usability testing ............ 78

Appendix B – Relational data model, entity descriptions ..................................................................... 79

 Volume Entity................................................................................................................................... 79

 Facility Entity ................................................................................................................................... 80

 EmissionSource Entity ..................................................................................................................... 81

 EmissionSourceCountrySpecific Entity ........................................................................................... 82
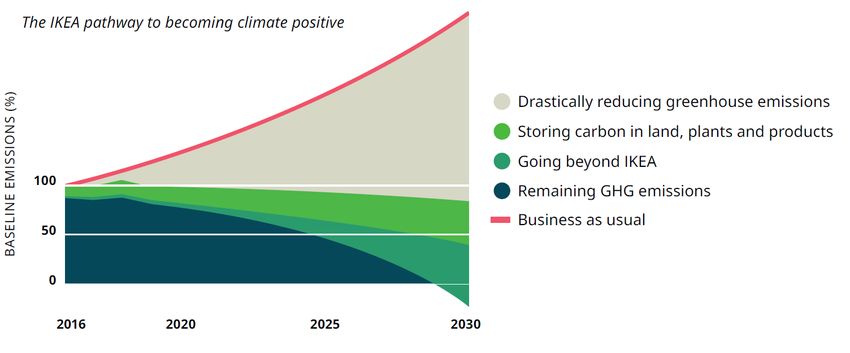
1 INTRODUCTION
This section will provide a general background to IKEA and why scenario analysis is needed to help
in the process of evaluating and setting climate targets. It will also present related work before
moving into explaining the aim and research questions used in the project. Finally, the scope and
limitation will be presented.

1.1 BACKGROUND
IKEA provides a wide range of affordable, ready-to-assemble, home furnishing products based on the
vision to “create a better everyday life for the many people”. To enable a long-term success of its
business IKEA has developed a sustainability strategy called “People & Planet Positive” (Inter IKEA
Systems B.V., 2020). IKEA wants to create a sustainable business model that should have a positive
impact on people, society, and the planet. This means that business should grow within the boundaries
of the planet and in a better balance with economic, social, and environmental aspects. One of the
focus areas of the sustainability strategy is to become “Circular & climate positive”. IKEA has joined
the Science based target initiative (SBTi) to set greenhouse gas (GHG) emission reduction targets to
be in line with what the latest science says is necessary to stay within the limits of 1.5 °C global
warming. In the IPCC special report “Global Warming of 1.5 ºC” it is stated that it is important to stay
within 1.5 °C to avoid many of the most severe effects of global warming, such as costal flooding and
extreme weather events (IPCC, 2018). In addition to the commitment within this initiative, IKEA is
committed to become climate positive by 2030, thus removing more greenhouse gas emissions than
the IKEA value chain emits, while growing the IKEA business (Inter IKEA Systems B.V., 2021; see
Figure 1). The first step to achieve this is to drastically reduce greenhouse gas emissions in absolute
terms from its operations and supply chain – both upstream and downstream. Some activities to reach
this goal are to: promoting sustainable choices, transforming into a circular business, striving to 100%
renewable energy across the IKEA value chain and by using more sustainable materials. This is
estimated to reduce the climate footprint by at least 15% by 2030 for the entire IKEA value chain
(corresponding to about 70% reduction per product, in relative terms).

To further reach net zero IKEA aims at storing carbon in land, plants, and products. The
methodologies for these are currently under development within IKEA and are not included in this
project.

 1
Figure 1. The IKEA pathway to becoming climate positive (Inter IKEA Systems B.V., 2021).

Within the SBTi, IKEA has set an overall ambition for the organisation. But how should these targets
be reached? What actions are necessary and are those enough to reach the targets? To have a fact-
based approach when setting and following up climate goals and actions, tools are necessary. Today,
tools are available for climate performance follow-up, but IKEA wants to develop its capabilities for
scenario analysis and simulation to be able to evaluate the impact of plans and future actions. Several
scenario analyses tools have previously been developed and used within IKEA for evaluating and
setting climate targets. These tools covered emissions related to production, food, product use at home
and to some extent materials. This project has continued the development of these tools with the
initial ambition to cover more parts of the IKEA value chain.

1.1.1 Emission areas at IKEA
IKEA calculate and report their GHG emissions in eight activity areas. These are materials, food
ingredients, production, product transport, IKEA retail & other operations, customer travel & home
deliveries, products use at home and product end-of-life. The climate footprint (the GHG emissions of
the IKEA operations) for each area for the financial year 2020 is presented in Figure 2. As seen in the
figure, the biggest footprints are from material, product use at home and production. In this report the
terms climate footprint data and climate data will be used interchangeably.

 2
Climate footprint at each stage of the IKEA value chain
 FY20
 12
 Million tonnes CO2-eq

 10

 8

 6

 4

 2

 0
 Materials Food Production Product IKEA retail Customer Product use Product end-
 ingredients transport & other travel & at home of-life
 operations home
 deliveries

Figure 2. The yearly climate footprint at each stage of the IKEA value chain for the financial year 2020 (September 1st, 2019
 to August 31st, 2020) (Inter IKEA Systems B.V., 2021).

A more detailed description of what is included in each emission area is presented in Table 1.

 Table 1. The emissions areas included in the IKEA climate footprint (Inter IKEA Systems B.V., 2021).

 CATEGORY EXPLANATION
 Materials By far the biggest contributor to the IKEA climate footprint (45%).
 Includes emissions from raw material extraction and processing of
 materials up to the entry gate of tier 1 suppliers (suppliers that provides
 parts and products directly to IKEA). The calculations are mainly based
 on estimation which results in large uncertainties in the numbers.
 Food ingredients 3% of the total climate footprint. Includes emissions from raw material
 extraction and processing of ingredients up to the entry gate of tier 1
 suppliers.
 Production The third biggest contributor to the IKEA climate footprint (12%).
 Includes scope 1, 2 and to some extent scope 3 emissions from tier 1
 suppliers. Includes both external suppliers, IKEA Industry, and IKEA
 Components for the supply of home furnishing products, food,
 components, and print. The footprint is reported on supplier level and not
 on product level.

 Product transport 5% of the total climate footprint. Includes emissions from upstream
 product transport (home deliveries not included)

 IKEA retail & other 3% of the total climate footprint. Emissions from the IKEA stores, offices,
 operations and similar operations.
 Customer travel & 6% of the total climate footprint. Includes emissions occurring from
 home deliveries customer traveling to the stores and for customer home deliveries.

 Product use at home The second biggest contributor to the IKEA climate footprint (22%).
 Emissions occurring during the use phase of sold products. Can be
 products such as lighting, appliances, and candles. The emissions come
 mainly from the consumption of electricity used by the products.
 Product end-of-life 4% of the total climate footprint. The estimated emissions related to end-
 of-life treatment of sold products, where a cut-off methodology is applied.
 3
It is within these emission areas the scenario analysis capabilities need to be developed. For each area
IKEA needs to set a target (if not already done), and to set and evaluate plans to see if they are in line
with the target. Which emission areas that are included in the project is described in scope and
limitation, section 1.4.

1.2 RELATED WORK
This project builds on the work done by Sander & Skoog (2017). They developed a simulation tool
for IKEA to be able to do scenario analysis to support decision making when setting climate targets.
The following research questions were explored in their study:

 1. Which are the emission drivers relating purchased goods and services, and use of sold
 products in the IKEA scope 3 emission system?
 2. Which parameters can be applied to allow steering on the emission drivers?
 3. How should a simulation tool be designed to address and capture the behaviour and
 characteristics of the emission drivers in the scope 3 emissions system?

The focus of the study was to capture scope 3 emissions from the IKEA value chain. More
specifically the authors looked at emissions from raw materials, food ingredients, production, and
product use at home. A big part of the study was to identify the emission drivers for the different
emission areas, meaning what causes the GHG emissions. This was done by conducting workshops
with relevant stakeholders within business control and sustainability functions, as well as external
experts. These emission drivers were implemented into a simulation tool developed in Excel. They
concluded that the tool did provide good support for decision making. However, the simulation model
did not include uncertainties for the GHG inventory and for assumptions made in the model. The tool
did also have a very basic user interface and the user experience was thus limited. The authors
recommends that feedback should be collected from the users of the tool to make sure it is operational
and fulfils its purpose.

The simulation tool developed by Sander & Skoog (2017) has been further developed within IKEA
after the projected was finished, with a focus on creating a graphical user interface. Most of the effort
has been directed to simulation tools for production and food ingredients, with less effort spent on
materials and product use at home. The emission drivers developed by Sander & Skoog will be used
in this project and will be elaborated upon in section 5.5.

1.3 AIM AND RESEARCH QUESTIONS
The aim is to expand on the existing scenario analysis tools to enable a facts-based approach to
climate goal setting by analysing the climate footprint of different scenarios. The tools will be used to
support decision making. Also, a clearly defined collection and storing data format should be
 4
developed to allow for a standardised data management and a more automated update of the
simulation tools.

The following research questions will be elaborated upon during the project:

 • When expanding on the existing scenario analysis tools, what are the priorities and user needs
 for IKEA?
 • To what extent can these priorities and user needs be realised/operationalised?
 • How should a new data format be designed to allow for a more standardised data
 management for the emission areas production, IKEA retail, and other operations?
 • Is it legitimate to use Attributional Life Cycle Assessment (ALCA) data as input data in a
 decision support tool? What are the implications of such a choice?

1.4 SCOPE AND LIMITATIONS
A considerable amount of data related to GHG emissions are needed to construct relevant simulation
tools. IKEA yearly collects environmental performance data, and it is this data that will be used
throughout the project. It is thus out of scope to collect more data than already exists within the
organisation.

The time horizon used within the simulation tool is from the baseline year 2016 up until 2030.

The initial ambition was to cover all activity areas of the IKEA value chain. In the beginning of the
project, a prioritisation was developed in collaboration with the supervisor at IKEA to decide what
area should be implemented first. The prioritisation was as follows: production; IKEA retail & other
operations; food ingredients; materials; product transport; customer travel & home deliveries; product
use at home; and product end-of-life. However, due to time constraints the parts that ended being
included in the project are production, IKEA retail & other operations, and food ingredients. The
included activity areas will now be further explained.

Production
IKEA yearly collects sustainability data such as energy & GHG data, water usage and waste amounts
from tier 1 suppliers. The GHG emissions related to the ingoing material to the tier 1 suppliers is
captured by the material emission area (see Figure 2) and is therefore not included here. The climate
footprint calculations for each supplier are based on the provided energy and GHG data. As part of the
energy & GHG data, the suppliers provide information regarding electricity, fuel usage for production
and building, fuels for internal transport, refrigerants and sold renewable electricity and heat. IKEA is
using the emission factors provided by the Greenhouse Gas Protocol (GHG Protocol, n.d.-b) and the
International Energy Agency (IEA) to calculate the GHG emissions based on the provided activity
data (IEA, n.d.). The biggest drivers of the GHG emissions are the emission from purchased
electricity and from onsite use of fuels for production and heating.
 5
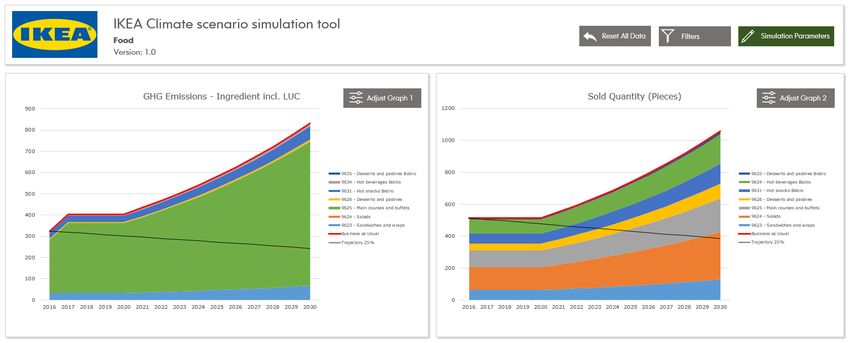
IKEA retail & other operations
Similar to production, IKEA collects sustainability data from all stores, offices, warehouses, and other
operations.

Food ingredients
There is a product information system, including a bill of material, connected to all food products.
With this information it is possible to find all ingredients of a product and their weight. The
information from the bill of material is combined with sales data and emissions factors from the
Ecoinvent LCA database to calculate the GHG emissions. The food emission area does only include
emissions related to raw material extraction and processing of ingredients up to the entry gate of tier 1
suppliers. Emissions from tier 1 processing is included in the production emission area. The main
emission driver is the emissions from meat, especially beef.

 6
2 THEORETICAL BACKGROUND

2.1 SCENARIO ANALYSIS AND SIMULATION FOR DECISION SUPPORT
Simulations has been used for a long time to forecast the behaviour of a system, such as the economy,
environmental pressures, and resource constraints (Swart, Raskin, & Robinson, 2004). An early
implementation of such a model was “Limit to growth” where present trends in economic and
technological growth was used to anticipate the trespassing of ecological limits (Meadows, 1972).
These are forecasting models that based on historical data tries to predict the future. The outcome of
these models can be used to steer business decisions. It was however recognised that the business
decisions themselves affected the outcome and thus needed to be taken into consideration in the
model (Huss, 1988). There was also a need to not just to create accurate forecasts but in assisting in
the planning for the future. Scenario analysis was introduced to incorporate the possibility for
business management to not just react to future conditions, but to evaluate different scenarios and then
develop strategies to change the conditions themselves (Huss, 1988).

The terms simulation and scenario are sometimes used interchangeably. Looking at the definition of
simulation it is defined as “the technique of imitating the behaviour of some situation or process”
(Oxford University Press, n.d-a). Scenario on the other hand is defined as “a postulated or projected
situation or sequence of potential future events” (Oxford University Press, n.d-b). The IPCC further
defines scenario as “scenarios are images of the future, or alternative futures. They are neither
predictions nor forecasts. Rather, each scenario is one alternative image of how the future might
unfold” (IPCC, n.d).

Moon (2015) conducted a literature review into how simulation modelling has been used within the
area of sustainability. As sustainability is a wide area, the reason of using simulation differs a lot
depending on the final application. Moon listed typical usage of simulation modelling as, (1) to
develop a better understanding and gain insights of a system, (2) to compare various plans and
scenarios before implementation, (3) to predict behaviours of a system, (4) to aid decision-making
processes, (5) to develop new tools for investigation and (6) for training. The interest for this thesis is
to use simulation modelling to aid decision-making (5) by comparing scenarios before
implementation (2).

An example of an environmental scenario analysis is the emission scenarios developed by the IPCC
(IPCC, 2000). They used advanced modelling and developed different scenarios depending on how
society might progress in the coming century. This model incorporates the complex interplay between
the social, economic and the nature aspect of society.

 7
2.1.1 The simulation modelling process
As described in the previous section, a simulation tries to imitate the behaviour of a system. A system
is generally defined as a collection of entities (Law, 2015). Law presents two ways to study a system.
Either run an experiment in the actual system or an experiment with a model of the system. If it is
possible and cost-effective it is generally recommended to run the experiment on the actual system.
However, this is rarely the case, and in such situations, it might be more feasible to do an experiment
on a model. To do an experiment with a model of the system there is a need for a physical model or a
mathematical model. A physical model is used to run physical experiments on objects such as a model
car. A mathematical model represents the logical and quantitative relationships between entities. The
mathematical model can be used to answer the question under investigation and can be solved by
either an analytical solution or a simulation. A simplified representation of the modelling process is
presented in Figure 3 (Sargent, 1981).

 Figure 3. A simplified version of the modelling process (Sargent, 1981)

The problem entity is the real-world system under investigation. In this project that included activities
and process that give rise to GHG emissions. The conceptual model is the mathematical
representation of the problem entity. It is developed in the analysis and modelling phase. If the
conceptual model is implemented on a computer, it is called a computerised model. During the phases
of the modelling process there is a need for validation and verification (V&V) to ensure the model
behaves as expected. Sargent (2010) defines model verification as “ensuring that the computer
program of the computerised model and its implementation are correct”. He further states that model
validation is normally defined as “substantiation that a computerised model within its domain of
applicability possesses a satisfactory range of accuracy consistent with the intended application of the
model”.
 8
Thus, verification is more about that the implementation is correct, with the correct use of formulas
and that little to no bugs are apparent. Validation is instead more about that the conceptual model
itself is correct and that the results are applicable for its intended users. It might be good to point out
that it might not always be possible to validate the model against the actual system (problem entity).
Oreskes (1998) splits models into two categories, models that can be validated and models that
cannot. For a model to be possible to validate it must: 1) be observable and measurable; 2) exhibit
constancy of structure in time; 3) exhibit constancy across variations in conditions not specified in
model; and 4) permit the collection of ample data. In the area of sustainability and environmental
systems, this is generally not the case. A model of an environmental system will thus generally be
evaluated against the scientific knowledge/agreement of how the system works.

Sargent (2010) explains three common ways of integrating V&V into the model developing process.
The first approach is to let the model development team themselves evaluate if the model is correct.
To avoid bias it is however better to use one of the other approaches. The second approach is to
involve the stakeholders and intended users of the model to verify its validity. The last approach is to
let an independent party to make the decision if a model is valid, often called “independent
verification and validation” (IV & V).

2.2 SCIENCE BASED TARGET INITIATIVE
IKEA is part of the Science based target initiative and have set targets which are in line with the Paris
Agreement. The emission reduction targets specified in the SBTi for IKEA are (SBT, n.d.):

 • “The IKEA home furnishing business commits to reduce absolute GHG emissions
 across the IKEA value chain (scope 1, 2 & 3) at least 15% by FY2030, from a FY2016
 base year.
 • Inter IKEA Group commits to reduce scope 1 and 2 GHG emissions 80% by FY2030,
 from a FY2016 base-year. For IKEA retail operations (scope 3), the franchisee Ingka
 Group commits to reduce absolute scope 1 and 2 GHG emissions 80% by FY2030, from
 FY2016.
 • Inter IKEA Group also commits to reduce absolute scope 3 GHG emissions from
 production at direct home furnishing, food, component and catalogue suppliers 80% by
 FY2030, from a FY2016 base year.
 • Inter IKEA Group and the franchisee Ingka Group commit to reduce scope 3 GHG
 emissions 50% per person for customer and co-worker travel and home deliveries by
 FY2030, from a FY2016 base year.

 9
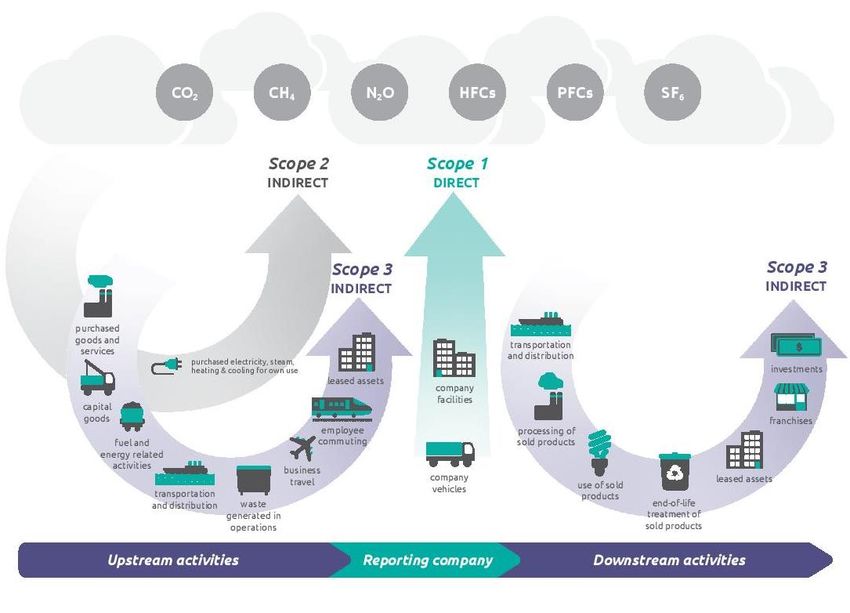
• Inter IKEA Group includes the IKEA franchisor, range development (including food),
 supply and some manufacturing activities. The target boundary includes biogenic
 emissions and removals from bioenergy feedstocks
 • The targets covering greenhouse gas emissions from company operations (scopes 1 and
 2) are consistent with reductions required to keep warming to 1.5°C.”

The SBTi encourages companies to set GHG emission reduction targets in line with what the latest
climate science considers to be necessary to meet the goals of the Paris Agreement (Science Based
Targets, 2021a). The Paris Agreement has a goal to limit global warming to well below 2 degrees
Celsius, with the ambition to limit warming to below 1.5 degrees, compared to pre-industrial levels
(U.N. Doc. FCCC/CP/2015/L.9/Rev/1, 2015). The SBTi is a collaboration between the World Wide
Fund for Nature (WWF), World Resources Institute (WRI), the United Nations Global Compact and
CDP. The SBTi issues a number of criteria and recommendations that applying companies has to
address (Science Based Targets, 2021b). All the criteria must be meet while recommendations are
suggestions for improved transparency and best practice, but not required. It is also stated that
companies must report their emissions in compliance with the Greenhouse Gas Protocol (GHG
Protocol) Corporate Standard, Scope 2 Guidance, and Corporate Value Chain (Scope 3) Standard.

2.3 GREENHOUSE GAS PROTOCOL
As described in the previous section, companies must comply with the GHG Protocol to be approved
by the SBTi. The GHG Protocol is a partnership between World Resources Institute (WRI) and the
World Business Council for Sustainable Development (WBCSD), and is the world most widely used
GHG accounting standard (GHG Protocol, n.d.-a). IKEA is using the methodology presented by the
GHG Protocol to calculate their GHG emissions. More specifically they are using the Corporate
Standard (WRI & WBCSD, 2004), the Scope 2 Guidance (WRI, 2015) and the Corporate Value
Chain (Scope 3) Standard (WRI & WBCSD, 2011). The GHG Protocol divides different types of
emissions into scope 1, 2 or 3 emissions, see Figure 4. Scope 1 emissions are direct GHG emissions
from sources that are owned and controlled by the reporting company. Examples of scope 1 emission
are emission from onsite combustion and vehicles. Scope 2 emissions are emissions that comes from
the generation of purchased electricity, steam, and heating/cooling. Scope 3 includes all other indirect
emissions from sources not owned by the reporting company, such as emissions from material
extraction and emissions that occurs in the user phase of sold products.

 10
Figure 4. The scopes of the GHG Protocol (WRI & WBCSD, 2011).

2.4 THE USE OF ATTRIBUTIONAL LCA DATA IN A DECISION-MAKING TOOL
There is an ongoing debate within the LCA community on the suitability to use attributional LCA
(ALCA) data for decision-making support (Brander, 2017; Ekvall, 2019; Weidema, 2003). The main
critique is that attributional accounting does not capture the full consequences of a business decision
and might in some cases lead to increased emissions (Brander, 2017; Plevin, Delucchi, & Creutzig,
2014). As described in section 2.3, IKEA is using the GHG Protocol for corporate GHG accounting
which is based on the attributional approach (Brander, 2017). The simulation tools developed in this
project are in turn using the data collected according to the GHG Protocol with the aim to support
decision making. Since the carbon footprint is essentially an LCA limited to greenhouse gases (ISO,
2018), the topic is of interest in this project.

As an alternative to ALCA, consequential LCA (CLCA) has been developed to provide information
on the consequences of a decision (Ekvall & Weidema, 2004). Ekvall (2019) explains the difference
as; “an attributional life cycle assessment (ALCA) estimates what share of the global environmental
burdens belongs to a product. A consequential LCA (CLCA) gives an estimate of how the global
environmental burdens are affected by the production and use of the product.”. The two methods are
thus used to answer different questions. Figure 5 visualises the difference between attributional and
consequential LCA.

 11
Figure 5. A visual representation of the difference between attributional and consequential LCA. Based on (Weidema, 2003),
 referred by (Ekvall, 2019).

For example, a company might purchase renewable electricity and using ALCA in an effort to
improve its environmental performance. However, it is not certain that such an action increases the
production of renewable electricity, just rearranging who takes credit for the “good” electricity. In that
case, no environmental improvement will be achieved. CLCA aims at considering the expected
consequences of a decision and will only give credit if the renewable electricity system is expected to
expand or that dirty sources are expected to decrease (Weidema, 2003). An example when the CLCA
will not give any credits is if the renewable energy source is constrained, such as is often the case with
hydropower. In order for CLCA to capture the consequences of a decision the system boundary is set
to include all parts affected by the change, also parts outside the value chain (Ekvall, 2019). ALCA,
generally sets the system boundary in relation to the value chain. CLCA also uses marginal data
instead of average data. This as a change in demand is generally affecting the marginal production of
a system. Lastly, CLCA is using system expansion instead of allocation in a multi output process.

In the decision of choosing between ALCA and CLCA, Weidema (2003) states that it is important to
clarify if the stakeholders are really interested in the environmental impacts of its products, or more in
the environmental impact of its supply chain. If the stakeholder is truly interested in ensuring that the
global environmental impacts are reduced because of one’s decisions, a consequential approach
should be applied. This approach will then investigate and include parts affected outside what is
controlled by the actor.

From a strict consequentialist perspective, it is stated that a decision-maker should take full
responsibility of the consequences of one’s actions (Brander, 2019). Brander argues that this is
excessive and impractical, and that a normative rule must be applied to delimit what set of
consequences an actor should be considered responsible for. This is what is done in attributional

 12
inventory boundary-setting. Brander (2017) also lists that ALCA is generally useful for assigning
responsibility for environmental impacts, setting carbon budgets, and for setting reduction targets.
However, if the LCA should be used for developing actions for emission reductions, CLCA should be
used to ensure the action do not have unintended consequences.

As ALCA and CLCA answers different questions, Ekvall (2019) suggests that the practitioner should
discuss the goal and scope with the client before deciding on an approach. Ekvall further states that
CLCA roughly speaking is more accurate in evaluating the environmental impact of a decision, while
ALCA has advantages in more or less all other aspects as it is the most well-known and used
approach.

As an interesting note, the GHG Protocol recognises that the attributional approach does not always
capture all changes in emissions associated with a decision. It is stated that “some companies may be
able to make changes to their other operations that result in GHG emissions changes at sources not
included in their own inventory boundary” (WRI & WBCSD, 2004). An example of this is the
installation of an on-site combined heat and power (CHP) plant that produces electricity and sells
excess heat to the district heating grid. If the emission factor of the sold heat is lower than the
substituted energy source, this would result in a total reduction of emissions in the system. This is
however not captured by the GHG Protocol Corporate Accounting and Reporting Standard. It is
instead stated that these reductions may be reported separately.

 13
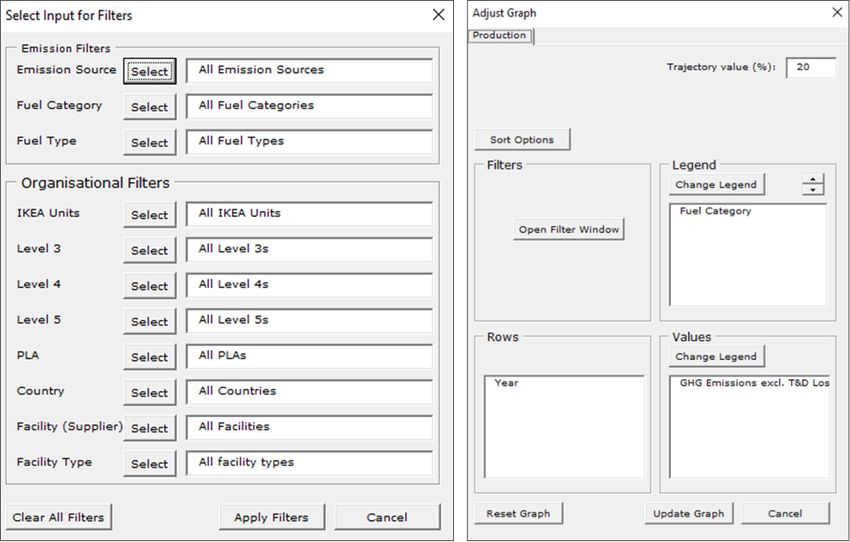
3 METHOD
The project has been carried out as a case study at IKEA, looking into how scenario analysis tools has
been used and what further needs are requested. This was done in a number of steps. Firstly, a
literature review was conducted. Then, interviews were performed with stakeholders at IKEA in order
to find out the needs of the organisation. From the interviews, a number of requirements were defined.
These requirements were later implemented into the simulation tool. Within the implementation
phase, a standardised data structure was designed, and functionality was developed to be able to
update the simulation tools based on the data structure. These steps will now be explained in more
detail.

3.1 LITERATURE REVIEW
A literature review was carried out in the beginning and throughout the project to find literature
related to the use of scenario analysis to set and follow up corporate climate targets. The area is rather
unexplored, and it is hard to find good and relevant sources. IKEA wants to use scenario analysis to
identify and prioritise activities and investments to reach the strategic goals as well as setting fact-
based climate targets for each business unit. They are thus not just interested in forecasting, but
instead in asking questions such as “what if we do this action, what is its contribution to reach our
goal?”. The following search phrases was separately used to find relevant sources of information:

“Scenario analysis”, “scenario analysis in decision making”, “scenario analysis tools”, “scenario
analysis corporate greenhouse gas emissions”, “simulation tool greenhouse gas emissions”,
“simulation tool sustainability”, “decision making attributional LCA”, “decision making
consequential LCA”, “corporate climate targets”.

Google Scholar, Chalmers library online search and Google Search was the search engines used in the
literature review.

3.2 STAKEHOLDER INTERVIEWS
To develop a tool that is usable and fulfils its purpose it is necessary to balance the need of the user
with the business objectives and technical requirements (Knight, 2019; see Figure 6). Therefore, semi-
structured stakeholder interviews were conducted with the intention to understand both the user need
and the business objectives. Semi-structured interviews were chosen because of the flexibility to have
an open-ended exploratory discussion based on predefined questions (Wilson, 2013).

 14
Figure 6. Balancing user needs, business objectives and technical requirements (Knight, 2019).

Each interview had the following phases:

 • An introduction was held to provide context and stating the purpose of the interview.
 • The interviewee/interviewees were presented a number of questions which were elaborated
 upon. The interviewer asked for clarification and for further information when necessary.
 • Closing comments including the possibility for the interviewee/interviewees to freely share
 any thoughts or comments

To get meaningful responses during the interview it is important to pay attention to- and develop good
questions (Nunnally & Farkas, 2016). The questions were developed based on the master’s thesis
description and in collaboration with the supervisor at IKEA. The main theme when developing the
questions was to understand how different parts of the organisation worked with setting and following
up climate goals and how scenario analysis could help. The questions that were developed and asked
during the interviews are presented in Table 2 together with the reasoning behind them.

 Table 2. Questions that were asked during stakeholder interviews.

 QUESTION: COMMENT:
 What is your and your department’s role Was asked to get a better understanding of the
 within IKEA? interviewee and the context that person was situated
 in.
 How do you set and follow-up climate This is a key question to get a good understanding on
 goals and action plans today? how they work with setting and following up of goals
 and actions.
 Related to setting and following up This question focused on problems that could be
 climate goals/actions, what problems are solved with a simulation tool as it was the scope of the
 there that can be solved with a Simulation thesis project.
 tool?
 What would enable you to include There is a general understanding that simulation
 simulations/scenario analysis in your role capabilities are necessary. There are also some tools
 today? available today. This question tries to understand what
 would enable these capabilities to be used throughout
 the organisation.

 15
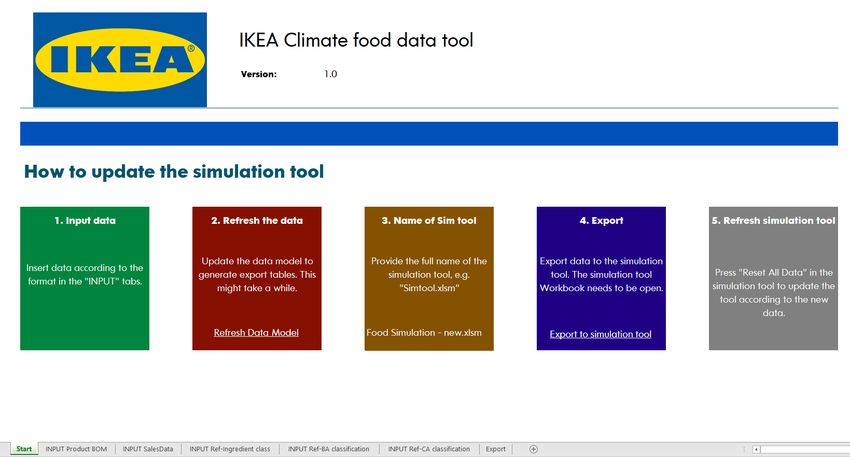
What kind of granularity do you need Different users and departments have different needs
 when it comes to simulation parameters when it comes to level of granularity and possibilities
 and filtering options? to filter down on certain aspects. These are important
 to find out before developing the tool.
 There is a simulation tool for some Tries to understand how the existing tool has been
 business areas available in Excel today. used and to what extent.
 Have you used it, and does it fulfil
 some/all of your needs?

The interviews were carried out with stakeholders within a variety of positions, mainly within
business control and sustainability functions. Most interviews were conducted with stakeholders
related to the emission area production, followed by interviews with people related to retail & other
operations and food ingredients. A more detailed presentation of all interview occasions including
date, part of IKEA and stakeholder position is presented in appendix A.

3.3 IMPLEMENTATION, USABILITY TESTING AND VERIFICATION
Two simulation tools have been developed, one combined for production and IKEA retail & other
operations, and another for food ingredients. In relation to the simulation tools, two separate tools for
updating the simulation tools have been developed. The implementation was carried out in five main
steps as presented in Figure 7. Step 2 is mainly connected to the tool developed for production, IKEA
retail & other operations. The food tool is using a predefined data format given by IKEA. Each step
will now be briefly explained.

 Figure 7. The main steps in the implementation phase.

Selecting a development platform
In the beginning of the project an exploratory investigation to evaluate and find the best tool/platform
for the needs of IKEA was carried out. The main alternatives to Excel that was investigated were
Power BI or to build a cloud-based web application. More details of this process are explained in
section 5.2.

As an outcome of this process, it was decided that the development of the simulation tool will
continue within Excel. Thus, Excel has been used together with Visual Basic Application (VBA) and

 16
UserForms. VBA is the programming language used within Excel to implement custom functionality.
UserForms are used to build user interfaces within Excel to be able to collect and process user input.

Design a standardised data format
There is a need to standardise the data format used to calculate the climate footprint for production,
IKEA retail, and other operation. As the simulation tool should be updated based on the new data
format there was a need to define it before moving into the development of the simulation tool. The
requirements and needs of the new data structure are explained in section 4.4.

Development of a tool for updating the simulation tool
The new simulation tool should be possible to update based on the new data structure. It should also
be possible to use data in the new data format for other applications as well. Therefore, a separate
update tool was developed. The development of the update tool is explained in section 5.2

Development of the simulation tool based on requirements
Based on the interviews, a number of requirements of what should be implemented were defined in
collaboration with the supervisor at IKEA. A selection of these requirements where then implemented
into the existing simulation tools as developed by Sander & Skoog (2017). The requirements are
defined in section 4.2 and 4.3 and the implementation process of these are explained in section 5.4.

Usability testing and verification
IKEA wants the developed simulation tool to be widely used in the organization by a multitude of
users to set and evaluate climate goals and actions. To be accepted and used it is important to develop
a tool with the user in mind and to conduct usability testing (Barnum, 2011). Usability testing gives
insights into how the actual user use the tool, what is working for them or not. Usability is defined as
"The extent to which a product can be used by specified users to achieve specified goals with
effectiveness, efficiency, and satisfaction in a specified context of use." (ISO, 2013). It focuses on the
users, the goals, and the context. The approach suggested by Barnum (2011), “How to Conduct Small
Studies” has been used and adopted in the project. The steps carried out in the usability testing was:

 • A small introduction on how to use the tool, such as how it looks and what features are
 available.
 • Let the user perform a number of predefined tasks while “thinking-aloud”.
 • Let the user freely share any additional thoughts or comments.

Participants for the usability testing were selected from the interviewee participants based on if they
were considered as users of the tool or not. It was limited to three participants due to the availability
of time. Details of the time, part of IKEA and stakeholder position is presented in appendix A.
Ideally, further iterations of user testing and development should be performed to ensure what has

 17
been implemented are fixing the usability issues. However, only one iteration was performed in this
project.

Connected to the verification of the simulation tools, this project builds on the work done by Sander
& Skoog (2017). They let appropriate stakeholders, such as external experts and sustainability roles
within IKEA, be involved in verifying the validity of equations, parameters, emission drivers and the
result of the model. It is therefore expected that the output from the tools developed by Sander &
Skoog is consider valid from the perspective of relevant stakeholders. This project is using the
conceptual and computerised model by Sander & Skoog. To verify the output from the new tool it has
been compared with the output from the tool by Sander & Skoog. In the case where alternations or
new features has been added it has been developed and verified with relevant stakeholders.

 18
4 IKEA PRIORITIES - RESULTS FROM THE STAKEHOLDER
 INTERVIEWS

This section will present the findings from the stakeholder interviews as well as the needs of IKEA
when it comes to defining a standardised data format. The findings from the interviews were used to
define a number of requirements before moving into the implementation phase.

4.1 FINDINGS FROM THE STAKEHOLDER INTERVIEWS
Interviews has been conducted with a variety of stakeholders from different parts of the IKEA
organisation. The needs and problems differ as a lot depending on the role of the interviewee. The
existing simulation tool has been used to set climate targets and evaluated action plans. As an
example, one category area added expected improvements into the simulation tool until 2030. They
added the expected growth, the expected new share of renewable purchased electricity and the
expected change in energy sources. It became apparent for them that what was in the action plans
were not enough to reach their reduction target. Another category area added the actions that they
thought were feasible to implement into the simulation tool. They discovered that it seemed possible
to reduce their climate footprint by 80% until 2030 and thus set that as their climate footprint
reduction target. The existing simulation tool seems to fulfil its main purpose; however, the users
expressed a number of issues and further needs that will now be presented. These has been grouped
into four themes, namely, usability and user competence, technical issues and solutions, governance,
and further user needs.

Usability and user competence

Some stakeholders expressed that the existing tool was a bit too complicated and hard to use. It was
related to the how the user should input the parameters used in simulation. They were sometimes
unsure what to enter and in what format to get the intended outcome. Multiple interviewees expressed
their wish for a tool that is very easy to use and if possible integrated into the Business Intelligence
(BI) solutions they use at IKEA today.

It was expressed by a Sustainability Developer that the existing simulation tool did not fit their
working needs. It was stated that to do scenario analysis on supplier level it is possible to use the
sustainability collection tool for suppliers and enter alternative numbers and see the outcome. The
need for simulations is instead on category area level to answer questions such as, what will be the
outcome if we complete all the actions in the supplier action plan? It was however expressed that the
existing tool was too general to be able to convert all the supplier action plans into the simulation tool
and see the outcome.

 19
One interviewee showed multiple aspects of the tool where the usability could be improved. It
included the removal of unused fields and the addition of clarification on what certain functions
within the tool meant.

A comment that expresses how they would like it to work is: “The teams do not want another tool,
they are already flooded with different tools, they want the functionality to be integrated into the
systems they already use”.

Technical issues and solutions

Multiple users reported that bugs regularly appeared when using the simulation tool. When a bug
appeared, the users could not save simulation parameters or run a simulation. Sometimes, an error
message appeared during execution, but a simulation result was presented anyway. They users could
not trust the result in that case.

Regarding the granularity of the data used in the tool the users would like to implement improvements
on at least supplier levels into the simulation tool, which is also possible today. It was also expressed
that if it is possible, they would like to have the possibility to implement improvements on production
unit level as a certain supplier can have multiple production units. A category area specific request
was to be able to work with improvements on paper grade level for a certain supplier and production
unit.

Related to the existing simulation tool used for food ingredients, one main issue was the file size of
the tool which was around 250 MB. Because of this it takes a long time to open, and Excel do
sometimes crash when opening the file on less powerful computers. Running simulations takes a long
time due to the size of the dataset. The interviewee tried to introduce the tool to more people, but due
to the slowness, the file size, and the usability of the tool it was not successful. A large file-size and
slow simulations processing has also been experienced on the production simulation tool, but not to
the same extent.

Governance

Based on the interviews, it became apparent that the “intended user” of the tool was not clearly
defined. From the climate team perspective (the team responsible for developing the previous
simulation tool), the intended user was often specified as the person responsible to the climate agenda
within for example a category area. However, talking with the sustainability developers within the
category areas, it seemed unclear who is responsible for using the simulation tool to evaluate the
climate agenda. Some expressed that it was up to the Business Developer to follow up the climate
targets and thus use the simulation tool.

When the tool has been used it has mainly been used in close collaboration with the climate team. The
tool has contained bugs and was considered non-initiative, and the users needed support to use it
 20
You can also read