South Pacific Subtropical High from the late Holocene to the end of the 21st century: insights from climate proxies and general circulation models ...
←
→
Page content transcription
If your browser does not render page correctly, please read the page content below
Clim. Past, 16, 79–99, 2020
https://doi.org/10.5194/cp-16-79-2020
© Author(s) 2020. This work is distributed under
the Creative Commons Attribution 4.0 License.

South Pacific Subtropical High from the late Holocene to the end
of the 21st century: insights from climate proxies and general
circulation models
Valentina Flores-Aqueveque1,3 , Maisa Rojas2,3,4 , Catalina Aguirre4,5,6 , Paola A. Arias7 , and Charles González1
1 Departamento  de Geología, Facultad de Ciencias Físicas y Matemáticas, Universidad de Chile,
Plaza Ercilla 803, Santiago, Chile
2 Departamento de Geofísica, Facultad de Ciencias Físicas y Matemáticas, Universidad de Chile,

Blanco Encalada 2002, Santiago, Chile
3 Millennium Nuclei for Paleoclimate, Universidad de Chile, Las Palmeras 3425, Ñuñoa, Santiago, Chile
4 Centro de Ciencia del Clima y la Resiliencia (CR2, FONDAP 15110009), Chile
5 Escuela de Ingeniería Civil Oceánica, Facultad de Ingeniería, Universidad de Valparaíso, Chile
6 Centro de Observación Marino para estudios de Riesgos del Ambiente Costero (COSTA-R), Valparaíso, Chile
7 Grupo de Ingeniería y Gestión Ambiental (GIGA), Escuela Ambiental, Facultad de Ingeniería,

Universidad de Antioquia, Medellín, Colombia

Correspondence: Valentina Flores-Aqueveque (vfloresa@uchile.cl)

Received: 5 June 2019 – Discussion started: 3 July 2019
Revised: 21 November 2019 – Accepted: 27 November 2019 – Published: 10 January 2020

Abstract. The South Pacific Subtropical High (SPSH) is           period, the SPSH expands (contracts). Together with this
a predominant feature of the South American climate. The         change, alongshore winds intensify (weaken) south (north)
variability of this high-pressure center induces changes in      of ∼ 35◦ S; also, southern westerly winds become stronger
the intensity of coastal alongshore winds and precipitation,     (weaker) and shift southward (northward). Model results
among others, over southwestern South America. In recent         generally underestimate reanalysis data. These changes are
decades, strengthening and expansion of the SPSH have been       in good agreement with paleoclimate records, which sug-
observed and attributed to the current global warming. These     gest that these variations could be related to tropical climate
changes have led to an intensification of the southerly winds    dynamics but also to extratropical phenomena. However, al-
along the coast of northern to central Chile and a decrease      though models adequately represent most of the South Amer-
in precipitation from central to southern Chile. Motivated by    ican climate changes, they fail to represent the Intertropical
improving our understanding about the regional impacts of        Convergence Zone–Hadley cell system dynamics, emphasiz-
climate change in this part of the Southern Hemisphere, we       ing the importance of improving tropical system dynamics in
analyzed SPSH changes during the two most extreme climate        simulations for a better understanding of its effects on South
events of the last millennium, the Little Ice Age (LIA) and      America. Climate model projections indicate that changes re-
the Current Warm Period (CWP: 1970–2000), based on pa-           cently observed will continue during the next decades, high-
leoclimate records and CMIP5/PMIP3 model simulations. In         lighting the need to establish effective mitigation and adap-
order to assess the level of agreement of general circulation    tation strategies against their environmental and socioeco-
models, we also compare them with ERA-Interim reanalysis         nomic impacts.
data for the 1979–2009 period as a complementary analy-
sis. Finally, with the aim of evaluating future SPSH behav-
ior, we include 21st century projections under a Representa-
tive Concentration Pathway (RCP8.5) scenario in our analy-
ses. Our results indicate that during the relative warm (cold)

Published by Copernicus Publications on behalf of the European Geosciences Union.
80                                  V. Flores-Aqueveque et al.: SPSH from the late Holocene to the end of the 21st century

1    Introduction                                                  regional temperature conditions. Model data for the CWP pe-
                                                                   riod are compared with European Centre for Medium-Range
Climate conditions in South America (SA) are the result of         Weather Forecasts (ECMWF) ERA-Interim Reanalysis data
the complex interactions among predominant atmospheric             to evaluate the degree of agreement between GCMs and re-
circulation patterns, orographic features, latitudinal differ-     cent “observations”. In addition, with the aim of understand-
ential radiation, and heat and water balances. One of the          ing future SPSH conditions and their consequences, we also
main features dominating climate in this region, in partic-        include 21st century projections under an RCP8.5 scenario
ular its western boundary, is the South Pacific Subtropi-          in our analyses.
cal High (SPSH), a quasi-permanent center of high atmo-               The structure of this paper is organized as follows. First, a
spheric pressure developed over the southeastern Pacific           climate background of present-day and past changes in the
Ocean. The present-day behavior of the SPSH is relatively          SA climate is presented. Section 2 details the model and
well known. The SPSH varies (intensity and position) at            reanalysis data analyzed, as well as the periods and pale-
different timescales, from seasonal to interannual, depend-        oclimate records considered. Section 3 presents the results
ing on the interplay between forcing from higher and lower         obtained from global model simulations and their compari-
latitudes (Grotjahn, 2004) and the superposition of large-         son with reanalysis data and with the information interpreted
scale phenomena at interannual timescales, such as the El          from paleoclimate records, as well as a discussion of this ev-
Niño–Southern Oscillation (ENSO; Cane, 1998), as well as           idence. Finally, Sect. 4 summarizes the main findings and
the Pacific Decadal Oscillation (PDO; Mantua et al., 1997)         conclusions from this work.
at inter-decadal timescales (Ancapichún and Garcés-Vargas,
2015). SPSH changes, in turn, influence other elements of          1.1   Present-day climate of southwestern South America
the ocean–atmosphere dynamics of SA, such as the merid-                  and future projections
ional winds and the related upwelling along coastal central
Peru to south–central Chile (e.g., Pizarro et al., 1994; Falvey    In the Southern Hemisphere (SH), the subsiding branch of
and Garreaud, 2009; Rahn and Garreaud, 2013), as well as           the Hadley cell (HC) determines the presence of a quasi-
precipitation at the western side of the Andes (e.g., Barrett      permanent belt of high surface pressure around 30◦ S (e.g.,
and Hameed, 2017).                                                 Held and Hou, 1980), whose development over the Pacific
   However, little is known about its past behavior. During        Ocean is known as the SPSH. The SPSH extends over much
recent decades, an intensification of coastal southerly winds      of the Pacific Ocean off the Chilean coast, with a center be-
and a decrease in precipitation have been observed in south-       tween 25–30◦ S and 90–105◦ W (Pizarro et al., 1994) and an
western SA. These changes have been related to an intensi-         area of influence extending poleward of 45◦ S during austral
fied and southward-shifted SPSH as a response to the cur-          summer (Fig. 1a), when it strengthens (Fuenzalida, 1971).
rent global warming scenario (Falvey and Garreaud, 2009;           At the northern edge of the SPSH, the air masses flow west-
Rahn and Garreaud, 2013; Ancapichún and Garcés-Vargas,             ward, producing the belt of the trade winds (tropical easter-
2015; Schneider et al., 2017; Boisier et al., 2018; Aguirre        lies). South of the SPSH, a westerly wind belt, known as the
et al., 2018). Model projections indicate that this trend will     southern westerly winds (SWWs), is developed in the midlat-
continue during the 21st century for southerly wind inten-         itudes, peaking around 50◦ S (Varma et al., 2012) (Fig. 1a).
sity (e.g., Garreaud and Falvey, 2009; Belmadani et al., 2014;     These prevailing winds, which are responsible for the very
Aguirre et al., 2018), as well as for precipitation (e.g., Nuñez   high regional precipitation on the windward side of the south-
et al., 2008; Kitoh et al., 2011; Cabré et al., 2016).             ern Andes (1000–7000 mm yr−1 ; Garreaud et al., 2013), are
   Given the fundamental impact of the SPSH on the along-          characterized by a remarkable seasonality driven mainly by
shore winds, and therefore on wind-driven upwelling along          changes in sea surface temperature (SST) and atmospheric
the southeastern Pacific (Croquette et al., 2007; Aguirre et       temperature gradients (Sime et al., 2013). Seasonally, the
al., 2018) and precipitation (Barrett and Hameed, 2017), the       SPSH is strongest in intensity and has a more poleward posi-
study of SPSH past variations is essential for understanding       tion during austral summer, and it has a more equatorward
its future behavior and key for diagnosing the impacts of cli-     position and less intensity during austral winter (Fig. 1a),
mate change on the ecohydrologic dynamics and socioeco-            allowing midlatitude frontal systems to reach further north
nomic activities in this region, such as fisheries.                and bringing winter rains to central Chile (e.g., Quintana and
   In this work, we analyze the SPSH past variations and their     Aceituno, 2012).
influence on the climate of western SA during the last millen-        The present-day climatic influence of the SPSH over SA
nium – a period in which natural and anthropogenic forcing         is modulated by large-scale climatic phenomena at interan-
can be evaluated – from two lines of evidence: paleoclimate        nual to decadal timescales. ENSO (Cane, 1998) dominates
proxies and general circulation models (GCMs). In particu-         global climate variations for the Pacific and the global tropics
lar, we focus on two extreme climate periods, the cold Little      (Rasmussen and Wallace, 1983) on interannual timescales,
Ice Age (LIA) and the Current Warm Period (CWP), in order          ranging quasi-regularly from 3 to 6 years and between 2 and
to contrast the SPSH behavior under different global and/or        7 years, according to Dettinger et al. (2000) and Cane (2005),

Clim. Past, 16, 79–99, 2020                                                                     www.clim-past.net/16/79/2020/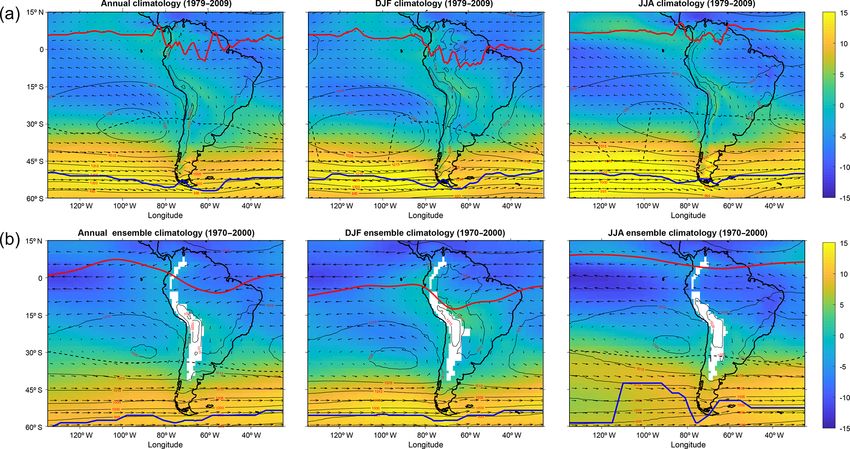
V. Flores-Aqueveque et al.: SPSH from the late Holocene to the end of the 21st century                                                   81

Figure 1. Present-day climate of southwestern South America. (a) ERA-Interim (1970–2009) and (b) ensemble model (1970–2000) clima-
tology. Magnitude (color) and direction (vectors) denote the wind stress in the eastern Pacific Ocean for the annual mean, DJF, and JJA. The
red line denotes the ITCZ position, the contour line (1020 hPa) indicates the SPSH extension, the black dashed line corresponds to the STJ
position, and the blue line denotes the position of the SWWs.

respectively. In southwestern SA, this phenomenon is as-                and Solomon, 2002; Marshall et al., 2004; Garreaud et al.,
sociated with a higher probability of heavy rainfall in cen-            2009).
tral Chile during the winter season, catastrophic flooding in              In addition, due to its outstanding orographic features, the
coastal Peru, and drought in the Altiplano of Peru and Bo-              southwestern margin of SA could also be influenced by re-
livia (Cane, 2005). At decadal timescales (20 to 30 years;              gional to local climate variations that are superimposed on
Mantua and Hare, 2002), the influence of the PDO (Mantua                these large-scale phenomena (e.g., Rutllant et al., 2003; Moy
et al., 1997; Zhang et al., 1997) plays a major role in the             et al., 2009).
South American climate. This climate pattern is described                  In the past decades, several changes have affected the
as El Niño-like, mainly because its warm (cold) phases are              climate of SA. The most important of these variations are
very similar to those of El Niño (La Niña) events, although             a decrease in precipitation in southwestern SA (Boisier et
of smaller amplitude (Garreaud and Battisti, 1999). In SA,              al., 2016, 2018) and an intensification of coastal-upwelling-
the anomalies of rainfall and temperature related to the PDO            favorable winds (Schneider et al., 2017) that trigger bio-
display a spatial distribution similar to the ENSO-related              logical and biogeochemical consequences (Anabalon et al.,
anomalies (Garreaud et al., 2009).                                      2016; Aguirre et al., 2018). Several authors have associated
   At higher latitudes south of 20◦ S, the Southern Hemi-               changes in alongshore winds to an intensified or expanded
sphere Annular Mode (SAM), also referred to as the Antarc-              SPSH (e.g., Falvey and Garreaud, 2009; Belmadani et al.,
tic Oscillation (AAO), influences climate variability at inter-         2014; Ancapichún and Garcés-Vargas, 2015).
monthly and interannual timescales (Thompson and Wallace,                  These observed trends are also found in numerous model
2000). The SAM is characterized by two pressure anomalies               projections for warming scenarios, suggesting that these
of opposite signs centered in Antarctica and a circumglobal             changes could continue during this century as a result of
band at ∼ 40–50◦ S, related to the north–south displacement             changes in the SPSH and precipitation, related to a pole-
of the SWWs (Garreaud et al., 2009). In SA, the influence               ward shift and intensification of the SWWs (e.g., Fyfe and
of this feature is associated with the increase in air tempera-         Saenko, 2006; Ihara and Kushnir, 2009; Chavaillaz et al.,
ture between 40 and 60◦ S and a decrease in precipitation in            2013; Bracegirdle et al., 2018). The projection of a poleward
southern Chile during its positive phase, related to a south-           displacement of the SPSH that intensifies alongshore winds
ward shift of the SWWs (Thompson et al., 2000; Thompson                 at the poleward portions of upwelling systems is a clear and

www.clim-past.net/16/79/2020/                                                                              Clim. Past, 16, 79–99, 2020
82                                  V. Flores-Aqueveque et al.: SPSH from the late Holocene to the end of the 21st century

robust characteristic in south–central Chile (Rykaczewski et          On the other hand, an increase in mean global tempera-
al., 2015). Furthermore, the upwelling system off south–           ture from the late 20th century has been observed and thor-
central Chile exhibits a robust future change in the timing, in-   oughly documented by many authors (e.g., Jones et al., 1998,
tensity, and spatial distribution of alongshore winds as a con-    2001; Mann et al., 1999, 2003; Briffa, 2000; Crowley and
sequence of global warming (Belmadani et al., 2014; Wang           Lowery, 2000; Folland et al., 2001; Hartmann et al., 2013,
et al., 2015; Rykaczewski et al., 2015).                           among many others). This global warming, also referred
                                                                   to as the late 20th century warmth or the Current Warm
                                                                   Period (CWP), has been defined as a period of uniformly
1.2   Late Holocene climate in South America: global               positive and simultaneous temperature trends in both hemi-
      events                                                       spheres (e.g., Neukom et al., 2014), with no precedent in
                                                                   the last 1000 years (Mann et al., 1999; Jones et al., 1998,
The LIA refers to a period of prominent climate anoma-             2001; Crowley and Lowery, 2000; Folland et al., 2001; Jones
lies over the past millennium when cold conditions were            and Mann, 2004; Marcott et al., 2013; Neukom et al., 2014;
recorded in most of Europe and parts of North America. It          PAGES2k Consortium, 2017). This characteristic makes the
has been established that the LIA developed between 16th           CWP, together with the LIA, the major climate event of the
and mid-19th centuries (Mann, 2002), being the last cold pe-       past 1 or 2 millennia, a period known as the “late Holocene”
riod recorded on Earth. However, the timing, magnitude, and        (Williams and Wigley, 1983).
nature of this event vary significantly from region to region
(Bradley and Jones, 1993; Mann et al., 1999) and between           2     Methodology
archives (Chambers et al., 2014).
   Unlike the Northern Hemisphere (NH), where the LIA              2.1    Climate models for the last millennium, the historical
is relatively well understood (e.g., PAGES2k Consortium,                  period, and 21st century projections
2017), across the SH the evidence and detection of this phe-
nomenon in proxy–climate records are less clear with respect       In this study, we analyze open-access CMIP5/PMIP3 climate
to its timing, regional extent, and specific associated climatic   model experiments for which all three types of simulations
changes (e.g., Chambers et al., 2014). The recent annually re-     are available: (1) the Last Millennium simulation (past1000;
solved millennial temperature reconstruction for the SH de-        Schmidt et al., 2011, 2012), which considers observed forc-
veloped by Neukom et al. (2014) reveals a cold phase (1594–        ing (orbital parameters, solar irradiance, greenhouse gases,
1677) coinciding with the peak of the LIA. However, at the         land use change, and volcanic aerosols) covering the 850–
regional scale, particularly in southern SA, evidence of this      1850 CE period; (2) the historical simulation, which includes
event has been poorly documented.                                  natural and anthropogenic (greenhouse gases concentration
   In general terms, the few reconstructions made suggest          and aerosols) forcing over the 1850–2005 CE period; and
that in this region the LIA was a period characterized by          (3) the anthropogenically forced Representative Concentra-
wetter conditions related to changes in the position of the        tion Pathway (RCP) 8.5 scenario (named for the equivalent
SWW belt (e.g., Lamy et al., 2001; Moy et al., 2008, 2009;         effect in the radiative forcing by 2100 CE relative to the
Moreno et al., 2014). However, so far there is still no con-       preindustrial period: +8.5 Wm−2 ), characterized by increas-
sensus about the trend in temperature during the LIA in            ing greenhouse gas emissions over the period 2006–2100 CE
this region. Some authors (e.g., Masiokas et al., 2009; Koch       (21C). Four models meet these criteria (Table 1). For each of
and Kilian, 2005; Koch, 2015) have recognized glacier ad-          these, we use the first ensemble member (r1i1p1).
vances in the extratropical SA (17–55◦ S) during this period,         We particularly analyze different meteorological variables
which can be interpreted as cold conditions. However, re-          considered to be representative of the main climate compo-
cently González-Reyes (2019), based on glacier equilibrium         nents present over western South America. The variables an-
line altitude modeling, determined that in the Mediterranean       alyzed correspond to monthly mean data for (a) the SPSH,
Andes (30–37◦ S) there are no marked glacier advances as-          represented by sea level pressure (SLP) and the position
sociated with the “classic” (i.e., NH) LIA. Instead of that,       (latitude, longitude) of its maximum, (b) the intensity of
the authors explain that more local factors, such as the Pa-       the meridional winds (e.g., approximately alongshore) at
cific SST variability, would have controlled the glacier mass      850 hPa, (c) the SWWs defined as the latitudinal position of
balance in the region during this period.                          the maximum zonal wind at 850 hPa between 40 and 60◦ S,
   Moreover, CMIP5/PMIP3 Last Millennium (LM) simu-                (d) the Intertropical Convergence Zone (ITCZ) represented
lations have shown weak temperature anomalies during the           by the position of the maximum value of precipitation be-
LIA, hindering the identification of this period, especially       tween 15◦ N and 8◦ S, and (e) the subtropical jet (STJ) us-
in the SH (e.g., Rojas et al., 2016; Fig. S1). This has been       ing the latitudinal position of the maximum zonal wind at
associated with the fact that this global event is a response      200 hPa north of 48◦ S.
to internal climate variability (PAGES2k Consortium, 2013;
Neukom et al., 2014) rather than to external forcing.

Clim. Past, 16, 79–99, 2020                                                                     www.clim-past.net/16/79/2020/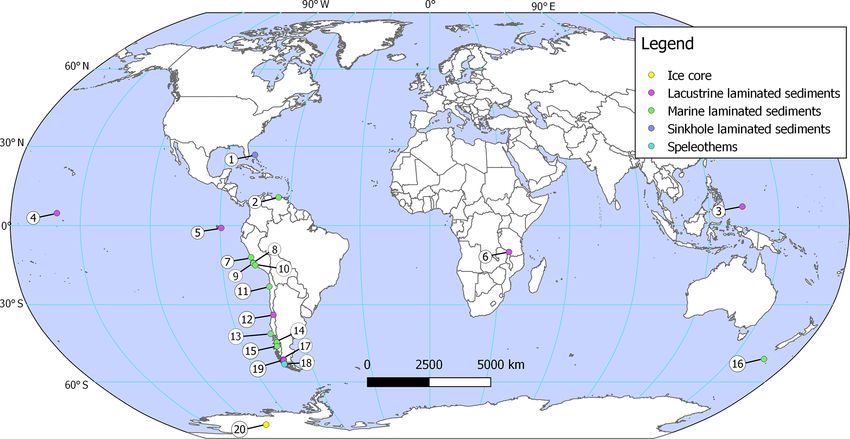
V. Flores-Aqueveque et al.: SPSH from the late Holocene to the end of the 21st century                                              83

Table 1. Characteristics and definition of the LIA period for each model simulation used. Modified from Rojas et al. (2016).

                       Model               Horizontal resolution   LIA period     Reference
                       bcc-csm-1           2.8◦ × 2.8◦             1590–1790      Wu et al. (2014), Xin et al. (2013)
                       CCSM4               0.9◦ × 1.25◦            1710–1810      Gent et al. (2011)
                       IPSL-CM5A-LR        1.9◦ × 3.75◦            1630–1710      Dufresne et al. (2013)
                       MRI-CGCM3           1.1◦ × 1.12◦            1510–1620      Yukimoto et al. (2011)

   Additionally, the global HC is computed over the three               nual and seasonal mean data from the ERA-Interim Re-
periods (LIA, CWP, 21C) using the mean meridional mass                  analysis for the period 1979–2009. This project, extensively
stream function.                                                        used in climate research, consists of a global-scale dataset
                                                                        that includes recorded climate observations of atmospheric
2.2   Global climate events: time periods considered                    weather (data available online at https://www.ecmwf.int/
                                                                        en/forecasts/datasets/reanalysis-datasets/era-interim, last ac-
For the LIA period, we use the time period identified in each           cess: 30 March 2019), with a spatial resolution of approxi-
model by Rojas et al. (2016), based on the annual tempera-              mately 0.75◦ × 0.75◦ (latitude × longitude), for the most rel-
ture anomaly over the NH with respect to the 1000–1850 CE               evant meteorological variables (wind, pressure, temperature,
mean, and the meridional SST gradient between the tropical              and cloud cover, among others). Its primary temporal resolu-
North and South Atlantic (Table 1). On the other hand, the              tion is 3 h for surface parameters, starting in 1979 and being
definition of the onset of the CWP varies by author. Some               continuously updated in near-real time (Dee et al., 2011).
of them consider it to be since 1850 CE (Deng et al., 2017)                We use the ERA-Interim Reanalysis because of its high
or the entire 20th century (1901–1990) (Briffa et al., 1995;            spatial resolution and the continuous improvement in the
Briffa, 2000; Jones et al., 1998), while other authors refer            quality of the data.
to the “mid-20th century” (e.g., Crowley and Lowery, 2000;
Levitus et al., 2000) or the “late 20th century” (e.g., Mann et
                                                                        2.4    Climate records of southwestern South America
al., 2003; Jones and Mann, 2004; Osborn and Briffa, 2006).
Recently, Díaz and Vera (2018) considered the CWP in South              In order to test the robustness of CMIP5/PMIP3 LM climate
America to be the period between 1951 and 2000 CE, also                 simulations, we carry out an integration of the results ob-
taking into account the negative rainfall trend observed in             tained from model simulations as well as paleoclimate and
the southern Andes.                                                     paleoenvironmental reconstructions of several regional high-
   According to the last IPCC Special Report (Allen et al.,             resolution records, mainly from southwestern South America
2018), between 1890 and 2010 almost all the current warm-               but also from other regions of the world.
ing could be attributed to human activities; in the absence                We consider records that (1) provide information about the
of strong natural forcing, solar and volcanic contributions             main climate features affecting southwestern South America,
account for less than ±0.1 ◦ C of the temperature increase              (2) have a minimum length of 500 years to potentially record
between 1890 and 2010. The same report states that since                the LIA and the CWP, and (3) have a resolution at interannual
2000, the human-induced warming accounts for ∼ 80 % of                  to centennial timescales (Fig. 2).
total warming, with the ±20 % uncertainty attributed to solar              The selected records fulfill at least three criteria defined
and volcanic contributions.                                             in the PAGES2k network. However, we also include records
   Whatever the time period considered, all these studies               that do not meet these criteria but are particularly valuable
have led to a consensus that in the past few decades, the mean          because of their temporal resolution or location, considering
annual NH temperatures are the warmest of the last 1000 or              the sparseness of records in this region. Details of the se-
even 2000 years (PAGES2k Consortium, 2019). For this rea-               lected records and their main characteristics are presented in
son, we consider the CWP to be the period covering the years            Table 2.
1970–2000 CE.
   Finally, in an analogous way, the RCP8.5 scenario in                 3     Results and discussion
model projections for the end of the 21st century was consid-
ered to cover the period between the years 2070 and 2100.               3.1    Paleoclimate evidence
                                                                        Several paleoclimate records analyzed (Table 3, Fig. 2) in-
2.3   Reanalysis data
                                                                        dicate that important changes have occurred during the late
With the aim of comparing the CMIP5/PMIP3 simulation                    Holocene along the western margin of South America. Sal-
data for the CWP (historical experiment; 1970–2000) and                 vatecci et al. (2014) analyzed marine laminated sediments
the present-day climate observational dataset, we use an-               off Pisco (14◦ S, 76◦ W; Perú), interpreting a period of weak

www.clim-past.net/16/79/2020/                                                                              Clim. Past, 16, 79–99, 2020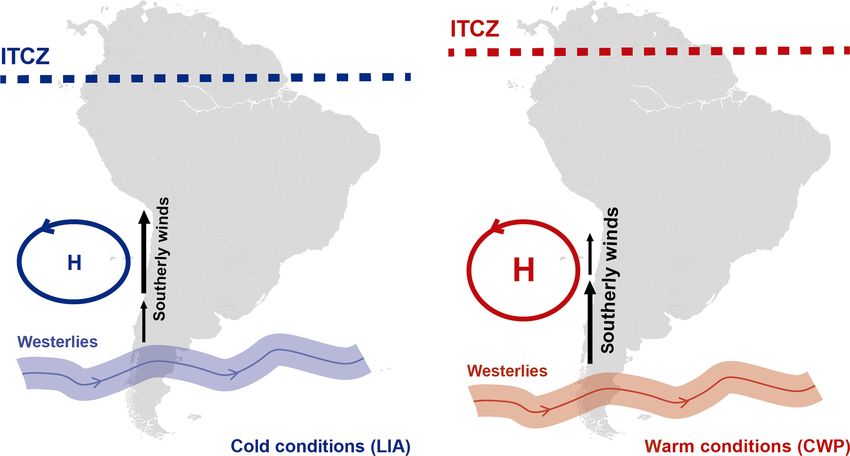
84                                         V. Flores-Aqueveque et al.: SPSH from the late Holocene to the end of the 21st century

Table 2. List of paleoclimate and paleoenvironmental records from southern South America and other regions used in this work, along with
their characteristics.

     No.   Record type          Location               Lat. (◦ )   Lon. (◦ )   Spanned period        Temporal reso-     Reference
                                                                                                     lution
     1     Sinkhole laminated   Southeastern North       26.79     −77.42      last 3000 years       Multi-decadal      van Hengstum et al. (2016)
           sediments            America
     2     Marine               Northern       South      10.7      −65.2      last ∼ 14 000 years   Interannual        Haug et al. (2001),
           laminated            America                                                                                 Peterson and Haug (2006)
           sediments
     3     Lacustrine           Central western Pa-         7.2      134.4     last ∼ 500 years      Inter-decadal to   Sachs et al. (2009)
           laminated            cific Ocean                                                          centennial
           sediments
     4     Lacustrine           Central      Pacific        4.7    −160.4      last 3200 years       Inter-decadal to   Sachs et al. (2009)
           laminated            Ocean                                                                centennial
           sediments
     5     Lacustrine           Central eastern Pa-      −0.9       −89.5      last 1200 years       Inter-decadal to   Sachs et al. (2009)
           laminated            cific Ocean                                                          centennial
           sediments
     6     Lacustrine           Eastern Africa          −10.0          34.1    last 700 years        Decadal            Johnson et al. (2001)
           laminated
           sediments
     7     Marine               Southwestern            −12.0       −77.2      last 700 years        Sub-decadal to     Siffedine et al. (2008),
           laminated            South America                                                        inter-decadal      Gutiérrez et al. (2009),
           sediments                                                                                                    Briceño-Zuluaga et al. (2016)
     8     Marine               Southwestern            −14.1       −76.5      last 700 years        Sub-decadal to     Siffedine et al. (2008),
           laminated            South America                                                        inter-decadal      Gutiérrez et al. (2009)
           sediments
     9     Marine               Southwestern            −14.3       −76.4      last ∼ 2000 years     Interannual to     Salvatecci et al. (2014),
           laminated            South America                                                        decadal            Briceño-Zuluaga et al. (2016)
           sediments
     10    Marine               Southwestern            −15.0       −75.7      last 1000 years       Interannual to     Fleury et al. (2015)
           laminated            South America                                                        multi-decadal
           sediments
     11    Marine               Southwestern            −23.1       −70.5      last ∼ 250 years      Annual             Flores-Aqueveque et al. (2015)
           laminated            South America
           sediments
     12    Lacustrine           Southwestern            −33.8       −70.9      last 2000 years       Decadal to cen-    Jenny et al. (2002)
           laminated            South America                                                        tennial
           sediments
     13    Marine               Southwestern            −41.0       −74.5      last ∼ 7700           Sub-decadal to     Lamy et al. (2001)
           laminated            South America                                                        inter-decadal
           sediments
     14    Marine               Southwestern            −44.3       −72.9      last 1750 years       Decadal            Sepúlveda et al. (2009)
           laminated            South America
           sediments
     15    Marine               Southwestern            −45.8       −73.5      last 1400 years       Multi-decadal      Bertrand et al. (2014)
           laminated            South America                                                        to multi-
           sediments                                                                                 centennial
     16    Marine               Southwestern            −50.8        166.1     last ∼ 5000 years     Centennial    to   Browne et al. (2017)
           laminated            Pacific                                                              millennial
           sediments
     17    Lacustrine           Southwestern            −51.0       −72.8      last 5000 years       Decadal       to   Moy et al. (2008), Moreno et al. (2009)
           laminated            South America                                                        multi-
           sediments                                                                                 centennial
     18    Lacustrine           Southwestern            −51.3       −72.9      last 3000 years       Centennial         Moreno et al. (2014)
           laminated            South America
           sediments
     19    Speleothems          Southwestern            −52.8       −73.4      last 5000 years       Sub-annual         Schimpf et al. (2011)
                                South America
     20    Ice core             Western Antarctica      −79.5      −112.1      last 2400 years       Sub-annual         Koffman et al. (2014)

Clim. Past, 16, 79–99, 2020                                                                                                www.clim-past.net/16/79/2020/
V. Flores-Aqueveque et al.: SPSH from the late Holocene to the end of the 21st century 85 Figure 2. Global distribution of the paleoclimate and paleoenvironmental records used in this work. See Table 1 for number identification. alongshore winds related to a contracted SPSH during the 2001; Peterson and Haug, 2006), Washington Island (4◦ N, LIA and stronger winds due to an expanded anticyclone dur- 160◦ W; Fig. 2), Palau (7◦ N, 134◦ E; Fig. 2), and the Galápa- ing the CWP. Recent climatological data seem to support gos Islands (1◦ S, 89◦ W; Fig. 2) in the central Pacific (Sachs these observations (Falvey and Garreaud, 2009). et al., 2009), Lake Malawi (10◦ S, 34◦ E; Fig. 2) in east- In the same area and slightly further north (Callao at 12◦ S, ern Africa (Johnson et al., 2001), and Abaco (26◦ N, 77◦ W; ◦ 77 W; Fig. 2), Sifeddine et al. (2008) also noted an in- Fig. 2) in the northern Bahamas (van Hengstum et al., 2016). crease (decrease) in the intensity of southerly winds dur- Changes in the South American climate system are also ing the CWP (LIA) attributed to a strengthened (weakened) recorded at higher latitudes. Using lacustrine sediments of SPSH. These authors suggest that these conditions could be Laguna de Aculeo (33◦ S, 71◦ W; Fig. 2), Jenny et al. (2002) caused by changes in the ITCZ and the SPSH latitudinal observed an increase in precipitation in Mediterranean cen- position, both being displaced to the north (south) during tral Chile during the LIA and interpreted it as an intensifi- the warm (cold) period. Changes in alongshore winds are cation of the SWWs. For the same period but using marine also reported off central Peru by Gutiérrez et al. (2009) and laminated sediments of southern Chile (41◦ S, 74◦ W; Fig. 2), Briceño-Zuluaga et al. (2016), as well as in northern Chile Lamy et al. (2001) also noted an increase in precipitation (23◦ S, 70◦ W; Fig. 2) by Flores-Aqueveque et al. (2015), in the southern Andes related to a northward displacement who interpreted the recent increase in southerly wind inten- of the SWWs due to a weakened SPSH. The opposite oc- sity trend as a response to an expanded and/or intensified curs during a warm period, such as the Medieval Climate SPSH. According to Gutiérrez et al. (2009) and Briceño- Anomaly (MCA). Zuluaga et al. (2016), stronger winds could be related to a Further south, Sepúlveda et al. (2009) reported a north- northward displacement of the ITCZ–SPSH system during ward shift of the SWW belt during the LIA, according to the CWP and to an intensification of the Walker circulation a marine sedimentary record obtained from the Jacaf Fjord associated with the current global warming. These authors in northern Chilean Patagonia (44◦ S, 73◦ W; Fig. 2). The also stated that during the LIA, the ITCZ was located south- same is interpreted from the analysis of a sediment core ward of its modern position, agreeing with the interpretation of Quitralco Fjord (46◦ S, 73◦ W; Fig. 2) by Bertrand et by Fleury et al. (2015) for the same area (11–15◦ S, Perú; al. (2014), who found that during the LIA (1200–1500 CE), Fig. 2). However, unlike the first authors, Fleury et al. (2015) the SWWs were gradually shifted northward and slightly noted a weakening in the Walker circulation since 1800 CE moved poleward during the last decades, agreeing with that suggests the influence of additional processes, probably recent trends in observed climatological data (e.g., Shin- related to a secular positive trend in tropical SST, accounting dell and Schmidt, 2004). According to these authors, late for this decrease. Holocene variations (latitudinal position and extent) in the Latitudinal changes in the ITCZ mean position, with a SWWs were mostly driven by changes in the strength of southward displacement during the LIA, have also been the polar cell, which responds to changes in temperature at recorded in other parts of the world such as the Cariaco Basin higher latitudes in the SH; this is in opposition to Lamy et (10◦ N, 66◦ W; Fig. 2) in northern Venezuela (Haug et al., al. (2001), who explained the changes in the SWWs based www.clim-past.net/16/79/2020/ Clim. Past, 16, 79–99, 2020
V. Flores-Aqueveque et al.: SPSH from the late Holocene to the end of the 21st century
www.clim-past.net/16/79/2020/
Table 3. Climate reconstructions of southwestern South America for the LIA and the CWP based on paleoclimate records.
Period Latitude ITCZ SPSH Meridional winds SWWs Reference
26.8 Shifted southward – – – van Hengstum et al. (2016)
10.7 Shifted southward – – – Haug et al. (2001), Peterson and Haug (2005)
7.2 Shifted southward – – – Sachs et al. (2009)
4.7 Shifted southward – – – Sachs et al. (2009)
–0.9 Shifted southward – – – Sachs et al. (2009)
–10.0 Shifted southward – – – Johnson et al. (2001)
–12.0 Shifted southward Shifted southward and/or weakened Weakened – Siffedine et al. (2008)
–12.0 Shifted southward Weakened – – Gutiérrez et al. (2009)
–14.1 Shifted southward Weakened Weakened – Briceño-Zuluaga et al. (2016)
–14.3 Shifted southward Contracted Weakened – Salvatecci et al. (2014)
Little Ice Age
–15.0 Shifted southward – – – Fleury et al. (2015)
–33.8 – Weakened – Intensified and/or shifted northward Jenny et al. (2002)
–41.0 – Weakened – Intensified and shifted northward Lamy et al. (2001)
–44.3 – – – Shifted northward Sepúlveda et al. (2009)
–45.8 – – – Shifted northward Bertrand et al. (2014)
–50.8 – – – Shifted northward Browne et al. (2017)
–51.0 Intensified and (southern edge) shifted southward Moy et al. (2008)
–51.0 – – – Intensified Moreno et al. (2009)
–52.8 – – – Weakened Schimpf et al. (2011)
–79.5 Shifted southward – – Weakened and/or shifted northward Koffman et al. (2014)
– Shifted southward Weakened and/or contracted Weakened Shifted northward –
26.8 Shifted northward – – – van Hengstum et al. (2016)
–12 – – Strengthened – Siffedine et al. (2008)
–12 Shifted northward Shifted northward and/or strengthened Strengthened – Gutiérrez et al. (2009)
–14.1 Shifted northward Shifted northward and/or strengthened Strengthened – Briceño-Zuluaga et al. (2016)
Current Warm –14.3 Shifted northward Strengthened Strengthened – Salvatecci et al. (2014)
Period –15 Shifted northward – – – Fleury et al. (2015)
(1970–2000) –23.1 – Strengthened or expanded Strengthened – Flores-Aqueveque et al. (2015)
–45.8 – – – Shifted southward Bertrand et al. (2014)
Clim. Past, 16, 79–99, 2020
–51.3 – – – Intensified and shifted southward Moreno et al. (2014)
–79.5 – – – Intensified and shifted southward Koffman et al. (2014)
– Shifted northward Strengthened and/or expanded Strengthened Shifted southward –
86V. Flores-Aqueveque et al.: SPSH from the late Holocene to the end of the 21st century 87
on variations in the tropical climate system (i.e., Hadley cell The position of the STJ is another climate feature that dif-
intensity). fers between the reanalysis and climate models. For reanal-
Evidence of SWW variations is also observed in paleo- ysis data, the latitudinal position of the STJ when it reaches
climate records at subantarctic and Antarctic latitudes. The the continent is around 27◦ S during the austral winter and
analyses of lacustrine sediments from Lago Guanaco, south- 29◦ S in the annual mean (Fig. 1a), being between 3◦ and 6◦
western Patagonia (51◦ S, 73◦ W; Fig. 2), developed by Moy of latitude north, respectively, of those represented by his-
et al. (2008) and Moreno et al. (2009) indicate that precipita- torical simulations (i.e., ∼ 30◦ S during austral winter and
tion increased during the LIA, related to more intense west- ∼ 35◦ S in the annual mean) (Fig. 1b). According to the re-
erly winds. Moy et al. (2008) also suggest a poleward shift sults obtained by Hudson (2012), the SH STJ position varied
of the southern margin of the SWW belt synchronously with between ∼ 30◦ and ∼ 45◦ S between 1979 and 2010. This
this intensification. range is in good agreement with the values obtained from
On the other hand, Schimpf et al. (2011) noted a decrease climate models, suggesting that the ERA-Interim reanalysis
in precipitation during the LIA and interpreted it as a south- dataset underestimates the STJ meridional position.
ward shift or a weakening in the core of the SWWs, ac- At higher latitudes, ERA-Interim reanalysis data differ
cording to a stalagmite from the southernmost Andes (53◦ S, from models in the representation of the present-day be-
73◦ W; Fig. 2). Recently, Browne et al. (2017), based on havior of the SWWs (Fig. 1), indicating a position further
a fjord sediment core collected from the Auckland Islands south of its core when this wind belt meets the continent
(51◦ S, 166◦ E; Fig. 2), interpreted a northward (southward) (∼ 54◦ S) during the entire year, showing almost no sea-
shift of the SWWs during the LIA (MCA), suggesting that sonal differences. Similar results are obtained by Swart et
the synchronous changes in the SWWs observed on both al. (2015), who compared surface winds and satellite-based
sides of the Pacific could be controlled by atmospheric tele- data, finding that several reanalyses overestimate recent ob-
connections between the low and high latitudes, modulated served trends. Moreover, these authors also found that spuri-
by the variability in the AAO and ENSO. Finally, Koffman ous long-term trends in SLP and winds observed in diverse
et al. (2014), based on dust particles found in an ice core from reanalysis datasets for the SH, especially in the southeastern
western Antarctica (79◦ S; Fig. 2), interpreted the SWWs to Pacific, limit their applicability as a tool for validating these
be less (more) intense and/or displaced equatorward (pole- features in model simulations.
ward) during the cold (warm) period in response to both sur-
face temperature changes in the tropical Pacific and solar 3.3 Climate changes over southwestern South America
variability. since the late Holocene according to GCMs
The apparent incongruity of the SWW changes observed
among paleorecords could be partly explained by their loca- Figure 3 shows the difference between the meridional winds
tions. Thus, the different proxies could be recording differ- during the LIA and the CWP (LIA minus CWP) for each
ential changes in the wind intensity between the edges and model as well as for the four-model mean. In addition, the
the core and/or latitudinal displacements of this belt. position of the ITCZ, the upper-level STJ, the SWWs at
850 hPa, and the SPSH locations for the LIA (cyan line) and
the CWP (fuchsia line) are displayed.
3.2 Model simulations vs. present-day atmospheric The four-model ensemble annual as well as the austral
observations summer and winter means show a strengthening of the SPSH
during the warm period, expressed as an expansion of this
The analysis of the main present-day (1979–2009) climate high-pressure center, mainly to the west and south. This
features of southwestern SA from ERA-Interim shows that trend is also observed in individual models, except for the
some differences arise when comparing this dataset (Fig. 1a) austral winter conditions and consequently the annual mean
with model simulations for a comparable period (1970– of model MRI-CGCM3. The SPSH expansion is more ev-
2000) (Fig. 1b). In general terms, the four models analyzed ident when comparing CWP and 21C data (Fig. 4), with
here seem to underestimate the present-day SPSH extension, its southern rim reaching higher latitudes as temperature
especially during austral summer (DJF) when the reanalysis increases. This behavior was already noted by Garreaud
shows an SPSH more expanded than simulated conditions. and Falvey (2009) using the PRECIS R2A regional climate
With respect to the location of the SPSH, it can be noted that model, and Kitoh et al. (2011) in high-horizontal-resolution
although the latitudinal SPSH position is very similar in both (20 and 60 km grid) model projections. The opposite (i.e.,
datasets, major differences can be observed in its longitudinal a contracted SPSH) is observed during relatively colder pe-
position (Table S1 in the Supplement). Maximum values of riods, except for the austral winter (June–July–August; JJA),
the SLP in reanalysis data are located further west than those when the SPSH positions for the LIA and the CWP are nearly
of the models at annual and seasonal scales, with this differ- identical (Fig. 3).
ence being more remarkable during austral summer, reaching With respect to the SPSH position, major differences can
around 11◦ of longitude. be observed in latitude between austral summer (December–
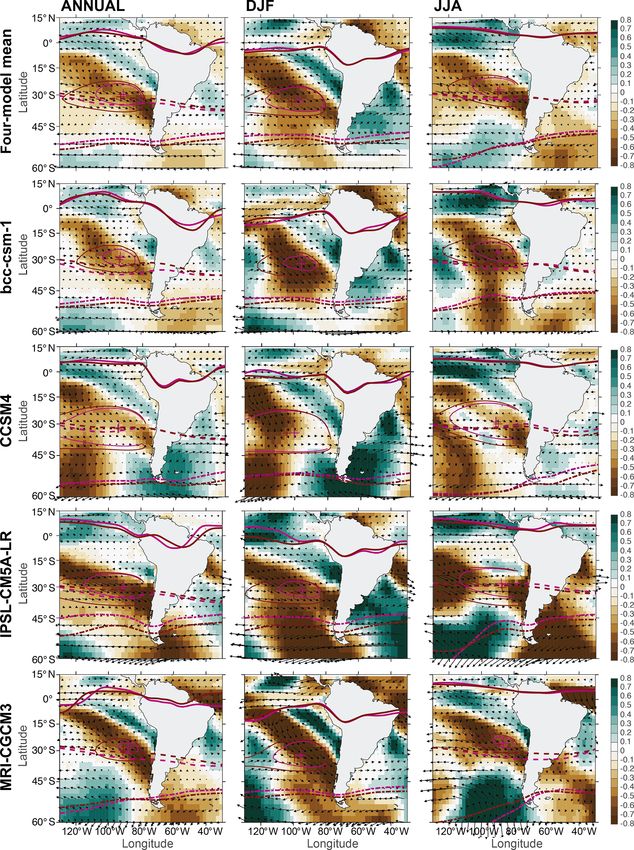
www.clim-past.net/16/79/2020/ Clim. Past, 16, 79–99, 202088 V. Flores-Aqueveque et al.: SPSH from the late Holocene to the end of the 21st century Figure 3. Annual and seasonal means of the southwestern South American climate system during the LIA (cyan lines) and the CWP (fuchsia lines) for the four-model mean and for each model. Background colors and vectors show the meridional wind difference LIA minus CWP. DJF: austral summer, JJA: austral winter, ITCZ: Intertropical Convergence Zone (thick solid lines), SPSH: Subtropical South Pacific High (thin solid lines), STJ: subtropical jet (dashed lines), SWW: southern westerly winds (dash-dotted lines). Crosses indicate the location of maximum SLP over the SPSH (i.e., SPSH location). Clim. Past, 16, 79–99, 2020 www.clim-past.net/16/79/2020/
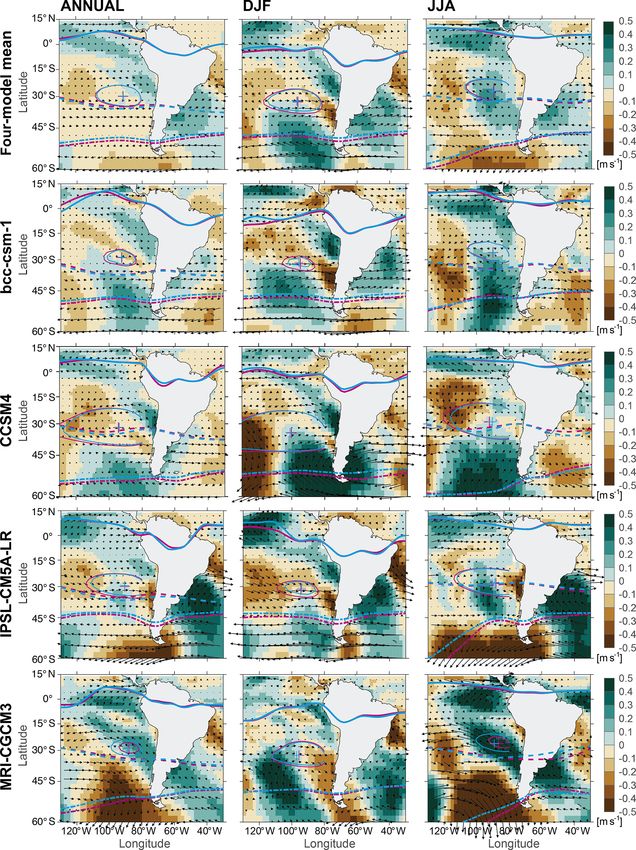
V. Flores-Aqueveque et al.: SPSH from the late Holocene to the end of the 21st century                                                    89

Figure 4. Annual and seasonal means of the southwestern South American climate system during the CWP (fuchsia lines) and 21C (dark
red lines) for the four-model mean and for each model. Background colors and vectors show the meridional wind difference CWP minus
21C. DJF: austral summer, JJA: austral winter, ITCZ: Intertropical Convergence Zone (thick solid lines), SPSH: Subtropical South Pacific
High (thin solid lines), STJ: subtropical jet (dashed lines), SWW: southern westerly winds (dash-dotted lines). Crosses indicate the location
of maximum SLP over the SPSH (i.e., SPSH location).

www.clim-past.net/16/79/2020/                                                                               Clim. Past, 16, 79–99, 2020
90                                 V. Flores-Aqueveque et al.: SPSH from the late Holocene to the end of the 21st century

January–February; DJF), when the maximum atmospheric             that leads to a strengthening of the low-level coastal jet (Gar-
pressure is located on average at ∼ 33◦ S, and austral win-      reaud and Falvey, 2009).
ter (JJA) when it moves northward at ∼ 27.5◦ S (Table S1            Wind intensity changes are also described by Belmadani
in the Supplement). This behavior agrees with the seasonal       et al. (2014), who analyzed the effect of global warming
variation observed by Rahn and Garreaud (2013) using the         on the upwelling-favorable winds along the Peruvian and
Climate Forecast System Reanalysis (CFSR) data for the pe-       Chilean coast by using the Laboratoire de Météorologie Dy-
riod 1979–2010 and by Barrett and Hameed (2017) using            namique (LMDz; Hourdin et al., 2006) global circulation
NCEP/NCAR reanalysis data for 1980–2013. The southward           model downscaled to a resolution of 0.5◦ × 0.5◦ . According
migration of the SPSH during austral summer would be at-         to these authors, the increase in the alongshore winds from
tributable to a basin-wide increase in SLP around 40◦ S in-      central to southern Chile is related to a poleward shift and/or
duced by changes in the latitudinal position of the ITCZ and     an intensification of the maximum latitudinal pressure gradi-
the presence of the South American monsoon (Rodwell and          ent associated with similar changes in the SPSH or the HC.
Hoskins, 2001).                                                     A similar trend, but of less magnitude, is observed
   Longitudinal changes are also seen at a seasonal scale,       when comparing present-day and future conditions (Fig. 4).
with maximum values of SLP located at ∼ 98◦ W during             This result is consistent with the study of Garreaud and
austral summer (DJF) and moving eastward in austral win-         Falvey (2009), who point out that the strengthening of the
ter (JJA) at ∼ 89◦ W on average (Table S1 in the Supple-         alongshore wind speed will continue throughout the 21st cen-
ment). These values are close to those obtained by Rahn and      tury. This reinforcement is characterized by a marked season-
Garreaud (2013) and Ancapichún and Garcés-Vargas (2015).         ality in which stronger meridional winds occur between 37
The latter authors, using monthly NCEP/NCAR reanalysis           and 41◦ S during austral spring–summer and migrate to sub-
data for the period 1949–2012, determined that over the past     tropical latitudes in the austral fall–winter season as a result
decade, the SPSH has intensified (at a rate of 1.36 hPa per      of an important increase in SLP (2–3 hPa) developed towards
decade) and shifted towards the southwest, with its maxi-        the southern rim of the SPSH. The authors also stated that
mum located at ∼ 37◦ S and ∼ 108◦ W during February and          by the end of this century, austral spring atmospheric coastal
March when the SPSH intensity is maximum. In contrast,           jet events will be more frequent and longer in duration that
during May, when the SPSH shows its weakest intensity, it is     present-day events.
located further north (∼ 26◦ S) and closest to the continent        These results also agree with the hypothesis of
(∼ 86◦ W). However, these observations are not in agree-         Rykaczewski et al. (2015). This hypothesis postulates that
ment with results from Barrett and Hameed (2017), who re-        the anthropogenic influence on seasonal changes and shifts
ported higher SLP values during austral spring (September        in the geographic position of the major atmospheric high-
to November) and an eastward migration during austral sum-       pressure centers will affect the intensity of upwelling-
mer, whereas weaker values and a westward shift are ob-          favorable winds.
served in austral autumn (March to May). Since both works           On the other hand, models fail in representing the position
use the NCEP/NCAR reanalysis, this discrepancy could arise       and variations of the upper-level STJ, which is displaced to
from the different methodologies used in each study to cal-      the north as the temperature increases (Figs. 3 and 4). This
culate the SPSH position and/or the different periods studied.   contradicts not only the general tendency of climate models
   Nevertheless, from our results it should be highlighted       of a poleward shift under the current global warming (e.g.,
that, regardless of seasonality, as temperature increases, a     Meehl et al., 2007; Woollings and Blackburn, 2012), but also
poleward and westward shift of the maximum value of SLP is       findings from recent observations. In fact, the analysis of to-
observed, following the expansion trend. This coincides with     tal ozone measurements from satellite and sounding data dis-
Gillett and Fyfe (2013), Rykaczewski et al. (2015), and Lu       cussed by Hudson (2012) estimates a poleward displacement
et al. (2007), who indicated that higher values of SLP would     of the STJ of 3.7 ± 0.3◦ latitude in the NH and 6.5 ± 0.2◦
tend to move poleward in response to increased greenhouse        latitude in the SH between 1979 and 2010.
gas concentrations.                                                 Changes in the SPSH also affect higher latitudes. As can
   The SPSH expansion during the CWP period is accom-            be seen in Figs. 3 and 4, the expansion (contraction) of the
panied by stronger (weaker) southerly winds south (north)        SPSH observed during relative warmer (colder) periods coin-
of ∼ 35◦ S on the southeastern side of the anticyclone dur-      cides with a southward (northward) displacement of the core
ing the austral summer. In austral winter, the opposite situ-    of the SWWs. This is valid for both seasons and the annual
ation develops, with an intensification of the coastal along-    mean of each individual model as well as the four-model
shore winds in northern to central Chile and a reduction of      mean, except for the austral winter of model MRI-CGCM3
the intensity south of ∼ 35◦ S (Fig. 3). This phenomenon         (Fig. 4). In addition, the SWWs are also stronger (weaker)
is observed systematically in each model. This effect could      during warmer (colder) periods (not shown). Therefore, an
be explained by the fact that the SPSH expands to midlat-        expanded SPSH acts to “block” the SWW belt, shifting it
itudes and shows no significant changes at subtropical lati-     southward. This behavior is observed at annual and seasonal
tudes, producing an enhanced meridional pressure gradient        mean scales, being more pronounced during austral summer.

Clim. Past, 16, 79–99, 2020                                                                   www.clim-past.net/16/79/2020/
V. Flores-Aqueveque et al.: SPSH from the late Holocene to the end of the 21st century                                          91

This is in agreement with Garreaud et al. (2009), who used         generally in good agreement with other models (e.g., Gar-
meteorological station and atmospheric reanalysis, and Swart       reaud and Falvey, 2009; Kitoh et al., 2011; Belmadani et al.,
et al. (2015), who considered 30 CMIP5 models and six re-          2014; Swart et al., 2015) as well as different sets of reanal-
analysis datasets. Garreaud et al. (2009) also pointed out that    ysis data (e.g., Barrett and Hameed, 2007; Garreaud et al.,
a contraction (expansion) of this wind belt occurs in parallel     2009; Rahn and Garreaud, 2013; Ancapichún and Garcés-
with southward (northward) seasonal shifts. However, since         Vargas, 2015). A comparison of our results with these previ-
we only analyzed the position of its core, this feature cannot     ous studies indicates that the models that we have considered
be observed from our results.                                      represent the SPSH behavior, alongshore winds, and SWW
   At longer timescales, Toggweiler et al. (2009) highlighted      changes well. However, simulations fail to represent the po-
the general relationship between the position of the wester-       sition of the STJ and its variations. The possible causes of
lies and global temperature. According to these authors, un-       this discrepancy will be explored in the next section.
der warm conditions (e.g., the CWP), the SWWs shift pole-
ward, while in cold climate periods (e.g., the Last Glacial        3.4   The link between the ITCZ and SPSH changes
Maximum), the westerlies move equatorward due to an in-
crease in sea ice around Antarctica (Bentley et al., 2009).        Different paleoclimate studies have linked changes in the
This northward shift could in turn “block” the SPSH, limit-        ITCZ–SPSH system to variations in the SPSH (Sifeddine
ing its expansion and southward displacement. A similar ef-        et al., 2008; Gutiérrez et al., 2009; Briceño-Zuluaga et al.,
fect could be produced by an increase in SWW intensity as a        2016; Fleury et al., 2015; Flores-Aqueveque et al., 2015). To
result of a decrease in the latitudinal thermal gradient or due    evaluate the role of the ITCZ in SPSH changes, we analyze
to an increased pressure gradient related to the differential      the position of the ITCZ during the three considered periods.
heating between SA and the South Pacific.                          Figure 1b shows that, in general, model simulations represent
   The southward migration, together with the increase in          an ITCZ that is located north of the Equator (∼ 10◦ N) during
its core strength, experienced by the SWWs during the last         austral winter (JJA) and moves southward (∼ 5◦ S) in austral
decades has been related to the shift to an increasingly posi-     summer (DJF). This range is very similar to the observed
tive phase of the SAM (e.g., Thompson et al., 2000; Thomp-         present-day conditions, in which the ITCZ is displaced sea-
son and Solomon, 2002; Marshall et al., 2004; Garreaud et          sonally from 9◦ N to 2◦ S (Denniston et al., 2016). However,
al., 2009; Swart and Fyfe, 2012) as a response to changes in       according to Schneider et al. (2014), the ITCZ moves be-
stratospheric ozone and greenhouse forcing (Thompson and           tween 9◦ N in austral winter (JJA) and 2◦ N in austral summer
Solomon, 2002; Gillett and Thompson, 2003; Shindell and            (DJF) over the central Atlantic and Pacific oceans, suggest-
Schmidt, 2004; Ihara and Kushnir, 2009; Son et al., 2010;          ing that the considered models locate the ITCZ further south
Gillett and Parker, 2013). This confirms what was previously       of its present-day position, especially in austral summer. In
stated by Pittock (1980) and Aceituno et al. (1993), who pro-      fact, the bias of global models representing the ITCZ and its
posed that the position of the SWWs depends on the location        different causes has been widely discussed in the literature
of the SPSH and the circum-Antarctic low-pressure belt.            (e.g., Hwang and Frierson, 2013; Hirota and Takayabu, 2013;
   The trend in the SWWs is also observed in several model         Colas et al., 2012; Gordon et al., 2000; Ma et al., 1996).
projections for the 21st century, which highlight the ten-            In Figs. 3 and 4, it can also be observed that, generally,
dency toward a poleward shift and an intensification of the        the ITCZ shifts southward over the Pacific as temperature in-
SWWs related to anthropogenic global warming (e.g., Fyfe           creases at annual and seasonal scales, with this difference be-
and Saenko, 2006; Ihara and Kushnir, 2009; Kitoh et al.,           ing more marked during austral summer. Over the Atlantic,
2011; Chavaillaz et al., 2013; Bracegirdle et al., 2018).          in general, the opposite occurs: the ITCZ migrates slightly to
   Changes associated with SWW variations have already             the north during the 21C (Fig. 4), but it does not exhibit sig-
shown visible effects in southern SA as an increase in de-         nificant differences between the LIA and the CWP (Fig. 3).
sertification in northern Chile (Salinas and Mendieta, 2013;       Furthermore, we analyze the meridional mass stream func-
Ortega et al., 2019) and a notable decrease in annual precip-      tion (as a proxy for the HC strength) and the zonal mean
itation from central Chile to central Patagonia (Boisier et al.,   precipitation during the LIA and the CWP (Fig. 5). Our re-
2018), exhibiting important impacts on socioeconomic activ-        sults show a southern branch of the HC that intensifies during
ities in this region. Moreover, our results suggest that conse-    the cold period (LIA) and weakens in the current period at
quences related to SWW changes during the next decades,            annual and seasonal scales. In addition, no evident shifts of
not only in southern SA (e.g., Vera et al., 2006; Meehl et         the northern and southern HC branches are observed between
al., 2007) but also at a global scale, for example through the     the two periods. Generally, a similar feature is observed in all
release of CO2 from the Southern Ocean to the atmosphere           models but with different magnitude (Fig. S2).
(e.g., Menviel et al., 2018; Saunders et al., 2018), could be         A comparison of the intensity of the precipitation rate be-
expected.                                                          tween the LIA and the CWP indicates no significant differ-
   Summarizing, our results show that the numerical simu-          ences between periods. However, as can be noted in Fig. 5,
lations analyzed here are consistent among themselves and          the maximum precipitation during the CWP is slightly higher

www.clim-past.net/16/79/2020/                                                                       Clim. Past, 16, 79–99, 2020
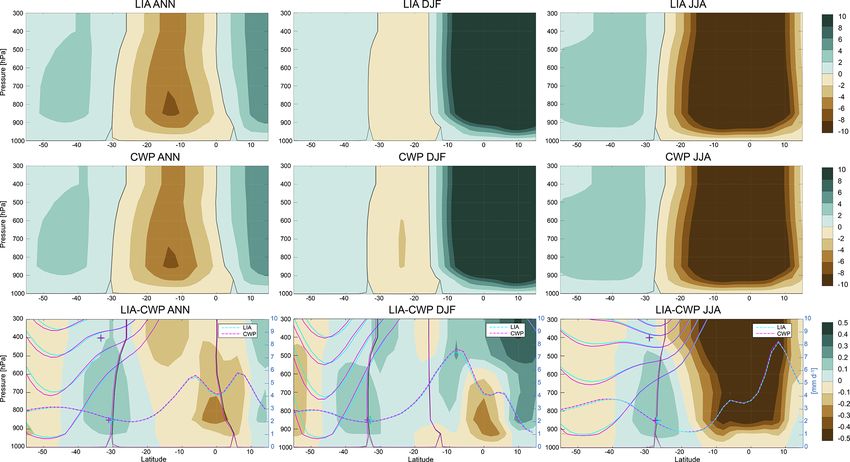
92                                    V. Flores-Aqueveque et al.: SPSH from the late Holocene to the end of the 21st century

Figure 5. Mass stream function ensemble mean during the LIA, CWP, and LIA–CWP (shades) for the annual mean (ANN), austral summer
(DJF), and austral winter (JJA). The zonal mean precipitation (dash-dotted lines), zonal mean winds (solid lines), subtropical ridge position
(lower crosses), and latitude of maximum zonal winds at 200 hPa (upper crosses) during the LIA (cyan) and the CWP (magenta) are also
shown.

than in the LIA. In addition, zonal winds at 200 hPa show al-            pected, the ITCZ moves southward. Schneider et al. (2014)
most no differences between the LIA and the CWP but ap-                  justify this behavior considering variations in the tropical net
pear to be located southward (equatorward) during the warm               energy input to the atmosphere. Slight changes in the atmo-
(cold) period. Similar results were obtained for each individ-           spheric energy flux can produce substantial ITCZ migrations,
ual model (Fig. S2).                                                     with this sensitivity being one of the possible explanations
   These results contradict the mechanism proposed by Lee                for the difficulty that current climate models have in simulat-
et al. (2011), which states that the ITCZ moves southward                ing the ITCZ position (Schneider et al., 2014).
and the southern branch of the HC becomes weaker, decreas-                  On the other hand, Yan et al. (2015), based on paleohydrol-
ing the intensity of the STJ, as a response to NH (i.e., North           ogy records of the western Pacific and climate models, pro-
Atlantic) cooling. These authors indicate that a colder NH               posed that during the LIA the tropical rain belt (i.e., the lat-
increases the north–south surface pressure interhemispheric              itudinal range over which the ITCZ seasonally moves) con-
gradient, driving an anomalous southward equatorial flow                 tracted, instead of a meridional shift as has been previously
and shifting the annual mean position of the ITCZ south-                 described (e.g., Lee et al., 2011). More generally, these au-
ward. According to Sachs et al. (2009), this shift would have            thors proposed that over the western Pacific, the ITCZ ex-
reached its southernmost position, of up to 500 km, during               pands and contracts over decadal to centennial timescales in
the LIA (1400–1850 CE).                                                  response to external forcing, rather than showing a latitudi-
   According to the literature, the ITCZ has shown impor-                nal migration. The same is observed by the analysis of stalag-
tant changes during the LM. Regarding the ITCZ position,                 mites in southern China discussed by Denniston et al. (2016),
Schneider et al. (2014) stated that during the LIA, the ITCZ             who pointed out that the latitudinal movement range of the
experienced a southward shift, explained by a cooling of the             ITCZ expanded and contracted during the last 3000 years in
NH extratropics relative to its southern counterpart. How-               a process that operates at multidecadal to centennial scales.
ever, this shift is not always supported by this mechanism.                 Reanalysis data for the 20th century also support the idea
The same authors indicate that ITCZ migrations are modu-                 that the ITCZ does not migrate significantly with climate
lated by ENSO. In fact, during the transition from La Niña               changes. In this sense, D’Agostino and Lionello (2016) in-
to El Niño, or during strong El Niño events, the NH extrat-              dicated that since 1979, the ITCZ has shown no significant
ropics warm around 0.08 ◦ C more than the SH extratropics                trend. However, they observed that the southern branch of the
(Hansen et al., 2010), but contrary to what should be ex-                HC migrates southward mainly during austral summer, while

Clim. Past, 16, 79–99, 2020                                                                             www.clim-past.net/16/79/2020/
You can also read


