Patterns of (trace) metals and microorganisms in the Rainbow hydrothermal vent plume at the Mid-Atlantic Ridge - VLIZ
←
→
Page content transcription
If your browser does not render page correctly, please read the page content below
Biogeosciences, 17, 2499–2519, 2020
https://doi.org/10.5194/bg-17-2499-2020
© Author(s) 2020. This work is distributed under
the Creative Commons Attribution 4.0 License.

Patterns of (trace) metals and microorganisms in the Rainbow
hydrothermal vent plume at the Mid-Atlantic Ridge
Sabine Haalboom1, , David M. Price1,a, , Furu Mienis1 , Judith D. L. van Bleijswijk1 , Henko C. de Stigter1 ,
Harry J. Witte1 , Gert-Jan Reichart1,2 , and Gerard C. A. Duineveld1
1 NIOZ  Royal Netherlands Institute for Sea Research, department of Ocean Systems, and Utrecht University,
P. O. Box 59, 1790 AB Den Burg, Texel, the Netherlands
2 Utrecht University, Faculty of Geosciences, 3584 CD Utrecht, the Netherlands
a current address: University of Southampton, Waterfront Campus, European Way, Southampton, SO14 3ZH, UK
 These authors contributed equally to this work.

Correspondence: Sabine Haalboom (sabine.haalboom@nioz.nl) and David M. Price (d.m.price@soton.ac.uk)

Received: 16 May 2019 – Discussion started: 20 June 2019
Revised: 27 February 2020 – Accepted: 16 March 2020 – Published: 12 May 2020

Abstract. Hydrothermal vent fields found at mid-ocean           (trace) metals and REEs, as, for example, Fe, Cu, V, Mn and
ridges emit hydrothermal fluids that disperse as neutrally      REEs were enriched by factors of up to ∼ 80, ∼ 90, ∼ 52,
buoyant plumes. From these fluids seafloor massive sulfides     ∼ 2.5 and ∼ 40, respectively, compared to above-plume wa-
(SMS) deposits are formed, which are being explored as pos-     ter samples taken at 1000 m water depth. The concentrations
sible new mining sites for (trace) metals and rare earth ele-   of these elements changed as the plume aged, shown by the
ments (REEs). It has been suggested that during mining ac-      decrease in element / Fe molar ratios of chalcophile elements
tivities large amounts of suspended matter will appear in the   (Cu, Co, Zn), indicative of rapid removal from the hydrother-
water column due to excavation processes and discharge of       mal plume or removal from the solid phase. Conversely, in-
mining waste from the surface vessel. Understanding how         creasing REE / Fe molar ratios imply uptake of REEs from
hydrothermal plumes can be characterised by means of geo-       the ambient seawater onto Fe-oxyhydroxides. This was also
chemistry and microbiology as they spread away from their       reflected in the background pelagic system, as Epsilonpro-
source and how they affect their surrounding environment        teobacteria started to dominate and univariate microbial bio-
may help in characterising the behaviour of the dilute distal   diversity declined with distance away from the Rainbow hy-
part of chemically enriched mining plumes.                      drothermal vent field. The Rainbow hydrothermal plume pro-
   This study on the extensive Rainbow hydrothermal plume,      vides a geochemically enriched natural environment, which
observed up to 25 km downstream from the vent site, enabled     is a heterogeneous, dynamic habitat that is conducive to eco-
us to investigate how microbial communities and (trace)         logical changes in a short time span. This study of a hy-
metal composition change in a natural plume with distance.      drothermal plume provides a baseline study to characterise
The (trace) metal and REE content of suspended particulate      the natural plume before the interference of deep-sea min-
matter (SPM) was determined using sector field inductively      ing.
coupled plasma mass spectrometry (SF-ICP-MS) with high
resolution (HR), and the microbial communities of the neu-
trally buoyant plume, above-plume, below-plume, and near-
bottom water and sediment were characterised by using 16S       1   Introduction
rRNA amplicon sequencing methods. Both vertically in the
                                                                Hydrothermal vent fields found at mid-ocean ridges and
water column and horizontally along the neutrally buoyant
                                                                back-arc basins are known for discharging fluids rich in po-
plume, geochemical and biological changes were evident, as
                                                                tential microbial energy sources, such as H2 , H2 S, CH4 , NH4
the neutrally buoyant plume stood out by its enrichments in
                                                                and Fe (Jannasch and Mottl, 1985; McCollom, 2000). In ad-

Published by Copernicus Publications on behalf of the European Geosciences Union.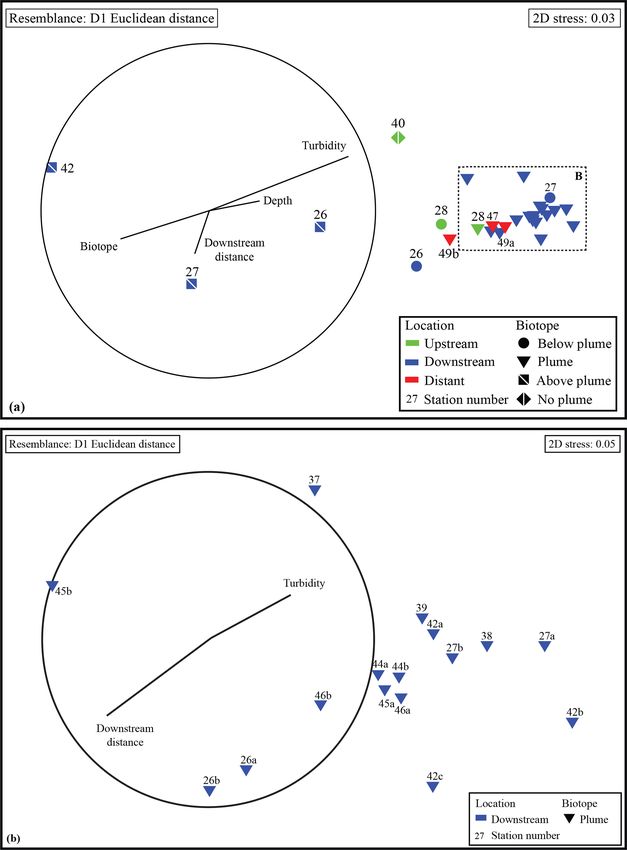
2500                              S. Haalboom et al.: Trace metals and microorganisms along a hydrothermal vent plume

dition, they are characterised by the presence of polymetal-       25 km from the Rainbow hydrothermal vent field showed en-
lic sulfide deposits containing high grades of metals like Cu,     richments of Fe, Cu, Mn, V, As and P, as well as REEs (Chav-
Co, Zn and rare earth elements (REEs) (Cave et al., 2002;          agnac et al., 2005), as a result of fallout from the hydrother-
Chavagnac et al., 2005). Because of the steadily increas-          mal plume. It has further been shown that microbial activity
ing demand for these metals and their geopolitical distribu-       influences geochemical processes in the plume (Breier et al.,
tion on land, hydrothermal vent deposits are explored as new       2012; Dick et al., 2013), such as scavenging and oxidation of
mining sites (Hoagland, 2010). Since such areas accommo-           metals (Cowen and Bruland, 1985; Cowen et al., 1990; Man-
date unique and vulnerable marine life, serious concerns ex-       dernack and Tebo, 1993; Dick et al., 2009), influencing the
ist about the environmental sustainability of seafloor mas-        local ocean geochemistry.
sive sulfide (SMS) deposit mining (Boschen et al., 2013;              Microbial activity within the plume is fuelled by re-
Collins et al., 2013), especially with regard to the effects of    dox reactions that provide energy for chemolithoautotrophic
the different plumes, which are generated during the exca-         microbial taxa. The abundance of energy sources within
vation of ores and by the return flow of wastes in the vicin-      plumes and hydrothermal systems support a plethora of
ity of hydrothermal vents (Ramirez-Llodra et al., 2011; Vare       chemolithoautotrophic microbial communities (e.g. Orcutt et
et al., 2018). As SMS mining will concentrate on deposits          al., 2011; Frank et al., 2013; Anantharaman et al., 2016).
around hydrothermal vents and not on active vents or chim-         Plume microbial communities can be distinct or relatively
neys due to technical risks associated with high temperatures      similar to background communities (Dick and Tebo et al.,
(Gwyther et al., 2008), it is likely that the background and ex-   2010; Sheik et al., 2015; Olins et al., 2017), with plume-
tinct vent communities (from microorganisms to megafauna)          associated bacteria originating from either seafloor commu-
will be impacted through habitat loss, mechanical destruc-         nities, background seawater communities or from growth
tion, noise, smothering and bioaccumulation of toxic sub-          within the plume (Dick et al., 2013). Djurhuus et al. (2017)
stances (Levin et al., 2016). However, knowledge about the         observed the reduction in dominance of vent-associated mi-
background ecosystem and natural plume is sparse, as the           croorganisms with increased redox potential, suggesting that
vents and their proximal fauna have attracted most of the at-      communities associated with the initial rising plume become
tention in, for example, microbiology (e.g. Han et al., 2018;      diluted on a scale of metres. Comparatively little is known
Cerqueira et al., 2018).                                           about changes in chemical composition and microbial as-
   To fill this gap, the Dutch TREASURE project (STW-              semblages in the hydrothermal plume after its initial rise,
NWO) was focussed on describing the structure of the back-         when it becomes neutrally buoyant and is dispersed by cur-
ground pelagic and benthic communities of an active hy-            rents, remaining traceable in particulate form at least 50 km
drothermal vent site with SMS deposits on the Mid-Atlantic         away from its source (Severmann et al., 2004) and even up to
Ridge (MAR). The Rainbow hydrothermal vent (36◦ 1400 N             4000 km in dissolved form (Resing et al., 2015). Considering
on the MAR) was selected for this study as it ejects one of the    the majority of microbial growth is predicted to occur in the
most prominent and persistent natural plumes on the MAR.           neutrally buoyant portion of the plume (Reed et al., 2015),
Hydrothermal plumes represent a distinct natural ecosystem         further efforts should be concentrated on sampling this por-
in itself, which under the influence of currents may extend        tion of the plume.
tens of kilometres away from its point of origin. Basic knowl-        In order to address this gap, water column and sediment
edge of natural plumes is essential to be able to discern im-      samples from the Rainbow hydrothermal vent area were in-
pacts arising from future SMS mining plumes created in the         vestigated during the TREASURE cruise. Geochemical and
vicinity of the hydrothermal vent, which are likely to inter-      biological changes were explored vertically in the water col-
fere with the natural hydrothermal plume. Though mining            umn and horizontally along the neutrally buoyant plume us-
plumes will have a higher initial density and therefore tend       ing sector field inductively coupled plasma mass spectrom-
to sink rather than maintain buoyancy (Gwyther et al., 2008;       etry (SF-ICP-MS) with high resolution (HR) to determine
Boschen et al., 2013), the finest and slowest-sinking fraction     the (trace) metal and REE content of the suspended par-
of suspended solids in the mining plume may interfere with         ticulate matter (SPM). Next-generation sequencing methods
the natural plume during its dispersal, especially when re-        were used to quantify the microbial diversity in the pelagic
leased above the seafloor.                                         system, which was influenced by the hydrothermal plume.
   Since the discovery of the Rainbow hydrothermal vent            Whilst mechanical understanding of microbial and geochem-
field in 1996 by German et al. (1996), several studies con-        ical interactions in the plume would have required a differ-
cerning the composition of the hydrothermal fluid and the          ent experimental setup, which was beyond the scope of the
sediment influenced by fallout of particulates from the Rain-      TREASURE project, this paper aims to contribute to knowl-
bow and other hydrothermal plumes have been published.             edge of geochemical and biological heterogeneity in the sur-
These showed, for example, that the underlying host rock           roundings of an SMS site, induced by the presence of an ac-
influences the hydrothermal fluid composition (Wetzel and          tive hydrothermal plume, which should be taken into account
Shock, 2000; Marques et al., 2006). Geochemical investiga-         in environmental impact assessments of SMS mining.
tion of sediment by Cave et al. (2002) at distances of 2 to

Biogeosciences, 17, 2499–2519, 2020                                                    www.biogeosciences.net/17/2499/2020/
S. Haalboom et al.: Trace metals and microorganisms along a hydrothermal vent plume 2501
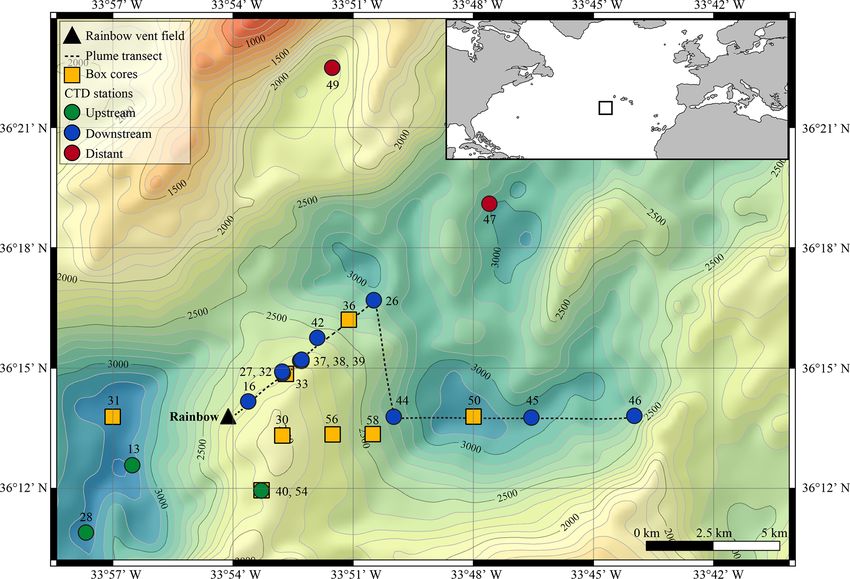
Figure 1. Geographical location (inset) and bathymetric map of the Rainbow study site on the Mid-Atlantic Ridge (from the European
Marine Observations and Data Network, EMOD, database), with sampling locations depicted.
2 Material and methods riched in Cu, Zn, Co and Ni when compared to vent systems
with a basaltic host rock (Charlou et al., 2002).
2.1 Study site The vent field consists of 10 active, high-temperature
(365 ◦ C), black smokers and emits an extensive plume with
The Rainbow hydrothermal vent field (Fig. 1) is located on a distinct chemical composition compared to the ambient
the Mid-Atlantic Ridge (MAR) at 36◦ 13.80 N, 33◦ 54.14 W, seawater (Severmann et al., 2004). The plume is considered
at approximately 2300 m water depth, southwest of the the largest and widest spreading in the region (German et
Azores. The vent field is located on the western flank on the al., 1996), rising up to 200 m above its source and traceable
non-volcanic Rainbow Ridge, in an offset between the South over at least 50 km (Severmann et al., 2004). Controlled by
Alvin Mid-Atlantic Ridge (AMAR) and AMAR segments of the local hydrodynamic regime and topography (Thurnherr
the MAR (German et al., 1996; Fouquet et al., 1998; Dou- and Richards, 2001; Thurnherr et al., 2002), the neutrally
ville et al., 2002). It is located at the intersection between the buoyant plume moves predominantly to the north and east
non-transform fault system and the ridge faults (Charlou et around the Rainbow Ridge with an average current speed
al., 2002), making this vent field tectonically controlled. The of 5–6 cm s−1 and continues in a northward direction along
vent field, which is approximately 100 m by 250 m in size, is the southern and eastern side of the rift valley of the AMAR
underlain by a basement composed of ultramafic rocks (Ed- segments (Edmonds and German, 2004). Characteristics and
monds and German, 2004; Marques et al., 2006). The ultra- behaviour of the Rainbow plume are relatively well studied,
mafic setting of Rainbow is atypical for the region, which which make the Rainbow vent field a suitable site to study
is dominated by basalt-hosted vent systems (Douville et al., neutrally buoyant plumes.
2002). Due to serpentinisation reactions during the circu-
lation of the hydrothermal fluid in the peridotite basement 2.2 Water column and sediment sampling
rocks, the Rainbow vent field produced plumes particularly
enriched in transition metals (notably Fe, Mn and Cu) and Water samples and sediment cores were collected along the
REEs (Douville et al., 2002; Findlay et al., 2015). On the path of the plume during RV Pelagia cruise 64PE398 in
contrary, the plumes are depleted in hydrogen sulfides (Char- April 2015. Five putatively distinct biotopes were sampled:
lou et al., 2002; Douville et al., 2002), resulting in relatively (i) above-plume (1000 m water depth), (ii) plume, (iii) below-
high metal / sulfide ratios. Consequently, the chimneys and plume (10 m above the bottom), (iv) near-bottom water and
the SMS deposits of the Rainbow hydrothermal field are en- (v) sediment.
www.biogeosciences.net/17/2499/2020/ Biogeosciences, 17, 2499–2519, 2020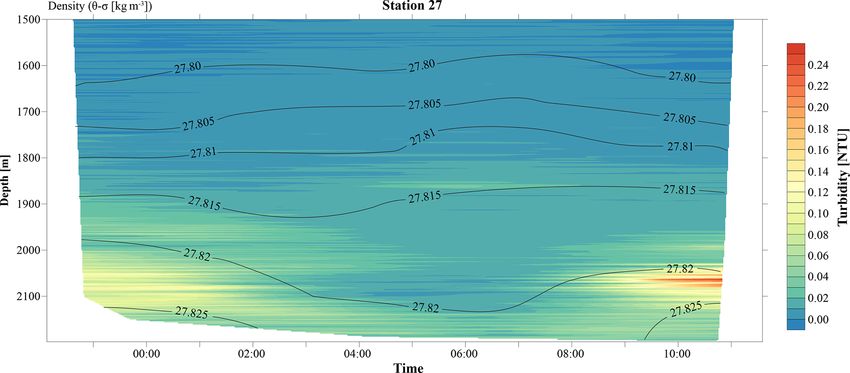
2502                              S. Haalboom et al.: Trace metals and microorganisms along a hydrothermal vent plume

   Using conductivity, temperature and depth (CTD) casts           2.4   Chemical analysis
with a Seabird 911 CTD rosette system, the plume was traced
in real time using turbidity as an indicator, measured in          For analysis of major and trace metals present in particulate
Nepheloid Turbidity Units (NTUs) with a WetLabs turbidity          form in and around the hydrothermal plume, water samples
sensor. Other variables measured included temperature (◦ C),       were filtered on board over acid-cleaned 0.45 µm polysul-
salinity, density (σ − θ , kg m−3 ), dissolved oxygen (ml L−1 )    fone filters directly from the Niskin bottle at ambient tem-
and chlorophyll (µg L−1 ). At five stations, continuous yo-yo      perature while applying under pressure. A water barrel in
CTD casts were taken over the course of 12 h to study the          between the filtration holder and pump allowed for volume
temporal changes of the hydrothermal plume.                        measurements of filtered water. The filters were subsequently
   A total of 41 water samples were collected using 12 L           stored at −20 ◦ C until further examination. Filters were dried
Niskin bottles from 11 downstream stations, 2 distal down-         in the laboratory in an Interflow laminar flow bench at room
stream stations and 3 upstream stations. Once the CTD was          temperature prior to analysis. Subsequently, the filters were
back on deck, three distinct water samples were immediately        placed in acid-cleaned Teflon vials and were subjected to a
taken for SPM, trace metals and the microbial community.           total digestion method. For this purpose a mixture of 6.5 mL
   Depths for sampling SPM were chosen to comprise the             HNO3 (ultrapure) / HF (suprapure) (10 : 1) solution, 1 mL
largest variation in turbidity measured by the WetLabs tur-        HCl (ultrapure) and 1 mL HClO4 (ultrapure) was added to
bidity sensor in a vertical profile so that the sensor could be    the vials, after which the vials were covered and placed in an
reliably calibrated and readings converted to milligrams per       Analab HotBlock for 48 h at 125 ◦ C. After the filters were
litre. If possible, trace metal and microbial community sam-       completely dissolved, the covers were taken off from the
ples were taken at the same stations and/or same depth.            vials and the vials were left for 24 h in order to evaporate the
   Sediment and near-bottom water samples were collected           acids. Finally, the residue was taken up again in 10 mL 1M
with a NIOZ-designed box corer of 50 cm diameter equipped          ultra grade HNO3 , and pre-spiked with 5 ppb scandium and
with a top valve to prevent flushing, subsequently trapping        5 ppb rhodium as internal standards. Furthermore, 10 proce-
near-bottom water (van Bleijswijk et al., 2015). In total, eight   dural blanks were performed. Half of them were empty acid-
cores were collected (Table 1). Due to unsuitable coring sub-      cleaned Teflon vials, the other five contained an acid-cleaned
strates, CTD locations and coring sites did not always follow      blank filter in order to correct for the dissolved filters. These
the same track. Box cores were taken on the eastern part of        blanks were subjected to the same total digestion method as
the Rainbow Ridge, continuing in the basin east of the ridge,      described above. A SF-ICP-MS (Thermo Element II) at the
while two cores were taken on the northwestern flank of the        Royal Netherlands Institute for Sea Research (NIOZ) was
ridge, following the path of the plume.                            used to analyse the concentrations of major and trace metals,
                                                                   as well as REEs. The concentrations were calculated using
2.3    Suspended particulate matter analysis                       external calibration lines made from a multi-stock solution,
                                                                   which was prepared by mixing Fluka TraceCert standards for
From each 12 L Niskin bottle, two 5 L subsamples were col-         ICP. Rh was used as an internal standard for all elements.
lected to determine the concentration of SPM. The subsam-          The machine drift was measured before, halfway and after
ples were filtered on board over pre-weighed 0.4 µm polycar-       each series of samples and was monitored by using an ex-
bonate filters. The filters were rinsed with ∼ 10 mL of Milli-     ternal drift solution. Precision (relative standard deviation,
Q water to remove salt while still applying under pressure         RSD) of these analyses was generally < 2 % for major and
and subsequently stored at −20 ◦ C on board. In the labora-        trace metals, apart from 115 In, where the RSD values gen-
tory, the filters were freeze dried and then weighed in dupli-     erally are between 4 % and 8 %, with maximum values go-
cate, or in triplicate if the difference between the first two     ing up to 12.48 %. For REEs, the RSD values were generally
measurements was more than 0.03 mg. To yield SPM con-              < 3 %, apart from a few measurements where RSD values
centrations, the net dry weight of the SPM collected on the        reached maximums up to 12.48 %. The accuracy could not be
filters (average of 0.25 mg), corrected by the average weight      determined as no certified reference material was analysed. A
change of all blank filters (0.04 mg), was divided by the vol-     blank correction was applied to the sample data by subtract-
ume of filtered seawater (5 L). Subsequently, the filters were     ing average values measured for five dissolved blank filters,
examined using a Hitachi TM3000 tabletop scanning elec-            which for the majority of the measured elements accounted
tron microscope (SEM) connected to an energy-dispersive            for less than 10 % of the sample values. Subsequently, the
spectroscopy (EDS) detector to visualise content of the SPM        data were recalculated to account for the dilution of the sam-
and to qualitatively analyse the chemical composition. The         ples during the total digestion and the amount of seawater
SEM was operated under an acceleration voltage of 15 kV            that was filtered to yield the true concentration of each ele-
and a filament current of 1850 mA.                                 ment.

Biogeosciences, 17, 2499–2519, 2020                                                     www.biogeosciences.net/17/2499/2020/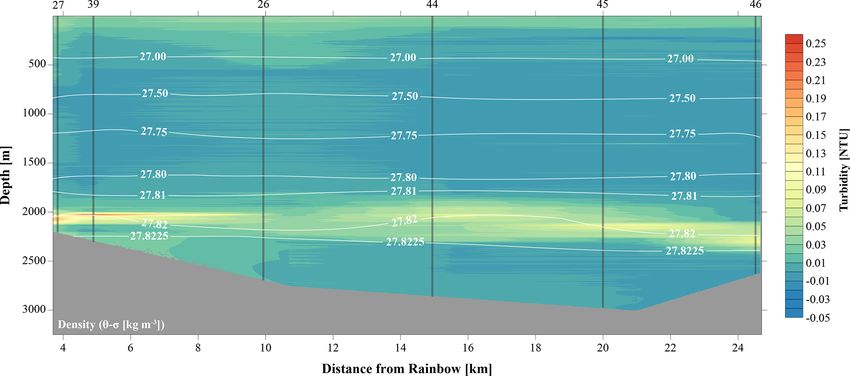
S. Haalboom et al.: Trace metals and microorganisms along a hydrothermal vent plume                                             2503

Table 1. Metadata of samples taken.

      Station   Latitude         Longitude        Biotope                          Sample     Depth   Micro-    SPM   (Trace)
                                                                                   type         (m)   biology         metals
      30        36◦ 130 1900 N   33◦ 520 4600 W   Sediment and near-bottom water   Box core   1970      x
      31        36◦ 130 4700 N   33◦ 570 0000 W   Sediment and near-bottom water   Box core   3190      x
      33        36◦ 140 5100 N   33◦ 520 4100 W   Sediment and near-bottom water   Box core   2223      x
      36        36◦ 160 1300 N   33◦ 510 0600 W   Sediment and near-bottom water   Box core   2857      x
      50        36◦ 130 4700 N   33◦ 470 6000 W   Sediment and near-bottom water   Box core   3157      x
      54        36◦ 110 5700 N   33◦ 530 4600 W   Sediment and near-bottom water   Box core   2129      x
      56        36◦ 130 2100 N   33◦ 510 3100 W   Sediment and near-bottom water   Box core   2198      x
      58        36◦ 130 2100 N   33◦ 500 3100 W   Sediment and near-bottom water   Box core   2514      x
      13        36◦ 120 3500 N   33◦ 560 3100 W   Above-plume                      CTD         125      x
      13        36◦ 120 3500 N   33◦ 560 3100 W   Below-plume                      CTD        3220      x
      13        36◦ 120 3500 N   33◦ 560 3100 W   Plume                            CTD        2000      x
      16        36◦ 140 1000 N   33◦ 530 3700 W   Plume                            CTD        1944      x
      16        36◦ 140 1000 N   33◦ 530 3700 W   Above-plume                      CTD         998      x
      26        36◦ 160 4100 N   33◦ 500 2900 W   Below-plume                      CTD        2756      x        x      x
      26        36◦ 160 4100 N   33◦ 500 2900 W   Plume                            CTD        2150      x        x      x
      26        36◦ 160 4100 N   33◦ 500 2900 W   Plume                            CTD        2000               x      x
      26        36◦ 160 4100 N   33◦ 500 2900 W   Above-plume                      CTD         999      x        x      x
      27        36◦ 160 5200 N   33◦ 520 4500 W   Below-plume                      CTD        2191      x               x
      27        36◦ 160 5200 N   33◦ 520 4500 W   Plume                            CTD        2077      x               x
      27        36◦ 160 5200 N   33◦ 520 4500 W   Plume                            CTD        1996                      x
      27        36◦ 160 5200 N   33◦ 520 4500 W   Above-plume                      CTD         994      x               x
      28        36◦ 100 5400 N   33◦ 570 4000 W   Below-plume                      CTD        3170      x        x      x
      28        36◦ 100 5400 N   33◦ 570 4000 W   Plume                            CTD        1975      x        x      x
      32        36◦ 140 5500 N   33◦ 520 4600 W   Plume                            CTD        2192               x
      32        36◦ 140 5500 N   33◦ 520 4600 W   Plume                            CTD        2088               x
      37        36◦ 150 1100 N   33◦ 520 1900 W   Plume                            CTD        2190                      x
      38        36◦ 150 1100 N   33◦ 520 1700 W   Plume                            CTD        2040                      x
      39        36◦ 150 1300 N   33◦ 520 1700 W   Plume                            CTD        2019                      x
      40        36◦ 110 5700 N   33◦ 530 1800 W   No plume                         CTD        2120                      x
      42        36◦ 150 4500 N   33◦ 510 5400 W   Plume                            CTD        2291      x        x      x
      42        36◦ 150 4500 N   33◦ 510 5400 W   Plume                            CTD        2209      x        x      x
      42        36◦ 150 4500 N   33◦ 510 5400 W   Plume                            CTD        2037               x      x
      42        36◦ 150 4500 N   33◦ 510 5400 W   Above-plume                      CTD         999      x        x      x
      44        36◦ 130 4700 N   33◦ 490 5900 W   Below-plume                      CTD        2623      x
      44        36◦ 130 4700 N   33◦ 490 5900 W   Plume                            CTD        2202               x      x
      44        36◦ 130 4700 N   33◦ 490 5900 W   Plume                            CTD        2002      x        x      x
      44        36◦ 130 4700 N   33◦ 490 5900 W   Above-plume                      CTD         995      x
      45        36◦ 130 4600 N   33◦ 460 3300 W   Below-plume                      CTD        3004      x
      45        36◦ 130 4600 N   33◦ 460 3300 W   Plume                            CTD        2166               x      x
      45        36◦ 130 4600 N   33◦ 460 3300 W   Plume                            CTD        2002      x        x      x
      45        36◦ 130 4600 N   33◦ 460 3300 W   Above-plume                      CTD         996      x
      46        36◦ 130 4900 N   33◦ 430 5900 W   Below-plume                      CTD        2622      x
      46        36◦ 130 4900 N   33◦ 430 5900 W   Plume                            CTD        2280      x        x      x
      46        36◦ 130 4900 N   33◦ 430 5900 W   Plume                            CTD        2145               x      x
      46        36◦ 130 4900 N   33◦ 430 5900 W   Above-plume                      CTD        1000      x
      47        36◦ 190 0600 N   33◦ 470 3600 W   Below-plume                      CTD        2850
      47        36◦ 190 0600 N   33◦ 470 3600 W   Plume                            CTD        2200      x               x
      49        36◦ 220 1900 N   33◦ 510 3100 W   Plume                            CTD        2260      x        x      x
      49        36◦ 220 1900 N   33◦ 510 3100 W   Plume                            CTD        1902               x      x

www.biogeosciences.net/17/2499/2020/                                                          Biogeosciences, 17, 2499–2519, 2020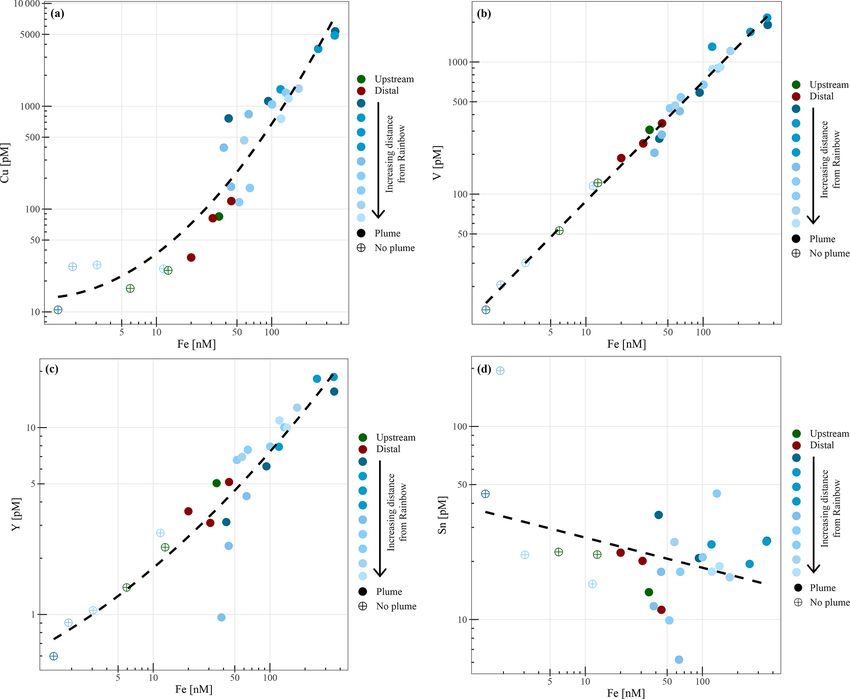
2504                                 S. Haalboom et al.: Trace metals and microorganisms along a hydrothermal vent plume

2.5    Microbial community                                              2.6    Statistics

Three distinct samples of 2 L of water were collected from              Unconstrained ordination techniques were utilised to dis-
three different Niskin bottles for next-generation sequencing           tinguish biotopes and general community patterns. Non-
(NGS). The water was filtered immediately after collection              metric multidimensional scaling plots (NMDS) were cre-
through a 0.2 µm polycarbonate filter (Nuclepore), facilitated          ated based upon Bray–Curtis similarity matrices of square-
by a vacuum of 0.2 bar, in a climate-controlled room at 4 ◦ C           root-transformed microbial community assemblages. Group
to limit DNA degradation. From the box cores > 0.25 g of                average clustering was also utilised in order to quantify
surface sediment was scraped off with a sterilised spatula,             similarities between the samples. ANalysis Of SIMilarities
whilst 1.5 L of overlying (near-bottom) water was filtered as           (ANOSIM) was subsequently used to statistically test com-
above. Filters were stored in a 2 mL cryo-vial and all samples          munity distinctions based upon presumed biotopes (sedi-
were stored at −80 ◦ C on board.                                        ment, near-bottom water, below-plume water, plume water
   DNA was extracted using a Power Soil DNA Isolation Kit               and above-plume water). In addition, all water column sam-
(MoBio, now Qiagen) according to the manufacturer’s pro-                ples were plotted in separate NMDS plots to observe patterns
tocol. Each DNA extract concentration was quantified using              in greater detail. Physical properties of all water samples (sta-
a Qubit 3.0 fluorimeter (Qiagen, Inc.) and stored at −20 ◦ C            tion, depth, turbidity and location) were depicted in a NMDS
before amplification. Extracts were combined with Phusion               plot to observe sample similarities. These environmental data
Taq (Thermo Scientific), High-Fidelity Phusion polymerase               were normalised, and Euclidean distance was used to create a
buffer and universal primers to amplify the V4 region of 16S            similarity matrix. The relationship between Fe and turbidity
rDNA of bacteria and archaea (Table 2), with unique molec-              was tested with a linear regression analysis. Trace metals and
ular identifier (MID) combinations to identify the different            REEs were normalised to Fe, since it is the primary particle-
samples. All negative controls from all polymerase chain re-            forming element at all stages of plume dispersion, giving in-
action (PCR) series were labelled with the same unique MID.             sight into the chemical behaviour. All multivariate statistics
The PCR settings were as follows: 30 s at 98 ◦ C, 29 cycles             were undertaken in Primer™ V6 (Clarke and Gorley, 2006).
(10 s at 98 ◦ C, 20 s at 53 ◦ C, 30 s at 72 ◦ C) and 7 min at 72 ◦ C.      The Shannon–Wiener index (loge ) was calculated as a di-
Four and three samples were rerun at 30 and 32 cycles, re-              versity measure. Biodiversity differences between biotopes
spectively, in order to yield enough product. Each sample               were tested with the non-parametric Kruskal–Wallis test with
was subjected to the PCR protocol in triplicate and processed           pairwise comparisons, as the data did not meet normality or
independently to avoid bias. A total of 5 µL of product was             homogeneity assumptions, even after transformation. These
used to screen the products on an agarose gel. The remain-              statistical tests were undertaken in SPSS.
ing 25 µL of each triplicate was pooled to evenly distribute               A SIMililarities PERcentage analysis (SIMPER in Primer
the DNA, split into two slots and run on a 2 % agarose gel at           v6) was applied on the microbial class level with a cut-off
75 volts for 50 min. Sybergold stain was applied post-run for           for low contributions at 90 % based on Bray–Curtis similar-
20–30 min before cutting the 380 bp bands out with a ster-              ity matrix to characterise the community composition based
ilised scalpel over a blue light to avoid UV damage. The                on groups contributing to intra-biotope similarities. Relation-
two bands of mixed triplicates were pooled, purified using              ships between environmental variables and microbial classes
the Qiaquick Gel Extraction Kit (Qiagen, Inc.) and quanti-              as a percentage of each composition within the plume were
fied with a Qubit™ 3.0 fluorometer (Qiagen, Inc.). Samples              tested with Pearson correlation and hierarchical clustering to
were pooled in equimolar quantities together with blank PCR             identify broad response groups.
controls. The pooled sample was concentrated using MinE-
lute™ PCR Purification columns (Qiagen Inc.) as described
by the manufacturer and sent to Macrogen (South Korea) for              3     Results
sequencing. Sequencing was undertaken with a Roches GS
FLX instrument using Titanium chemistry on an eight-region              3.1    Water column characteristics
gasket and Roche GS FLX instruments. Sequence processing
was undertaken as described by van Bleijswijk et al. (2015),            Temperature, salinity and density plots indicated that the
using a QIIME pipeline. Sequences shorter than 250 bases                water column at each location had similar physical traits,
and average Q scores below 25 were removed. The OTU se-                 whereby three main different water masses could be dis-
quences (> 98 % similarity) were classified (> 93 % similar-            tinguished (Fig. S1 in the Supplement). The surface East-
ity) based on a recent SILVA SSU database (release 132; Yil-            ern North Atlantic Central Water (ENACW) was charac-
maz et al., 2014). Single reads were excluded and all data              terised by a temperature, salinity and density at the surface of
were standardised to remove any disproportionate sampling               18 ◦ C, 36.4 and 26.2 kg m−3 to 11 ◦ C, 35.5 and 27.2 kg m−3
bias.                                                                   at the bottom of the water mass. The underlying Mediter-
                                                                        ranean Outflow Water (MOW) was characterised by a tem-
                                                                        perature of 7.5–11 ◦ C, a salinity of 35.4–35.5 and a den-

Biogeosciences, 17, 2499–2519, 2020                                                          www.biogeosciences.net/17/2499/2020/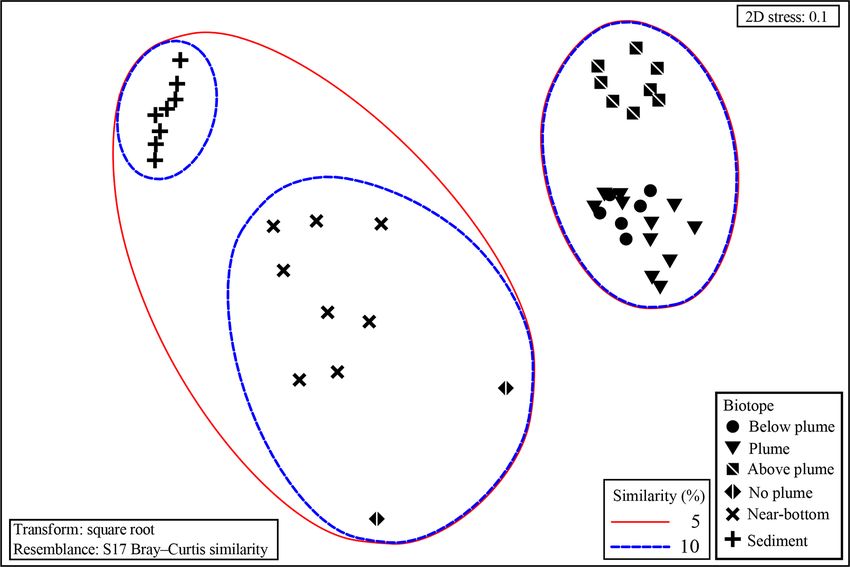
S. Haalboom et al.: Trace metals and microorganisms along a hydrothermal vent plume                                                   2505

Table 2. Primers used for sequencing.

      Forward primer       Forward primer            Reverse primer         Reverse primer                Ratio in    Reference
      name                 sequence 50 -30           name                   sequence 50 -30               mix
      Arch-0519-a-S-1      CAGCMGCCGCGGTAA           Bact-0785-b-A-18       TACNVGGGTATCTAATCC            3/9 + 3/9   Klindworth
      (universal)                                    (universal)                                                      et al. (2013)
      Bact-0519F           CAGCAGCATCGGTVA                                                                1/9         This paper
      (targets WS6,
      TM7, OP11 groups)
      Nano-0519F           CAGTCGCCRCGGGAA           Nano-0785R             TACNVGGGTMTCTAATYY            1/9 + 1/9   This paper
      (targets                                       (targets
      Nanoarchaea)                                   Nanoarchaea)

sity of 27.2–27.75 kg m−3 . The North Atlantic Deep Water             with instances of seafloor contact during time of sampling.
(NADW) was characterised by temperatures ranging from                 Therefore, no samples could be taken below the plume at
4 to 7.5 ◦ C, salinity of 35.0 to 35.4 and a density of 27.75         these stations. The assumption that the plume is subject to
to 27.825 kg m−3 (Emery and Meincke, 1986). The neutrally             vertical movement is supported by observations made during
buoyant plume was centred around the 27.82 kg m−3 isopyc-             12 h CTD yo-yo casts carried out at station 27 (Fig. 3). Along
nal, as illustrated in Figs. 2 and 3.                                 with vertical displacements of the 27.82 kg m−3 isopycnal on
                                                                      the order of 150 m, likely reflecting internal tidal motions, the
3.2     Turbidity and plume dispersion                                hydrothermal plume was found to also move up and down
                                                                      and at times touch the seafloor.
Against a background of non-plume-influenced waters, as
found in the CTD casts, with typical concentrations of SPM            3.3    Enrichment of (trace) metals compared to the
of 0.04 mg L−1 (0.015 NTU), the neutrally buoyant plume                      ambient seawater
stands out as a layer with distinctly higher turbidity values
(i.e. higher SPM concentrations) consistently present in the          NMDS ordination (Fig. 4) based on Euclidean distance re-
depth interval of 1750–2400 m at stations located north and           semblance of normalised element / Fe molar ratio data of all
east of Rainbow (Fig. 2). Except where this turbid water layer        collected water samples (2D stress = 0.03), revealed a clear
was found impinging the seabed, relatively clear waters sep-          distinction of the different samples. Most outstanding are the
arated the turbid layer from the underlying seabed.                   samples from above-plume waters, indicating that the chem-
   At downstream stations, a consistent trend of decreasing           ical composition is different from the other samples.
turbidity and increasing vertical dispersion was noted. At sta-          The remaining samples showed less variation, nonetheless
tion 27, 3.5 km north of Rainbow, maximum turbidity in the            the samples collected from below the plume and the samples
core of the plume was 0.15 NTU (0.09 mg L−1 ) and plume               collected away from the main path of the plume can be dis-
thickness was about 105 m, whilst at station 46, 15.2 km              tinguished. This shows that the hydrothermal plume can be
east of Rainbow, maximum turbidity was only 0.08 NTU                  characterised by its chemical composition. When comparing
(0.06 mg L−1 ) and plume thickness was 275 m. Away from               samples taken in the turbidity maximum of the plume to the
the main plume path, stations 47 and 49 (13.8 and 16.5 km             above-plume water samples taken at 1000 m water depth it
from Rainbow, respectively) showed a diluted signature sim-           is found that Fe, Cu, P, V and Pb are enriched by factors
ilar to that observed at the most distal stations along the main      of ∼ 80, ∼ 90, ∼ 17, ∼ 52 and ∼ 25, respectively. Elements
plume path. Despite being most proximal to Rainbow, sta-              with a more moderate degree of enrichment are Co, Mn, Zn,
tion 16, located 1.0 km downstream of Rainbow, showed a               Al and Ni, with enrichment factors of ∼ 8.0, ∼ 2.5, ∼ 10.3,
relatively low turbidity of 0.015 NTU (0.04 mg L−1 ). Since           ∼ 1.4 and ∼ 1.6, respectively. The REEs were enriched by a
the plume is more constrained closer to the source, the main          factor of 5 to 40 relative to the clear water. U, Ti and Ca are
body of the narrower plume could have been missed with the            slightly enriched at turbidity maxima, by factors of ∼ 1.3,
CTD. Stations upstream of the vent site (stations 13 and 28,          ∼ 1.6 and ∼ 1.2, respectively. In and Sn are depleted com-
4.2 and 7.5 km southwest of Rainbow, respectively, and sta-           pared to the above-plume water.
tion 40, 3.6 southeast of Rainbow) displayed low turbidity
values, ranging between 0.01 and 0.02 NTU (0.04 mg L−1 )
(Fig. S2).
   The CTD profiles from stations 42 and 49 (4.9 and 16.5 km
north of Rainbow, respectively) both displayed the highest
turbidity in the lower hundreds of metres above the seafloor,

www.biogeosciences.net/17/2499/2020/                                                          Biogeosciences, 17, 2499–2519, 2020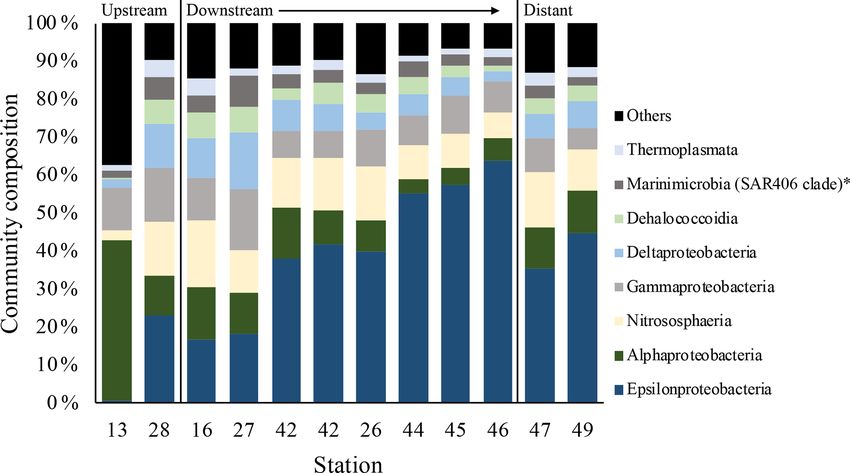
2506                               S. Haalboom et al.: Trace metals and microorganisms along a hydrothermal vent plume

Figure 2. Transect along main plume path (indicated in Fig. 1 as plume transect), showing turbidity in the water column. The plume is
indicated by highest turbidity values and disperses away from the Rainbow vent field.

Figure 3. A 12 h yo-yo CTD at station 27 showing the temporal evolution of the hydrothermal plume over a tidal cycle.

3.4    Geochemical gradients within the hydrothermal                   well as off the main path of the plume at the upstream and
       plume                                                           the most distal downstream stations. Since the Fe concentra-
                                                                       tion is linearly related to the turbidity (Fig. 5) (R 2 = 0.9356,
                                                                       P < 0.001), normalisation to Fe reveals relative enrichments
Within the hydrothermal plume, geochemical evolution is                or depletion of common elements. The chalcophile elements
found as the plume disperses. Visual examination of the                Co, Cu and Zn show a partly linear relation steepening with
samples with the SEM, coupled with chemical analysis per-              increasing Fe concentration (Fig. 6a for Cu), indicating that
formed with the EDS detector, revealed that the SPM within             the element / Fe molar ratios are elevated close to the source
the plume close to the Rainbow hydrothermal vent at sta-               but decrease towards the more distal sites (Fig. 7a). One ex-
tion 32 (2.9 km north of Rainbow) mainly consisted of Fe-              ception is the Zn / Fe molar ratio, which is elevated at station
sulfides. In the plume samples further downstream, Fe is               37, 39 and 44. Furthermore, a high Zn / Fe molar ratio is ob-
mainly present as Fe-oxides, Fe-hydroxides or bound in alu-            served at upstream station 40. The oxyanions P and V are
minosilicates.                                                         linearly related to Fe (Fig. 6b for V) and show varying ele-
   Chemical examination of the samples showed gradients in             ment / Fe molar ratios without a clear trend of increasing or
the element / Fe molar ratios along the path of the plume, as

Biogeosciences, 17, 2499–2519, 2020                                                         www.biogeosciences.net/17/2499/2020/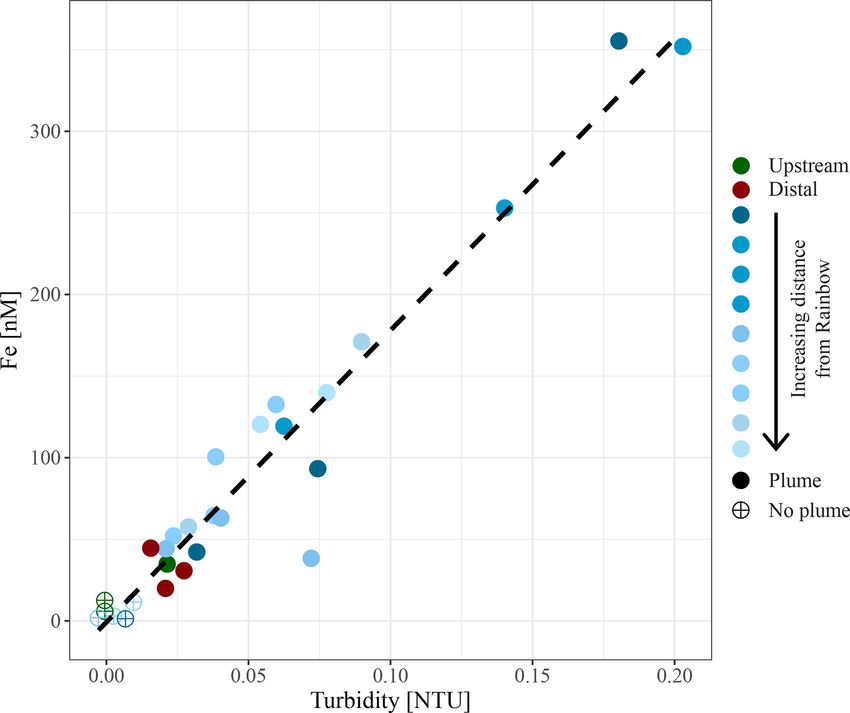
S. Haalboom et al.: Trace metals and microorganisms along a hydrothermal vent plume                                        2507

Figure 4. (a) NMDS ordination showing all water samples based on their resemblance in chemical composition. (b) NMDS ordination
showing all plume samples from the downstream stations based on their resemblance in chemical composition.

decreasing ratios, both upstream and downstream of Rain-          47 and 49, and upstream station 40 was found to have a sig-
bow (Fig. 7b). The REEs show a partly linear relation, lev-       nificantly higher Ca / Fe molar ratio (Fig. 7e). Other analysed
elling off with increasing Fe concentrations (Fig. 6c for Y).     elements, Mn, Al, Ni, In, Pb, Sn, Ti and U, showed no clear
Within the plume this is displayed as increasing element / Fe     relationship with the Fe concentration (Fig. 6d for Sn). How-
molar ratios towards station 44, with station 42 as an excep-     ever, within the plume it was found that the Mn / Fe molar
tion, followed by slightly decreasing molar ratios from sta-      ratio is lower than at the upstream stations or the more distal
tion 44 onwards (Fig. 7c). The Ca / Fe molar ratios ranged        downstream stations.
between 0 and 15 for most of the downstream stations, apart
from the stations further downstream (47 and 49), which dis-
played slightly higher Ca / Fe molar ratios. Upstream station
28 had a Ca / Fe molar ratio similar to those found at station

www.biogeosciences.net/17/2499/2020/                                                     Biogeosciences, 17, 2499–2519, 2020
2508 S. Haalboom et al.: Trace metals and microorganisms along a hydrothermal vent plume
3.6 Univariate biodiversity
Plume and below-plume samples were less diverse than
sediment samples, whilst diversity in the plume was lower
than in near-bottom water samples (Kruskal–Wallis: χ2
(4) = 36.127, P < 0.01). In general, plume diversity was low
(Fig. 10), but further differences were not statistically signif-
icant, likely due to limited replication and intra-biotope vari-
ation.
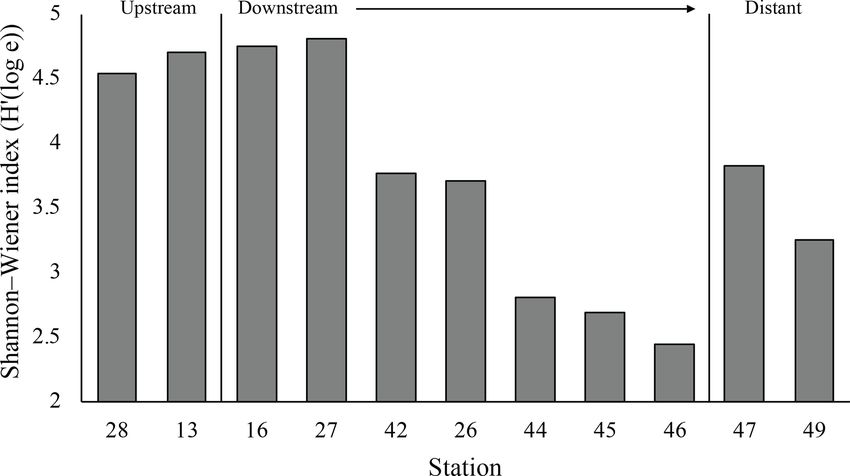
The plume microbial community at sites upstream of Rain-
bow and at the immediate downstream sites (stations 28, 13,
16 and 27) showed similar and relatively high biodiversity
(> 4.5) (Fig. 11). Plume biodiversity at the sites further away
from Rainbow gradually decreased until station 46, which
displayed the lowest Shannon–Wiener index value of 2.4.
Distant stations 47 and 49, showed biodiversity rising to a
more moderate index value around 3.5.
Figure 5. Relationship between in situ measured turbidity and mo-
lar concentration of particulate iron.
3.7 Species composition
Results of the SIMPER analyses, showing the contributions
3.5 Microbial assemblages in water column biotopes of taxa composition to similarities within biotopes (Table 3),
mirrored the NMDS and ANOSIM results, whereby the sim-
Samples from sediment, near-bottom water and no plume ilarity of community composition in each biotope was domi-
water contained microbial communities that clustered dis- nated by a different makeup of the microbial community. The
tinctly from each other and from plume, below-plume and archaeal class Nitrososphaeria (marine group 1 archaea) con-
above-plume communities (Fig. 8). In particular, sediment, tributed the most to similarity within the above- and below-
near-bottom water and no plume (station 13) samples have plume water communities, while also being very common in
communities that are very dissimilar from the overlying wa- all water samples. Alphaproteobacteria, Gammaproteobacte-
ter column samples. Sediment samples appeared to cluster ria and Deltaproteobacteria also constituted a large amount of
in a straight line, suggesting some sort of gradient of sim- the makeup of all biotopes in the area. The class Epsilonpro-
ilarity along the ordination axis, though no apparent pat- teobacteria were rare in above-plume samples and only con-
terns were observed when independently plotted. The near- tributed < 2 % to near-bottom water communities. By con-
bottom water samples were relatively dispersed in the NMDS trast, Epsilonproteobacteria were dominant in plume water
plot, suggesting a more variable community. Samples taken samples (accounting for > 35 % of the community) and were
at the upstream station 13 from below-plume and plume the fifth most dominant taxon in below-plume water samples
depths showed no similarity with samples from correspond- contributing 8.9 % of the community.
ing depths in the other stations, whilst the above-plume com- Epsilonproteobacteria accounted for about 20 % of the
munity at this station is consistent with that of other stations. plume community at stations near the vent. Beyond the near
In general, plume and below-plume communities were more vent stations, an increase in relative abundance of Epsilon-
similar nearer to the vent source, with stations further down- proteobacteria with distance from the vent was observed,
stream displaying greater dissimilarity (Figs. 9, S3). accounting for 64 % of the community at the distant sta-
Group average cluster analysis showed a high level of tion 46 (Fig. 12). Alphaproteobacteria, Deltaproteobacteria
dissimilarity, i.e. large community variation, between and and Gammaproteobacteria appeared to become less domi-
within biotopes. ANOSIM revealed all putative biotopes that nant with distance from the plume source (Fig. 12). The com-
were sampled had distinct communities (global R = 0.738; munities at distant stations 47 and 49 were less dominated
P < 0.001; 999 permutations), except for plume and below- by Epsilonproteobacteria (around 40 %). Below-plume com-
plume samples, which could not be distinguished statistically munities were dominated mostly by Nitrososphaeria (marine
(global R = −0.091; P = 0.861). The two seemingly unique group 1 archaea), whereby Nitrososphaeria became more
samples from station 13 also tested as significantly distinct dominant with distance from the plume source similar to
but with a low number of permutations (< 999) due to low the Epsilonproteobacteria in the plume. Correlations between
replication (n = 2). environmental variables (elemental chemistry and physical
properties) and all microbial classes observed in the plume
were evident and appeared to be class-specific (Fig. S4). The
hierarchical clustering revealed eight broad response groups,
Biogeosciences, 17, 2499–2519, 2020 www.biogeosciences.net/17/2499/2020/S. Haalboom et al.: Trace metals and microorganisms along a hydrothermal vent plume 2509
Figure 6. Relationships between molar concentrations of particulate copper (a), vanadium (b), yttrium (c) and tin (d) to iron.
which displayed different relationships with the environmen- 4.1 Physical constraints of plume location and
tal variables. behaviour
The plume was observed within the NADW mass, con-
4 Discussion strained to an isopycnal density envelope of 27.82 kg m−3
(Figs. 2 and 3). The apparent continuity of this turbid wa-
Using a multidisciplinary approach in which physical, geo-
ter layer, especially to the northeast of the Rainbow field,
chemical and ecological data were collected from the Rain-
and lack of similarly turbid waters in the bottom waters be-
bow vent neutrally buoyant plume and its underlying sedi-
low the plume, link the plume to Rainbow and preclude lo-
ment, we aimed to expand knowledge and characteristics of
cal sediment resuspension as an origin. Using turbidity mea-
the background (i.e. before impact) state of a hydrothermal
surements and presumed plume path, we traced the plume
vent site. Such knowledge is deemed essential to be able to
up to 25 km away from the vent source. This is within the
assess (potential) impacts of future deep-sea SMS mining,
range mentioned by German et al. (1998), who found that
as it may help in characterising the behaviour of the diluted
the Rainbow plume extends over 50 km, being controlled by
distal part of chemically enriched mining plumes. We found
local hydrodynamics and topography. Unexpectedly, in the
geochemical and microbial differences between the above-
basin upstream of the Rainbow vent field, a turbidity peak
plume, plume, below-plume and no-plume water, and, in ad-
at 1975 m water depth resembling a plume was observed as
dition, pertinent chemical and biological gradients within the
well (station 28), confounding our assumption of a clear wa-
extensive Rainbow hydrothermal vent plume were evident.
ter column at upstream stations and distant downstream sta-
tions. This suggests that the plume is distributed much fur-
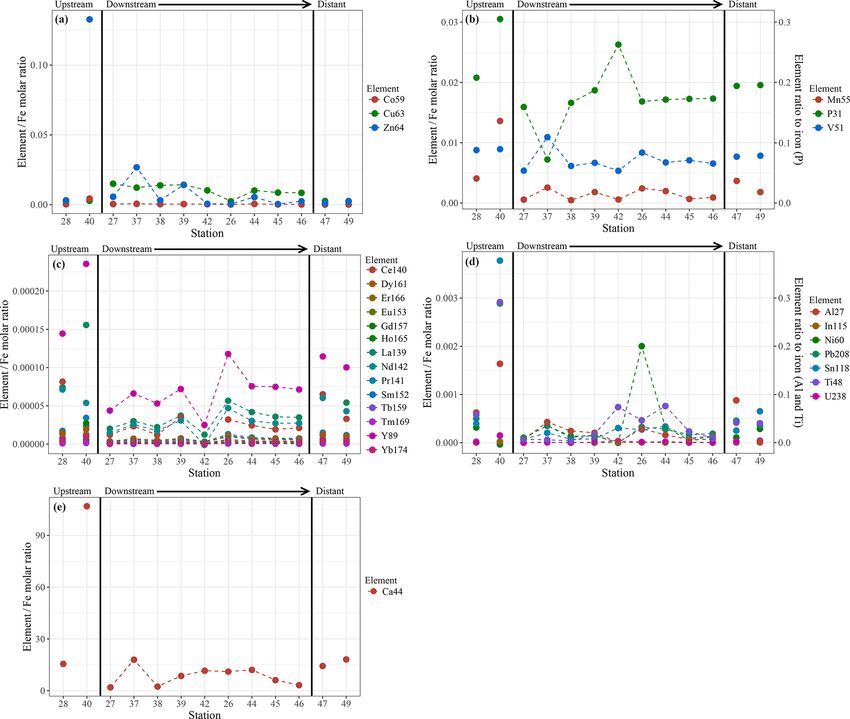
www.biogeosciences.net/17/2499/2020/ Biogeosciences, 17, 2499–2519, 20202510 S. Haalboom et al.: Trace metals and microorganisms along a hydrothermal vent plume Figure 7. Element to iron molar ratios of plume samples of upstream, downstream and distant stations. Downstream stations follow the main path of the plume. (a) shows the element / Fe molar ratios of the chalcophiles (Co, Cu and Zn), (b) shows the ratios of Mn and the oxyanions (P and V), (c) displays the ratios of REEs, (d) the ratios of Al, In, Ni, Pb, Sn, Ti and U and (e) shows the Ca / Fe molar ratios. ther than previously observed by Thurnherr and Richards 4.2 Plumes influence on the water column chemical (2001) and German et al. (1998). This is exemplified by the and microbial make-up local variation in microbial community composition of up- stream stations (Fig. 12) and is supported by the relatively The neutrally buoyant plume introduced pelagic heterogene- low Ca / Fe molar ratio at station 28 (Fig. 7), indicating hy- ity in terms of chemical and microbial composition, which drothermal influence. In addition, the observed variability of is supported by the vertical classification of the different plume strength and vertical position (Fig. 3) indicate that lo- biotopes. The neutrally buoyant plume was evidently en- cal fluctuation in the current regime and tidal motions influ- riched in metals and REEs compared to overlying clear ence plume behaviour. This dynamic behaviour has implica- water. Element concentrations were found to be in line tions for survey designs and should be considered when mon- with those found by German et al. (1991) and Edmond et itoring natural and man-made plumes, such as mining-related al. (1995) and Edmonds and German (2004), who studied the plumes. Prior insight into plume extension and behaviour is Trans-Atlantic Geotraverse (TAG) hydrothermal plume and required for the identification of adequate control sites and the Rainbow hydrothermal plume, respectively. Our chem- for tracking of plume evolution in future impact studies. ical results from Rainbow also match with those of Lud- Biogeosciences, 17, 2499–2519, 2020 www.biogeosciences.net/17/2499/2020/
S. Haalboom et al.: Trace metals and microorganisms along a hydrothermal vent plume 2511
Table 3. SIMPER similarity results of each biotope at class level.
Biotope Average Class Average Average Sim/SD Contribution Cumulative
similarity proportion similarity (%) (%)
(%) (%)
Above 82.34 Nitrososphaeria 27.10 22.79 4.61 27.67 27.67
plume Alphaproteobacteria 18.34 15.22 4.15 18.49 46.16
Gammaproteobacteria 13.44 11.58 5.52 14.07 60.23
Deltaproteobacteria 10.67 8.46 3.38 10.27 70.50
Marinimicrobia (SAR406 clade)∗ 8.22 6.96 6.07 8.46 78.96
Dehalococcoidia 6.38 5.69 9.19 6.91 85.87
Thermoplasmata 2.63 2.26 5.68 2.74 88.61
Acidimicrobiia 2.13 1.89 8.62 2.30 90.91
Plume 76.74 Epsilonproteobacteria 39.59 30.29 2.53 39.47 39.47
Nitrososphaeria 12.16 10.32 4.05 13.45 52.92
Gammaproteobacteria 9.69 7.92 4.71 10.32 63.23
Alphaproteobacteria 9.23 7.22 2.44 9.40 72.64
Deltaproteobacteria 7.60 5.56 2.75 7.25 79.88
Dehalococcoidia 4.57 3.55 2.58 4.63 84.51
Marinimicrobia (SAR406 clade)∗ 4.02 3.07 3.83 4.00 88.51
Thermoplasmata 2.56 1.94 3.39 2.53 91.04
Below- 77.94 Nitrososphaeria 22.35 16.60 3.29 21.30 21.30
plume Alphaproteobacteria 13.26 11.43 5.18 14.67 35.97
Deltaproteobacteria 10.88 9.25 8.31 11.87 47.84
Gammaproteobacteria 10.60 8.89 7.78 11.40 59.24
Epsilonproteobacteria 9.65 7.18 2.50 9.22 68.46
Dehalococcoidia 7.84 6.97 7.89 8.95 77.40
Marinimicrobia (SAR406 clade)∗ 6.32 4.49 2.31 5.76 83.16
Thermoplasmata 4.69 3.04 2.20 3.90 87.07
Phycisphaerae 1.97 1.75 7.60 2.24 89.31
Planctomycetacia 2.03 1.50 2.96 1.93 91.23
Near-bottom 75.71 Gammaproteobacteria 20.79 16.77 3.18 22.15 22.15
water Nitrososphaeria 16.90 13.54 3.79 17.89 40.04
Alphaproteobacteria 15.55 13.25 5.47 17.50 57.54
Deltaproteobacteria 6.68 5.89 5.99 7.78 65.32
Oxyphotobacteria 5.93 4.04 2.18 5.34 70.66
Dehalococcoidia 4.08 2.99 2.50 3.95 74.61
Phycisphaerae 3.72 2.57 2.03 3.40 78.01
Thermoplasmata 2.47 1.70 2.25 2.24 80.25
Acidimicrobiia 2.06 1.61 2.72 2.13 82.38
Bacteroidia 2.15 1.57 1.85 2.07 84.45
Marinimicrobia (SAR406 clade)∗ 1.75 1.24 2.17 1.64 86.09
OM190 1.64 1.14 2.02 1.51 87.60
Planctomycetacia 1.40 1.09 2.76 1.44 89.04
Epsilonproteobacteria 1.71 0.85 1.08 1.12 90.16
Sediment 82.51 Gammaproteobacteria 29.67 27.17 8.51 32.93 32.93
Alphaproteobacteria 13.98 12.44 4.88 15.07 48.01
Deltaproteobacteria 11.98 10.98 10.24 13.30 61.31
Nitrososphaeria 7.73 5.69 3.74 6.90 68.21
Phycisphaerae 5.46 5.01 7.85 6.07 74.28
Dehalococcoidia 3.35 2.48 2.58 3.01 77.29
BD2-11 terrestrial group 2.36 1.91 2.90 2.31 79.60
Subgroup 22 (Acidobacteria) 2.10 1.74 3.22 2.11 81.71
OM190 2.09 1.50 5.50 1.81 83.53
Nitrospira 1.79 1.49 3.68 1.80 85.33
Bacteroidia 1.91 1.48 3.66 1.79 87.12
Acidimicrobiia 1.58 1.24 2.84 1.50 88.62
Thermoanaerobaculia 1.41 1.07 3.25 1.30 89.92
Gemmatimonadetes∗ 1.57 1.06 1.56 1.28 91.21
∗ Indicates undefined class.
www.biogeosciences.net/17/2499/2020/ Biogeosciences, 17, 2499–2519, 20202512 S. Haalboom et al.: Trace metals and microorganisms along a hydrothermal vent plume
microbes deeper below the plume, as suggested by Dick
et al. (2013). In addition, internal wave-induced turbulence
causes vertical mixing along the slope of the Rainbow Ridge
(van Haren et al., 2017), which may cause the plume and
associated communities near the vent field to mix with am-
bient water communities, leading to assemblage similarities.
This indicates the plume and that associated microbial pro-
cesses could have a larger vertical footprint than previously
observed, supporting suggestions by Olins et al. (2017) that
proximal non-plume habitats have been overlooked. Interest-
ingly, near-bottom water (and sediment) community assem-
blages were distinct from the below-plume and other water
column communities. This could imply (1) that there is little
“fallout” from the plume at distance from the vent, which
Figure 8. Non-metric multidimensional scaling plot of the micro- is in agreement with sediment trap observations by Khri-
bial community composition of all samples based on Operational pounoff et al. (2001); that (2) plume-specific bacteria die
Taxonomic units. Similarity groupings are based on group average off due to lack of energy sources and DNA degrades before
clustering. “No plume” is representative of samples collected from reaching the seafloor; and that (3) microbes are more abun-
station 13, where there was no indication of a plume. dant in the near-bottom waters, either naturally or through
mechanical disturbance resuspending sediment during the
coring process, outnumbering groups that have been mixed in
ford et al. (1996), who studied vent fluid samples from the from overlaying water. Despite the presence of a plume and
TAG, Mid-Atlantic Ridge at Kane (MARK), Lucky Strike precipitation, a difference between the sea floor and the water
and Broken Spur vent sites; i.e. our element concentrations column biotopes is present, consistent with global broadscale
were found to be in the same order of magnitude as theirs non-vent benthic–pelagic patterns (Zinger et al., 2011). Ac-
(Table S2). cording to Khripounoff et al. (2001), particulate fallout from
The distinctive chemical composition of the plume the Rainbow plume is spatially very limited. This implies that
samples (e.g. metal concentrations) affects chemolithoau- the extended chemical imprint on the sediment (reported by
totrophic microbial growth within the plume, as indicated Cave et al. , 2002; Chavagnac et al. , 2005; and this study)
by the typical microbial community in plume samples. We is likely to have formed when the plume is in direct contact
observed a clear and consistent separation between com- with the sediment during its vertical tidal migration. As the
munities in the plume and those in above-plume samples. plume rises again, the associated distinct communities appar-
The influence of MOW on the above-plume community ently resume dominance in the near-bottom water. Though
could also play a role, as water masses can harbour dif- Epsilonproteobacteria have been detected in Rainbow vent
ferent microbial communities (Agogue et al., 2011). How- sediments comprising over 5 % of the sediment community
ever, the palpable presence of a plume in the turbidity data (López-García et al., 2003), very few reads of this group
with supporting chemical measurements and the occurrence in sediment samples were present in our study, probably as
of vent-associated Epsilonproteobacteria (Olins et al., 2017; our coring samples were collected kilometres away from the
Djurhuus et al., 2017) and other vent-associated groups, venting site. Cave et al. (2002), observed chemical evolution
such as the Gammaproteobacteria clade SUP05 (Sunamura of sediment composition with distance from source, thus we
et al., 2004), point to a unique chemical environment. Here infer a relationship between the sediment dwelling Epsilon-
chemosynthetic communities flourish and give rise to inde- proteobacteria with nearby plume precipitates, such as Cu
pendent biotopes in the neutrally buoyant plume kilometres and presumed precipitates Zn and Cd (Trocine and Trefry,
downstream of the vent site. 1988). Additionally, extracellular DNA degradation rate can
Below-plume communities were not distinct from the be 7 to 100 times higher in sediment than in the water column
plume biotope, although instead of Epsilonproteobacteria, (Dell’Anno and Corinaldesi, 2004). Therefore, although our
the ubiquitous class Nitrososphaeria was the most dominant results suggest no microbial plume community imprint on
group, reflecting some similarities with above-plume seawa- the sediment, we cannot rule out short-lived episodic com-
ter communities. Similarities between plume and proximal munity changes when the plume is in contact with the sedi-
habitat communities have also been observed by Olins et ment.
al. (2017), whereby intra-field (defined as within vent field
between diffuse flows) and diffuse flow microbial commu-
nities were alike. In our study, similarities between plume
and below-plume water are likely derived from precipita-
tion of mineral and microbial aggregates dragging plume
Biogeosciences, 17, 2499–2519, 2020 www.biogeosciences.net/17/2499/2020/S. Haalboom et al.: Trace metals and microorganisms along a hydrothermal vent plume 2513
Figure 9. Non-metric multidimensional scaling plot of the microbial community composition of all water column samples based on Opera-
tional Taxonomic units. Plume and below-plume depths from Station 13 were excluded.
Figure 10. Mean Shannon–Wiener diversity index for microorgan-
isms in each biotope. Error bars represent ± SE. Figure 11. Shannon–Wiener index values for microorganisms in
each plume sample taken.
4.3 Geochemical gradients within the hydrothermal
plume
Fe-sulfides were found, whereas Fe-(oxyhydr)oxides were
Analysis of SPM in water samples taken along the flow path found further downstream. This suggests that chalcophile el-
of the plume, as well as off the flow path, showed conspicu- ements are mainly present in the form of sulfide mineral par-
ous trends of elements, reflecting the chemical evolution of ticles at the proximal stations, which are entrained in the
the plume as it drifts away from its hydrothermal source. flow of hydrothermal water emanating from the Rainbow
The chalcophile elements (Cu, Co and Zn) were found to vents. Subsequently, they are rapidly lost by settling from
have the highest element / Fe molar ratios closest to the vent the plume in sulfide-bearing phases, while a large portion of
site, indicating either rapid removal from the hydrothermal Fe remains in suspension (Cave et al., 2002; Edmonds and
plume or removal from the solid phase as the plume drifts German, 2004), consistent with decreasing concentrations of
away from the vent site. Using SEM-EDS, it was demon- Cu, Zn and Co in sediment recovered from the Rainbow area
strated that at the proximal downstream stations mainly with increasing distance to the vent site (Cave et al., 2002).
www.biogeosciences.net/17/2499/2020/ Biogeosciences, 17, 2499–2519, 20202514 S. Haalboom et al.: Trace metals and microorganisms along a hydrothermal vent plume
Figure 12. Microbial community composition in the plume samples as a percentage of the dominant class groups in accordance with the
SIMPER results. The asterisk indicates an undefined class.
The oxyanions (V and P) showed slightly varying ele- cles and the sediments is lower close the Rainbow vent field
ment / Fe molar ratios with increasing distance away from and increases as the Fe concentration decreases when the
Rainbow, suggesting co-precipitation with Fe as oxyhydrox- plume disperses. Since Ca is naturally present in high abun-
ides (Edmonds and German, 2004). No additional uptake of dances in pelagic skeletal carbonate that rains down from the
these elements was observed with increasing distance from overlying water column and Fe is mainly present as a hy-
the vent field (German et al., 1991), since these elements are drothermal component, the Ca / Fe molar ratio could be an
scavenged initially in significant amounts during the buoyant indicator for the extent of the hydrothermal influence. The
plume phase (Cave et al., 2002). high molar ratio at station 40 would then suggest that this
The trend shown by Mn / Fe molar ratios can be at- station is hardly or not at all influenced by the hydrothermal
tributed to the slower oxidation kinetics of Mn (Cave et plume, as the natural abundance of particulate iron is low
al., 2002). It takes longer for reduced Mn to be oxidised (e.g. Michard et al., 1984 and this study), whereas stations
than it would for Fe, resulting in an increase in particulate 28, 47 and 49 are, as expected, influenced in more moder-
Mn with increasing distance from the Rainbow hydrothermal ate degrees compared to the stations directly downstream of
vent field, which subsequently settles out from the plume as Rainbow.
Mn-oxyhydroxides (Cave et al., 2002).
The observed positive relationship between the REEs and 4.4 Microbial gradients within the hydrothermal
Fe is indicative of continuous scavenging of these elements plume
from the ambient seawater onto Fe-oxyhydroxides (Edmonds
and German, 2004; Chavagnac et al., 2005; Caetano et al., The microbial plume community composition and diversity
2013). Therefore, the highest element / Fe molar ratios were altered with distance from the plume source, showcasing
observed away from the Rainbow hydrothermal vent site, horizontal heterogeneity within the plume. Despite dilution,
where Fe-(oxyhydr)oxides are dominant more distal to the the vent-associated group Epsilonproteobacteria (specifically
vent site. the most common genus Sulfurimonas), appeared to dom-
The Ca / Fe molar ratios vary between 0 and 15 for the inate the community composition. This is likely due to its
stations downstream of the Rainbow hydrothermal vent but flexibility to exploit a range of electron donors and accep-
are higher at the distant downstream station 47 and 49 and tors (Nakagawa et al., 2005), making them suitable inhab-
upstream stations 28 and 40. Especially at station 40, located itants of dynamic environments (Huber et al., 2003). From
on the Rainbow Ridge, the Ca / Fe molar ratio is significantly the relative abundance data presented here it cannot be de-
higher than at the other stations. This is in line with observa- termined whether Epsilonproteobacteria dominate by rapid
tions by Khripounoff et al. (2001) and Cave et al. (2002), who reproduction or if other groups decline in abundance. How-
also found that the relative Ca concentration in settling parti- ever, it is evident that Epsilonproteobacteria remain com-
petitive or outcompete other competitors, such as gener-
Biogeosciences, 17, 2499–2519, 2020 www.biogeosciences.net/17/2499/2020/You can also read