Unexplained hydrogen isotope offsets complicate the identification and quantification of tree water sources in a riparian forest ...
←
→
Page content transcription
If your browser does not render page correctly, please read the page content below
Hydrol. Earth Syst. Sci., 23, 2129–2146, 2019
https://doi.org/10.5194/hess-23-2129-2019
© Author(s) 2019. This work is distributed under
the Creative Commons Attribution 4.0 License.

Unexplained hydrogen isotope offsets complicate the identification
and quantification of tree water sources in a riparian forest
Adrià Barbeta1 , Sam P. Jones1 , Laura Clavé1 , Lisa Wingate1 , Teresa E. Gimeno1,2,3 , Bastien Fréjaville1 , Steve Wohl1 ,
and Jérôme Ogée1
1 INRA, UMR ISPA, 33140, Villenave d’Ornon, France
2 BC3 – Basque Centre for Climate Change – Klima Aldaketa Ikergai, 48940 Leioa, Spain
3 IKERBASQUE, Basque Foundation for Science, 48008 Bilbao, Spain

Correspondence: Adrià Barbeta (adria.barbeta-margarit@inra.fr) and Jérôme Ogée (jerome.ogee@inra.fr)

Received: 20 December 2018 – Discussion started: 9 January 2019
Revised: 6 April 2019 – Accepted: 11 April 2019 – Published: 26 April 2019

Abstract. We investigated plant water sources of an emblem-        phytic species. By means of a sensitivity analysis, we found
atic refugial population of Fagus sylvatica (L.) in the Ciron      that the estimation of plant water sources using mixing mod-
river gorges in south-western France using stable water iso-       els was strongly affected by this δ 2 H depletion. A better un-
topes. It is generally assumed that no isotopic fractionation      derstanding of what causes this isotopic separation between
occurs during root water uptake, so that the isotopic compo-       xylem and source water is urgently needed.
sition of xylem water effectively reflects that of source water.
However, this assumption has been called into question by re-
cent studies that found that, at least at some dates during the
                                                                   1     Introduction
growing season, plant water did not reflect any mixture of
the potential water sources. In this context, highly resolved      1.1    Why is an improved understanding of tree water
datasets covering a range of environmental conditions could               use needed?
shed light on possible plant–soil fractionation processes re-
sponsible for this phenomenon. In this study, the hydrogen         Ongoing climate change, through the combination of al-
(δ 2 H) and oxygen (δ 18 O) isotope compositions of all poten-     tered precipitation regimes and warmer temperatures, is af-
tial tree water sources and xylem water were measured fort-        fecting terrestrial ecosystems globally, promoting rapid and
nightly over an entire growing season. Using a Bayesian iso-       widespread changes in forest cover (e.g. Allen et al., 2015).
tope mixing model (MixSIAR), we then quantified the rela-          This is because soil–plant interactions and species-specific
tive contribution of water sources for F. sylvatica and Quer-      water use can provoke shifts in forest species’ distributions
cus robur (L.) trees. Based on δ 18 O data alone, both species     through readjustments in species abundance (Clark et al.,
used a mix of top and deep soil water over the season, with        2016). In this context, it is a priority to better understand how
Q. robur using deeper soil water than F. sylvatica. The con-       spatial and temporal dynamics of water use by trees will be
tribution of stream water appeared to be marginal despite the      affected in the future. This will not only reduce uncertainties
proximity of the trees to the stream, as already reported for      in the projections of forested areas (e.g. De Cáceres et al.,
other riparian forests. Xylem water δ 18 O could always be in-     2015; Good et al., 2017) but will also improve our ecohydro-
terpreted as a mixture of deep and shallow soil waters, but        logical understanding of biosphere–atmosphere feedbacks
the δ 2 H of xylem water was often more depleted than the          and associated climate change (Berg et al., 2016; Senevi-
considered water sources. We argue that an isotopic frac-          ratne et al., 2013). This may also help understand how cli-
tionation in the unsaturated zone and/or within the plant tis-     mate refugia facilitate the persistence of important biodiver-
sues could underlie this unexpected relatively depleted δ 2 H      sity hotspots (McLaughlin et al., 2017).
of xylem water, as already observed in halophytic and xero-

Published by Copernicus Publications on behalf of the European Geosciences Union.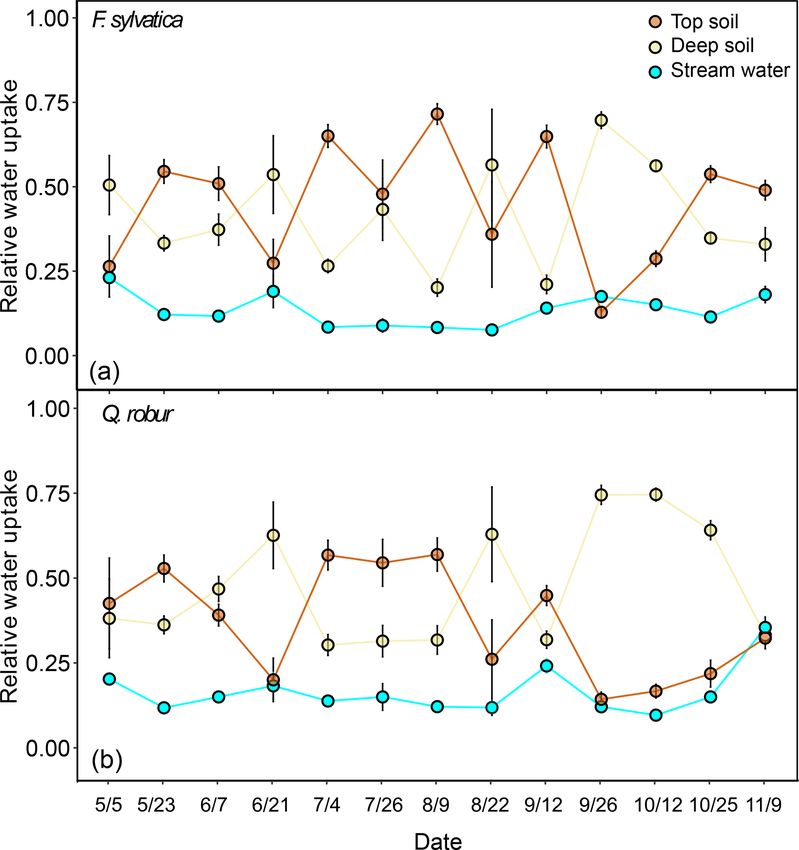
2130                          A. Barbeta et al.: Complication of the identification and quantification of tree water sources

1.2    The isotopic tracing method to study tree water use          concluded that mature stream-side riparian trees in a semi-
                                                                    arid catchment did not use stream water but were depen-
Water stable isotopes (δ 18 O and δ 2 H) are commonly used          dent on an unidentified, relatively more depleted, water
as tracers of plant water use (Dawson et al., 2002; Rothfuss        source, hypothesized to reflect groundwater (Dawson and
and Javaux, 2017; see also references below). This requires         Ehleringer, 1991). On the other hand, smaller trees seemed
sampling all potential water sources as well as xylem wa-           to rely on stream water. Another study conducted in a sea-
ter and analysing these waters for isotopic composition. Be-        sonally dry conifer forest in Oregon found that the δ 18 O and
cause plants can access various pools of water below ground         δ 2 H of soil and tree water were similar during the dry sea-
(soil water at different depths, groundwater, rock water) but       son and clearly distinct from stream water, even when sam-
also at the soil surface (recent rain, river water), on leaf sur-   pled near the stream (Brooks et al., 2010). This led to the
faces (dew) or even in the air (fog, water vapour), sampling        two water worlds (TWW) hypothesis whereby the first de-
all potential water sources can be technically challenging,         pleted rainfall water after a rainless summer fills small soil
destructive, expensive and/or time-consuming, and this may          pores first and does not contribute to river flow nor to mix-
hamper the assessment of their temporal and spatial variabil-       ing with subsequent rain events, as it was already observed in
ity within river catchments (Fahey et al., 2017). The devel-        ecosystems with less seasonality of rainfall (Tang and Feng,
opment of laser-based isotopic analysers in the last decade         2001). This water pool eventually participates in soil evap-
has however increased the throughput of water isotope mea-          oration but mainly remains in the soil until being used by
surements, providing opportunities to carry out observational       plant transpiration during the following dry summer. In light
studies at higher temporal and spatial resolution (Martín-          of this TWW hypothesis, Bowling et al. (2017) revisited the
Gómez et al., 2015).                                                study site of Dawson and Ehleringer (1991) many years later
   The isotope tracing methodology is based on two main             and remeasured hydrogen but also oxygen water isotopes in
principles. Firstly (H1), it is assumed that isotopic fractiona-    xylem water, soil water at different depths and stream water,
tion during root water uptake (and/or xylem water redistri-         in addition to (this time) groundwater and snowmelt water.
bution) does not occur (Allison et al., 1983; Dawson and            They suggested that, if the TWW were true, the soil, still dry
Ehleringer, 1991; Ehleringer and Dawson, 1992; White et             at the end of winter, should get recharged in spring during
al., 1985). Some recent studies have challenged this assump-        snowmelt, leading to depleted snowpack water being locked
tion by showing evidence of isotopic fractionation during           in small soil pores and used by the trees later in the sum-
root water uptake, but it was suggested that such an iso-           mer. Although the vertical distribution of soil water isotopes
topic fractionation was a specific feature of saline or xeric       following snowmelt seemed consistent with the TWW hy-
environments (Ellsworth and Williams, 2007; Lin and Stern-          pothesis, neither snowmelt water nor groundwater could be
berg, 1993). Secondly (H2), it is essential that the isotopic       identified as an alternative source for riverside trees. They
compositions of all potential water sources are different           concluded that the dual-isotope approach could not unam-
enough to distinguish their relative contribution to xylem wa-      biguously determine the water sources of these riparian trees
ter (Ehleringer and Dawson, 1992). Processes underlying the         but that soil moisture seemed to be the most likely candidate,
variability in source water isotopic composition include the        despite the proximity of the river. Oerter et al. (2019) have
temporal variability in the isotopic composition of rainfall        solved the conundrum by revisiting once more the site and
and mixing processes of water in the subsurface (Allison and        sampling soil water with vapour probes. The isotopic com-
Hughes, 1983; Brooks et al., 2010; Tang and Feng, 2001), the        position of soil water vapour was similar to that of xylem
evaporative enrichment of water in surface soil layers (Al-         water, so they could confirm that there was not a missing
lison, 1982; Sprenger et al., 2016; Tang and Feng, 2001),           source. On the other hand, that may also suggest that pore-
the seasonality of groundwater and rock moisture recharge           level isotopic heterogeneity interacts with root water uptake
(Oshun et al., 2015), or isotopic processes during fog water        and complicates the interpretation of xylem water isotopes.
droplet formation (Scholl et al., 2011). There is no certainty
however that these processes will necessarily lead to differ-       1.4   Rock moisture as an alternative plant water
ent isotopic compositions of all potential water sources. Still,          source?
if H1 is true, the δ 18 O and δ 2 H of xylem water should always
lie within the range of values of all water sources.                Plant water source studies in which the xylem water iso-
                                                                    topic composition does not spread within the range of the
1.3    Possible caveats of the isotopic tracing method              sources’ isotopic compositions often acknowledge that a rel-
                                                                    evant source of water may not have been sampled (Bowling
The water isotope tracing technique has succeeded in ad-            et al., 2017; Geris et al., 2017). Not many studies sample rock
vancing our understanding of plant water uptake (Ehleringer         moisture, but it has been shown that water stored in rocky
and Dawson, 1992; Dawson et al., 2002). However, it oc-             layers can contribute to plant transpiration, sometimes more
casionally leads to results that are rather unexpected. For         than saturated soil layers (Barbeta and Peñuelas, 2017, and
instance, a pioneering study using hydrogen isotopes alone          references therein). Indeed, rock moisture can represent up

Hydrol. Earth Syst. Sci., 23, 2129–2146, 2019                                    www.hydrol-earth-syst-sci.net/23/2129/2019/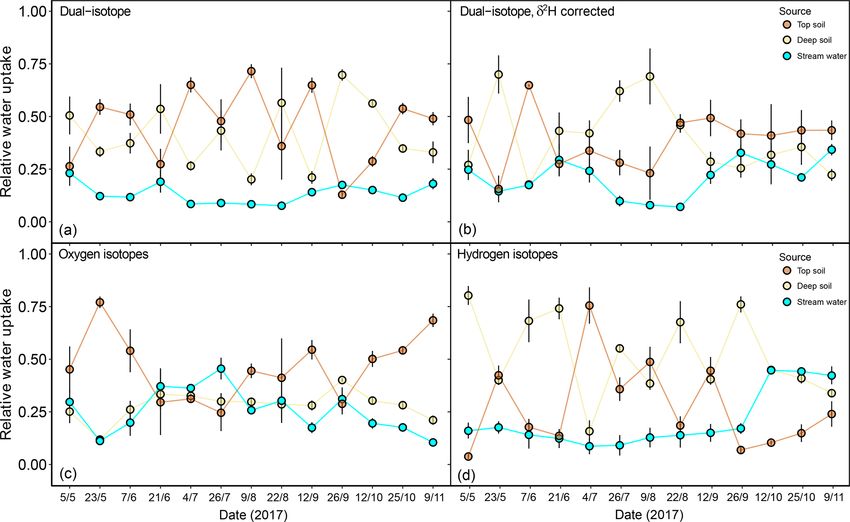
A. Barbeta et al.: Complication of the identification and quantification of tree water sources                                2131

to 27 % of annual rainfall and can be taken up by trees dur-       deuterium fractionation on the quantification of plant wa-
ing the dry season (Rempe and Dietrich, 2018). Moreover,           ter sources was addressed in a recent study by Evaristo et
the water stored in soil rock fragments can have an isotopic       al. (2017). They showed that erroneous results could be ob-
composition distinct to that of soil water or groundwater, be-     tained when a simple mass balance approach using hydrogen
ing either relatively more depleted (in the case of δ 2 H in Os-   isotopes only was implemented, but they also concluded that
hun et al., 2015) or more enriched (Palacio et al., 2014; Rong     results were less sensitive to deuterium fractionation when
et al., 2011). Such variable and contrasted isotopic effects       both deuterium and oxygen isotopes were combined within a
of lithology are to be expected for differing minerals and         Bayesian inference approach (Evaristo et al., 2017).
can even cause fractionations of opposite signs for the hy-
drogen and oxygen isotopes (Meißner et al., 2014; Oerter et        1.6    Aim of the study
al., 2014). Thus, wherever weathered rocks constitute a large
fraction of the soil volume, the isotopic composition of rock      The aim of this study was to identify the water sources
moisture should be measured as rock moisture could consti-         of a refugial population of Fagus sylvatica (L.) in SW
tute a significant alternative plant water source.                 France, nearing the southernmost distribution limit of this
                                                                   species. Evidence from studies of population genetics (De
1.5   Evidence of isotope fractionation during root water          Lafontaine et al., 2013) and in situ soil macrofossil charcoals
      uptake                                                       radiocarbon-dated back to more than 40 kyr before present,
                                                                   when the area was a periglacial desert (de Lafontaine et
Although it cannot be ruled out that rock water in the             al., 2014), indicate that the Ciron valley acted as a climate
carbonate-rich soil of Bowling et al. (2017) was a signifi-        refugium during the Last Glacial Maximum (de Lafontaine
cant source of water for trees or caused any unexpected iso-       et al., 2014; Timbal and Ducousso, 2010). Thereafter F. syl-
tope effects, the very clayey soil texture reported by Brooks      vatica expanded northwards and colonized the areas of its
et al. (2010) seems less likely to contain a large rock wa-        current distribution range from this and other populations
ter component. Oerter et al. (2014) showed that cations ad-        in southern Europe (Gavin et al., 2014). The population is
sorbed to clay minerals create isotopically organized hydra-       hypothesized to have persisted there since the Last Glacial
tion spheres of water around them and thereby sequester            Maximum (de Lafontaine et al., 2014) because of an array of
these water molecules away from the bulk water. However,           edaphic, thermal and hydric features decoupled from the sur-
even if the majority of the water contained in small pores is      rounding regional environment, notably convergent topogra-
adsorbed water that does not interact with the more mobile         phy, frequent fog, short distances to a stream and complex
water (the TWW hypothesis), in summer, when only water in          lithology. In an attempt to better understand the ecohydro-
small pores is accessible to the trees, there should be an iso-    logical mechanisms shaping this refugium, we sampled po-
topic match between soil pore and xylem water, unless H1 is        tential source waters as well as xylem water, analysed their
not true and isotopic fractionation occurs during root uptake.     isotopic composition and applied isotope mixing models to
In this context, a recent controlled experiment conducted on       quantify the relative contribution of different water sources to
potted avocado (Persea americana) trees has revealed iso-          both F. sylvatica and the more regionally widespread Quer-
topic fractionation during root water uptake in non-saline,        cus robur (L.). To do so, we also addressed a number of
relatively moist environments (Vargas et al., 2017), clearly       the caveats raised above including the sampling of all poten-
questioning the validity of H1. Vargas et al. (2017) showed        tial water sources, including fog and rock water, in addition
that P. americana plants discriminated against hydrogen iso-       to measuring both water isotopes to identify better possible
topes about 10 times more than oxygen isotopes during water        isotopic fractionation during root water uptake. We used a
uptake, and this discrimination increased with soil water loss,    Bayesian inference approach to quantify how plant source
porosity and particle size. Interestingly, the datasets reported   water varied seasonally, between species and with distance
by Brooks et al. (2010) and Oerter and Bowen (2019) contain        to the river. In parallel with the ecological focus of our study,
a substantial number of xylem water samples that occupy the        the reported isotopic dataset spanning a whole growing sea-
δ 18 O–δ 2 H space well below the soil water line, suggestive of   son was also used to explore the potential effect of isotopic
deuterium fractionation processes during root water uptake.        fractionation on the quantification of tree water sources.
In fact, a growing number of studies are reporting xylem wa-
ter with an isotopic composition that is relatively depleted       2     Methods
compared to that of the considered sources (De Deurwaerder
et al., 2018; Evaristo et al., 2017; Geris et al., 2017; Oerter    2.1    Study site and experimental design
and Bowen, 2019; Wang et al., 2017), suggesting that iso-
topic fractionation during root water uptake may be more           European beech (Fagus sylvatica L.) is a deciduous
common than previously thought. If such fractionation pro-         broadleaved tree species distributed across most of West-
cesses are not taken into account, the estimation of plant wa-     ern and Central Europe. The population that is the focus
ter sources may be miscalculated. The effect of an eventual        of this study is found along a mixed riparian forest on

www.hydrol-earth-syst-sci.net/23/2129/2019/                                     Hydrol. Earth Syst. Sci., 23, 2129–2146, 2019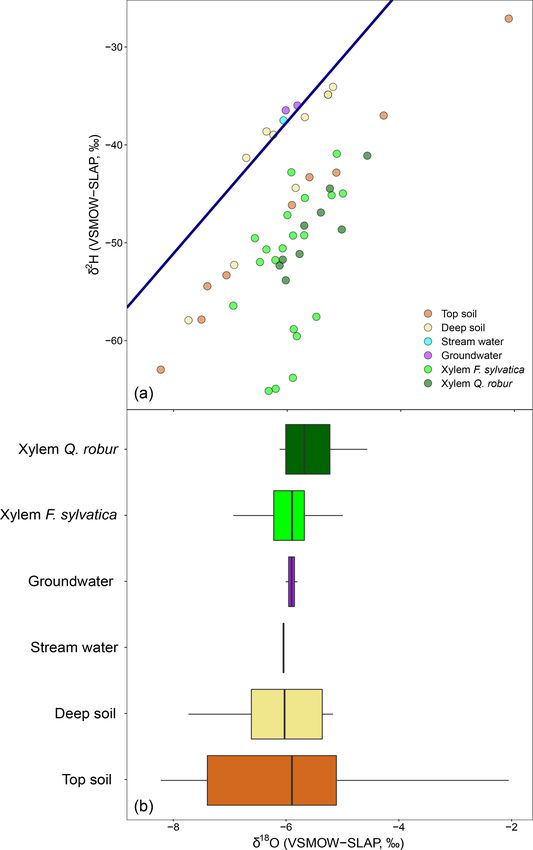
2132                           A. Barbeta et al.: Complication of the identification and quantification of tree water sources

the karstic canyon formed by the Ciron, a tributary of the           tracted xylem samples from coarse roots with an increment
Garonne river, in Gironde, a south-western French region             borer. Three soil cores per plot, located randomly amongst
(44◦ 230 N, 0◦ 180 W; 60 m a.s.l.). The soil there has a fine tex-   the sampled trees, were extracted with a soil auger. Each soil
ture and is slightly less organic than the sandy soils found         core was split into top soil (0–10 cm) and deep soil (from 70–
in the surroundings, typical of the Aquitaine Basin (Table S1        80 to 110–120 cm depending on the depth of the rocky layer).
in the Supplement). Importantly, the presence of limestone           While we were aware of the possibility of non-monotonic
rocks weathered to various degrees creates a distinguish-            soil isotopic profiles, we considered the sampled layers as
able carbonate-rich C horizon between 50 and 120 cm below            the best representatives of evaporation-exposed soil layers
ground (Table S1). Interestingly this European beech popu-           and deeper ones only affected by infiltrating water and sub-
lation is restricted either to the sheltered Ciron ravine or to      sequent mixing. This decision was done based on the char-
slightly more distant sites (100 m) located on irregular mi-         acteristics of the soil profile (Table S1), in which the sam-
crotopography with small karstic depressions. In this riparian       pled deep soil layer had a texture that could hold most of
forest F. sylvatica trees coexist with other deciduous species       the soil moisture, compared to upper soil layers, by having a
such as Quercus robur L., a regionally common tree species           very coarse texture and thus lower water retention capacity.
that dominates the canopy further away from the river. Other         Soil samples were placed in 20 mL vials with positive insert
tree species within the riparian forest are Carpinus betulus         screw-top caps, sealed with Parafilm® and kept in a cool box
L., Alnus glutinosa L., Corylus avellana L. and Tilia platy-         until they were stored in the lab at 4 ◦ C. From July onwards,
phyllos Scop. At the riparian forest limits beyond the chalky        we also sampled limestone rocks. We dug horizontally into
soil areas, we find plantations of Pinus pinaster Ait., clear        rocky edges to avoid the effect of evaporation and collected
cuts or agricultural fields.                                         one sample per plot and sampling date.
   The studied area has a temperate oceanic climate (Cfb                In addition to soil, xylem and rocks, we collected for ev-
in the Köppen–Geiger classification). Daily meteorologi-             ery sampling date water from the stream, groundwater from
cal data were available from a weather station located at            a well located ca. 50 m from the river, and fog and rainwater
about 20 km from the studied site, and long-term (1897–              from collectors installed in a small open area about 100 m
present) monthly temperature and precipitation data were             away from one of our plots. Both rain and fog collectors
also available from another weather station located 16 km            were connected via a funnel to a thermally insulated wa-
away from the studied area. Streamflow data were obtained            ter reservoir buried in the ground with minimal contact with
from a stream gauge located about 4 km downstream of our             the open air following the recommendations of the Global
study area. Over the period 1897–2015, the mean annual               Network of Isotopes in Precipitation (GNIP) network (http://
temperature was 12.9 ◦ C and the mean annual precipitation           www-naweb.iaea.org/napc/ih/IHS_resources_gnip.html, last
was 813 mm yr−1 , distributed rather evenly over the season.         access: 1 July 2018). Each rain and fog water sample cor-
Since 1897, the mean annual temperature has increased by             responds to the averaged (amount-weighted) value of the
+1.0 ◦ C (P < 0.001), whereas precipitation has not showed           water that precipitated since the previous sampling date.
any trend.                                                           The local meteoric water line (LMWL) was constructed
   Early in 2017, three field plots with different conditions        with rainwater isotope data collected monthly since Febru-
were set up within the riparian forest. Two of the plots were        ary 2007 at a GNIP station located in Cestas, France (Fig. 2).
located on opposite sides of the river (NE and SW) to explore        The fog collector was custom-built following the design of
exposition effects, and a third plot, adjacent to an open area       the single-stage Caltech Active Strand Cloud water Collec-
formerly occupied by a P. pinaster plantation, was chosen            tor (CASCC2, Demoz et al., 1996). This design has been
to explore the effect of forest fragmentation on the microcli-       shown to be well suited for water isotope studies (Spiegel
mate and notably the fog occurrence. In each of the plots, we        et al., 2012). According to the theory presented in Demoz et
selected five mature F. sylvatica and three Q. robur individu-       al. (1996) our one-stage fog collector is ill-designed to col-
als of 80–150 years with all occupying dominant positions in         lect small fog events (i.e. clouds with droplet sizes of 7 µm
the canopy. In addition, we selected six non-dominant F. syl-        or less, corresponding to a liquid water content of less than
vatica trees in two of the plots to explore the effect of tree       0.01 g m−3 ), but such fog events are unlikely to have any sig-
size (Dawson and Ehleringer, 1991; Ehleringer and Daw-               nificant contribution to the water source of the trees (i.e. less
son, 1992). The maximum distance between trees from the              than 0.5 L h−1 per tree, assuming a surface of exchange of
same plot was 15 m. All selected trees were sampled fort-            60 m2 per tree and an average wind speed through the tree
nightly from mid-April to early November 2017. In order to           crown of 0.2 m s−1 during such fog events). On the other
measure the xylem water isotopic composition, several twigs          hand, any fog event with enough water made up of droplets
were collected from every tree, rapidly peeled to remove bark        larger than 7 µm in diameter was (in theory) collected, and
and phloem, and then placed in an airtight Exetainer® sealed         the isotopic composition of this fraction of the cloud was ex-
with Parafilm® and kept in a cool box until they were stored         pected to be representative of the entire cloud, because the
in the lab at 4 ◦ C. For four trees (three F. sylvatica and one      isotopic composition of cloud droplets is independent of their
Q. robur), the canopy could not be accessed and so we ex-            size (Spiegel et al., 2012).

Hydrol. Earth Syst. Sci., 23, 2129–2146, 2019                                      www.hydrol-earth-syst-sci.net/23/2129/2019/
A. Barbeta et al.: Complication of the identification and quantification of tree water sources                                 2133

2.2   Water extraction and determination of stable                   2.3   Data analysis
      isotope composition
                                                                     The relationships between xylem water and its potential
The water contained in soil, xylem and rock samples was ex-          sources were compared at the plot level. All the analyses
tracted using a cryogenic vacuum distillation system based           described below are also calculated at the plot level. Be-
on the design and methodology described by Orlowski et               cause no significant difference was found between the iso-
al. (2013). A detailed description of the system used is avail-      topic compositions of xylem (or water sources) between the
able in Jones et al. (2017). Briefly, the pressure in the extrac-    different studied plots, “plot” was set as a random factor.
tion line was set at less than 1 Pa at the start of the extraction   To assess whether there was an isotopic offset between tree
(i.e. when the samples were still frozen in liquid nitrogen).        xylem water and its potential sources, the concept of the
The samples were then gradually (within 1 h) heated up to            line-conditioned excess (LC-excess) proposed by Landwehr
80 ◦ C (soils) or 60 ◦ C (xylem) for 2.5 h. The pressure line        and Coplen (2006) was used: LC-excess = δ 2 H − aδ 18 O − b,
was continuously recorded using subatmospheric pressure              where a and b correspond to the slope and intercept of the
sensors (APG100 Active Pirani vacuum gauges, Edwards,                LMWL, respectively. However, because the source water for
Burgess Hill, UK) to check that the lines remained leak-tight        a tree is more likely to be made of soil water than rainwa-
throughout the entire extraction. Gravimetric water content          ter directly, we modified the equation above and computed
was assessed for each sample using the sample weight be-             the deviation of a given xylem water with respect to the soil
fore and after water extraction. We also checked that the wa-        water line (SW-excess) from the same plot and date:
ter extraction had been completed by oven drying all samples
                                                                     SW-excess = δ 2 H − as δ 18 O − bs ,                        (1)
at 105 ◦ C for 24 h and reweighing them.
   The isotopic composition (δ 2 H and δ 18 O) of the differ-        where as and bs are the slope and intercept of the soil wa-
ent waters were measured with an off-axis integrated cav-            ter line for a given plot and date, respectively, and δ 2 H and
ity optical spectrometer (TIWA-45EP, Los Gatos Research,             δ 18 O correspond to the isotopic composition of a xylem wa-
USA) coupled to an autosampler. Details on the processing            ter sample collected on that plot at that date. The slope and
and post-correction of water samples can be found in Jones           intercept as and bs were computed by performing a linear re-
et al. (2017). The presence of organic compounds (ethanol,           gression on all the soil water isotope data from the surface
methanol and/or other biogenic volatile compounds) in wa-            and deep horizons collected at a given plot and date. The
ter samples can lead to large isotopic discrepancies in laser-       SW-excess of xylem water is an indicator of the δ 2 H offsets
based analyses (Martín-Gómez et al., 2015). Organic com-             between xylem samples and their corresponding soil water
pounds are found in certain soil types (Orlowski et al., 2018)       lines. Positive SW-excess values indicate xylem samples that
but are more typically found in water extracted from plant           are more enriched in deuterium than the soil water line (and
tissues (Zhao et al., 2011). Post-corrections to account for         are thus positioned above soil water in a δ 18 O–δ 2 H diagram),
the presence of organic compounds in water can be applied,           while negative SW-excess values indicate xylem samples that
based on metrics from the measured absorption spectrum               are more depleted in deuterium than the soil water line (and
(Brian Leen et al., 2012; Schultz et al., 2011). Nonetheless,        are thus positioned below soil water in a δ 18 O–δ 2 H diagram).
these post-processing functions must be developed for each              The contribution of different water sources to that of
individual instrument. Following Schultz et al. (2011), we           xylem water was estimated using the MixSIAR package
thus developed our own post-corrections by analysing Milli-          (Stock and Semmens, 2016) in R (R Core Development
Q waters mixed with methanol and/or ethanol at various con-          Team, 2012). Different mixing models were run in the script
centrations and by fitting the measured deviation from the           version of the package, and the number of Markov chain
expected isotope ratio to the narrow- and broadband met-             Monte Carlo iterations was increased manually (by trial and
rics provided by the instrument. We verified the performance         error) until convergence was reached and the results for
of our correction with the contaminated standard WICO5               the Gelman and Geweke diagnostics were acceptable. We
(Wassenaar et al., 2018). Xylem water samples generally ex-          grouped together trees of the same plot, species and date al-
hibited higher narrow- and broadband metrics compared to             together and thus specified the residual error term in the iso-
rain or even soil water samples, but the corrections on xylem        tope mixing models (Parnell et al., 2010). The potential tree
samples were always quite small (ca. 1.5 ‰ for δ 2 H and             water sources that we considered were restricted to the top
0.7 ‰ for δ 18 O) compared to the correction we had to ap-           and deep soil water and stream water/groundwater. Stream
ply on the WICO5 sample, or on some of our water–alcohol             water and groundwater were pooled together as they were
mixtures used to derive our in-house post-processing func-           isotopically indistinguishable. Fog and rock moisture were
tions. All isotopic data reported here are expressed on the          not included as potential water sources with this approach
VSMOW–SLAP scale.                                                    because their isotopic signatures were very distant to xylem
                                                                     waters in a δ 18 O–δ 2 H diagram and because there were only
                                                                     a limited number of campaigns when they were measured.
                                                                     In order to test the sensitivity of MixSIAR to different data

www.hydrol-earth-syst-sci.net/23/2129/2019/                                       Hydrol. Earth Syst. Sci., 23, 2129–2146, 2019
2134 A. Barbeta et al.: Complication of the identification and quantification of tree water sources
inputs, the models were run with four different types of input
data: (1) δ 2 H and δ 18 O, (2) δ 2 H and δ 18 O after subtracting
the SW-excess from the δ 2 H of xylem samples, (3) only δ 18 O
and (4) only δ 2 H. Correcting xylem δ 2 H with SW-excess im-
plies that tree water uptake relies only on soil water pools be-
cause the SW-excess is calculated using the slope and inter-
cept of the soil water line. However, the lower part of this line
usually overlaps with unenriched stream water and ground-
water. Thus, we expected that δ 2 H departures from this line
are meaningful in potential cases where trees are accessing
not only soil water but also stream water.
The spatial, temporal, species-specific and size-related sta-
tistical comparisons between the isotopic compositions of
grouped samples were analysed using linear models or, when
plot and date were necessarily set as random factors, linear
mixed models from the package lme4 (Bates et al., 2015) in
R. For instance, for comparisons between groups across sev-
eral dates, the date of sampling was set as a random factor.
In order to understand the factors driving the observed SW-
excess of xylem water, we fitted generalized linear mixed
models (GLMM) including soil moisture (top and deep),
type of sampling (coarse root or branch) soil water isotopes,
tree diameter (DBH), and rainfall and vapour pressure deficit
(VPD) prior to sampling and using the tree species as an ex-
planatory variable. We selected the best model by means of
the second-order Akaike information criteria (AIC). Given
the water source contributions estimated with MixSIAR us-
ing different input data, we assessed their correlations with
top and deep soil moisture, rainfall and VPD, also using
GLMM from lme4.
3 Results Figure 1. Environmental conditions in the riparian forest along the
Ciron river during the 2017 growing season. (a) Daily vapour pres-
3.1 Environmental conditions sure deficit (VPD), (b) daily precipitation, (c) monthly streamflow
for 2017 (dashed line) and the 2010–2017 period (solid line), and
The mean temperature of the 2017 (April–November) grow- (c) gravimetric water content of top soil (0–10 cm) and deep soil
ing season was 0.4 ◦ C warmer than the long-term average (ranging from 50 to 120 cm).
but 0.5 ◦ C cooler than the average of the last 25 years. Pre-
cipitation during the 2017 growing season was 20 % lower
than the long-term average but close to the average of the 2.5 g cm−3 , we estimated the mean volumetric water content
last 25 years. There was a clear deficit in precipitation of limestone rocks to be around 12 %, which is comparable
from the previous winter (estimated from December 2016 to that of the deep soil.
to March 2017) that caused a 43 % reduction in stream-
flow compared to the 2000–2017 average, throughout the en- 3.2 Stable isotopic composition of tree water sources
tire growing season (Fig. 1). Deep soil layers progressively
dried over the entire growing season up to the last sampling The long-term (2007–present) local meteoric water line us-
campaign in November, while top soil moisture was usually ing the closest GNIP station (see Material and Methods) is
higher but also more variable, with relatively high levels at shown in each panel of Fig. 2. The rain data collected fort-
the beginning and end of the season and levels as low as the nightly plotted closely to this line and ranged, from −7.0 ‰
deep soil layer only in midsummer (Fig. 1). Based on the to −1.3 ‰ in δ 18 O and −46.8 ‰ to −5.4 ‰ in δ 2 H (Fig. 2).
water retention properties of top and deep soil layers, we es- Fog water ranged from between −6.5 ‰ and −0.9 ‰ in
timated that the permanent wilting point was reached in the δ 18 O and between −32.4 ‰ and −8.4 ‰ in δ 2 H (Fig. 2) and
top soil only in early September and from late July to the was not significantly different from rainwater (P > 0.05 for
end of the season in the deep soil. Using a rock density of both isotopes, Fig. S1 in the Supplement). Stream water and
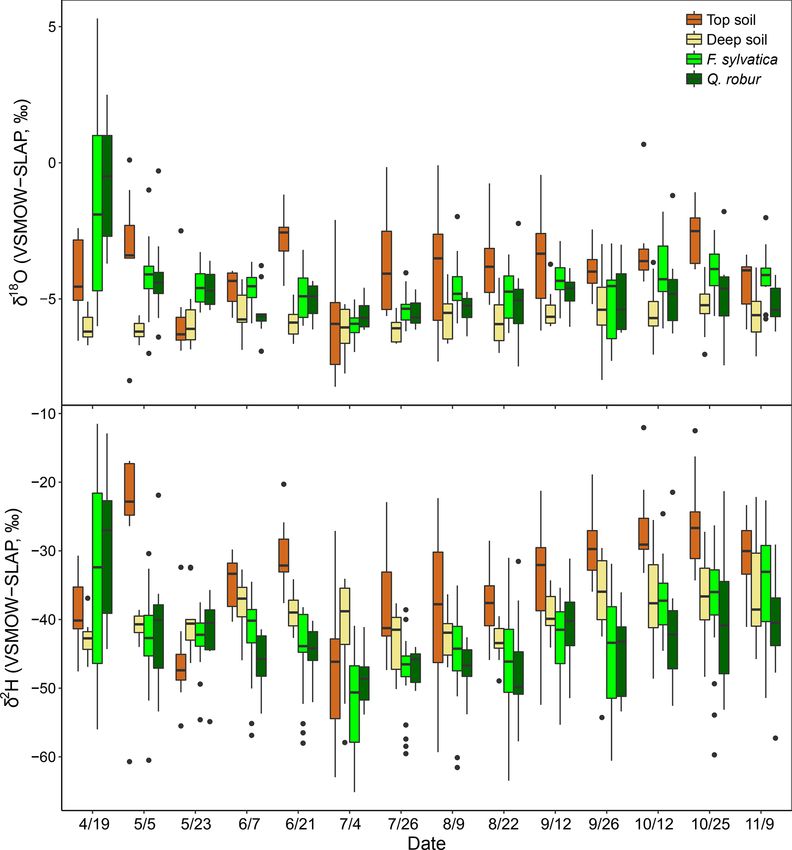
Hydrol. Earth Syst. Sci., 23, 2129–2146, 2019 www.hydrol-earth-syst-sci.net/23/2129/2019/A. Barbeta et al.: Complication of the identification and quantification of tree water sources 2135
groundwater had isotopic compositions that were not statis- this first campaign, xylem water samples of both F. sylvatica
tically different and very stable over time (−5.9 ± 0.2 ‰ in and Q. robur overall had a more depleted δ 2 H than top and
δ 18 O and −36.8 ± 0.8 ‰ in δ 2 H). deep soil water (P < 0.001), as illustrated by Fig. 3. Con-
Soil water samples occupied the δ 2 H–δ 18 O space on the sequently, a large number of the xylem samples fell outside
right side of the LMWL (Fig. 2). On average over the grow- the range of the considered sources in the dual-isotope space
ing season, top soil water was significantly more enriched (Fig. 2).
than deep soil (P < 0.001 for both isotopes) as a result of The diameters at breast height of trees (DBH) were neg-
evaporative enrichment at the soil surface. The resultant soil atively correlated with both isotopes of xylem water sam-
water line (SWL) had a mean slope of 5.17 (ranging from ples (P < 0.001). Consequently, dominant trees of F. syl-
4.01 to 9.99 depending on the sampling date), which is sig- vatica had more depleted xylem water than non-dominant
nificantly smaller than the slope of the LMWL (6.73). The trees (P < 0.01 for both isotopes). Xylem water from F. syl-
difference in δ 18 O between top and deep soil water was sig- vatica trees presented marginally more enriched values of
nificantly smaller in the plot within a mixed broadleaved for- δ 18 O (P < 0.05) and δ 2 H (P < 0.1) than Q. robur trees.
est (P < 0.05), suggesting that soil evaporation was probably To our surprise, no significant differences were found in
lower at this plot. xylem water isotopes between the three studied plots. The
Over the season, rainfall amounts over the 15 d preced- four trees (all on the same plot) in which xylem water was
ing each sampling campaign had a negative effect on top soil extracted from outcropping coarse roots (rather than from
water δ 18 O and δ 2 H (P < 0.001) and no significant effect twigs) showed a significantly more depleted δ 2 H over the
on the isotopic composition of the deep soil water, typical of whole season (P < 0.001), but no significant difference in
shallow infiltration–evaporation cycles (Barnes and Allison, δ 18 O, compared to all the other trees (Fig. 4). The δ 2 H offset
1988). In the top soil, water content was negatively corre- between xylem and soil water samples still persisted after ex-
lated with soil water δ 18 O (P < 0.05) but not with δ 2 H. This cluding these coarse root samples, demonstrating that xylem
is surprising because isotopic fractionation occurring during water δ 2 H exhibited different patterns than δ 18 O.
soil water evaporation and water vapour and liquid diffusion The isotopic offset between xylem and soil water sam-
should affect both water isotope signals in the same direc- ples was assessed by calculating the SW-excess. On average,
tion. The fact that these water signals respond differently to xylem water samples had a SW-excess of −8.40 ± 5.37 ‰ .
top soil water content but similarly to rainfall amount (see There were no significant differences in xylem SW-excess
above) indicates that observed changes in top soil water iso- between species, and its seasonal variations were small
tope signals are primarily governed by the isotopic compo- (Fig. 5). Although canopy position and DBH had no effect
sition of the precipitation input and only secondarily by soil on the SW-excess, the type of sampling had a strong influ-
water evaporative enrichment. It may also be that hydrogen ence, as the SW-excess was significantly more negative in
isotopes of soil water are reflecting extra fractionation pro- trees whose xylem water had been sampled from coarse roots
cesses (e.g. root uptake) compared to their oxygen isotope as opposed to twigs (Fig. 4, Table S2). The linear regres-
counterparts. No similar correlation was observed between sion of the soil water line was significant for most sampling
soil water content and δ 18 O (or δ 2 H) in the deep soil proba- dates and plots (Table S3). Consequently, we removed from
bly because the range of variations was smaller (Figs. 1 and the multivariate analysis of the SW-excess those data cor-
2). Finally, δ 2 H and δ 18 O of rock moisture were significantly responding to sampling dates and plots that did not present
more enriched than those of top and deep soil water but fell significant soil water line regressions. Still, the SW-excess
along the LMWL (Fig. 2). The isotopic signal of rock mois- did not significantly differ between cases with significant soil
ture did not differ between plots over time, nor did it correlate water lines and cases with non-significant soil water lines
with weather conditions or with the isotopic signal of top or (P = 0.45). Likewise, non-significant fittings of the soil wa-
deep soil water, and thus rock soil water isotopic composition ter lines could entail non-monotonic isotopic soil profiles,
was excluded from further analyses. in which intermediate layers could potentially be relatively
more depleted in both isotopes than surface soil layers. In
3.3 Stable isotopic composition of xylem water such cases, the estimation of the SW-excess could be less
meaningful regarding isotopic offsets between xylem and
The isotopic composition of xylem water always fell under- soil water.
neath the LMWL in the dual-isotope space (Fig. 2). Xylem The GLMM used to understand the factors driving the SW-
water from the first campaign on 19 April (i.e. just before excess across time and space explained 33.3 % of the vari-
or during budburst) was exceptionally enriched (Fig. 3) and ance (Table S2). The model that best fitted the data showed
fell in the upper right part of the dual-isotope space (top that top soil water content had a positive effect on SW-excess,
left panel in Fig. 2), except for those trees that had already whereas rainfall, top soil water δ 2 H and daytime VPD had
flushed their leaves. This could be indicative of stem evap- negative effects (larger isotopic offset between xylem water
orative enrichment over winter, as observed in other species and the soil water line). The variables with larger relative im-
(Bowling et al., 2017; Martín-Gómez et al., 2017). Excluding
www.hydrol-earth-syst-sci.net/23/2129/2019/ Hydrol. Earth Syst. Sci., 23, 2129–2146, 20192136 A. Barbeta et al.: Complication of the identification and quantification of tree water sources
Figure 2. Dual-isotope (δ 2 H and δ 18 O) plot of xylem water of the two studied species (F. sylvatica and Q. robur) and its potential sources
(soil water at two depths, groundwater, stream, rain, fog and rock water) for every sampling campaign conducted in 2017. The blue line
indicates the LMWL, whereas the dashed black line indicates the global meteoric water line (GMWL).
portance were the type of sampling (coarse roots or twigs; see Fog and rock moisture were not included as potential wa-
Fig. 4) and rainfall of the week prior to the sampling date. ter sources because their isotopic signatures were very en-
riched compared to xylem water but also soil and stream
3.4 Isotopic mixing models water/groundwater (Fig. 2), so that their contribution would
have moved xylem water samples above and to the right of
The potential tree water sources that we considered were re- the other potential sources in the dual-isotope plot, i.e. the
stricted to the top and deep soil water and stream water and opposite of what we observed. Also fog water could only be
groundwater. Stream water and groundwater were pooled to- collected at the end of the summer, so it is unlikely to have
gether as they were isotopically indistinguishable (Fig. 2). been a significant source of water in either spring or early
Hydrol. Earth Syst. Sci., 23, 2129–2146, 2019 www.hydrol-earth-syst-sci.net/23/2129/2019/A. Barbeta et al.: Complication of the identification and quantification of tree water sources 2137
Figure 5. Temporal variations of SW-excess of F. sylvatica and
Q. robur xylem samples over the 2017 growing season. Box size
represents the interquartile range, the black line is the median, the
whiskers indicate variability outside the upper and lower quartiles,
and individual points are outliers.
summer. The first set of isotopic mixing models was only
run for the dominant trees of F. sylvatica and Q. robur using
both δ 18 O and δ 2 H data. Because non-dominant trees were
Figure 3. Isotopic composition of top soil water (0–10 cm), deep only sampled for F. sylvatica, and not for Q. robur, we pre-
soil water (50–120) and xylem water of the two studied species ferred to exclude them when comparing the two species. On
(F. sylvatica and Q. robur) for each sampling campaign. Data were average, these mixing models indicated that F. sylvatica trees
pooled over the three studied plots. Box size represents the in- used a mix of top and deep soil water, with a marginal con-
terquartile range, the black line is the median, the whiskers indi- tribution of stream water (Fig. 6). The same mixing models
cate variability outside the upper and lower quartiles, and individual also indicated that Q. robur relied mostly on soil water as
points are outliers.
well but had significantly higher contributions from stream
(P < 0.01) and deep soil water (P < 0.01) and consequently
lower contributions from top soil water (P < 0.001), com-
pared to F. sylvatica. Nonetheless, both species followed sim-
ilar temporal patterns (Fig. 6). The non-dominant F. sylvat-
ica trees also had source contributions similar to the domi-
nant ones, although with a slight but surprisingly higher rela-
tive uptake from stream water (Fig. S2). Differences between
plots were not significant (not shown).
In a second step, we focused on the sensitivity of the iso-
topic mixing models to the observed δ 2 H offset and the dual-
versus single-isotope approach. For this, we only used the
isotopic data for dominant F. sylvatica trees (N = 15). Cor-
recting values of xylem δ 2 H for their SW-excess significantly
affected the estimated source contributions of F. sylvatica
(Fig. 7). The dual-isotope model with corrected δ 2 H values
Figure 4. SW-excess, δ 2 H and δ 18 O of xylem samples of dominant estimated a higher contribution of stream water late in the
F. sylvatica and Q. robur depending on the part of the tree sample season (P < 0.001) and deep soil water in the summer com-
(twigs or coarse roots). Significant differences between twigs and pared to the dual-isotope model with the original δ 2 H val-
coarse roots (P < 0.001) are highlighted with asterisks (***). Box ues. This was naturally accompanied by a reduction in the
size represents the interquartile range, the black line is the median, contribution of top soil water during summer. The single-
the whiskers indicate variability outside the upper and lower quar-
isotope approach using only δ 18 O also estimated a higher
tiles, and individual points are outliers. Xylem samples from the
contribution of stream water (P < 0.001), following closely
first sampling campaign were excluded from the analysis because
of probable winter branch evaporation (see text). that of the deep soil, and a lower contribution of top soil wa-
ter compared to the dual-isotope approach with uncorrected
δ 2 H (Fig. 7). On the other hand, a single-isotope approach
using only δ 2 H led to very similar contribution patterns to
www.hydrol-earth-syst-sci.net/23/2129/2019/ Hydrol. Earth Syst. Sci., 23, 2129–2146, 20192138 A. Barbeta et al.: Complication of the identification and quantification of tree water sources
4 Discussion
4.1 Potential causes for the δ 2 H offset between xylem
water and source water
Our results support those from recent studies reporting xylem
water with a hydrogen isotope ratio more depleted than any
of the considered water sources and thus of any of their com-
binations (Evaristo et al., 2017; Geris et al., 2017; Oerter
and Bowen, 2019). The diversity of methodologies used for
the extraction of waters and their isotopic determination in
all these studies, including ours, minimises the likelihood of
a common analytical or methodological bias. Furthermore,
isotopic offsets measured between xylem and source water
were consistent over time and space (Figs. 2 and 5). Other
field datasets have shown similar isotopic offsets in semi-
arid (Dawson and Ehleringer, 1991; Oerter and Bowen, 2019;
Zhao et al., 2016) and saline (Lin and Sternberg, 1993) envi-
ronments, but here we show that it also occurs and persists in
temperate deciduous trees growing in a mild oceanic climate.
Furthermore, isotopic offsets between xylem water and soil
water in potted plants (Ellsworth and Williams, 2007; Var-
Figure 6. Relative water uptake from each of the plant water sources gas et al., 2017) and plants in botanical gardens (Evaristo
considered: topsoil, deep soil and stream water (indistinguishable et al., 2017) have also been reported and discussed to some
with groundwater), as estimated with MixSIAR for the dominant extent. In addition, studies from tropical (De Deurwaerder et
trees of F. sylvatica (a) and Q. robur (b). The error bars correspond al., 2018), semi-arid (Wang et al., 2017), temperate (Bertrand
to the standard deviation (N = 15 for F. sylvatica and N = 9 for
et al., 2014; Brooks et al., 2010) and northern ecosystems
Q. robur). These proportions were estimated with uncorrected δ 2 H
(Geris et al., 2015, 2017) have also reported offsets similar
and δ 18 O values for xylem water.
in magnitude to those observed in our study. However, these
results and their repercussions for partitioning were not fully
the dual-isotope approach with uncorrected δ 2 H, except at discussed or explored. Our results show that δ 2 H offsets be-
the very beginning and end of the growing season (Fig. 7). tween xylem water and source water complicate the identifi-
The discrepancy in the estimation of source contribution cation of plant water sources and the source contributions es-
to xylem water of isotope mixing models with different in- timated by Bayesian isotopic mixing models (Fig. 7), a find-
put data also translated into a contrasting relationship with ing in contrast with recent studies (Evaristo et al., 2017).
environmental data (rainfall, VPD and soil moisture). These The mismatch between xylem water and source water iso-
relationships are reported in Table 1, separated by source topes may be caused by three non-exclusive processes: (1) a
and input data. Overall, the models using a dual-isotope ap- water isotope separation between bound and mobile soil wa-
proach but with corrected δ 2 H values or only δ 18 O showed ter (Tang and Feng, 2001; Brooks et al., 2010), (2) a wa-
the strongest and most plausible correlations with environ- ter isotope fractionation occurring at the soil–root interface
mental variables over the growing season. Although the con- (Ellsworth and Stenberg, 2007; Vargas et al., 2017), or (3) a
tribution of stream water to xylem water estimated from δ 2 H water isotope compartmentalization between vessel water
only led to the best correlations with rainfall amounts and and other stem water pools (Zhao et al., 2016). In particular,
VPD, the sign of these correlations was the opposite of what surface–water interactions operating at the pore level (Oerter
is expected. That said, the use of only one isotope was not and Bowen, 2017) and varying as a function of particle size
sufficient to disentangle the contribution of various water (Gaj et al., 2017) or cation content (Oerter et al., 2014) may
sources for some campaigns where the isotopic composi- create isotopic heterogeneity within the soil matrix. The soil
tions of the different water sources were too similar (Fig. 8). in our study site is sandy; thus the effect of interactions with
In these cases, the Bayesian mixing models predicted equal clay-absorbed cations are likely to be small (Fig. S2). How-
contributions for each of the three water sources considered ever, surface–water interactions on quartz silica or carbon-
(e.g. on 4 July for δ 18 O only, Fig. 7). rich materials have also been shown to affect the water iso-
tope composition of adsorbed water (Lin and Horita, 2016;
Lin et al., 2018; Chen et al., 2016). Assuming that cryogeni-
cally extracted soil water represents bulk soil water, a dispar-
ity between adsorbed soil water and more mobile water ac-
Hydrol. Earth Syst. Sci., 23, 2129–2146, 2019 www.hydrol-earth-syst-sci.net/23/2129/2019/A. Barbeta et al.: Complication of the identification and quantification of tree water sources 2139
Figure 7. Relative water uptake from each of the plant water sources considered: topsoil, deep soil and stream water (indistinguishable with
groundwater), as estimated with MixSIAR for the dominant trees of F. sylvatica. The input data are different for each of the four panels:
(a) uncorrected δ 2 H and δ 18 O, (b) δ 2 H (corrected for SW-excess) and δ 18 O, (c) only δ 18 O and (d) only δ 2 H. The error bars represent
standard deviations (N = 3).
Table 1. Output of the generalized linear mixed models computed with the source contributions estimated with different input data and
environmental independent variables. Dual implies the use of both water isotopes. Individual models are run per each plant water source
and input data type. For each model effect, the β estimate (standardized correlation coefficient) is shown. Marginal R 2 corresponds to the
variance in source contribution explained by the model independent variables. Significant effects are highlighted in bold and with asterisks
(* P < 0.05, ** P < 0.01, *** P < 0.001).
Input data Source Rainfall (5 d VPD (5 d Top soil Deep soil Marginal
amount) average) moisture moisture R2
Top soil 0.428* 0.004 −0.002 −0.081 0.140
Dual Deep soil −0.531 −0.048 −0.092 0.128 0.232
Stream water 0.138 0.138 0.298 −0.111 0.095
Top soil 0.425** 0.033 0.035 −0.664*** 0.336
Dual, δ 2 H corrected Deep soil −0.422* 0.013 −0.221 0.641*** 0.393
Stream water 0.014 −0.028 0.415* −0.258 0.203
Top soil −0.153 −0.429* 0.271 0.372* 0.272
Only δ 18 O Deep soil 0.158 0.277 −0.608*** −0.320* 0.398
Stream water 0.128 0.474* −0.168 −0.203 0.227
Top soil 0.375 0.043 −0.065 0.101 0.154
Only δ 2 H Deep soil −0.021 0.350 −0.049 −0.158 0.160
Stream water −0.682** −0.661*** 0.215 0.316* 0.526
cessible to the plant would create a mismatch between plant study (Oerter and Bowen, 2019). In addition, adsorbed water
and bulk soil water. Indeed, probe-sampled soil water vapour is generally more depleted than bulk soil water (Lin et al.,
appeared to be more representative of the plant-accessed soil 2018; Lin and Horita, 2016), so the more mobile water taken
water pool, compared to cryogenically extracted soil water up by the plants should be more enriched than bulk soil wa-
(Oerter et al., 2019). But this technique seems to solve the ter, i.e. the opposite of what is found in this study.
isotopic mismatches only in some sites (Bowling et al., 2017; Another possibility is that fractionation processes occur
Oerter et al., 2019), while in others it shows a relative de- during water extraction. Meißner et al. (2014) reported that
pletion in δ 2 H of xylem water, similar to that found in this treating soil samples with HCl to remove carbonates prior to
www.hydrol-earth-syst-sci.net/23/2129/2019/ Hydrol. Earth Syst. Sci., 23, 2129–2146, 20192140 A. Barbeta et al.: Complication of the identification and quantification of tree water sources
carbonates in the C horizon were responsible for a δ 18 O de-
pletion of extracted water from the deep soil samples of about
1 ‰, this would mean that the true soil water in this horizon
should be shifted by about +1 ‰. This would slightly mod-
ify the SW-excess values but would not cancel the observed
isotopic offset between soil water and xylem water. There-
fore, although the results of Meißner et al. (2014) are very
relevant to our study, they cannot explain the isotopic offset
observed here.
The water content of rocks was quite high (ca. 12 % in
volume) and highly enriched in both 18 O and 2 H compared
to bulk soil water. It is not clear what causes this enrich-
ment of rock water compared to the surrounding soil. If root
water uptake were causing it, this would mean that isotopic
fractionation processes during rock water absorption by the
roots enrich rock water and deplete the water taken up by
the plants. Without root water uptake, the isotope composi-
tion of rock water should then be similar to the surrounding
soil, and root water uptake could thus explain a depletion of
plant-accessed water compared to soil water, at least when
rock water contributes significantly to the plant water use.
However, the resulting isotopic offset should also vary over
time and space because it would be related to the soil wa-
ter and rock contents at the different depths. In contrast, we
measured a rather constant offset in the dual-isotope space,
driven mainly by δ 2 H and poorly explained by environmental
variables. Similar results in the literature (although scarcely
discussed) can be found at sites with contrasting plant and
soil types, soil moisture regimes and lithology (Brooks et
al., 2010; De Deurwaerder et al., 2018; Geris et al., 2017;
Vargas et al., 2017; Zhao et al., 2016). Thus, although em-
pirical evidence for an isotope separation between bulk and
Figure 8. Differences in the isotopic composition of xylem water plant-accessed soil water pools is growing, our results do not
and its potential sources using one isotope. The top panel depicts support that this would be produced by isotopic fractiona-
the dual-isotope plot for a single date (4 July), with xylem water tion during rock water absorption by the plants. Otherwise,
and sources. The bottom panel is the box plot of the δ 18 O values for we would expect both hydrogen and oxygen isotopes to be
xylem water of F. sylvatica and Q. robur and each of the potential affected and the isotope separation between plant and bulk
sources. Box size represents the interquartile range, the black line is soil waters to be weaker when soil water content is large.
the median, the whiskers indicate variability outside the upper and Instead, we found for all our trees a significant δ 2 H offset
lower quartiles, and individual points are outliers. between xylem and soil water sources (Fig. 5), even at times
when soil water content was high (Fig. 1). Similarly, we do
not think that branch evaporation is responsible for the re-
water extraction led to a cryogenically extracted water δ 18 O ported isotopic offset (Martín-Gómez et al., 2017). If it were
in agreement with that of input water, whereas the δ 18 O of the case, we would expect the magnitude of the offset to vary
cryogenically extracted water from carbonate-rich soil sam- over the season with evaporative demand and to affect both
ples was depleted by about 1 ‰ compared to input water. On hydrogen and oxygen isotopes, i.e. the opposite of what we
the other hand, they found no effect of carbonate content on report here.
hydrogen isotopes. They suggested that the δ 18 O depletion The SW-excess of xylem water collected from coarse roots
of extracted water was caused by oxygen isotope exchanges was significantly more depleted than that from twigs (Fig. 4).
between soil water and carbonates during the extraction, a Previous studies have shown that water in coarse or tap roots
process that should be temperature-dependent. Meißner et can exhibit significantly lower δ 2 H relative to source water
al. (2014) did not specify their extraction temperature but we pools, for example in Populus euphratica (Zhao et al., 2016)
expect it to be > 60 ◦ C, i.e. close to our extraction temper- and Prosopis velutina (Ellsworth and Williams, 2007). More-
ature of 80 ◦ C, so that we could expect a carbonate-induced over, the δ 2 H offsets between soil and root water observed
isotope effect of comparable magnitude. If the presence of in the former studies were of the same order of magnitude
Hydrol. Earth Syst. Sci., 23, 2129–2146, 2019 www.hydrol-earth-syst-sci.net/23/2129/2019/You can also read