Long term assessment of nutrient flow pathway dynamics and in stream fate in a temperate karst agroecosystem watershed
←
→
Page content transcription
If your browser does not render page correctly, please read the page content below
Received: 9 November 2018       Accepted: 27 February 2019
DOI: 10.1002/hyp.13427

RESEARCH ARTICLE

Long‐term assessment of nutrient flow pathway dynamics and
in‐stream fate in a temperate karst agroecosystem watershed

William I. Ford1                |   Admin Husic2             |    Alex Fogle1          |   Joseph Taraba1

1
 Biosystems and Agricultural Engineering,
University of Kentucky, Lexington, Kentucky,      Abstract
USA                                               Nutrient dynamics in karst agroecosystems remain poorly understood, in part due to
2
 Civil, Environmental and Architectural
                                                  limited long‐term nested datasets that can discriminate upland and in‐stream pro-
Engineering, University of Kansas, Lawrence,
Kansas, USA                                       cesses. We present a 10‐year dataset from a karst watershed in the Inner‐Bluegrass
                                                  Region of central Kentucky, consisting of nitrate (nitrate‐N [NO3−]), dissolved reactive
Correspondence
William Ford, Biosystems and Agricultural         phosphorus (DRP), total organic carbon (TOC), and total ammoniacal‐N (TAN) mea-
Engineering, University of Kentucky,
                                                  surements at nested spring and stream sites as well as flowrate at the watershed out-
Lexington, KY 40509.
Email: bill.ford@uky.edu                          let. Hydrograph separation techniques were coupled with multiple linear regression
                                                  and Empirical Mode Decomposition time‐series analysis to determine significance
Funding information
Office of Experimental Program to Stimulate       of seasonal processes and to generate continuous estimates of nutrient pathway
Competitive Research, Grant/Award Number:
                                                  loadings. Further, we used model results of benthic algae growth and decomposition
1632888
                                                  dynamics from a nearby watershed to assess if transient storage in algal biomass
                                                  could explain differences in spring and downstream watershed nutrient loading.
                                                  Results highlight statistically significant seasonality for all nutrients at stream sites,
                                                  but only for NO3− at springs with longitudinal variability showing significant
                                                  decreases occurring from spring to stream sites for NO3− and DRP, and significant
                                                  increases for TOC and TAN. Pathway loading analysis highlighted the importance of
                                                  slow flow pathways to source approximately 70% of DRP and 80% of NO3−. Results
                                                  for in‐stream dynamics suggest that benthic autotroph dynamics can explain summer
                                                  deviations for TOC, TAN, and DRP but not NO3−. Regarding upland dynamics, our
                                                  findings agree well with existing perceptions in karst for N pathways and upland
                                                  source seasonality but deviate from perceptions that karst conduits are retentive of
                                                  P, reflecting the limited buffering capacity of the soil profile and conduit sediments
                                                  in the Inner‐Bluegrass. Regarding in‐stream fate, our findings highlighted the signifi-
                                                  cance of seasonally driven nutrient processing in the bedrock‐controlled streambed
                                                  to influence nutrient fluxes at the watershed outlet. Contrary to existing perceptions,
                                                  we found high N attenuation and an unexplained NO3− sink in the bedrock stream,
                                                  leading us to postulate that floating macrophytes facilitate high rates of
                                                  denitrification.

                                                  K E Y W OR D S

                                                  bedrock stream, hydrologic pathways, in‐stream fate, karst agroecosystem watershed, nutrient
                                                  loadings, time‐series analysis

1610     © 2019 John Wiley & Sons, Ltd.                          wileyonlinelibrary.com/journal/hyp         Hydrological Processes. 2019;33:1610–1628.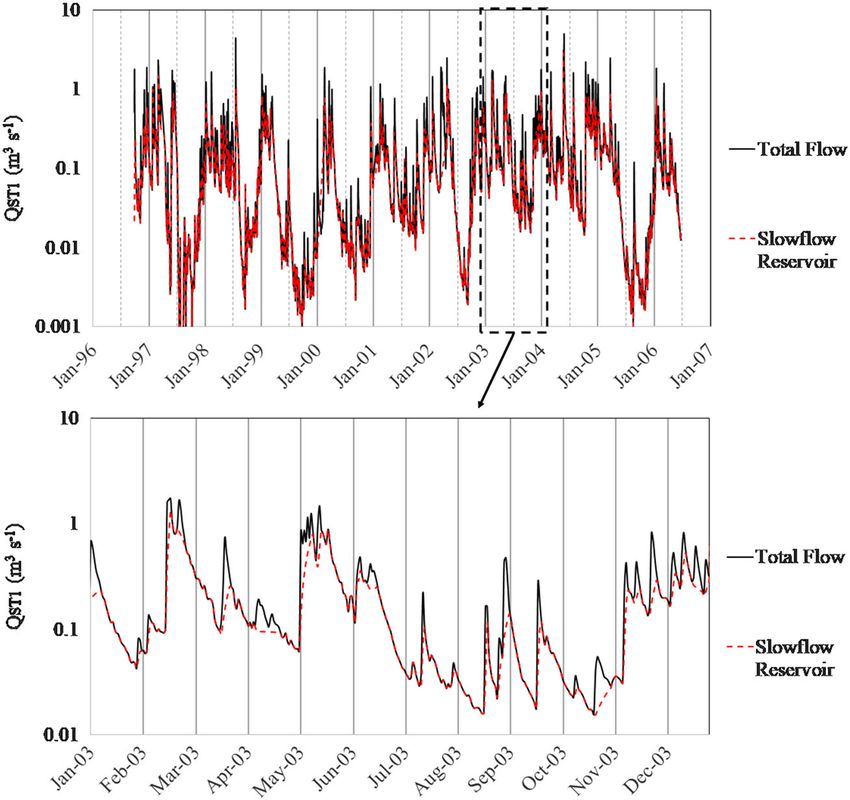
FORD     ET AL.                                                                                                                                  1611

1    |      I N T RO D U CT I O N                                           practices in which high soil P levels at the soil surface become con-
                                                                            nected to the stream network through macropores and overland flow
Karst landscapes drain approximately 12% of the earth's surface and         during quickflow (Baker, Johnson, & Confesor, 2017; Ford, Williams,
serve as a drinking water source for nearly 25% of the Earth's popula-      Young, King, & Fischer, 2018; Jarvie et al., 2014; King, Williams, &
tion (Ford & Williams, 2007; Hartmann, Goldscheider, Wagener,               Fausey, 2014). Despite this, karst conduits have recently been recog-
Lange, & Weiler, 2014). Agricultural karst terrain is highly vulnerable     nized to be highly retentive of DRP, even during quickflow, because
to nutrient leaching, making karst landscapes hotspots for down-            of transient sediment deposits within preferential pathways that
stream eutrophication (Husic, Fox, Adams, et al., 2019; Jarvie et al.,      adsorb or settle a portion of reactive P (Jarvie et al., 2014; Mellander
2014; Mellander et al., 2013). There is increasing recognition that         et al., 2013). Regarding seasonality of soil drainage waters during low
spring and surface water interfaces in karst landscapes are an ecosys-      flow in agroecosystems, a recent review suggests that N and P have
tem control point for biogeochemical transformations, yet these inter-      been found to have contrasting seasonality with nitrate often having
faces remain understudied (Briggs & Hare, 2018). In part, this is likely    maximum concentrations in winter and minimum concentrations in
due to a lack of extensive databases for the management and predic-         summer, whereas DRP often has been found to have maximum con-
tion of karst water resources, as recently highlighted by Hartmann          centrations in summer and minimum concentrations in winter (Ford,
et    al.    (2014).   Compounding   these   problems    in   temperate     Williams, & King, 2018).
agroecosystems are complex seasonal patterns of nutrient dynamics              Regarding in‐stream fate, agroecosystem streambeds often consist
both in the uplands (Exner‐Kittridge et al., 2016; Ford, Williams, &        of exposed bedrock or thin surficial sediment deposits starkly con-
King, 2018; Hartmann et al., 2014; Jarvie et al., 2014) and in‐stream       trasting the deep alluvial beds found in systems with predominant
(Ford, Fox, Pollock, Rowe, & Chakraborty, 2015; Ford, Williams, &           hyporheic zones (Fogle, Taraba, & Dinger, 2003; Ford & Fox, 2014;
King, 2018; Shore et al., 2017) that require long‐term data to capture      Husic, Fox, Agouridis, et al., 2017; Mellander et al., 2013). Recent
variability in environmental drivers (Mulholland & Hill, 1997; Pionke,      studies have highlighted the impact of the surficial fine‐grained lami-
Gburek, Schnabel, Sharpley, & Elwinger, 1999; Stow, Cha, Johnson,           nae, in both surface and phreatic conduit streambeds, on nutrient
Confesor, & Richards, 2015). The above information suggests that            attenuation and transient storage (Ford & Fox, 2014, 2015; Ford,
long‐term datasets that can distinguish upland input dynamics from          Fox, & Pollock, 2017; Husic, Fox, Ford, et al., 2017; Husic, Fox,
in‐stream nutrient fate are needed to improve nutrient management           Agouridis, et al., 2017). Less is known about the role of exposed bed-
in karst agroecosystems.                                                    rock streambeds in low‐gradient regions. Limited research in this area
     Regarding upland dynamics, recent advancements in techniques to        may stem from findings in steep‐gradient bedrock systems that have
quantify karst hydrologic pathways has led to a conceptualization of        shown less metabolic activity as compared with alluvial systems (e.g.,
karst drainage as a series of reservoirs characterized by quick, interme-   Argerich, Haggerty, Marti, Sabater, & Zarnetske, 2011; Gibson,
diate, and slow flow pathways (Husic, Fox, Adams, et al., 2019; Husic,      O'Reilly, Conine, & Lipshutz, 2015). Nevertheless, researchers have
Fox, Ford, et al., 2019; Rimmer & Hartmann, 2014). Quickflow in karst       recognized that in‐stream aquatic vegetation dynamics can influence
watersheds reflects short residence time water originating from sink-       transient storage and transformation of nutrients in exposed bedrock
holes, swallets, estavelles, and conduits (Pronk, Goldscheider, Zopfi,      streams and thus should be considered in management strategies
& Zwahlen, 2009; White, 2002). Intermediate flow pathways reflect           (Ensign & Doyle, 2006; Gibson et al., 2015; Hensley & Cohen, 2012).
moderate residence time and include recharge via soil macropores               Prevailing   aquatic    vegetative   controls    on   nutrients     in
and epikarst fractures (Tzoraki & Nikolaidis, 2007; Williams, 2008).        agroecosystem streams include autochthonous production of benthic
Slow flow pathways reflect longer residence times and convey water          algae and aquatic macrophytes, which has broadly led to their inclu-
via diffuse Darcian recharge and percolation through small, low‐            sion in existing surface water quality models (Chapra, Pelletier, &
permeability fissures in the epikarst (Ghasemizadeh et al., 2012;           Tao, 2008; Mebane, Simon, & Maret, 2014; Park & Clough, 2012;).
Mellander et al., 2013). Quantification of these pathway dynamics is        Vegetative nutrient dynamics in agroecosystem streams are often tied
now commonly performed using hydrograph separation techniques               to benthic vegetation as opposed to production in the water column
on flow time series (e.g., Husic, Fox, Adams, et al., 2019; Mellander       (Ford et al., 2017; Ford & Fox, 2014; Griffiths et al., 2012). Benthic
et al., 2013).                                                              aquatic macrophytes are rooted in streambed sediments and are thus
     Improved hydrologic characterization of karst watersheds has led       unlikely to exert a strong control on nutrients in scoured bedrock
to improved characterization of nutrient transport pathways. Nitrate        channels (Park & Clough, 2012). However, non‐rate‐limiting nutrient
concentration and subsequent leaching from the soil and epikarst zone       conditions, open canopies, shallow streams, and low light attenuation
have been found to control spring concentrations and loadings,              results in the proliferation of thick benthic algae mats, of temporally
whereas quickflow following storm events has been found to dilute           varied persistence, in the stream network (Ford & Fox, 2014; Griffiths
concentrations relative to groundwater aquifer sources (Baran,              et al., 2012; Hotchkiss & Hall, 2015). These findings would tend to
Lepiller, & Mouvet, 2008; Husic, Fox, Ford, et al., 2019 and references     suggest that the prevalence of assimilatory and dissimilatory processes
within). Conversely, dissolved reactive phosphorus (DRP) has been           may be mediated by the presence of algal biomass in scoured bedrock
found to be more concentrated in quickflow than in intermediate             channels. Assessing these perceptions in karst agroecosystems is crit-
and slow flow pathways, stemming from agricultural management               ical given that karst drainages provide thermal buffering, have low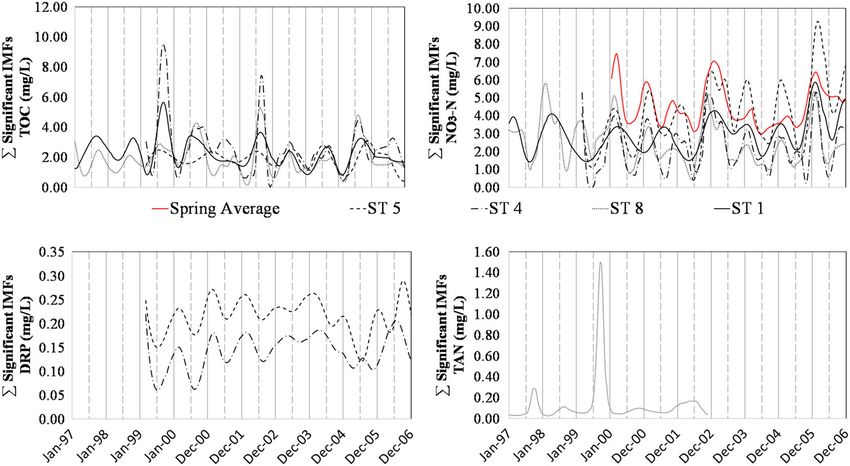
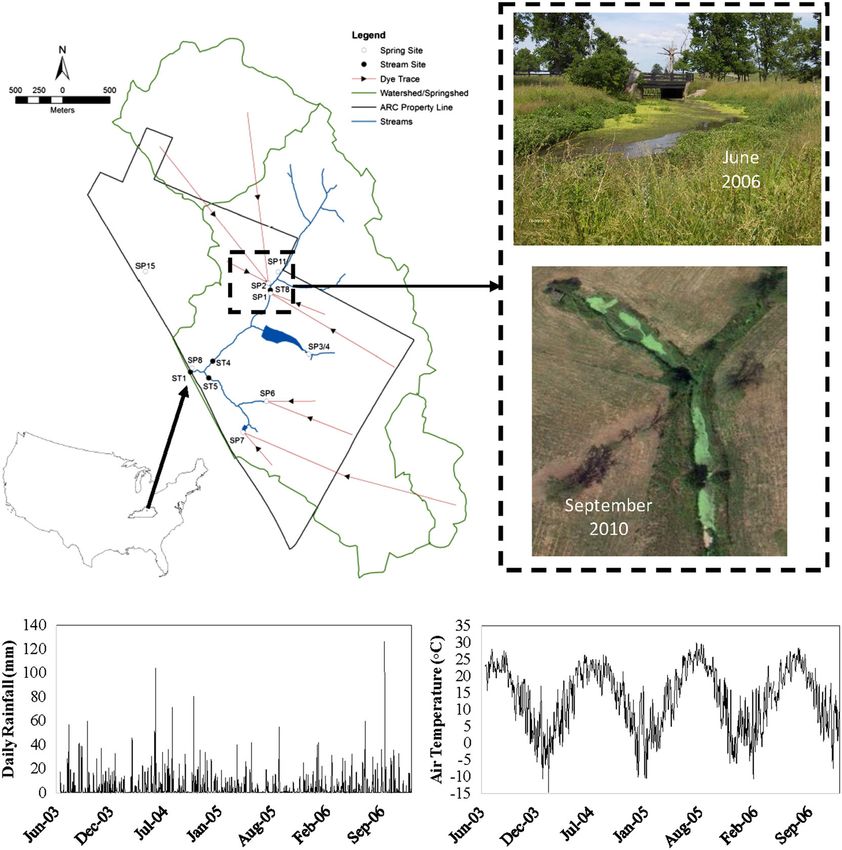
1612                                                                                                                                   FORD   ET AL.

dissolved oxygen at low‐flows, and deliver high nutrient loads that        (c) assess the fate of nutrients in bedrock‐controlled surface streams
stimulate in‐stream biochemical reactivity (Dirnböck, Kobler, Kraus,       draining karst agroecosystems.
Grote, & Kiese, 2016; Husic, 2018; Husic, Fox, Adams, et al., 2019;
Husic, Fox, Ford, et al., 2019; Jiang, Hu, & Schirmer, 2013; Knierim,
Pollock, Covington, Hays, & Brye, 2017; Mahler & Bourgeais, 2013).         2     |       METHODS
   This study aims to quantify hydrologic and in‐stream aquatic vege-
tation controls on nutrient dynamics in a karst agroecosystem water-       2.1       |   Study site
shed through analysis and statistical modelling of long‐term
hydrologic and water quality data. Specific objectives of this study       To meet the objectives of this study, the Camden Creek watershed
were to (a) assess spatiotemporal dynamics of nutrients in a karst         (Figure 1) was selected as the study site. Camden Creek drains a large
agroecosystem using long‐term measurements from nested spring              portion of the University of Kentucky Animal Research Center (ARC)
and stream sites, (b) quantify flow and nutrient pathway dynamics in       farm and lies within the Inner‐Bluegrass physiographic region of cen-
a karst watershed and assess their influence on nutrient loading, and      tral Kentucky. The region is characterized by a temperate Midwestern

FIGURE 1 Watershed delineation, site locations, imagery, and weather data from the Camden creek watershed in central KY, USA. The inner
polygon represents the surface watershed delineation for Camden Creek, and the outer polygons reflect additional spring shed drainage areas
to sinkholes connected to the Camden Creek Watershed. Spring (SP1, SP2, SP3/4, SP6, SP7, SP8, and SP11, and SP15) and in‐stream (ST1, ST4, ST5,
and ST8) sampling locations are identified. Site images show prevalence of floating aquatic macrophytes (primarily duckweed) to persist during the
growing season. The top image is a picture from June 2006, and the bottom image was obtained from Google Earth and was taken September
2010. The bottom charts show temperature and rainfall data collected at a NOAA gauging station located within the ARC farm from June 2003 to
June 2006 (overlapping with nutrient data collected in this study)
FORD   ET AL.                                                                                                                                       1613

U.S. climate with four distinct seasons including moderately cold win-        (Keagy et al., 1993), thus limiting erosion and transport of sediment to
ters, warm and humid summers, and moderate transition periods in              the stream. For this reason, we did not explicitly consider the role of
spring and fall (see Figure 1). Average annual rainfall monitored at          fluvial sediment deposits to influence nutrient processes in this study.
                                                                        −1
the ARC from June 2003 to December 2006 was 1,253 mm year ,
and average annual temperature was 13.3°C.
   The watershed is characterized by broad, shallow sinkholes; low‐           2.2   |   Data collection and laboratory analysis
relief, broad valleys and ridges; sparse rock outcrops, and thick, fertile,
phosphatic Ordovician limestone; and shale‐residual soils, typical of         Data collection was conducted at both stream (ST) and spring (Sp)
the region. The USDA soil classification of the ARC shows predomi-            locations in the watershed. Monitored stream sites included ST1
nantly Hagerstown and Maury silt loam soils. Soil depths vary from            (watershed outlet), ST5 (major tributary draining into the main stem),
less than 1 m on valley walls to 5 m on ridge tops. The hydrogeology          ST4 (main‐stem site that was upstream of the confluence of the main
of the study site has been previously characterized (Keagy, Dinger,           stem with ST5), and ST8 (upstream boundary of the main stem). Sev-
Fogle, & Sendlein, 1993), and we briefly summarize key components.            eral spring sites were monitored both within the Camden Creek
The study area is almost entirely underlain by Ordovician‐age rocks,          watershed (Sp1, Sp2, Sp3/4, Sp6, Sp7, Sp8, and Sp11) and outside of
predominantly Lexington limestone with nearly horizontal strata.              the watershed boundary but within the ARC farm (Sp15; Figure 1).
Limestone members include (in descending order) Devils Hollow,                   Grab sampling began in October 1996 and was conducted through
Tanglewood, Brannon, and Grier, with most soils having formed over            June 2007. Unpreserved samples were collected for NO3− in 250‐ml
the Tanglewood member. The regional water table exists within the             amber glass bottles. A secondary unpreserved DRP split was collected
Grier member, and perched aquifers have been observed from well               in 125‐ml polyethylene bottles. Preserved (H2SO4) samples were col-
nests both above the bedrock surface and within the Grier member.             lected in 250‐ml clear glass bottles for total ammoniacal‐N (TAN)
   Fourteen springs have been identified on the ARC, including                and total organic C (TOC). All samples were placed on ice immediately
ephemeral (n = 9), local perennial (n = 3), and regional perennial            following sampling and were delivered to the labs within 6 hr of col-
(n = 2) springs (Keagy et al., 1993). Dye traces were conducted in            lection. The DRP split was filtered prior to delivery to the lab. Samples
the watershed on regional perennial springs and highlight sinkhole            were then refrigerated prior to analysis and were analysed within
connectivity to create a cumulative watershed drainage area of                standard preservation windows. Regarding laboratory analysis, NO3−,
1,069 ha, which extends well beyond the surface watershed drainage            TAN, and TOC were analysed in the Kentucky Geological Survey lab-
area of 771 ha (Keagy et al., 1993; Reed, McFarland, Fryar, Fogle, &          oratory. A 50‐ml split from the 250‐ml amber glass bottle was filtered
Taraba, 2010; Figure 1). Heterogeneity in karst conduit maturity has          and analysed on a Dionex Ion Chromatograph for NO3− within 48 hr
been previously documented in the region (e.g., Mahoney, Fox, & Al            of sample collection. TOC was analysed by a UV peroxide instrument
Aamery, 2018; Reed et al., 2010). We classify the Camden Creek                by Phoenix on the unfiltered H2SO4 preserved sample within 28 days.
watershed to have immature karst as compared with other basins in             TAN was determined by filtering a 50‐ml split of the H2SO4 preserved
the region. For example, Reed et al. (2010) highlighted that a regional       sample, adjusting the pH between 9 and 11 and analysing for NH3‐N
spring less than 5 km away, draining a similar area to the Camden             colorimetrically using a UV Vis spectrometer by Varian within 28 days
Creek watershed, had more complex architecture and a resurgent                of sample collection. Orthophosphate (DRP) was determined colori-
stream channel, contrasting regional springs in Camden Creek. Fur-            metrically at 630 nm for a 1‐ml filtered split within 28 days of sample
ther, the abundance of local ephemeral springs that drain in upper por-       collection (D'Angelo, Crutchfield, & Vandivere, 2001).
tions of the epikarst, as opposed to connecting to deeper conduits at            The silt–loam soil texture and abundance of sinkholes at the study
the regional level, suggests less developed karst conduit architecture,       site promoted streamflow to be predominantly initiated by spring dis-
broadly, in the watershed.                                                    charge from the 14 spring sites at both low and high flow conditions,
   During the timeframe of this study, portions of the ARC were used          hence annual nutrient fluxes from springs were a large fraction of
for precision and site‐specific agriculture operations, as well as            watershed fluxes. We aimed to compare upland spring contributions
tobacco, row crops, small grains, and animal research plots. Both             of nutrients with fluxes at stream monitoring stations to identify the
organic and inorganic fertilizers were applied to the crop production         influence of in‐stream processes. Spring sites were generally sampled
systems throughout the monitoring period. Tobacco received both N             once every 4 weeks, and stream sites were sampled biweekly. TOC
and P inorganic fertilizer sources whereas the other row crops (e.g.,         and TAN were collected at all stream sites throughout the monitoring
maize) were side‐dressed with inorganic N. Surrounding landscapes             period but only at Sp2 and Sp6 from 1997 to 1999. Long‐term records
were predominantly horse pasture with some sparse residential devel-          from the spring sites were primarily from the local perennial and local
opment. The streams at the ARC are shallow, flow over limestone bed-          ephemeral systems (Sp1, Sp3/4, Sp6, Sp8, Sp11, and Sp15) reflecting
rock with limited sediment deposits, and are generally unshaded with          the wide range of variability in spring nutrient inputs on the farm.
some riparian vegetation (Fogle et al., 2003). Sediment storage in the        The regional perennial springs (Sp2 and Sp7) were sparsely monitored
streambed is low with most of the bedrock exposed. Low storage of             directly due to logistical issues of monitoring at the spring orifice. The
sediment in the streambed likely reflects flow pathways because most          ephemeral nature of many of the monitored springs resulted in peri-
stormflow enters the streams via springs as opposed to overland flow          odic discontinuities in the individual spring datasets, limiting the ability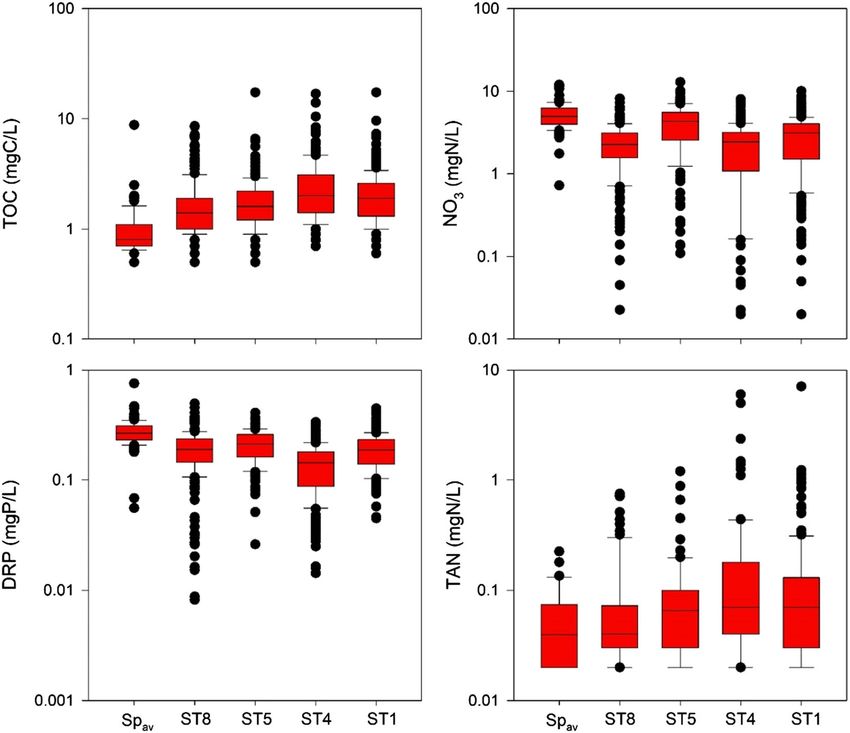
1614 FORD ET AL.
to perform time‐series analysis on each. Local ephemeral springs were Time‐series analysis was used to elucidate information on statisti-
typically activated during stormflow and recession of perched aquifers cally significant trends in the nutrient species. Given that the dataset
in the vadose zone. Local perennial springs breached confining layers was collected biweekly to monthly, over a decade, we expected statis-
via sinkholes, allowing perched aquifers to drain at a more regional tically significant fluctuations to reflect prevailing seasonal fluctua-
level and hence flowed year‐round (Keagy et al., 1993). Flowrate from tions of spring and in‐stream dynamics. Empirical mode
each contributing spring was not available to perform flow weighted decomposition (EMD) was selected as the preferred method for the
averaging. Nevertheless, upon initial investigation, we found that analysis because the method is purely empirical (i.e., does not use pre-
visual time series of maximum, minimum, and averaged nutrient con- scribed oscillating functions), can be applied to a wide class of signals,
centrations for spring sites displayed analogous temporal dynamics and can be used as an a posteriori approach, which is ideal for an
(e.g., seasonal variability). In order to generate a continuous dataset exploratory analysis (Ford et al., 2015; Ford, Williams, & King, 2018;
of composite spring contributions from the watershed and subse- Huang et al., 1998; Wu, Huang, & Peng, 2007). EMD was conducted
quently make downstream comparisons, we averaged values from utilizing a six‐step iterative procedure as summarized in Ford et al.
spring sites on days that spring data was available (Spav). Because a (2015) in which a dataset is decomposed into a series of intrinsic mode
large proportion of the springs were monitored, it is reasonable to functions (IMFs) and a residual term. IMFs are a finite series of
use the central limit theorem to approximate the composite spring amplitude‐ and frequency‐modulated, oscillatory functions. The low-
nutrient concentrations for the watershed by averaging the individual est frequency IMF is identified as the base trend, and the highest fre-
spring contributions at a given point in time (Olkin, Gleser, & Derman, quency IMF is considered noise for well‐sampled datasets (Wu et al.,
1994). 2007). We compiled a previously published code in Matlab R2016a
Flowrate was monitored at ST1 from October 1996 through Sep- that performs EMD and generates IMFs for each site (Rato, Ortigueira,
tember 2006 using an ISCO 4220 Flow Meter with a submerged pres- & Batista, 2008). We performed statistical significance evaluations to
sure transducer. From October 1996 through August 2003, depth (d) test the hypothesis that IMFs of the dataset were different from white
upstream of a broad‐crested weir was used to estimate flowrate noise IMFs. Statistically significant trends were determined visually by
(Equation 1) per the Teledyne flow measurement handbook equation variance–frequency plots in which IMFs with variance greater than
for a broad crested weir. three times the standard deviation for noise at a particular frequency
were identified as significant trends (see Ford et al., 2015). A further
1:5
Q ¼ −4:769d þ 49:299d ; (1) explanation of the method is detailed elsewhere (e.g., Ford et al.,
2015; Wu et al., 2007; Wu & Huang, 2004). Statistically significant
3 −1 IMFs with frequencies between 0.7 and 1.3 years were considered
where Q was volumetric flowrate (ft s ), and d was the depth (ft). In
September 2003, a 120° V‐notch weir was installed at ST1. Flow was seasonal IMFs because fluctuations may not have been pronounced
estimated using a piecewise function considering flow below (Equa- in some years (frequency > 1 year) or may have multiple maxima and
tion 2) and above (Equation 3) the top of the weir plate. minima in a year (frequency < 1 year).
Q ¼ 4:330d2:5 if d < 1 ft; (2)
2.4 | Multiple linear regression analysis
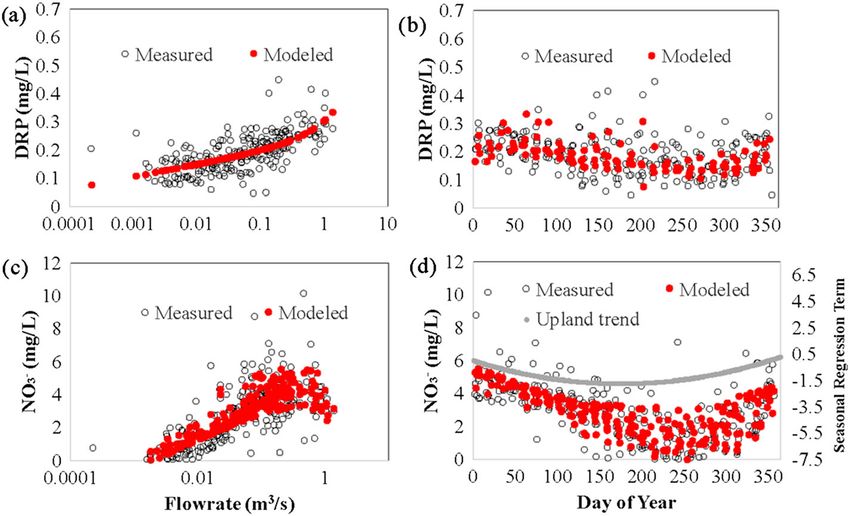
Q ¼ 4:330 þ 46:62 ðd−1Þ1:5 if d > 1 ft: (3) Given the importance of downstream NO3− and DRP transport, we
performed multiple linear regression (MLR) modelling using presumed
important drivers of nutrient dynamics to create a continuous predic-
2.3 Exploratory statistical analysis of 10‐year
| tive model of load estimates. MLR was performed on the average
nutrient dataset spring (Spav) and watershed outlet (ST1) datasets. In terms of indepen-
dent variables in the MLR, seasonal fluctuations in environmental
Nonparametric statistical tests and exploratory visual statistical plots parameters (e.g., atmospheric variables and soil properties) and
were utilized to compare nutrient datasets between stream monitor- precipitation‐driven hydrologic variability have been identified as key
ing stations and the averaged spring dataset. Box‐and‐whisker plots factors controlling nutrient concentrations in agroecosystem water-
were used to visualize distributions and were generated in SigmaPlot sheds (Ford, Williams, & King, 2018 and references within; Sinha,
13 (Systat Software, Inc). Given the skew of the data, y‐axes were Michalak, & Balaji, 2017). Seasonal maxima and minima often show
plotted on a log scale, and nonparametric statistical tests were hysteresis from common predictors such as temperature, light avail-
performed using SigmaStat 13. Specifically, the nonparametric ability, pH, and dissolved oxygen (e.g., Ford et al., 2015; Ford & Fox,
Kruskal–Wallis one‐way analysis of variance test was utilized to deter- 2014; Ford, Williams, & King, 2018). Upon initial investigation, we
mine statistically significant (α = 0.05) differences in median values found a power relationship between day of year and NO3− concentra-
between groups. For parameters with significant differences between tion at spring sites, which reflects previously reported timing of sea-
groups, a post hoc test using Dunn's method was performed to com- sonal source nutrient concentration dynamics in temperate
pare significant differences between data pairs. agroecosystems (Ford, Williams, & King, 2018). Day of year was used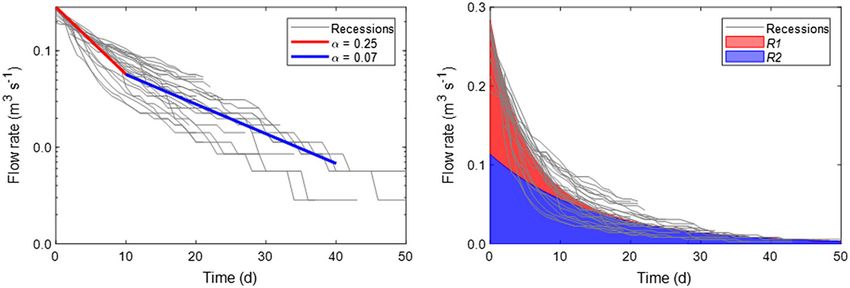
FORD     ET AL.                                                                                                                                                        1615

as a response variable to account for the presence or absence of the                             a continuous time series of discharge, providing a tool to assess tem-
upland seasonal trend. Regarding hydrologic impacts, we anticipated                              poral loading dynamics from each reservoir.
both log–linear relationships (Schilling & Lutz, 2004) and linear rela-                             Forty‐one recessions with a duration of at least 15 days were iden-
tionships (e.g., Zheng et al., 2015) between flowrate and nutrient con-                          tified during the 10‐year study period. Of the 41 recessions, 33 were
centrations. Given the multiple descriptors, we performed an MLR                                 used to generate the master recession curve. The eight discarded
with the following structure for all nutrient species:                                           recessions were either (a) primarily comprised of days with zero flow
                                                                                                 (i.e., no flux) or (b) had nonlinear reservoir recessions likely associated

         i; j       i; j   i; j          i; j               i; j         i; j
  Cpre          ¼ β0 þ β1 *Q þ β2 * lnðQÞ þ β3 *Day þ β4                        * Day2 ;   (4)   with later rainfall disrupting the initial recession. Thereafter, the 33
                                                                                                 individual recessions were organized such that they aligned to create
where, β's were the regression coefficients, i was the nutrient species,                         a single, master recession using the RC 4.0 software (HydroOffice;
j was the site identifier (either Sp or ST1), Cpre was the predicted nutri-                      Malík & Vojtková, 2012). The y‐axis was changed to a logarithmic
ent concentration, Q was the flowrate at the watershed outlet, and                               scale, and distinct linear segments of the master recession curve were
Day was the day of year (ranging from 1 to 365). The regression anal-                            identified. Recession coefficients (α) were then manually calibrated to
ysis was performed in Matlab R2016a using the built‐in MLR analysis                              generate the best‐fit solution of discharge reservoirs to the master
function (fitlm). The procedure identified coefficients that provided a                          recession curve. Lastly, the areas under the quickflow and slow flow
“best fit” linear model and provided a suite of statistical data. Specifi-                       curves were integrated to calculate the approximate contribution of
cally, we used the F statistic to test the null hypothesis that individual                       each pathway to net water drainage.
coefficients were not equal to zero and the null hypothesis that the                                A master recession curve is useful for identifying drainage reser-
overall MLR model provided a superior fit to a mean trend. The p                                 voirs, quantifying long‐term contributions from dynamic transfer
values were calculated for the F statistics in both hypothesis testing                           zones, and estimating recession coefficients for modelling purposes.
scenarios, and significance results for p < 0.10, p < 0.05, p < 0.01,                            However, the master recession curve does not provide a continuous
and p < 0.001 were provided. Acceptance of the null hypothesis                                   time‐series estimate of flow contribution from each reservoir. To
occurred for p < 0.10. If individual parameters were found insignifi-                            address this problem, individual hydrograph separation was performed
cant, they were removed from the MLR, and the regression was rerun                               for each storm event during the 10‐year study period. Hydrograph
until all parameters were significant and the overall model was                                  separation was performed with the following steps: (a) a “storm event”
significant.                                                                                     was first defined as a period of hydrologic activity resulting in a rapid
                                                                                                 increase in discharge, followed by a gradual recession that ends when

2.5      |      Pathway loading analysis                                                         the next spike in flow was observed; (b) a linear increase in slow flow
                                                                                                 was assumed from the beginning of the rising limb of the hydrograph
We conducted a loading analysis to quantify the relative importance                              to the inflection point on the falling limb, and this point signifies the
of flow pathways and in‐stream processes for watershed nutrient                                  end of quickflow (Husic et al., 2019a); and (c) event contribution by
loading. Loads were estimated for nitrate and DRP at ST1 and Spav                                each pathway was calculated as the area between two curves.
using continuous flow data and regression‐predicted concentration
values as follows:
                                                                                                 2.6   |   In‐stream vegetation dynamics
                                  i; j
                            Load ¼        ∑nt¼1 Qt ST1 Cpre−t i; j Δt;                     (5)
                                                                                                 We aimed to assess the perception that autotrophic algal biomass
where Load is the mass loading (kg), t is the time index, n is the number                        dynamics controlled in‐stream nutrient fate in the bedrock‐controlled
of timesteps in the analysis, and Δt is the timestep. Although our focus                         streambed. Recent modelling and isotope monitoring approaches have
for the pathway analysis was on loadings at ST1, we used loadings                                shown newly fixed autochthonous C may have short residence time
estimated with Spav regression results for the in‐stream fate analysis                           due to respiration or organic matter exudation resulting in regenera-
described in Section 2.6.                                                                        tion of available nutrients to the stream channel or have longer‐term
   To estimate the contribution of flow pathways to nutrient loading                             storage in algal biomass that is subsequently subjected to downstream
dynamics, we multiplied the load from the regression model at ST1 by                             export due to hydraulic scour and sloughing (Ford & Fox, 2014;
the fraction of flow from karst reservoir pathways, which were esti-                             Hotchkiss & Hall, 2015). Although we did not have measurements or
mated continuously using hydrograph separation. In lieu of event‐                                modelling of algae mass transfer dynamics from the Camden Creek
based high‐resolution data, we were unable to perform a loadograph                               watershed, previously published modelling results of algae C dynamics
recession (e.g., Husic, Fox, Adams, et al., 2019; Mellander et al.,                              in the nearby South Elkhorn watershed were used to estimate fluxes
2013); however, given the longevity (10 years) of data collected during                          on a monthly basis (Ford & Fox, 2014). Briefly, the previously pub-
a wide array of hydrologic conditions, we were able to perform                                   lished algae growth and decomposition model (Ford & Fox, 2014;
hydrograph separation. Specifically, we developed a master recession                             Rutherford, Scarsbrook, & Broekhuizen, 2000) estimates C fixation
curve to identify and assess prominent pathway reservoirs. Thereafter,                           (gC m−2 day−1) as a function of light, temperature, and population sat-
we performed hydrograph separation of all individual events to create                            uration limitations, estimates biochemical losses (gC m−2 day−1) using a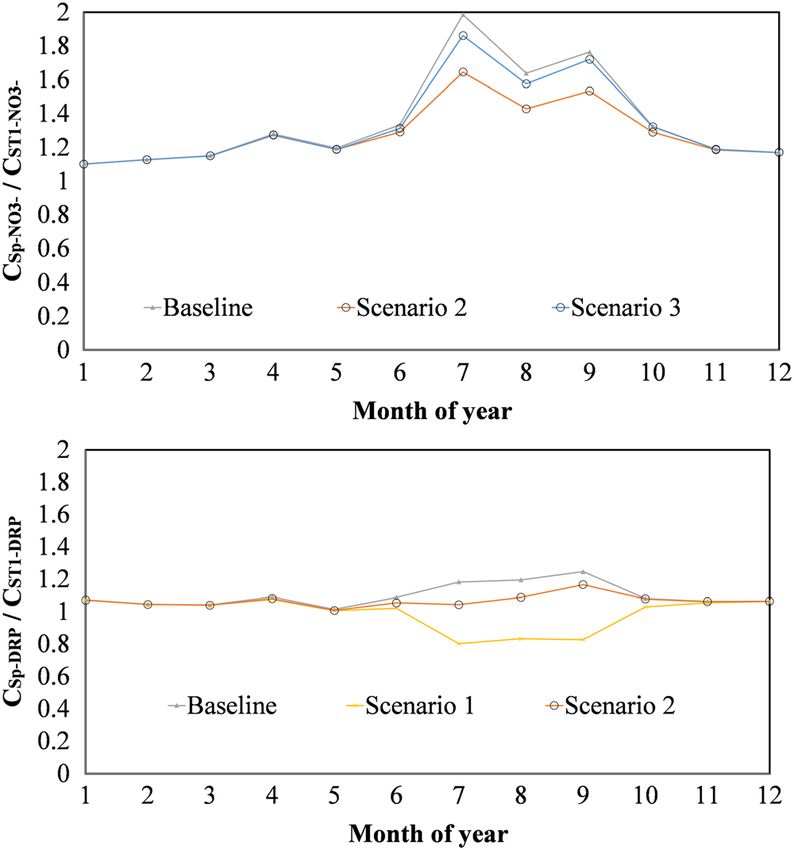
1616                                                                                                                                      FORD   ET AL.

calibrated first‐order equation that varies as a function of temperature     organic matter exudates as dissolved organic matter (i.e., dissolved
(Rutherford et al., 2000), and estimates downstream export (gC m             organic carbon, dissolved organic nitrogen, and dissolved organic
−2
     day−1) as a result of physical scouring of algal biomass. The bio-      phosphorus were regenerated to the stream channel). Scenario 2
chemical loss term is assumed to encompass losses associated with            assumed that all algae biochemical losses were a result of respiration
direct heterotrophic respiration of detrital material, endogenous respi-     or that organic excretions were rapidly mineralized to ammonium
ration, and leaching of algal exudates; hence, the fate and partitioning     and DRP without nitrification occurring (i.e., TAN and DRP were
of this lumped pool is uncertain and is addressed using a scenario anal-     regenerated to the stream channel). Scenario 3 was the same as Sce-
ysis described below. Although the model also explicitly accounts for        nario 2, except we assumed that all TAN was subsequently nitrified
heterotrophic organic matter breakdown and processing of the partic-         within the stream channel (i.e., NO3− and DRP were regenerated to
ulate detrital algal pool, these fluxes were found to be insignificant for   the stream channel). Although these scenarios represent extreme con-
dissolved nutrient considerations and hence were not included to sim-        ditions, they provided a spectrum of potential fates for biochemical
plify the analysis. Detailed information regarding inputs, parameteriza-     losses for N and P.
tion, and model evaluation are provided in Ford and Fox (2014).
     We utilized reach‐averaged results from a 5‐year (January 2006
through December 2010) model simulation in the South Elkhorn                 3     |       RESULTS
watershed. Specifically, we used estimates of C fixation by algae, bio-
chemical losses from the algal pool to the stream water, and down-           3.1       |   Exploratory analysis of the 10‐year dataset
stream export. Results from the model were composited on a
monthly basis to account for annual variability in processes (e.g., wet      The importance of in‐stream production of TOC and TAN and removal
vs. dry summers), which enabled direct comparison with monthly aver-         of NO3− and DRP are recognized by the visual box and whisker plots
aged differences between the spring and watershed outlet load esti-          and statistically significant differences from the spring inputs to down‐
mates. Because the model predictions estimate C fluxes, we used a            gradient stream sites (Table 1 and Figure 2). Generally, we found sta-
typical C:N:P ratio for algal biomass (40:7.2:1) and assumed biochem-        tistically significant increases of TOC and TAN and decreases of DRP
ical processes had analogous stoichiometry, which is assumed in other        and NO3− from upstream springs (Spav) to downstream (ST1, ST4, ST5,
algal nutrient models (Chapra et al., 2014).                                 and ST8) locations. As well, we found that increasing drainage areas
     To assess if benthic algae fluxes could help inform differences         for stream sites resulted in increasing TOC and TAN and decreasing
between loads from ST1 and Spav, we compared the ratio of monthly            DRP and NO3−. However, some exceptions were observed, for
flow‐weighted concentrations for the baseline regression model with          instance when comparing ST4 and ST8 of NO3− or comparing ST1 with
several hypothetical scenarios. The ratio was quantified as follows:         ST8 for DRP in which significant median differences were not
                                                                             observed between sites. These deviations are likely associated with
                     CSpav CSpav *Q Load Spav                                source mixing of two tributaries or a lack of in‐stream influence during
                          ¼        ¼          :                        (6)
                     CST1   CST1*Q   Load ST1                                median flow conditions.
                                                                                 Statistically significant IMFs from the EMD were primarily
If the ratio was equal to one, this signified that spring concentrations     governed by seasonal trends and provided insight into timing of sea-
(and loading) were equal to that of the watershed outlet (i.e., conser-      sonal maximum and minimum nutrient concentrations (Table 2;
vative transport with no additional inputs). If the ratio was greater        Figure 3). For TOC, NO3−, and TAN, all stream datasets had statisti-
than one, the spring contributions were either diluted by another flow       cally significant seasonal IMFs. For DRP, only ST4 and ST5 had signif-
source (e.g., overland flow) or nutrients were attenuated within the         icant seasonal fluctuations. Regarding seasonality of Spav for TAN and
stream channel resulting in higher nutrient concentrations at the            TOC, insufficient length of data was available to perform EMD. How-
spring than at the watershed outlet. If the ratio was less than one,         ever, data were available throughout at least one full calendar year,
the spring contributions were either mixed with a concentrated source        and variability for both parameters were low relative to stream sites;
or net nutrient regeneration occurred within the stream channel              hence, seasonal variability was not expected to be prominent
resulting in lower concentrations at the spring relative to the water-       (Figure 2). Spring DRP and NO3− concentrations had sufficient data
shed outlet. Because the Spav concentrations were arithmetic averages        for EMD analysis, and we found significant seasonality for NO3− but
of all springs on the site, we did not expect values to equal 1; however,    not for DRP (Table 2). Regarding timing of maxima and minima, TOC
we did anticipate relatively stable ratios throughout the year if nutri-     and TAN generally were maximum in summer (July–September) and
ents behaved conservatively in the channel.                                  minimum in winter (January–March). Similar to findings in Figure 2,
     Because the algae growth and decomposition model did not explic-        NO3− and DRP IMFs (Figure 3) showed inverse relationships to TOC
itly simulate organic and inorganic N and P fate following leaching or       and TAN in which maximums generally occurred in winter (January–
respiration from the algal pool, we ran three hypothetical scenarios         March) and minimums generally occurred in summer (July–Septem-
for fate of the biochemical loss pools and adjusted the spring loadings      ber). Of note was the seasonal NO3− IMF for the Spav data, which
accordingly to investigate potential changes in Equation 6. Scenario 1       had analogous timing to stream sites for maximum concentrations
assumed all algae biochemical losses were associated with excretion of       (January–March) but differed for minimum concentrations and
FORD   ET AL.                                                                                                                                          1617

TABLE 1 Statistical significance test results comparing nonparametric distributions of stream sites and average spring values was performed
using the Kruskal–Wallis one‐way analysis of variance with a post hoc multiple comparison procedure using Dunn's test

 Kruskal–Wallis one‐way analysis of variance on ranks

 Nutrient                    TOC                         DRP                         NO3−                       TAN

 p value
1618                                                                                                                                    FORD   ET AL.

FIGURE 2 Box and whisker plots of nutrient concentration data from stream sites (ST1, ST4, ST5, and ST8) and the average spring values (Spav).
Boxes show the inner‐quartile range (25th and 75th percentiles) and median (50th percentile) values, whereas whiskers show 5th and 95th
percentile values. Values greater or less than 5th and 95th percentiles are included as points

vadose zone nutrient concentrations to influence watershed nutrient        consistent with the timing of minimum values in the EMD analysis
concentrations in the study watershed (Figure 4). Generally, we found      for the stream sites.
that the positive log–linear relationship between flowrate and DRP
controlled at low flows (
FORD   ET AL.                                                                                                                                               1619

TABLE 2 Frequency (years) of statistically significant intrinsic mode functions (IMFs) from the empirical mode decomposition analysis of mon-
itoring sites

 Parameter                                  Spav                            ST1                             ST4             ST5             ST8

 Total organic carbon                       N/A                             1.19                            0.61            1.38            0.83
                                                                            1.79                            1.10                            1.26
                                                                            3.58                            1.65                            1.95
                                                                            5.38                            5.5                             3.58
                                                                                                                                            5.38
 Dissolved reactive phosphorus              No significant IMFs             No significant IMFs             0.97            0.97            No significant IMFs
                                                                                                            2.75            2.75
                                                                                                            4.13            4.13
 Nitrate                                    0.68                            1.26                            0.59            0.93            0.72
                                            1.18                            2.69                            1.34            1.85            1.19
                                            2.17                                                            1.83            3.33            1.65
                                            4.33                                                            2.75                            2.69
                                                                                                            5.5
 Total ammoniacal nitrogen                  N/A                             1.20                            N/A             N/A             N/A

Note. Statistically significant trends were determined visually by variance–frequency plots in which IMFs with variance greater than three times the stan-
dard deviation for noise at a particular frequency were identified as significant trends (see Ford et al., 2015). Residual long‐term trends are not included in
this table because the timescale of their fluctuations are unknown but are reflected in the sum of statistically significant fluctuations in Figure 3. N/A is used
for sites where the specified constituent was not measured.

FIGURE 3 Results of the empirical mode decomposition (EMD) time‐series analysis showing statistically significant intrinsic mode functions
(IMFs) for Spav, ST1, ST4, ST5, and ST8 sites. Results are provided for a 10‐year span from January 1, 1997 to December 31, 2006. Not all data
sets were obtained for a long enough record for time‐series analysis (e.g., total organic carbon [TOC] and total ammoniacal‐N [TAN] at spring sites
were collected for 2 years). Solid lines represent the beginning of the year (January 1), and dashed vertical lines represent the middle of the year
(July 1). Note the EMD analysis of Spav are only shown for 2000–2006 because data was collected at a biweekly temporal resolution for some
springs prior to 2000

loadings from R1 and R2 generally followed the same seasonal trends                phosphorus was associated with R1 and 70% with R2. Contrasting
as flowrate; however, the fractional contribution of NO3− from R1 was              NO3−, this result showed that R1 had higher flow‐weighted DRP con-
consistently less than the fractional contribution of R2, suggesting               centrations as compared with R2.
lower flow‐weighted concentrations of NO3− from R1. On average,
we estimate a load of 9.64 kgN day−1 from R1 and 40.85 kgN day−1                   3.4    |   In‐stream vegetation scenarios
from R2. As a result, nearly 20% of nitrogen was associated with R1
and 80% with R2. Regarding DRP, we found a load of 1.11 kgP day−1                  Application of stoichiometric relationships to the algal C model from
from R1 and 2.69 kgP day−1 from R2. As a result, nearly 30% of                     the neighbouring stream highlight the importance of algal dynamics
1620 FORD ET AL.
TABLE 3 Results of the multiple linear regression analysis. Values uptake, peak biochemical losses occurred in September. Scouring of
denote estimates with standard error in parenthesis algal biomass was steadier throughout the year, but still was a maxi-
Spring DRP NO3 − mum in summer with peak values occurring in July.
Results of the baseline loading scenario (i.e., regression model
β0 0.21 (0.02)**** 5.3 (0.60)****
results) show that ratios of Spav to ST1 concentrations are slightly
β1 (Q) 0.14 (0.03)**** 1.7 (0.87)a*
greater than one in winter (reflecting either a systematic bias due to
β2 (ln(Q)) −9.1*10−3 (5.5*10−3) −0.22 (0.15) arithmetic averaging or an additional diluted flow source), but the larg-
β3 (Day) 1.8*10−4 (2.3*10−4) −0.01 (6.4*10−3)** est deviations are observed in spring and summer, coinciding with
β4 (Day2) −3.9*10−7 (5.9*10−7) 3.9*10−5 (1.6*10−5)** peak values of algal transformations. During nonsummer months, Spav
Stream DRP NO3 − concentrations were found to be higher than ST1 for NO3− (10–30%)
and DRP (1–8%). One potential explanation for this is that, per our
β0 0.24 (0.01)**** 7.3 (0.29)****
method, we used arithmetic as opposed to flow‐weighted averages
β1 (Q) 0.07 (0.02)*** −2.26 (0.45)****
(in absence of flow measurements at all springs) that may bias the
β2 (ln(Q)) 0.02 (3.4*10−3)**** 0.77 (0.07)****
results either towards high or low nutrient concentrations. In our case,
β3 (Day) −1.1*10−4 (1.4*10−4) −0.02 (2.9*10−3)**** we surmise this would be attributed to biasing towards higher concen-
β4 (Day2) 3.1*10−7 (3.6*10−7) 5.7*10−5 (7.5*10−6)**** trations from smaller springs. A second explanation is that additional
flow sources (e.g., wet weather seeps, lateral subsurface flow, or over-
Note. For predictive modelling purposes, parameters with p valuesFORD ET AL. 1621
FIGURE 5 Master recession curve constructed from 32 recessions over 10 years of flow at ST1. The master recession curve was decomposed
into two linear drainage reservoirs: R1 (α = 0.25) and R2 (α = 0.07). The area shaded in red is associated with quick and intermediate flow whereas
the area shaded in blue is associated with slow flow
TABLE 4 Seasonal breakdown of hydrologic and nutrient fluxes and pathways for the Camden Creek Watershed
Season QST1 (m3 s−1) QR1 (m3 s−1) QR2 (m3 s−1) fQ‐R1 fQ‐R2
Winter (Jan–Mar) 0.30 0.07 0.23 24% 76%
Spring (Apr–Jun) 0.20 0.04 0.16 21% 79%
Summer (Jul–Sep) 0.06 0.02 0.04 34% 66%
Fall (Oct–Dec) 0.15 0.04 0.11 26% 74%
−1 −1 −1
Season NO3ST1 (kgN day ) NO3R1 (kgN day ) NO3R2 (kgN day ) f NO3‐R1 f NO3‐R2
Winter (Jan–Mar) 94.95 18.63 76.32 20% 80%
Spring (Apr–Jun) 43.48 5.61 37.87 13% 87%
Summer (Jul–Sep) 7.80 1.88 5.92 24% 76%
Fall (Oct–Dec) 55.74 12.44 43.30 22% 78%
−1 −1 −1
Season DRPST1 (kgP day ) DRPR1 (kgP day ) DRPR2 (kgP day ) fDRP‐R1 fDRP‐R2
Winter (Jan–Mar) 5.92 1.69 4.23 29% 71%
Spring (Apr–Jun) 4.61 1.37 3.24 30% 70%
Summer (Jul–Sep) 0.71 0.20 0.51 28% 72%
Fall (Oct–Dec) 3.97 1.18 2.78 30% 70%
year. Regarding NO3−, Scenarios 1 and 2 reflected the most extreme reflecting a mixture of quick and intermediate flow paths. Our imma-
conditions and still resulted in concentrations that were 43–65% ture karst watershed had two distinct log–linear regions in the master
higher for Spav as compared with ST1. Results from Scenario 3 (which recession curve (Figure 5), suggesting drainage of two distinguishable
was most realistic for DRP) resulted in NO3− concentrations upwards hydrologic reservoirs. For context, we compare with a mature karst
of 80% higher for Spav as compared with ST1. This result suggests system 21 km from our study watershed (Royal Spring basin). For
alternative removal mechanisms in the stream channel or adjacent Royal Spring, three distinguishable hydrologic reservoirs were identi-
riparian corridor for N dynamics that cannot be accounted for by algal fied in the master recession curve, with coefficients of 0.50, 0.15,
biomass dynamics alone and will be highlighted in the discussion and 0.05 day−1 reflecting the quick, intermediate, and slow flow paths,
section. respectively (Husic, Fox, Ford, et al., 2019). Regarding slow flow, our
results found a master recession coefficient of 0.07 day−1 suggesting
75% of flow in the watershed on an annual basis is governed by
4 | DISCUSSION recharge through low permeability matrix pores and small fissures.
The inverse of the recession coefficient (1/α) represents the time that
4.1 | Upland drainage controls on nutrients in karst it would take to completely drain a reservoir assuming no additional
agroecosystems recharge or recession slope changes (Tobin & Schwartz, 2016), and
is calculated as 14 days for slow flow in Camden Creek. This value is
Hydrology of the Camden Creek watershed can be characterized by a short relative to slow flow drainage in Royal Spring (20 days). This is
prominent slow flow drainage reservoir and a second reservoir likely attributed to the immature, vadose zone conduit architecture1622 FORD ET AL.
FIGURE 6 Results of the continuous flow
recession analysis for the 10‐year study at
ST1. Results are presented for the total
monitored flow and for the slow flow
reservoir. Quick and intermediate flow is the
difference between total and slow flow. An
enhanced image of 1 year of recession
analysis is provided to highlight quick/
intermediate and slow flow variability within
events for January 2003–December 2003
found a master recession coefficient of 0.25 day−1, corresponding to
a drainage time of roughly 4 days, representing a mixture of quick
and intermediate flow pathways. This pathway likely reflects surface
run‐off that is redirected to sinkholes and perched aquifer drainage
through large epikarst fractures and conduits that has been observed
to occur above the bedrock surface (Keagy et al., 1993; Mellander
et al., 2013). Indistinguishability of quick and intermediate pathways
reflects the lack of resurgent streams, which provide the immediate
spring response in mature karst systems. The implication of this find-
FIGURE 7 Results from a 5‐year modelling study of algal C dynamics ing is that hydrograph separation techniques may have limited applica-
(Ford & Fox, 2014) were used to estimate algal N and P dynamics by bility in less mature karst landscapes for differentiating soil hydrologic
considering analogous stoichiometry of processes and a C:N:P ratio of processes (e.g., piping through macropores) from tertiary pathways
40:7.2:1 (Chapra et al., 2014). Values from Ford and Fox (2014) were
such as sinkholes and swallets. Findings from the Camden Creek anal-
averaged for month of year (with January representing Month 1 and
ysis agree with the prevailing thought that the epikarst acts as a
December representing Month 12). Uptake of N and P, losses
associated with biochemical processes, and physical scouring/ dynamic zone of water transfer and storage during moderate to
sloughing of algae are considered (note that uptake is equal to extreme events (Aquilina, Ladouche, & Dörfliger, 2006; Champollion
scouring plus biochemical losses on an annual basis) et al., 2018; Husic, Fox, Adams, et al., 2019; Williams, 2008).
Synthesis of our NO3− pathway loading analysis with the results of
of the Camden Creek springs that are, on average, about 15 m below regional karst watersheds suggests that soil water N dynamics regu-
the ground surface and drain small groundwater basins on the order of late the annual NO3− load and are responsible for the low variability
1 km2 (Keagy et al., 1993). It is important to note that these drainage in NO3− loading across Inner‐Bluegrass karst systems with varying
values do not consider temporary storage within the aquifer reservoirs degrees of fluviokarst development. We find that slow flow is the pre-
(e.g., field capacity, capillary forces, aquitards, and spatial heterogene- dominant contributor to watershed nitrate loads in the Camden Creek
ity in permeability). For example, in Royal Spring, numerical modelling watershed due to higher volumetric flow contributions combined with
indicated a mean residence time of 122(±9) days (Husic, Fox, Ford, higher nutrient concentrations, highlighting the importance of subsur-
et al., 2019), which is much greater than the aforementioned 20‐day face NO3− dynamics to regulate watershed NO3− fluxes in the imma-
drainage time. Regarding the second hydrologic reservoir (R2), we ture karst system. Our finding of diluted NO3− concentrations duringFORD ET AL. 1623
Greece (Tzoraki & Nikolaidis, 2007), and 7.27 tN km−2 y−1 from a Long
Term Ecological Research karst site in Austria (Hartmann et al., 2016).
The implication of these findings is that physical and biochemical pro-
cesses in the soil (coupled with upland management practices) may be
the most important control on annual NO3− loading as compared with
epikarst and phreatic zone dynamics. Future studies should explicitly
consider the role of soil physical and biochemical properties as well
as nutrient management dynamics when studying nutrient flow path-
ways in subsurface drainage (e.g., Williams, King, Ford, Buda, & Ken-
nedy, 2016). Recent work has highlighted the ability of reservoir
models in karst landscapes to separate the influence of soil and
epikarst regions on vadose zone N processing (Husic, Fox, Ford,
et al., 2019) and may be valuable tool in these future studies. Our find-
ings have implications for targeting optimization of NO3− removal in
soil vadose zones for receiving waters where long‐term annual nitrate
fluxes are of particular concern to the downstream waterbody. Given
that timing of these loadings within the year can be highly variable as a
function of karst maturity (Husic, Fox, Ford, et al., 2019), management
practices may therefore have varying degrees of effectiveness at
reducing annual nitrate loads and the timing of fluxes at finer time-
scales also require consideration.
FIGURE 8 Results from the algae scenario analysis to illustrate
Findings from our study suggest that DRP loading is dominated by
differences in the ratio of flow weighted mean concentrations from
slow flow despite higher concentrations in quick and intermediate
Spav and the watershed outlet ST1. Results are provided for NO3− and
dissolved reactive phosphorus (DRP). Scenario 1 assumed all algae flow, which agrees with dynamics observed in similar karst
biomass losses were lost as dissolved organic matter (i.e., dissolved agroecosystems; however, we find concentrations (and subsequently
organic nitrogen and dissolved organic phosphorus). Scenario 2 fluxes) of DRP to be an order of magnitude higher than other karst
assumed that all algae losses were a result of mineralization/ agroecosystem studies (e.g., Mellander et al., 2013), reflecting the lim-
respiration to inorganic forms and that no nitrification occurred (i.e.,
ited capacity of the phosphatic limestone in our study site to attenu-
total ammoniacal‐N [TAN] and dissolved reactive phosphorus [DRP]).
Scenario 3 assumed that all algae losses were a result of mineralization ate DRP. We found DRP concentrations in Spav had a significant
and that all TAN was subsequently nitrified (i.e., NO3− and DRP) linear increase with increasing flow, suggesting that quickflow path-
ways were more highly concentrated in DRP. This finding agrees with
existing theory that increasing connectivity of subsurface pathways to
peak flows, as evidenced by the decreasing linear trend in Figure 4, is P‐rich surface soils via macropores and preferential pathways will
reflective of NO3− dynamics in many karst N agroecosystem studies bypass the filtration capacity of soil and epikarst matrix, resulting in
(e.g., Husic, Fox, Ford, et al., 2019) and reflects rapid connectivity of elevated DRP concentrations (Baker et al., 2017; Jarvie et al., 2014;
nitrate‐depleted precipitation mixing with the vadose zone NO3− King et al., 2014; Mellander et al., 2013). Nevertheless, slow flow con-
source. Further, seasonality in NO3− concentrations was found to be centrations were also high in our system with average DRP concentra-
a maximum in winter and minimum in summer and has been previ- tions of 0.233 mg L−1, a value that is nearly an order of magnitude
ously postulated to be reflective of physical and biochemical transfor- higher than eutrophic thresholds of 0.02–0.03 mg L−1 for freshwater
mations in soil, epikarst, and phreatic zones broadly across algal proliferation (Table 4; Dodds, Smith, & Lohman, 2002; Sharpley
agroecosystems (Exner‐Kittridge et al., 2016; Ford, Williams, & King, et al., 2003). Mellander et al. (2013) collected high resolution data
2018; Griffiths et al., 2012; Mulholland et al., 2008; Peterson et al., from a 92% permanent pasture karst watershed with mean Mehlich
2001; Pionke et al., 1999; Royer, Tank, & David, 2004). Our watershed 3P of 66 ppm in the upper 10 cm of the soil profile and found mean
loading analysis suggested an average annual loading of 1.7 tN km TRP (unfiltered molybdate reactive P) concentrations to average
−2
y−1. This result is similar to average annual loadings from both more 0.0 18 mg L−1 over a 2‐year period, postulating that P attenuation
−2 −1 −2 −1
mature (1.8 tN km yr ) and less mature (2.1 tN km y ) karst may occur in all pathways due to transient sediment storage in disso-
agroecosystems previously reported in the study region, which have lution conduits and fissures. Jarvie et al. (2014) similarly found that
similar soil types and agroecosystem management (Ford et al., 2017; karst flow pathways may provide a significant sink (as much as 96%
Husic, Fox, Ford, et al., 2019; Mahoney et al., 2018). These loadings of SRP) during stormflows resulting in concentrations an order of mag-
have particularly low variability when considering the ranges reported nitude lower than edge‐of‐field surface run‐off. On the basis of the
in other disturbed karst watersheds; for instance, 4.70 tN km−2 y−1 existing perception that karst networks attenuate P in soils and con-
was observed from a 97‐ha karst dairy farm spring in Ireland (Fenton duit sediments, our findings would suggest that sediments and soils
et al., 2017), 10.38 tN km−2 y−1 from the karstified Krathis River in of the Inner‐Bluegrass Region may have limited capacity in both the1624 FORD ET AL.
soil matrix and transient sediment stores in fractures to retain P once Macalady, 2010). Although studies have shown that algal mats provide
leached from surface soils. little influence on overall stream denitrification in other midwestern
agroecosystems (e.g., Schaller, Royer, David, & Tank, 2004), we postu-
late proliferation of thick mats of floating aquatic macrophytes may
4.2 | Nutrient fate in karst bedrock streambeds facilitate high rates of N removal in the bedrock stream.
Proliferation of floating aquatic macrophytes, commonly observed
Findings from this study suggest that algal biomass dynamics in the at the study site, likely reflect the favourable conditions created by
bedrock‐controlled streams could govern seasonal production of mineralization of benthic algae and the limited nitrification potential
TAN and TOC, as well as seasonal transient removal of DRP from of systems flowing over bedrock. Our results support peak TAN con-
the water column. Our results showed that timing of peak biochemical centrations in late summer to occur at stream sites and found limited
losses from the algae pool corresponded to maxima in the significant variability in Spav, suggesting that in‐stream production of TAN is the
seasonal fluctuations of both TOC and TAN (Figure 3; Figure 7) sug- primary source. Although benthic substrates have been recognized
gesting the importance of algal leaching and mineralization to govern to facilitate rapid nitrification of TAN within tens to hundreds of
organic carbon and TAN dynamics in the stream channel. The signifi- metres of being introduced to the stream reach (Peterson et al.,
cance of DOC leaching in warm summer months is recognized in that 2001), the lower metabolic activity of bedrock streambeds (Argerich
it provides a labile C source for heterotrophic bacteria, such as et al., 2011) likely leads to lower rates of nitrification. The rapid
denitrifying bacteria, to attenuate contaminants (Arango & Tank, growth of floating aquatic vegetation, namely duckweed, is widely rec-
2008; Ford et al., 2017; Hotchkiss & Hall, 2015; Lane, Lyon, & Ziegler, ognized in low‐velocity freshwater systems where TAN is present,
2013; Marcarelli, Baxter, Mineau, & Hall, 2011). Conversely, pulses of thus outcompeting and shading algal biomass (Peng, Wang, Song, &
TAN have been shown to enhance toxicity of harmful algae blooms Yuan, 2007; Ran, Agami, & Oron, 2008). Given the timing of high
and production of microcystin in laboratory studies and thus may TAN concentrations in the stream channel to occur during low‐flow
become problematic in downstream waterbodies (Davis, Bullerjahn, and long‐residence periods, our findings suggest that regenerated
Tuttle, McKay, & Watson, 2015). Regarding DRP attenuation, results TAN may subsequently fuel rapid floating aquatic macrophyte growth.
in Figure 8 for the hypothetical algae fate scenario suggests that a sig- Although we did not have quantitative measures of floating aquatic
nificant fraction of DRP is transiently stored (and ultimately lost) to macrophytes, we identified duckweed as the prevalent floating macro-
downstream waterbodies as particulate algal P due to sloughing and phyte and observed thick mats to occur during low‐flow periods from
scour. If benthic algal biomass dynamics from the nearby watershed late spring to early fall. Aerial imagery from September highlights the
are congruent with our system, an average of 0.07 kgP day−1 is prevalence of aquatic vegetation in the stream channel during summer
transported during summer (equivalent P concentration of (Figure 1). Such dynamics have not previously been highlighted as a
0.015 mgP L−1) and would be susceptible to regeneration down- major control on N dynamics in other agroecosystem streams to our
stream. As previously mentioned, given eutrophic conditions of knowledge and need further validation.
−1
0.02–0.03 mgP L , assessing the fate of this flux is significant for bor- We postulate that the floating aquatic vegetation provides a sub-
derline eutrophic agroecosystems. strate for microbial biofilms and, when coupled with a labile DOC
We were unable to fully describe NO3− summer deviations in the source, may facilitate denitrification rates that are on the high side
Camden Creek watershed from algal biomass dynamics alone, leading of disturbed agroecosystem streams. Our findings show that leaching
us to postulate alternative biotic controls in the bedrock‐controlled of algal C via organic carbon exudates is greatest during the period
streambed. As highlighted in the results, algal biomass dynamics did of maximum NO3− depletion. Denitrifying bacteria are heterotrophic
not fully explain nitrogen removal dynamics in the stream channel. In organisms and will remove NO3− more effectively in environments
order to attain the concentration ratio of Spav to ST1 from fall, winter, enriched in labile C, such as autochthonous biomass exudates (Lane
−1
and spring months (average ratio of 1.19), an average of 2.5 kgN day et al., 2013). Further, large mats of aquatic macrophytes have been
(0.2 gN m−2 day−1) would need to be regenerated to the stream chan- found to promote denitrification on plant surfaces by supporting
nel, suggesting the stream has a potentially large nitrate sink that is microbial biofilms (Eriksson, 2001; Eriksson & Weisner, 1999; Veraart,
not able to be explained by algal biomass dynamics. Of interest to de Bruijne, de Klein, Peeters, & Scheffer, 2011). Assuming that, con-
watershed managers and scientists is whether such a NO3− sink is servatively, 10% of the aforementioned nitrate sink can be explained
associated with assimilatory transient storage in other biota that is by denitrification (Mulholland et al., 2008), a denitrification rate of
subsequently exported from the watershed or from dissimilatory pro- 0.02 gN m−2 day−1 or 8.3*102 μgN m−2 hr−1 during peak removal is
cesses (i.e., denitrification) that would permanently remove NO3− from plausible. This estimate would place the bedrock stream in the upper
the waterbody. Given the findings of the algal scenario analysis for 50th percentile of denitrification rates reported in agricultural streams
DRP, we postulate that permanent removal via denitrification is the (Mulholland et al., 2008). Although this hypothetical estimate needs
most likely contributor. Although riparian zone denitrification may further quantitative validation using more sophisticated modelling
contribute, we do not anticipate it to be the governing mechanism and field monitoring approaches that consider the complex interac-
based on previous research that has shown the lowest rates of denitri- tions of N species within the various biotic pools, these findings pro-
fication in riparian zones occur at the soil‐stream interface (Ranalli & vide evidence of the significance of this spring–surface waterYou can also read