Comparative Assessment of Zero Emission Electric and Hydrogen Buses
←
→
Page content transcription
If your browser does not render page correctly, please read the page content below
Comparative Assessment of Zero Emission Electric
             and Hydrogen Buses

              12 July 2021 (Revised 14 October 2021)

              Professor David A. Hensher
              Dr. Edward Wei
              Dr. Camila Balbontin

              Institute of Transport and Logistics Studies (ITLS)
              University of Sydney Business School
              https://www.sydney.edu.au/business/our-research/institute-of-
              transport-and-logistics-studies.html
              David.Hensher@sydney.edu.au
              Edward.Wei@sydney.edu.au
              Camila.Balbontin@sydney.edu.au

              Report prepared for BusVic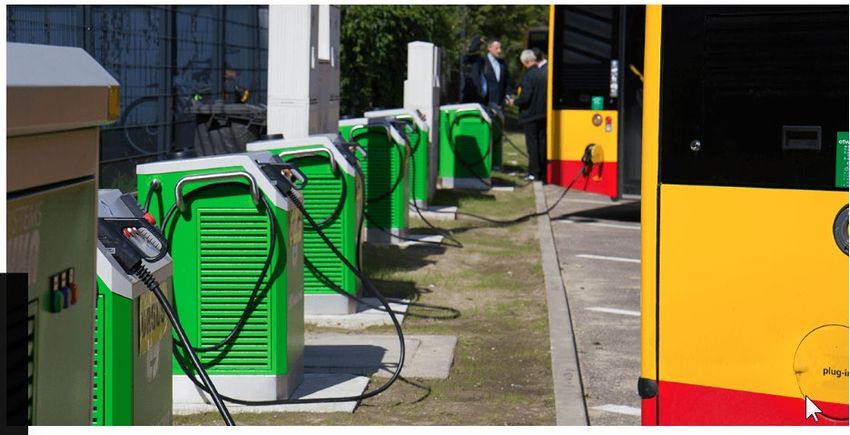
Assessment of Zero Emission Buses (by ITLS)

Table of Contents
Figures........................................................................................................................................... 7
Tables ............................................................................................................................................ 8
Abbreviations ................................................................................................................................ 9
Executive Summary ..................................................................................................................... 11
1.      Introduction ........................................................................................................................ 12
     1.1      Overview of ZEB Adoption across Countries and Regions ............................................ 13
        1.1.1 Australia ..................................................................................................................... 13
        1.1.2 New Zealand............................................................................................................... 15
        1.1.3 Europe Union and the UK ........................................................................................... 16
        1.1.4 US and North America ................................................................................................ 17
        1.1.5 Asia ............................................................................................................................. 18
     1.2      Benefits of ZEBs ............................................................................................................ 18
        1.2.1 Emission Reduction Level ........................................................................................... 19
        1.2.2 Other Benefits ............................................................................................................ 24
2. Electric Bus and Considerations .............................................................................................. 26
     2.1      Charging Electric Buses ................................................................................................. 26
        2.1.1 Charging Strategy ....................................................................................................... 26
        2.1.2 Charging Methods and Facilities................................................................................. 28
     2.2 Battery Technology and Price............................................................................................ 31
        2.2.1 Battery Technology and Charging Time ...................................................................... 31
        2.2.2 Battery Prices ............................................................................................................. 33
     2.3 Operating Costs ................................................................................................................. 34
     2.4 Understanding the Baseline Scenario for Electric Buses ................................................... 35
3. Hydrogen Bus and Considerations .......................................................................................... 39
     3.1      Future Prospect of Hydrogen and Hydrogen Bus.......................................................... 39
     3.2 Emissions during the Production of Hydrogen and FCEB Baseline Scenario ...................... 40
        3.2.1 Types of Hydrogen and Emissions .............................................................................. 40
        3.2.2 Hydrogen’s Energy Density, Storage and Use in FCEBs............................................... 41
     3.3 Cost of Hydrogen............................................................................................................... 43
     3.4 Challenges Facing Hydrogen Industry and FCEB ................................................................ 44
4. Research on BEBs and FCEBs ................................................................................................... 47

                                                                                                                                    5|Page
Assessment of Zero Emission Buses (by ITLS)

   4.1 Adoption of BEBs ............................................................................................................... 47
   4.2 Fuel Consumption and Emissions ...................................................................................... 47
   4.3 Energy Consumption and Emission Reductions for ZEBs ................................................... 48
   4.4 Factors Influencing Energy Consumptions and Economy for ZEBs .................................... 49
5 Planning and Transition Approaches to ZEBs ........................................................................... 51
   5.1 Planning and Considerations for Rolling out ZEBs ............................................................. 51
   5.2 Government Policymaking and Support Actions ............................................................... 53
   5.3 Decision-making for the Transport Authority and Bus Operator ....................................... 54
   5.4 Overcoming the Main Barriers and providing a Good Start in Adopting ZEBs ................... 56
References .................................................................................................................................. 58
Appendices ................................................................................................................................. 63
   Appendix 1 Emissions and energy efficiency of buses............................................................. 63
   Appendix 2 Emissions of electricity grid and hydrogen production in Australia...................... 64
   Appendix 3 Energy density and heat value ............................................................................. 65
   Appendix 4 Useful conversions of electricity and hydrogen.................................................... 66
   Appendix 5 Fuel cell bus suppliers and manufacturers ........................................................... 67
   Appendix 6 Electric bus suppliers and manufacturers............................................................. 68
   Appendix 7 Worldwide averages for a 12-metre bus fleet ...................................................... 69

                                                                                                                               6|Page
Assessment of Zero Emission Buses (by ITLS)
Figures
Figure 1.1 Conceptual illustration of WTW (WTT & TTW) emissions for diesel, BEB and FCEB. .. 20
Figure 1.2 Three scopes of direct and indirect emissions............................................................ 21
Figure 2.1 Main differences between opportunity and depot charging ...................................... 27
Figure 2.1 Plug-in cable charger at bus depot in Aarhus, Denmark ............................................. 29
Figure 2.2 ABB’s Heavy Vehicle Charger (HVC) depot charging and HVC 450 kW pantograph .... 29
Figure 2.3 Principle of WPT/IPT charging .................................................................................... 30
Figure 2.4 IPT/WPT charging in Spain and UK (Source: FTA 2014 & UITP 2019).......................... 30
Figure 2.5 ABB/TOSA Flash-charging system in Geneva, Switzerland (Source: FTA 2014) .......... 31
Figure 3.1 Three most common hydrogen types and their carbon intensity............................... 41
Figure 3.2 Illustration of a hydrogen fuel cell bus (source: Toyota Sora) .................................... 42
Figure 3.3 Australia’s hydrogen end uses .................................................................................... 45
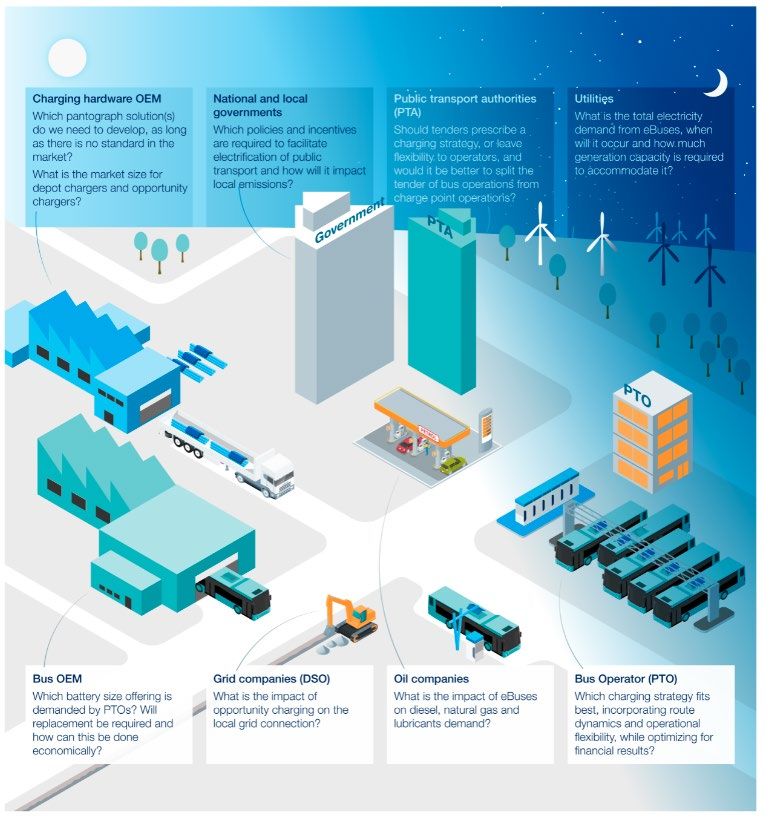
Figure 5.1 Key questions for stakeholders .................................................................................. 53
Figure 5.2 Enabling factors and actions in the planning and scaled-up lifecycle of ZEB adoption
.................................................................................................................................................... 57
Figure A5.1. Brand logos for main fuel cell bus makers (not exclusive)....................................... 67
Figure A6.1. Brand logos for main electric bus makers (not exclusive) ....................................... 68
7|Page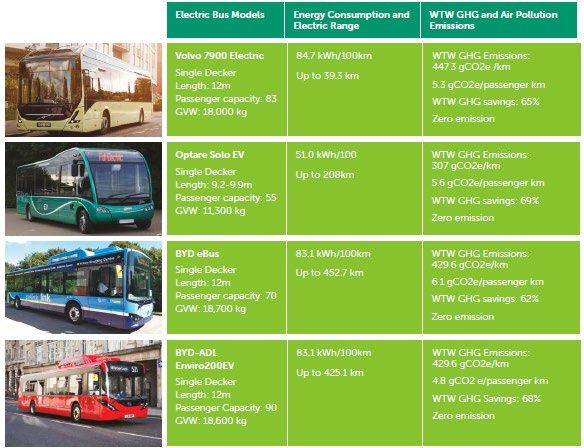
Assessment of Zero Emission Buses (by ITLS)

Tables
Table 1.1 Government trials and commitments of the electric bus by industry ......................... 14
Table 1.2: Renewable energy penetration by state (Source: Clean Energy Council 2021) .......... 21
Table 1.3 Indirect emission factors for consumption of purchased electricity or loss of electricity
from the grid (Source: Department of Environment and Energy 2017) ...................................... 22
Table 1.4 Carbon intensity factors for electricity mix in different countries and regions (Source:
Lie et al. 2021) ............................................................................................................................ 23
Table 1.5 Comparison of the CO2 emissions from different buses in the fleet (Source: Grijalva &
Martìnez 2019)............................................................................................................................ 23
Table 2.1 Comparison of LFP and NMC batteries for slow and fast charging ............................. 33
Table 2.2 A comparison of LFP and NMC advantages and disadvantages .................................. 33
Table 2.1 Key factors to consider when purchasing and operating electric bus .......................... 36
Table 2.2 Default cost values in EU ............................................................................................. 36
Table 2.3 Electric Bus Models...................................................................................................... 37
Table 3.1 The emission intensity of production (from COAG Energy Council 2019) .................... 40
Table 3.2 Energy consumption and emissions by various fuel sources ....................................... 43
Table 3.3 Hydrogen production costs ......................................................................................... 44
Table 4.1. The emission intensity of production ......................................................................... 48
Table A1.1 Emission factors beyond tailpipe emissions and fuel/energy efficiency (base:
standard 12-metre bus) .............................................................................................................. 63
Table A2.1 Indirect emission factors for consumption of purchased electricity or loss of
electricity from the grid .............................................................................................................. 64
Table A2.2 Emissions intensity of hydrogen production ............................................................. 64
Table A3.1. Heat values of various fuels...................................................................................... 65
Table A7.1 Fleet Assumption....................................................................................................... 69
Table A7.2 Fuel Efficiency of 12-Metre Buses by Country/Region .............................................. 70

                                                                                                                               8|Page
Assessment of Zero Emission Buses (by ITLS)

Abbreviations
AC                         Alternative current (slow charging)
AMP                        Unit of electric current
BEBs (Battery-electric     An electric bus that is driven by an electric motor and obtains energy
buses)                     from on-board batteries.
BEV                        Battery electric vehicle
Blue hydrogen              Blue hydrogen incorporates CCS into the SMR processes, reducing carbon
                           emissions.
Brown hydrogen             Brown hydrogen is formed through fossil fuels such as through coal
                           gasification. It accounts for around 95% of global hydrogen production.
CCS                        Carbon capture and storage
CCS (Combined charging     The name of a quick charging method for battery electric vehicles
system)                    delivering 200kW via a special plug-in electrical connector, or up to 350
                           kW via an overhead pantograph. The connector is different than a
                           CHAdeMO connector. This quick standard originated in Europe and is
                           predominantly used in Europe and the US.
CHAdeMO                    The trademark name of a quick charging method for battery electric
                           vehicles delivering up to 62.5 kW by 500 V, 125 A direct current via a
                           special electrical connector. This quick charging method started in Japan
                           and is predominantly used in the U.S. and Japan.
Charging                   Refuelling an electric vehicle with electricity
Charging station           An element of infrastructure that safely supplies electric energy for the
                           recharging of electric vehicles, also known as an EVSE (Electric Vehicle
                           Supply Equipment).
CO                         Carbon monoxide
CO2                        Carbon dioxide
DC                         Direct current (fast charging)
Depot charging             This type of charging usually occurs overnight when the buses are not
                           used for a longer period of time.
Electrolysis of water      Electrolysis of water is the process of using electricity to decompose
                           water into oxygen and hydrogen gas. Hydrogen gas released in this way
                           can be used as hydrogen fuel.
FCEB (Fuel Cell Electric   Buses that uses compressed hydrogen gas as fuel to generate electric
Buses)                     power via a highly efficient energy converter, a fuel cell. They produce no
                           tailpipe emissions.
GHG                        Greenhouse gas
Green hydrogen             Green hydrogen is produced from water electrolysis and renewable
                           energy and is carbon neutral.
Grey hydrogen              Grey hydrogen is produced from natural gas.
H2                         Hydrogen
H2O                        Water
HRS                        Hydrogen refuelling station
ICE (Internal Combustion   An engine that generates motion by the burning of petrol, oil or other
Engine)                    fuel with air inside the engine, the hot gases produced being used to
                           drive a piston or do other work as they expand.

                                                                                           9|Page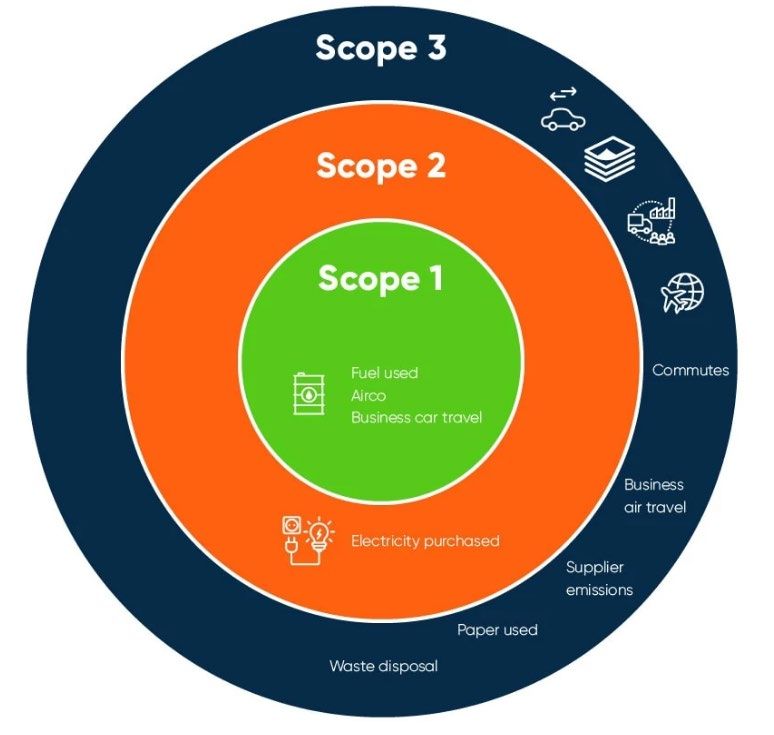
Assessment of Zero Emission Buses (by ITLS)

 Incentives               Many governments offer incentives to encourage buyers to choose an
                          electric car. Incentives for EVs can include grants towards the purchase
                          price, free parking, zero road tax, low company car tax and exemption
                          from city emissions and congestion charges.
 kW (kilowatt)            A kilowatt is simply a measure of power, or equal to 1,000 watts. This is a
                          unit that is usually used to measure the charging speed of a charger.
 kWh (Kilowatt Hour)      A measure of electrical energy equivalent to the power consumption of
                          one kilowatt for one hour. This is a unit usually used to measure the
                          storage capacity of a battery.
 LCA                      Life cycle assessment
 MPDGE                    Miles per gallon diesel equivalent
 MW                       Megawatt
 NOx                      Oxides of nitrogen
 Opportunity charging     Otherwise known as on route or overhead charging. This allows you to
                          quickly charge your battery compared to overnight charging which could
                          take up to 6-7 times as long.
 Regenerative braking     An energy recovery system used in most electric vehicles that can help
                          charge the battery while the vehicle is slowing down. Typically, the
                          electric motor acts as the generator, so power can flow both ways
                          between it and the battery.
 SMR                      Steam methane reformer /Gasification is used in industries to separate
                          hydrogen atoms from carbon atoms in methane (natural gas) or from
                          coal. These processes result in carbon dioxide emissions.
 TCO (Total cost of       The total cost to own a bus from the time of purchase by the owner
 ownership)               through operation and maintenance, all the way to the time it leaves the
                          ownership. Includes all the expenses such as insurance, maintenance,
                          repairs, service, etc.
 Wh                       Watt-hour, a unit of energy equivalent to one watt (1 W) of power
                          expended for one hour (1 h) of time.
 ZEBs (zero-emission      A zero-emission bus uses electricity to power a battery. ZEBs include
 buses)                   battery-electric buses and Fuel-cell buses. The great advantage of these
                          buses is that they do not require gasoline, oil changes, or an internal
                          combustion engine. They also do not emit exhaust emissions.
Main sources:
   1. https://viriciti.com/blog/a-complete-guide-to-abbreviations-for-electric-bus-fleets/
   2. https://www.myev.com/research/ev-101/ev-terminology
   3. NewBusFuel (2021) “New Bus Refuelling for European Hydrogen Bus Depots”, downloaded from
      https://www.fuelcellbuses.eu/public-transport-hydrogen/new-bus-refuelling-european-
      hydrogen-bus-depots-guidance-document-large
   4. https://yhejitl3sl24wn203q4vn14z-wpengine.netdna-ssl.com/wp-content/uploads/Fact-sheet-
      Hydrogen-explained.pdf

                                                                                         10 | P a g e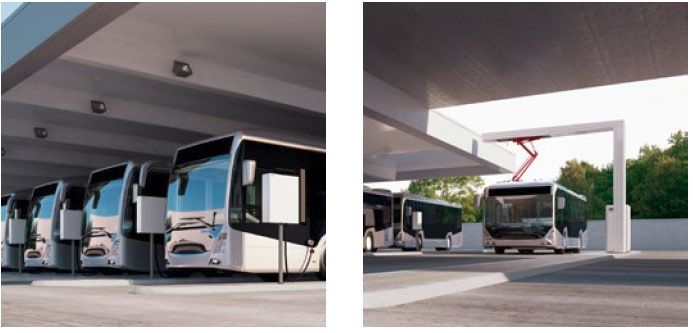
Assessment of Zero Emission Buses (by ITLS)

Executive Summary
This report complements a decision support system (DSS) we have prepared to obtain estimates
of CO2 emissions and associated costs such as charging batteries and diesel costs for current
diesel buses in a metropolitan or regional fleet, as well as two classes of battery electric buses
and hydrogen buses. The main focus is on CO2 emissions as governments in Australia set timelines
to transition to zero emission buses in the contracted route fleets.

Although the tailpipe emissions can be described as zero or close to zero for green energy, CO2
emissions are produced throughout the full lifecycle of energy produced and distributed for
electric battery and fuel cell (hydrogen) buses. The focus of the DSS is on the end use emissions
and those associated with the other stages in energy production and distribution to the bus
operation.

We draw on the evidence in this report to provide emission factors to enable a bus operator or
indeed anyone interested in the topic such as Bus Association or Government, to calculate using
the DSS, the CO2 emissions and associated costs for the operation of a fleet of diesel buses,
battery electric buses or hydrogen fuel cell buses in an operating environment defined by the
number of buses in the fleet, the annual kilometres of these buses and for diesel, the end use
fuel efficiency of the fleet. One objective is to be able to compare the CO2 emissions and costs
of fleets with varying mixes of diesel and green energy buses as they transition to a fully green
fleet. The DSS enables the estimates to be obtained for each transition year. The most important
pieces of information that are inputs into calculating the comparative costs and emissions
associated with the various end use fuel sources are summarised in the following table, drawn
from the chapters of this report.

                                                                     WPT/IPT*     Grey Hydrogen   Blue Hydrogen
                                           Plug-in    Conductive                                                      Green
                                Diesel                               (Inductive
                                          charging     charging                    (best case)     (best case)      Hydrogen
                                                                     charging)
                                1350        656          682            650           850              71               0
 Life cycle emission (g
 CO2/km)                          (0.5       (1
                                                     (1 kWh/km)      (1 kWh/km)    (0.1kg/km)      (0.1kg/km)       (0.1kg/km)
                               ltr/km)    kWh/km)
 Emission percentage
                               100.00%    48.59%       50.50%         48.15%         62.70%          5.26%            0.00%
 relative to diesel (per km)
 Fuel efficiency per 100       40 to 60
                                                     90 to 150 kWh                 9 to 10 kgs     9 to 10 kgs      9 to 10 kgs
 kms                            litres
                               $AUD1.5
 Unit cost                        0/                 $AUD0.25/kWh                 $AUD4.40/kg     $AUD6.04/kg      $AUD7.76/kg
                                litre
 Energy/Fuel cost per 100      $AUD60.
                                                      $AUD22.50                    $AUD39.60       $AUD54.36        $AUD69.84
 kms (low end) $AUD2021          00
 Energy/Fuel cost per 100      $AUD90.
                                                      $AUD37.50                    $AUD44.00       $AUD60.40        $AUD77.60
 kms (high end) $AUD2021         00
 Cost saving relative to
 diesel (best case) (high      100.00%                  75.00%                       51.11%          32.89%           13.78%
 end)

                                                                                                              11 | P a g e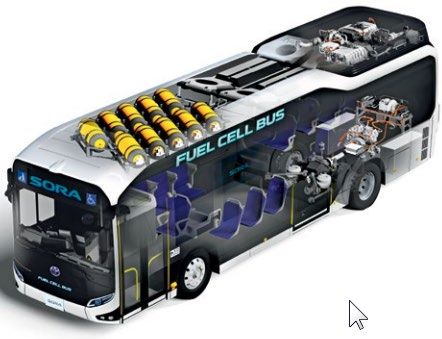
Assessment of Zero Emission Buses (by ITLS)

    Cost saving relative to
                                100.00%          37.50%                    34.00%         9.40%          -16.40%
    diesel (low end) (per km)

For wireless fast charging facilities for BEBs, the Wireless Power Consortium (WPT) provides information on the
principles, technology options, and advantages of this technology. Wireless charging adopts the Inductive Power
Transfer (IPT) method that exploits basic laws in electromagnetics

1. Introduction
With the net-zero emission target set for 2050 in the Paris Agreement 1, the introduction and
rollout of zero-emission buses (ZEBs) in every Australian state and territory is fast approaching.
It is not a matter of whether such transition is necessary, but how the change should be
implemented. All state governments have either given the timetable or are working on the plan
to achieve full electrification of the state bus fleets.

Australia ranks 22nd in greenhouse gas emission (GHG) globally, and transportation accounts for
about 17% of total emissions. Australia’s per capita transport emissions are 45% higher than the
OECD average (Climate Council 2017). Globally, transportation contributes more to the total
emission at 22% than the Australian level (Mohamed et al. 2018). Diesel driven heavy-duty
vehicles, including buses, also account for most of the other air pollutants such as 45% of nitrogen
oxides (NOx) and 75% of particulate matters including PM 2.5 and PM 10 (Li 2016). The public
transport sector can provide transport needs between 10% in Australia to over 70% in China, with
the rest as driving and other modes (Climate Council 2017). There are generally three pathways
to reduce emissions in transport: 1) shifting Internal Combustion Engine vehicles (ICE) to electric
vehicles (EVs); 2) shifting more transport requirements to public transport to reduce cars on
roads which currently account for over 50% of total transport emissions, and 3) electrification of
public transport from diesel and gas-based to electric-based.

For buses, shifting more car drivers to buses and electrification of bus fleets are two primary
strategies. A bus uses less than 40% of the fuel used to move 100 passengers, so a 10% passenger
shift from cars to buses would reduce carbon emissions by over 400,000 tonnes a year (OzeBus
2020). On electrification of bus fleets, besides achieving the zero-emission objective, it is widely
agreed that the total cost of ownership (TCO) of the electric bus will continue to decline, driven
by the reduction in battery price and continued lower energy consumption by electric buses
compared to diesel buses. In a recent cost-benefit analysis by Quarles et al. (2020) for the US
market, they predict that the battery-electric bus (BEB) fleet, including the required charging
infrastructure, will be cost-competitive by the 2030 to the diesel bus fleet.

1
 More information can be found on https://www.wri.org/climate/expert-perspective/paris-agreement-
strategy-longer-term
                                                                                                  12 | P a g e
Assessment of Zero Emission Buses (by ITLS)

There are two leading technologies for the zero-emission bus (ZEB), both generating zero tailpipe
emissions. The majority of ZEBs will be BEBs, using rechargeable batteries. The second type is
hydrogen fuel cell electric bus (FCEB), using compressed hydrogen gas to generate electric power
via a fuel cell, a highly efficient energy converter. Some other technologies are targeting partial
electrification for low emission buses. For example, Transdev is testing a hydrogen unit called
HYDI which can be installed on existing diesel buses to cut down the use of diesel. 2 Low emission
buses also include using plug-in hybrid electric buses, which the state governments or bus
operators do not consider. For this report, we only focus on ZEBs to align with the complete
electrification of the bus fleet to achieve the zero-emission tailpipe target.

1.1    Overview of ZEB Adoption across Countries and Regions
It is important to understand and review the status of ZEB adoption in both Australia and globally
in order to provide the background for the later discussion on options available in Australia.

1.1.1 Australia
In Australia, all states governments have committed to commence the process of introducing
ZEBs. Their actions include trials of ZEBs with an increasing number beginning or active in several
states. For example, the timetable for achieving 100% ZEBs has been announced in NSW by the
Minister for Transport, with the goal to convert the entire NSW bus fleet of over 8,000 buses to
BEBs by 2030 (Cotter 2021). In February 2021, the first 10 BEBs begun operating in NSW, and 50
more BEBs will be incrementally rolled out during 2021.

Both BEBs and FCEBs have been tested in Australia (Li 2016). The general trend is to shift to BEBs.
The hydrogen bus has seldom been mentioned in reports and documents relating to bus
electrification. State transport authorities are cautious in estimating the cost involved, with
ongoing research to establish the feasibility of the switch plan. For example, in Western Australia,
the transit authority has tested buses using many alternative energies, including electric, diesel-
electric hybrid and hydrogen (Ally & Pryor 2016). A report for the Victorian Department of
Transport (Rare Consulting 2010) suggests that in achieving the stated targets for emission
reduction, four evaluation criteria can be considered, including fleet suitability, fuel and emission
benefits, cost implications, and the timeframe of assessment of the merits of alternative fuels
(e.g., electric and hydrogen), alternative drivetrains (e.g., fully electric and hybrid), and vehicle
technologies (e.g., vehicle aerodynamics and tyre technologies).

A recent report by the International Association of Public Transport (UITP 2021) provides a
summary of the current state of ZEBs in Australia:
   • NSW: The government has committed to the electrification of all bus fleets by 2030, with
      more than 50 new BEBs on the road in 2021.

2
  For more information on HYDI can be found on https://www.hydi.com.au/technology/heavy-
transport/
                                                                                        13 | P a g e
Assessment of Zero Emission Buses (by ITLS)
• ACT: The first 90 BEBs are expected to commence in 2021 to 2022, with the remaining
delivered no later than 2024.
• QLD: The Department of Transport and Main Roads (TMR) has announced that all buses
purchased by 2030 will be ZEBs. New ZEB trials are being operated in South-East QLD in
2021.
• VIC: The government has committed $20 million investment in the 2021 to 2022 budget
for a three-year trial of ZEBs.
• SA: The government has announced the action plan for 2021 to 2025 to start the
transition to ZEBs.
• WA: The government has announced that from 2022, BEBs will start operating on certain
roads.
On ZEB procurement, both Australian bus manufacturers such as BCI and BusTech and overseas
manufacturers such as Yutong, BYD, Volvo and other brands would be considered. Appendix 6
and Appendix 5 have the names and logos of many manufacturers for BEBs and FCEBs throughout
the world. Instead of entirely relying on imports, Australian bus manufacturers such as BusTech
could have a good opportunity 3. Table 1.1 provides a more detailed summary of some current
trials and commitments.
Table 1.1 Government trials and commitments of the electric bus by industry
3
See “https://www.electrive.com/2020/12/06/electrification-efforts-in-new-zealand-
australia/”
14 | P a g eAssessment of Zero Emission Buses (by ITLS)
Source: (from “State of electric vehicles” by Electric Vehicle Council 2020)
In the rollout of ZEBs, different levels of government appear to have different priorities. For
example, for the regulatory framework and incentive schemes, the federal government is
expected to lead. On the other hand, tendering, supporting the rollout of charging or refuelling
infrastructure for ZEBs should be supported by the state government. Both levels of the
governments can play a significant role in research and development (R&D), for example, in
supporting trials of FCEBs.
1.1.2 New Zealand
New Zealand transport authorities have made significant progress in supporting the transition
from diesel buses to ZEBs. The bus fleet of over 2,000 city transit buses throughout New Zealand 4
will be replaced by ZEB buses, with many actions already started in Auckland, Wellington and
Christchurch, in which 80% of the total bus fleet operates. The joint efforts by transport
authorities, councils, and transport agencies (e.g., Waka Kotahi) have enabled a faster uptake of
new buses.
4
From https://www.busandcoach.co.nz/about-us/nz-industry-facts
15 | P a g eAssessment of Zero Emission Buses (by ITLS)
In Wellington, the transport authority aims to have 108 BEBs by 2023. In Auckland, 34 BEBs will
operate by the end of 2021, and the goal is to complete the transition to ZEBs by 2030. In
Christchurch, 25 BEBs will be added by 2022. Transport authorities have announced that they will
not consider bids for new diesel buses when existing bus contracts expire in all three cities.
A recent order through service provider Metlink will see 98 new BEBs arrive in Wellington
between mid-2021 and early 2023 5. In addition, the first order of 78 extra-sized BEBs designed
for New Zealand made by Yutong has been handed over in Auckland. These BEBs carry bigger and
more powerful batteries to run longer daily and have extra axle for reducing wear and tear on
the roads. 6
Besides BEBs, the hydrogen bus is also being considered. Auckland Transport (AT) is testing the
first hydrogen bus. AT is planning to replace diesel buses with both BEBs and FCEBs costing up to
$200m 7.
1.1.3 Europe Union and the UK
In the EU, 27% of total GHG is attributed to road transport, one of the most significant
contributors (Varga et al. 2020). Therefore, there is a great need for the public transport sector
to reduce emissions. The EU started a program in 2013 called ZeEUS to test and facilitate the
adoption of electric buses focusing on urban bus system networks. Many public transport
organisations across the EU are contributing to testing, forums, R & D, and other related
activities.
The ZEB is quickly gaining ground in many countries. There are over 4,000 battery-electric city
buses registered in Europe with a further 3,500 plus electric coaches. Top countries with ZEB
fleets include the Netherlands, the UK, France, Poland, Sweden, Spain and Austria (CTI 2021).
London has Europe’s largest electric bus fleet with over 200 BEBs. 25% of the total bus fleet in
The Netherlands was electric at the end of 2020.
As the largest market in the EU for BEBs, Germany started slowly but is catching up at fast pace.
There are currently 500 BEBs and 50 FCEBs in Germany. According to Werner Overamp, VDV Vice
President, up to 1,000 BEBs will be put in operation every year in coming years to electrify bus
5
From https://www.electrive.com/2020/12/06/electrification-efforts-in-new-zealand-australia/
6
From https://www.stuff.co.nz/environment/climate-news/123225756/supersized-electric-
bus-hits-auckland-roads-in-drive-to-phase-out-diesel-fleet
7
From https://www.stuff.co.nz/national/politics/local-democracy-reporting/300242131/auckland-
transport-sets-the-groundwork-for-new-zealands-first-hydrogen-bus
16 | P a g eAssessment of Zero Emission Buses (by ITLS)
fleets in the main cities such as Berlin, Cologne, Frankfurt, Hamburg and Munich (Sustainable Bus
2021).
According to the UK government plan, by 2037, all 8,000 buses in London will be ZEBs
(Sustainable Bus 2020a). National committees are examining multiple emission plans to shift
heavy-duty vehicles, including buses, to a mixture of electricity, biofuel and hydrogen (National
Academies of Sciences, Engineering, and Medicine 2020). Up to £120 million is being made
available through the ZEBRA scheme, allowing local transport authorities to bid for funding to
purchase ZEBs across England. The funding will be adequate to deliver up to 500 ZEBs. In total,
the UK government has announced a £3 billion fund to improve bus services covering
electrification of the bus fleet 8.
Across the EU, hydrogen buses have been tested and are in operation in many cities. All FCEBs
operating in Europe were purchased under projects co-funded by the EU. Over 200 hydrogen
buses have been ordered through the EU-backed JIVE and JIVE 2 projects, the leading European
projects on the hydrogen bus. The JIVE project is deploying 139 FCEBs and refuelling stations
across the EU. There are also plans to get over 1,200 FCEBs by 2025 9.
In the UK cities of London, Liverpool, and Aberdeen, FCEB buses are in trial and testing (Cotter
2021). FCEBs are also operating in several European cities, including Stuttgart, Cologne, Frankfurt,
Hamburg, Versailles and Rotterdam 10.
1.1.4 US and North America
At the end of 2019, only 450 out of 75,000 buses in the US were ZEBs. By December 2020, 2,800
ZEBs have been delivered or ordered, adding 300 ZEBs operating in Canada. Over 3,000 ZEBs have
been confirmed or in operation in North America (Sustainable Bus 2021b). As early as 2016, 55%
of the public bus fleet used alternative fuels, of which 15% were electric or hybrid-electric, the
other 45% using natural gas or biodiesel (Lee et al. 2019). California recently has approved
regulation requiring public transport agencies to achieve zero-emissions for the transit bus fleet
by 2040. It is the first regulation of its kind, and expected to be followed by other states 11.
Financially, between 2013 and 2020, the Federal Transit Administration (FTA) in the US
distributed over US$485 million for low and zero-emission buses, including hybrids, BEBs and
FCEBs via the Low or No-emission Bus Program. In addition, state-level grant programs also
8
From https://www.traffictechnologytoday.com/news/electric-vehicles-ev-infrastructure/uk-
government-announced-120m-funding-for-electric-buses.html
9
From https://www.sustainable-bus.com/fuel-cell-bus/fuel-cell-bus-hydrogen/
10
From https://airqualitynews.com/2021/02/03/worlds-first-hydrogen-powered-double-
decker-buses/
11
From https://www.fleetowner.com/running-green/article/21703306/california-becomes-first-state-
to-mandate-zeroemission-buses
17 | P a g eAssessment of Zero Emission Buses (by ITLS)
support the adoption of ZEBs. As a result, many states and cities in the US are receiving grants
for purchasing electric buses.
The Canadian government is planning to have 5,000 ZEBs, including transit and school buses by
2025. There are over 200 ZEBs in operation in six provinces. The North American electric bus
market is led by a few players, including Proterra, BYD Motors, and New Flyer of America.
Canadian technology has powered over 1,000 FCEBs around the world 12.
1.1.5 Asia
According to MarketWatch (2021), by May 2020, China had about 420,000 ZEBs, close to 99% of
the total global ZEB fleet. This trend is expected to continue with a fast pace of transition. The
rate of circulation is about 9,500 ZEBs every five weeks 13. ZEBs account for about 15% of China’s
total bus fleet. China also has many sizeable electric bus manufacturers such as Ankai, BYD,
Foton, and Yutong, producing more BEBs than their EU counterparts of Volvo, Iveco, Solaris and
Daimler 14.
Li (2016) provides several examples of how BEBs have rolled out in large Chinese cities such as
Beijing and Shanghai through programs related to significant events such as the Beijing Olympics
and the Shanghai World Expo. City governments are also the primary drivers to fund the shift to
BEBs in developed cities such as Shenzhen. Liu et al. (2018) also provide various incentive details
for the national and local governments to roll out FCEBs in public transport.
The other fast-growing country in Asia for BEBs is India, with a forecast by 2025 to account for
10% of the total annual demand globally (Sustainable Bus 2020a). In Japan, the development is
leaning towards FCEBs. The Ministry of Economic, Trade and Industry has set 100 FCEBs in
operation by 2020. The Bureau of Transportation of the Tokyo Metropolitan Government has
announced 70 FCEBs operating in Tokyo by 2020. Toyota has developed and tested a 100 FCEB
bus fleet for the Olympic Shuttle Bus program from 2019, which has been delayed to 2021 due
to the pandemic. The main challenge is the lack of hydrogen refuelling facilities for a city transit
bus 15. Less than 100 BYD BEBs are operating in Japan. The future direction of whether BEB or
FCEB will be the main ZEB fleet is yet to be determined.
1.2 Benefits of ZEBs
The primary objective in adopting ZEBs is to reduce CO2 emissions and achieve the net-zero
emission target for the public transport sector. It is essential to know the levels of reduction that
12
From https://www.globenewswire.com/news-release/2020/11/19/2130343/0/en/North-America-
Electric-Bus-Market-Growth-Trends-and-Forecast-2020-2025.html
13
From https://www.ies-synergy.com/en/electric-buses-where-are-
we/#:~:text=It%20is%20clear%20that%20China,9%2C500%20buses%20every%205%20weeks.
14
From https://www.ies-synergy.com/en/electric-buses-where-are-we/
15
From https://www.aljazeera.com/economy/2019/9/18/how-toyotas-olympic-buses-are-fuelling-its-
hydrogen-dream
18 | P a g eAssessment of Zero Emission Buses (by ITLS)
can be achieved. This will help decision-makers clearly understand benefits and costs in order to
make the right choice in the ZEB transition.
1.2.1 Emission Reduction Level
There are different levels of emissions representing different stages, from energy production to
the tailpipe. When the term ZEB is used, zero-emission often only refers to the tailpipe emission.
Although tailpipe emissions from ZEBs is zero, the life cycle emissions are not zero with low
emissions often used as the preferred representation.
Three definitions relating to emissions have been noted in the “Low Emission Bus Guide” by
LowCVP (2016, p11):
“Well-to-Wheel' (WTW) includes all the emissions involved in the process of
extraction/creation, processing and use of fuel in a vehicle to gauge the total carbon
impact of that vehicle in operation. 'Well-to-Tank' (WTT) only includes all the emissions
associated with fuel up to the point that it enters a vehicle's fuel tank or energy storage
device. ‘Tank to Wheel’ (TTW) covers the emissions associated with fuel combustion in
the vehicle, i.e. from the tailpipe.”
The tailpipe emissions for ZEBs are equivalent to TTW. The other emissions occur in electricity
generation and distribution for BEBs and production, compressing, transport and distribution for
FCEBs, or WTW and WTT emissions. Figure 1.1 illustrates the life cycle emissions from WTT to
TTW for three types of buses: diesel, BEB and FCEB. At the WTT stage, all three types of buses
have emissions. At the TTW stage, only diesel bus has emission, hence why the “ZEB” term is
used.
19 | P a g eAssessment of Zero Emission Buses (by ITLS)
Figure 1.1 Conceptual illustration of WTW (WTT & TTW) emissions for diesel, BEB and FCEB.
Emissions can also be categorised as direct and indirect. Direct emissions are emissions from
sources that are owned or controlled by the reporting entity. Indirect emissions are emissions
resulting from the activities occurring at sources owned or controlled by other entities. In
defining the direct and indirect emissions, a definition of three scopes of emissions are often
mentioned 16, as shown in Figure 1.2.
16
From https://indiaghgp.org/content/what-difference-between-direct-and-indirect-emissions
20 | P a g eAssessment of Zero Emission Buses (by ITLS)
Figure 1.2 Three scopes of direct and indirect emissions.
(Source: https://ecochain.com/knowledge/scope-1-2-and-3-emissions-overview-to-direct-and-
indirect-emissions)
Australia’s electricity production has high fossil-fuel intensity with 62% from coal, 9.9% from
natural gas, 27.7% from renewable energy and 0.5% from other waste and mine gas or other
liquids based on the latest report by Clean Energy Australia (2021). The emission factors are
about 1kg CO2-e/kWh for coal and 0.5 kg CO2-e/kWh for gas, and only close to zero-emission from
renewable energy. This matches with emission factors in the US (NREL 2016). The emission
intensity is different by state. Table 1.2 provides a detailed configuration of energy sources used
for electricity generation in each Australian state and territory.
Table 1.2: Renewable energy penetration by state (Source: Clean Energy Council 2021)
State Total Fossil Fuel Total Renewable Renewables as
Generation Generation Renewable Proportion of Proportion of
(GWH) (GWH) Generation Generation Consumption
(GWH)
Tasmania 10,956 90 10,866 99.2% 100.0%
South Australia 14,285 5,763 8,523 59.7% 60.1%
21 | P a g eAssessment of Zero Emission Buses (by ITLS)
Victoria 49,390 35,705 13,685 27.7% 28.4%
Western Australia 19,171 14,528 4,643 24.2% 24.2%
New South Wales 68,158 53,846 14,312 21.0% 19.1%
Queensland 65,426 54,537 10,888 16.6% 18.0%
National 227,386 164,469 62,917 27.7% 27.7%
The emissions that BEBs cause, when charged from the grid are indirect emissions (Scope 2). On
the other hand, a diesel bus will generate 1.3 kg/km CO2 emissions. If a bus is an electric bus,
then to run 1km, 1 to 1.4 kWh electricity is required from the grid. Let us make it simple with 1km
for 1kWh, the actual level of CO2 emissions from an electric bus running 1km is about 1kg CO2 if
charged from a coal-powered station, and 0.5kg CO2 from a gas-powered station; hence the
actual life cycle emission reduction can be as low as 26% if electricity is produced from coal and
63% if electricity is produced from gas. In addition, if hydrogen is produced with carbon capture
and storage (CCS), the emission rate is about 0.28 kg/kWh, plus some extra for compressing and
transport; hence the emission reduction will be less than either coal or gas generated electricity
charged EVs and electric buses, calculated as a 75% reduction in the life cycle emissions. If
electricity or hydrogen are produced from renewables (e.g., solar, wind) and then used to power
BEBs and FCEBs, the life cycle CO2 emissions will be close to zero or very low. For example, in the
above case, if BEBs are adopted in Tasmania, where electricity has a very low carbon density,
BEBs can truly be called ZEBs.
Except in Tasmania and South Australia, with 60% to 99% renewable energy used for electricity
generation, other states such as New South Wales, Queensland and Victoria are still heavy fossil
fuel reliant in power generation, so a kWh of electricity in Australia will generate about 0.7 kg
CO2-e/kWh. The indirect emission factors for consumption of purchased electricity recommended
by the Australian Government also align with this emission level but were higher as shown in
Table 1.3 (Department of Environment and Energy of the Australian Government (2017),
reflecting the improvement in using renewables for electricity generation.
Table 1.3 Indirect emission factors for consumption of purchased electricity or loss of
electricity from the grid (Source: Department of Environment and Energy 2017)
State or Territory Emission factor kg CO2-e/kWh
New South Wales 0.83
Australian Capital Territory 0.83
Victoria 1.08
Queensland 0.79
South Australia 0.49
Western Australia 0.70
Tasmania 0.14
Northern Territory 0.64
22 | P a g eAssessment of Zero Emission Buses (by ITLS)
Comparing the carbon intensity numbers in some other countries (Table 1.4), the carbon
intensity for the electricity mix for most Australian states and territories is much higher. The
carbon intensity of the electricity mix plays a vital role in achieving the emission reduction target
from electric vehicles overall.
Table 1.4 Carbon intensity factors for electricity mix in different countries and regions
(Source: Lie et al. 2021)
State or Territory Emission factor kg CO2-e/kWh
Norway 0.019
Sweden 0.012
Denmark 0.209
Nordic countries 0.075
Italy 0.327
Poland 0.846
EU 0.294
US-avg. 0.432
China 0.555
Japan 0.506
One encouraging comparison comes from research undertaken by Spanish researchers using data of
multiple years in studying the replacement of diesel and CNG bus fleet with BEBs. Their findings show
that the overall emission reduction is still quite significant even with a high WTT emission level due
to electricity carbon intensity, as shown in Table 1.5. Given that Spain has 33% of renewables in the
electricity mix compared to Australia’s 27.7%, the emission reduction level is greater, but still can
provide good evidence when considering BEBs.
Table 1.5 Comparison of the CO2 emissions from different buses in the fleet (Source: Grijalva
& Martìnez 2019)
Urban Bus Weight of Energy Consumption gCO2/km gCO2/km gCO2/km
Technology the Fleet (in kWh/100 km) (WTT) (TTW) (WTW or total)
Diesel Bus 34.34% 571 162 1326 1488
Hybrid Bus 2.34% 470 154 796 949
CNG Bus 61.56% 728 187 1014 1201
Electric Bus 1.76% 93 292 0 292
From the results shown above, although the WTT emission is higher for electric buses powered
by the electricity mix, the TTW emission is far higher for other buses, and BEBs is zero because
there is no exhaust emission when BEB is running. Overall, the WTW or life cycle CO2 emission
for BEBs is still far lower at about 20% of diesel buses. Another reason for the far higher emission
is the low fuel economy for diesel and CNG buses.
23 | P a g eAssessment of Zero Emission Buses (by ITLS)
1.2.2 Other Benefits
A recent report by the Committee on Transport and Infrastructure of NSW listed four main
benefits of electric buses (CTI 2020). Besides CO2 emission reductions and improved air quality,
the other reasons are improved public health, reduced noise pollution and lower cost over the
asset’s lifetime. Two of the main benefits given by UITP are improved quality of life and health
due to clean air and fostering the attractiveness of cities (UITP 2019). Other benefits for ZEBs are
summarised below.
Reducing Air Pollution
Air quality can be improved by reducing or eliminating air pollutants such as Oxides of Nitrogen
(NOx) and Particulate Matter (PM). The evidence from Europe has shown that BEBs are less
contaminating than any other energy-powered buses. Grijalva & Martìnez (2019) use case study
results in Spain and concluded that BEB is five times less polluting than a diesel bus, four times
less polluting than a CNG bus and three times less polluting than a hybrid bus. It eliminates
pollutant gases, including NOx, PM10, and PM2.5. TfNSW indicate there are 520 premature
deaths in Sydney due to air pollution. For each replacement an existing diesel bus by a ZEB, the
state will save annually at least $2,400 in health costs. Similar evidence on health benefits has
been given for other countries (CTI 2020).
Reducing Noise Pollution
The noise reduction effect of ZEBs without an internal combustion engine is significant. Diesel
and CNG buses (and trucks) can generate an incredible amount of noise, up to 80 decibels, almost
100 times louder than a quiet residential street setting (CTI 2020). Due to the high social cost
associated with noise, adopting ZEBs delivers significant social and health benefits.
Benefits for Bus Operators
Besides the social and health benefits, there are direct benefits for bus operators. One of the
most significant benefits is cost savings. Using evidence from trials and comparisons of electric
bus fleets with diesel and CNG fleets, cost-savings can be substantial, varying from 30% up to
70% depending on the energy/fuel consumption and prices (see Executive Summary). Some fuel
consumption comparisons are provided in Appendix A. The cost-saving topic is further discussed
in Chapter 2.
In general, the lower usage of energy by BEBs and FCEBs provides much higher energy efficiency
(i.e., better fuel economy) and even more enhanced by the relatively lower price for electricity
and decreasing price for hydrogen. On fuel economy, the evidence by NREL (2018) suggests that
for a standard 12-metre bus, the fuel economy associated with using electricity is four times
greater than for comparable diesel or CNG buses. Using the standard measure in the US called
“miles per diesel gallon equivalent” (MPDGE), a battery-electric bus has an equivalent of 17.11
MPDGE, compared to 4.23 MPDGE for a CNG bus (NREL 2018). Diesel buses have 3.5 to 5.8
MPDGE fuel economy, similar but better than CNG buses (MJB 2013). This means that with an
equal amount of energy (electricity, diesel or CNG), BEBs are much more energy efficient and can
operate almost four times greater distance. For FCEB, although hydrogen differs in production
24 | P a g eAssessment of Zero Emission Buses (by ITLS)
and compression technologies, the lowest standard set by the US government is 8 MPDGE and is
likely to achieve 13 MPDGE or higher, which is also higher than CNG or diesel (Lee et al. 2018;
NREL 2018).
The following two chapters, the chapter explore and discuss the main aspects of BEBs and FCEBs.
25 | P a g eAssessment of Zero Emission Buses (by ITLS)
2. Electric Bus and Considerations
2.1 Charging Electric Buses
Crucial considerations associated with the selection of technology, operation, and economic
aspects for BEBs are the charging strategy and charging method. The strategy and method are
closely related, but there are two decisions for consideration. The strategy consideration is more
closely related to operations, and the method consideration is more closely associated with the
technology.
2.1.1 Charging Strategy
Bus operators can choose from overnight depot charging or opportunity charging (also often
referred to as “on-route” or “en route” charging), or the combination of the two strategies (UITP
2019). Depot charging involves the installation of charging equipment at the depot and is the
most popular method for charging BEBs fewer requirements for road and transport authorities
which is not the case for opportunity charging. . Depot charging requires less up-front capital
outlays. It is also easier for the bus operator to schedule charging, such as during the off-peak or
in choosing times in order to generate the least CO2 emissions or impose less pressure on the
electricity grid, which would in turn reduce both costs and WTT emissions.
Depot charging often uses smaller chargers, 40 kW or 150 kW, instead of fast chargers, which are
usually 500 kW chargers used in the opportunity charging setting. Overnight charging at the
depot often uses plug-in cable or a conductive system like a pantograph to charge. The system
often requires larger or heavier batteries than BEBs designed more for opportunity charging to
store enough energy for a day’s operation.
For depot charging, energy consumption and CO2 emissions may differ depending on the charging
time. For example, wireless/inductive charging was found to consume 0.3% less energy and emits
0.5% less GHG than plug-in charging in the total life cycle (Bi et al., 2015). It is expected that the
speed of charging and hourly variation during the day in the electricity grid can cause slight but
significant variations in both energy and CO2 emissions (Miller, Arbabzadeh, & Gencer 2020; NREL
2016).
Opportunity charging involves charging a bus along the bus route, at selected charging points, or
the start/end of the bus line. Conductive or inductive charging technology may be chosen
depending on the facilities. BEBs designed more suitable for fast conductive charging, or wireless
charging often choose smaller batteries using high energy density materials like lithium nickel
manganese cobalt oxide (NMC), allowing a high proportion of the battery to charge within a short
time (Li et al. 2020). On the other hand, overnight depot charging often uses larger or heavier
batteries using more conventional materials with lower energy density like lithium iron
phosphate (LFP). With the differences in technology, the depot and opportunity charging can be
used in combination for most BEBs if the infrastructure is available.
26 | P a g eAssessment of Zero Emission Buses (by ITLS)
Opportunity (on-route) charging requires the installation of fast chargers along the routes of the
BEB’s at strategic locations in order to provide a quick charge to the bus while passengers are
loading and unloading. The typical fast charging time is between 5 to 10 minutes.
Two main advantages of opportunity charging are the short charging time and allowing BEBs to
cover a longer route. The main disadvantages are the high cost of the on-route charging
equipment and the cooperation of more parties (i.e., approval by transport, road and other
government authorities). Placing on-route charging equipment and allowing BEBs to stay for five
or more minutes to recharge can be challenging for busy urban areas with inadequate lanes. It is
more difficult than depot charging for planning, and requires a systematic approach. On-route
charging is also the most expensive way to recharge BEBs and also requires routine
maintenance 17. Figure 1 below summarises some critical differences between the two strategies.
Figure 2.1 Main differences between opportunity and depot charging
(source: https://www.mckinsey.com/industries/oil-and-gas/our-insights/the-european-electric-
bus-market-is-charging-ahead-but-how-will-it-develop#)
17
From https://wendelcompanies.com/battery-electric-buses-things-you-need-to-know/
27 | P a g eAssessment of Zero Emission Buses (by ITLS)
2.1.2 Charging Methods and Facilities
The three leading charging technologies are: 1) lower power charging through cable and plug-in
(e.g., AC or DC charging using charging system (CCS) or CHAdeMO systems); 2) higher power
charging through conductive charging with physical connections (e.g., using fast charging
equipment like a pantograph); and 3) fast charging through inductive/wireless charging using a
magnetic field for fast charging (UITP 2019). Besides these three methods, BEBs also include an
on-board regenerative braking process that may recharge up to 40% of the electricity back to the
battery during operation, especially in a metropolitan bus with many stops and starts.
For general electric vehicles like passenger cars, there are commonly three levels of charging
available. Level 1 is a typical low current (10 to 15 Amps) and use of a slow charging charger
available in homes for electric cars to charge overnight. Level 2 is a dedicated AC charger at
around 7kW with a current of 32 Amps, available at homes, workplaces, shopping centres, hotels
and other places. With one-hour charging, electric cars may be able to get about 40kms of range.
Level 3 is a dedicated DC charger for a fast charge for passenger cars or light vehicles with about
25 to 35 kW and 40 to 500 Amps of power and current. It usually is available in commercial
premises or roadside locations in order to provide fast charging 18. These three levels can also be
further split into five levels, with Level 3 further divided into fast charge (public), super-fast
charge (public) and ultra-fast charge (public) 19.
It is rare that bus manufacturers recommend power less than 40 kW AC or DC chargers for buses.
Since BEBs often have a battery capacity of 340 kWh or more, Level 1 and Level 2 chargers are
simply inadequate. Level 3 and above may be close to what depot charging facilities at a bus
depot would need. For example, ABB recommends ABB Terra CA / CB 120kW or 240kW DC cable
chargers or a Terra HVC 450kW pantograph fast charger for the depot. The BYD 12-metre bus has
two 40 kW AC chargers and an extra 150 kW DC charger for depot charging. The ABB Terra HVC
450 kW pantograph can boost charge a bus in about 5 to 10 minutes. Figure 2.1 shows a plug-in
charger at a bus depot in Aarhus, Denmark. The charger can provide 75 kW power output
(Sustainable Bus 2020c). Figure 2.2 shows ABB’s HVC pantograph charging buses at the bus
depot. Conductive pantograph uses roof-mounted equipment to make an electrical connection
between the bus and an overhead power supply.
18
From https://electricvehiclecouncil.com.au/about-ev/charger-map/
19
From https://www.transport.nsw.gov.au/projects/electric-vehicles/charging-an-electric-vehicle
28 | P a g eAssessment of Zero Emission Buses (by ITLS)
Figure 2.1 Plug-in cable charger at bus depot in Aarhus, Denmark
Figure 2.2 ABB’s Heavy Vehicle Charger (HVC) depot charging and HVC 450 kW pantograph
Pantograph systems are capable of very high-power transfer. The power capacity of the charger
is typically 150-300kw with a charging time of 5-6 minutes to boost-charge a bus, suitable for
opportunity charging when a bus has a 5 to 10 minutes’ stop. Pantograph charging units can be
installed indoors or outdoors.
For wireless fast charging facilities for BEBs, the Wireless Power Consortium (WPT) provides
information on the principles, technology options, and advantages of this technology. Wireless
charging adopts the Inductive Power Transfer (IPT) method that exploits basic laws in
5
29 | P a g eAssessment of Zero Emission Buses (by ITLS)
electromagnetics 20. According to Bi et al. (2015), wireless charging also emits 0.5% less GHG than
plug-in charging system in the total life cycle.
Figure 2.3 Principle of WPT/IPT charging
(Source: FTA 2014)
There are high installation requirements for WTP/IPT facilities, but users' test results are positive
from tests run in the UK. Figure 2.4 shows WTP/IPT charging in Spain and London. A 12-metre
transit BEB can be charged during stops at the terminals or other spots. A WTP/IPT can provide a
15-second burst of 400 kW. This speed is faster than a pantograph. However, the technical
requirements, installation costs and other related requirements are higher.
Figure 2.4 IPT/WPT charging in Spain and UK (Source: FTA 2014 & UITP 2019)
20
A wire carrying an electric current produces a magnetic field around the wire (Ampere’s Law). A coil intersecting
a magnetic field produces a voltage in that coil (Faraday’s Law). Electromagnetic power transfer between electrical
circuits across an air gap can be achieved using magnetic field coupling at resonance (Tesla).
30 | P a g eYou can also read