MEASURES TO ADDRESS AIR POLLUTION FROM SMALL COMBUSTION SOURCES - February 2, 2018
←
→
Page content transcription
If your browser does not render page correctly, please read the page content below
MEASURES TO ADDRESS
 AIR POLLUTION FROM
  SMALL COMBUSTION
            SOURCES

                               February 2, 2018

                                Editor: Markus Amann
         International Institute for Applied Systems Analysis (IIASA)

     1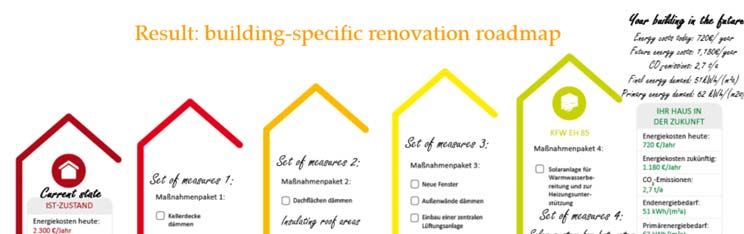
Abstract

           This report reviews the perspectives for reducing emissions from small
           combustion sources in the residential sector, taking into account recent
           legislation and expectations on the future of solid fuel use in the residential
           sector in the EU. It highlights new technologies that enable effective
           reductions of emissions from these sources if applied at a larger scale, and
           different types of policy interventions that have proven successful for the
           reduction of pollution from small combustion sources in the household
           sector. Case studies address technological aspects as well as strategies,
           measures and instruments that turned out as critical for the phase‐out of
           high‐polluting household combustion sources. While constituting about
           2.7% of total energy consumption in the EU‐28, solid fuel combustion in
           households contributes more than 45% to total emissions of fine particulate
           matter, i.e., three times more than road transport.

                                                  2
The authors

This report has been produced by

         Markus Amann1)
         Janusz Cofala1)
         Zbigniew Klimont1)
         Christian Nagl2)
         Wolfgang Schieder2)

Edited by:
        Markus Amann)

Affiliations:
         1)
              International Institute for Applied Systems Analysis (IIASA), Laxenburg, Austria
         2)
              Umweltbundesamt Vienna, Austria

Acknowledgements

This report was produced under Specific Agreement 11 under                           Framework   Contract
ENV.C.3/FRA/2013/00131 of DG‐Environment of the European Commission.

Disclaimer

The views and opinions expressed in this paper do not necessarily represent the positions of
Umweltbundesamt, IIASA or their collaborating and supporting organizations.

The orientation and content of this report cannot be taken as indicating the position of the European
Commission or its services.

                                                       3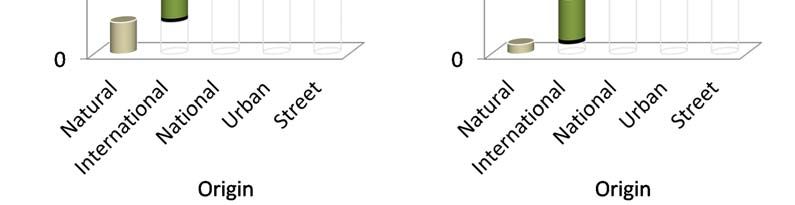
Executive Summary
In 2005, households1 contributed more than 45% to total PM2.5 emissions in the EU‐28, and thereby
three times more than road transport. However, there are large variations across Member States, with
contributions ranging from below 10% in the Netherlands, Cyprus and Malta to almost 80% in Croatia,
Latvia and Lithuania. 80% of emissions were caused by the combustion of biomass (wood), while the
remainder occurred from coal combustion in a few countries (Poland, Ireland).
The National Emission Ceilings (NEC) Directive establishes for 2030 an emission reduction requirement
for PM2.5 of 50%, relative to 2005, supported by provisions in the Ecodesign Directive for solid fuel
combustion in small combustion devices, which also addresses organic gaseous compounds, CO and
NOx.
Despite these measures, it must be expected that by 2030 exposure to fine particulate matter will
remain a significant threat to human health. Also the WHO guideline value for exposure to PM2.5 will
not be fully achieved, especially in areas where solid fuel combustion in households will prevail.
In this context, this report reviews the perspectives for reducing emissions from household sources in
the European Union.
A host of new technologies allow significant reductions of PM2.5 emissions, especially from biomass
combustion. Representing current best available technology, these are commercially available,
triggered by stringent national emission regulations for small combustion facilities in some countries.
Wider application could significantly contribute to the emission reductions that are envisaged in the
future.
Given the importance of regulation as a driver for technology development, the review of good practice
examples reveals a wealth of experience throughout Europe. Successful policy interventions that have
led to effective reductions of air pollutant emissions in the household sector include
awareness campaigns, informal platforms, qualification of focus groups, product declaration
and expert advice at the site,
subsidies for thorough building renovation, for the switch to other fuels or the upgrade to new
facilities,
a ban of the use of solid fuels, as well as
measures in combination to fight energy poverty.
Four case studies clearly demonstrate that successful solutions require an integrated approach. Actual
improvements rarely occur overnight, but need a sustained process over several years. In areas with
widespread and substantial exceedances of air quality limit values, a complete ban of solid fuels proved
successful. However, such a ban should be accompanied by a scheme to support energy efficiency
improvements before switching to alternate fuel systems.
End‐of‐pipe technologies, i.e. electrostatic precipitators, might be foreseen for existing facilities,
however, shorter intervals for maintenance and regular checks for appropriate fuel have to be
considered. Additionally, emissions can be reduced by changing the way wood is ignited, i.e., starting
the fire on the top of the fuel stack; awareness campaigns could help to disseminate information about
such practice.
1
This study covers small combustion sources in the residential, commercial and agricultural sectors. For
simplicity, these sectors are further referred to as the “household sector”.
4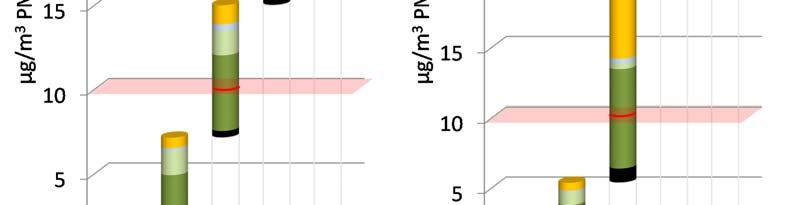
List of acronyms

   CLE      Current legislation
   CO2      Carbon dioxide
   EEA      European Environment Agency
   EMEP     European Monitoring and Evaluation Program of the Convention on Long‐range
            Transboundary Air Pollution
   EU       European Union
   GAINS    Greenhouse gas ‐ Air pollution Interactions and Synergies model
   GDP      Gross domestic product
   IED      Industrial Emissions Directive
   IIASA    International Institute for Applied Systems Analysis
   IIR      Informative Inventory Reports
   kt       kilotons = 103 tons
   MCP      Medium Sized Combustion Plants
   NEC      National Emission Ceilings
   NFR      ‘Nomenclature For Reporting’ of emission inventories to EMEP/EEA
   NH3      Ammonia
   NMVOC    Non‐methane volatile organic compounds
   NOx      Nitrogen oxides
   NO2      Nitrogen dioxide
   O3       Ozone
   PJ       Petajoule = 1015 joule
   PM10     Fine particles with an aerodynamic diameter of less than 10 µm
   PM2.5    Fine particles with an aerodynamic diameter of less than 2.5 µm
   PRIMES   Energy Systems Model of the National Technical University of Athens
   SO2      Sulphur dioxide
   TSAP     Thematic Strategy on Air Pollution
   VOC      Volatile organic compounds

                                         5
Contents

1     Context ............................................................................................................................................... 8
2     The importance of pollution from household sources...................................................................... 9
    2.1      The contribution of the household sector to total PM2.5 emissions ........................................ 9
    2.2      Comparison of PM2.5 emission factors from biomass and coal combustion ......................... 13
3     New technologies and best available technology ........................................................................... 16
    3.1      Wood chip boilers with low‐emissions .................................................................................... 18
    3.2      Pellet boilers with low emissions, possibly in combination with zero‐emission systems ....... 18
      3.2.1         Pellet boilers with low emissions ..................................................................................... 18
      3.2.2         Pellet boilers with low emissions and integrated electricity generation (Micro‐CHP) .... 19
      3.2.3         Pellet boilers with low emissions and integrated heat pumps ........................................ 19
    3.3      Log wood boilers with low emissions and integrated heat pumps ......................................... 20
    3.4      Log wood stoves with low emissions and high energy efficiency ........................................... 21
    3.5      Electrostatic precipitators ........................................................................................................ 21
4     Good practice examples and case studies....................................................................................... 23
    4.1      Awareness raising, training, and information campaigns ........................................................ 24
      4.1.1         Environmental labelling .................................................................................................... 24
      4.1.2         Public education ‐ Italy ..................................................................................................... 24
      4.1.3         Awareness campaigns ‐ Austria, Switzerland, Germany, Denmark ................................. 25
      4.1.4         The ‘Smoke‐man’ campaign ‐ Czech Republic.................................................................. 25
      4.1.5         The Interreg project PMinter ‐ Austria and Slovenia ....................................................... 26
      4.1.6         ‘Club of professionals of wood heating systems’ ‐ Région Grenobloise, France ............. 27
    4.2      Provisions for proper installation and improved maintenance ............................................... 27
      4.2.1         Inspection and maintenance of biomass appliances: Germany ...................................... 27
      4.2.2         Regular inspection and requirements for new biomass appliances ‐ Zürich ................... 27
    4.3      Emission standards for household combustion appliances ..................................................... 28
      4.3.1         Stringent emission limit values for household solid fuel combustion ‐ Germany ........... 28
    4.4      Replacement of solid fuels by district heating ......................................................................... 29
      4.4.1         Compulsory district heating for new buildings ‐ Upper Austria, Styria (Austria)............. 29
      4.4.2         Strategic extension of district heating: Vienna (Austria) ................................................. 29
    4.5      Financial incentives................................................................................................................... 29
      4.5.1         Subsidies for the installation of energy‐efficient technologies ‐ Austria ......................... 29
      4.5.2         Replacement of solid fuels boilers ‐ Czech Republic ........................................................ 29
      4.5.3         ‘Prime Air Bois’ ‐ Vallée de l’Arve (France) ....................................................................... 30
    4.6      Bans and restrictions on solid fuel use..................................................................................... 31

                                                                             6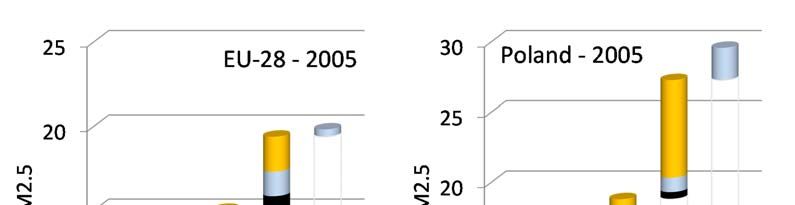
4.6.1 Ban on use of wood burning fireplaces and stoves ‐ Italy ............................................... 31
4.6.2 Ban of bituminous coal ‐ Ireland ...................................................................................... 31
4.6.3 Ban of solid fuel ‐: Poland ................................................................................................. 31
4.6.4 Ban of chimneys in allotments ‐ Vienna (Austria) ............................................................ 31
4.7 Strategies and measures to address building energy efficiency ............................................. 32
4.7.1 Energy‐efficiency in the clean energy transition .............................................................. 32
4.7.2 Nearly zero‐energy buildings ‐ Po region (Italy) ............................................................... 32
4.7.3 Strategies and measures to address energy efficiency ‐ Ireland ..................................... 33
4.8 Energy‐efficient building renovation........................................................................................ 33
4.8.1 Building renovation in the EU legislation ......................................................................... 33
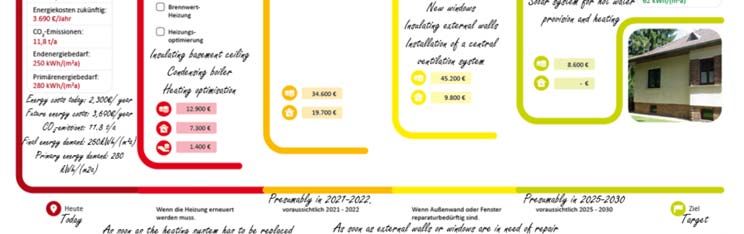
4.8.2 Building Renovation Passport and Individual Renovation Roadmap ‐ Germany ............. 34
4.8.3 The ‘Dwelling ID’ (Woningpas) ‐ Flanders (Belgium) ........................................................ 34
4.8.4 Individual Building Renovation Roadmaps ....................................................................... 34
4.9 Fuel poverty .............................................................................................................................. 35
4.9.1 Supporting energy efficiency ‐ Saint‐Josse (Belgium) ...................................................... 35
4.9.2 Seasonal Health Interventions Networks (SHINE) ‐ UK .................................................... 36
4.9.3 Examples in South‐Eastern Europe .................................................................................. 37
4.9.4 Ireland ............................................................................................................................... 37
4.9.5 European Fund for Strategic Investments (EFSI).............................................................. 37
4.10 Case studies .............................................................................................................................. 39
4.10.1 Case study 1: Dublin: Ban of bituminous coal for household heating ............................. 40
4.10.2 Case study 2: Lombardy: Wood burning in small appliances .......................................... 41
4.10.3 Case study 3: Poland: Ban of solid fuels ........................................................................... 43
4.10.4 Case study 4: Vienna: Sustainable district heating and cooling ....................................... 44
4.10.5 Case study 5: Sweden: Development of district heating networks ................................. 45
5 Conclusions ...................................................................................................................................... 48
References................................................................................................................................................ 49
71 Context
In its Clean Air Programme for Europe (COM(2013)918 final), the European Commission has laid out a
comprehensive approach to improve air quality in Europe. The main legislative instrument to achieve
the 2030 objectives of the Clean Air Programme is Directive 2016/2284/EU on the reduction of national
emissions of certain atmospheric pollutants, which entered into force on 31 December 2016 (the NEC
Directive or NECD). The Directive calls for reduction of 50% of primary PM2.5 emissions, and to meet
these, emissions especially from wood and coal combustion in the household sector will need to be
reduced.
The recent Outlook in Future Emissions and Air Quality in the EU (Amann M., Anderl, et al. 2017), based
on latest information of economic development and emission inventories, indicates that by 2030
exposure to fine particulate matter will remain a significant threat to human health. This comes despite
the sharp decline in energy‐related air pollutant emissions throughout the European Union that will
result from the implementation of the NEC Directive and other source‐oriented legislation. Also the
WHO guideline value for exposure to PM2.5 will not be fully achieved, especially in areas where solid
fuel combustion in households will prevail.
In view of the obligations for effective reductions of emission from the household sector that are
implied by the NEC Directive and the need for further measures if the WHO guideline value for PM2.5
is to be met, this report reviews the perspectives for reducing emissions from household sources in the
European Union. Section 2 reviews the current contributions of the household sector to total national
primary emissions of PM2.5, an important constituent of fine particulate matter in ambient air, as well
as the changes that can be expected for 2030 from the recent pieces of legislation. Section 3 presents
new technologies that enable effective reductions of emissions from these sources. These are already
well established on the market in some countries, and a wider application could achieve substantial
cuts in emissions. Subsequently, Section 4 introduces successful examples of policy interventions that
have led to effective reductions of air pollutant emissions in the household sector. Case studies address
technological aspects as well as strategies, measures and instruments that turned out as critical for the
phase‐out of high‐polluting household combustion sources. Finally, results and conclusions are laid
down in Section 5.
82 The importance of pollution from household sources
The use of solid fuels in small combustion sources for the production of heat and hot water can cause
high emissions of pollutants, such as fine particulate matter (PM10, PM2.5), SO2, NOx, VOC and
benzo(a)pyrene, with negative impacts on human health.
In cold and moderate climate zones there is a long tradition of using solid fuels (coal and biomass), for
heating. However, in many countries, coal and wood as the main heat supply source have been
gradually replaced by cleaner forms of energy, including natural gas, district heat and electricity,
although coal still constitutes an important fuel for household heating in some areas, due to social and
other reasons. Also wood prevails as an important source of energy in many rural areas.
At the same time, there is an increasing trend of biomass use as a secondary or supplementary source
for heating in so‐called ‘pleasure stoves’, even in urban areas. In addition, some countries are actively
promoting the use of biomass for heating as a climate policy measure, in order to increase the use of
renewable energy sources.
2.1 The contribution of the household sector to total PM2.5 emissions
Overall, in 2005 biomass combustion in the residential sector accounted for 1.9% of total primary
energy use in the EU‐28, and coal combustion for 0.7% (Figure 2‐1).
20%
18%
16%
14%
12%
10%
8%
6%
4%
2%
0%
2005
2030
2005
2030
2005
2030
2005
2030
2005
2030
2005
2030
2005
2030
2005
2030
2005
2030
2005
2030
2005
2030
2005
2030
2005
2030
2005
2030
2005
2030
2005
2030
2005
2030
2005
2030
2005
2030
2005
2030
2005
2030
2005
2030
2005
2030
2005
2030
2005
2030
2005
2030
2005
2030
2005
2030
2005
2030
AT BE BG CR CY CZ DK EE FI FR DE GR HU IE IT LV LT LU MT NL PL PT RO SK SL ES SE UKEU‐28
Coal Biomass
FIGURE 2‐1: C OAL AND BIOMASS USE IN THE HOUSEHOLD SECTOR AS SHARES OF TOTAL ENERGY USE, FOR 2005
AND THE PRIMES 2016 REFERENCE SCENARIO FOR 2030
9Despite the small share in total energy consumption, in 2005 these 2.6% of energy use caused 46% of
total primary emissions of PM2.5 in the EU‐28 (biomass burning 36% and coal burning 10%), thereby
outweighing emissions from the road transport by a factor of three.
There are large differences across EU Member States, owing to differences in climatic conditions,
heating practices, fuel compositions, regulations, technological standards (of both buildings and
heating systems) and climate policies that promote the use of biomass (Figure 2‐2). While the
household sector accounted for less than 10% of total PM2.5 emissions in the Netherlands, Cyprus and
Malta, its share reaches up to 80% in Croatia, Latvia and Lithuania. In the EU household sector, about
80% of emissions emerged from the combustion of biomass. However, coal burning, while less
important at the EU‐level, contributed the majority of emissions in Ireland and Poland (Figure 2‐2).
90%
80%
% of total national PM2.5 emissions
70%
60%
50%
40%
30%
20%
10%
0%
BE
IE
IT
BG
CR
GR
EU‐28
CZ
DK
MA
SK
UK
AT
CY
EE
FI
DE
ES
HU
LT
SE
LV
LU
NL
PL
PT
SL
FR
RO
Coal Biomass
FIGURE 2‐2: PERCENTAGE OF TOTAL NATIONAL PM2.5 EMISSIONS FROM THE COMBUSTION OF COAL AND BIOMASS
(WOOD ) IN THE HOUSEHOLD SECTOR IN 2005
The high share of emissions from the household sector in total primary PM2.5 emissions as well as their
low release height make them an important contributor to ambient PM2.5 levels and population
exposure. In 2005, across the EU it is estimated that, even at the urban traffic stations, about one
quarter of PM2.5 concentrations originated from emissions of the household sector (left panel in Figure
2‐3), and even more than 40% in areas with wide‐spread heating with solid fuels (e.g., in Poland, Figure
2‐3, right panel).
10Note: These graphs present the contributions from different emission
sources to ambient PM2.5, for the urban traffic stations that provided for
2009 sufficient data to the AIRBASE database of the European Environment
Agency (EEA). The presentations follow the analysis presented in the TSAP
Report #12 (Kiesewetter and Amann 2014)
FIGURE 2‐3: S OURCES OF PM2.5 AT URBAN TRAFFIC STATIONS IN 2005; LEFT PANEL: AVERAGE OF ALL TRAFFIC
STATIONS IN THE EU‐28; RIGHT PANEL : POLAND
By 2030, the PRIMES 2016 REFERENCE scenario foresees for the EU‐28 a 36% increase of biomass use
in the household sector (inter alia due to enhanced renewable energy policies), while coal use is
projected to decline by 42% (Figure 2‐1; Figure 2‐4.). In addition, recent EU legislation addresses, inter
alia, emissions from solid fuel combustion in the household sector. Energy efficiency measures resulting
from Ecodesign and Energy Labelling Regulations, as well as from the Energy Efficiency Directive
(2012/27/EU) and Energy Performance of Buildings Directive (2010/31/EU), indirectly contribute to
reductions of emissions by decreasing energy consumption in the European Union. The Commission
Regulations of the Ecodesign Directive for solid fuel local space heaters (EU) 2015/1185 2 and (EU)
2015/1189 3 for solid fuel boilers specify emission limit values, supported by the Energy Labelling
Directive 2015/1186 and 2015/1187 for small scale combustion with solid fuels. The NEC Directive
established national emission ceilings for PM2.5, which imply for many countries emission reductions
from these sources.
2
COMMISSION REGULATION (EU) 2015/1185 of 24 April 2015 implementing Directive 2009/125/EC of the European Parliament and of the
Council with regard to Ecodesign requirements for solid fuel local space heaters
3
COMMISSION REGULATION (EU) 2015/1189 of 28 April 2015 implementing Directive 2009/125/EC of the European Parliament and of the
Council with regard to Ecodesign requirements for solid fuel boilers
112500
2000
Petajoule/yr 1500
1000
500
0
2005 2030
Coal Biomass
FIGURE 2‐4: USE OF SOLID FUELS IN THE H OUSEHOLD SECTOR, EU‐28, 2005 AND PRIMES 2016 REFERENCE
SCENARIO FOR 2030
Combining these new pieces of legislation with the recent projections of energy use, the ‘Progress
towards the achievement of the EU's air quality and emissions objectives' (Amann M., Anderl, et al.
2017) suggests for 2030 a 60% decline of PM2.5 emissions from the household sector, with a
particularly steep decrease of emissions from coal burning owing to the continuing substitution of coal
in households by cleaner fuels. However, as similar trends apply to other emission sources as well (e.g.,
transportation, industrial processes, etc.), the relative share of the household sector in total emissions
will not change significantly (Figure 2‐5).
90%
80%
% of national total PM2.5 emissions
70%
60%
50%
40%
30%
20%
10%
0%
BG
UK
CZ
AT
BE
ES
CY
EE
DE
HU
IE
SE
FI
IT
LV
LT
LU
NL
PL
PT
RO
SL
EU‐28
CR
GR
DK
FR
MA
SK
Coal Biomass
FIGURE 2‐5: PERCENTAGE OF TOTAL NATIONAL PM2.5 EMISSIONS FROM THE COMBUSTION OF COAL AND BIOMASS
(WOOD ) IN THE HOUSEHOLD SECTOR IN 2030, AFTER IMPLEMENTATION OF THE NATIONAL EMISSION CEILINGS
DIRECTIVE
122.2 Comparison of PM2.5 emission factors from biomass and coal combustion
As mentioned above, across Member State the different shares of the household sector to total
national PM2.5 emissions are caused by a number of factors, including the prevalence of small
combustion sources, the structure of fuel consumption for these sources, and social and regulatory
conditions that affect the technological status of devices.
To this end, this section compares the (aggregated) emission factors4 that are used in the GAINS model
to reproduce the nationally reported emission figures for PM2.5 from small combustion sources in the
household sector, based on published fuel consumption statistics. To stratify for differences in the
composition of boilers and stoves, emission factors are presented separately for coal (coal is used only
in a limited number of MS) and wood, and for boilers, stoves, and fireplaces. Note that the GAINS model
employs more detailed source categories, the aggregated figures presented here are for comparative
purposes only.
Coal boilers, kg/GJ Coal stoves, kg/GJ
0.7 0.7
0.6 0.6
0.5 0.5
0.4 0.4
0.3 0.3
0.2 0.2
0.1 0.1
0.0 0.0
BG CZ FR DE HU IE PL SK ES UK BE BG CZ DE HU IE LV PL RO SK ES UK
FIGURE 2‐6: AGGREGATED EMISSION FACTORS FOR PM2.5 FOR COAL BOILERS AND COAL STOVES TO REPRODUCE
THE EMISSION INVENTORY FIGURES OFFICIALLY REPORTED BY MEMBER STATES FOR 2005 WITH PUBLISHED FUEL
STATISTICS
In general, there are large variations in emissions factors. For coal boilers, emission factors vary by a
factor of three, with the lowest factors for Germany, which has stringent legislation implemented (see
Section 4.2.1). Emission factors for coal stoves are more uniform, although the German value appear
as the lowest again (Figure 2‐6).
Similar observations emerge for wood combustion (Figure 2‐7 to Figure 2‐9), where even larger
variability occurs across Member States. In principle, the figures reproduce different states and
stringency of emission control legislation, as evidenced by the comparatively low values in Austria,
Germany and Sweden.
In general, the comparison clearly illustrates that the benefits of stringent regulations for small
combustion sources can be clearly seen in emission inventories, based on measurements that are
carried out for representative conditions in a country.
4
GAINS represents this sector by distinguishing several stove and boiler types with their specific emission
factors. Here the fuel‐weighted average emission factor is shown.
13Wood stoves, kg/GJ
0.9
0.8
0.7
0.6
0.5
0.4
0.3
0.2
0.1
0.0
AT BE BG CR CZ DK EE FI FR DE GR HU IE IT LV LT LU NL PL PT RO SK SL ES SE UK
FIGURE 2‐7: A GGREGATED EMISSION FACTORS FOR PM2.5 FOR WOOD STOVES THAT REPRODUCE THE EMISSION
INVENTORY FIGURES OFFICIALLY REPORTED BY MEMBER STATES FOR 2005 WITH PUBLISHED FUEL STATISTICS
Wood boilers, kg/GJ
0.9
0.8
0.7
0.6
0.5
0.4
0.3
0.2
0.1
0.0
AT BE CR CZ DK EE FI FR DE GR HU LV LT PL PT RO SK SL ES SE UK
FIGURE 2‐8: AGGREGATED EMISSION FACTORS FOR PM2.5 FOR WOOD BOILERS THAT REPRODUCE THE EMISSION
INVENTORY FIGURES OFFICIALLY REPORTED BY MEMBER STATES FOR 2005 WITH PUBLISHED FUEL STATISTICS
Wood fireplaces, kg/GJ
0.9
0.8
0.7
0.6
0.5
0.4
0.3
0.2
0.1
0.0
AT BE CR CZ DK EE FI FR DE GR HU IT LV LT NL PL PT SK ES SE UK
FIGURE 2‐9: AGGREGATED EMISSION FACTORS FOR PM2.5 FOR WOOD FIREPLACES THAT REPRODUCE THE
EMISSION INVENTORY FIGURES OFFICIALLY REPORTED BY MEMBER STATES FOR 2005 WITH PUBLISHED FUEL
STATISTICS
14It should be noted that emission factors for Denmark are considerably higher than for many other
countries, despite the stringent legislation. This highlights an important caveat of such a comparison,
which is related to different measurement methods that are used by countries to establish emission
factors for their national inventories. Emissions of particulate matter can be defined as consisting of
filterable (i.e., solid or liquid particles that are captured on the filter) and condensable fraction, i.e.,
formed from vapour upon cooling and condensation. Emission factors derived from dilution tunnel
measurement are always higher than solid particle measurements, but the largest difference is for
traditional stoves, boilers, fireplaces while the difference is much smaller for modern automatic and
pellet stoves and boilers (van der Gon et al, 2015).
The current reporting of PM emissions is often inconsistent across countries where for residential
combustion different measurement methods are used. Many of the measurements of combustion
sources in Europe are only filterable, but some countries (e.g., Denmark, Norway and Switzerland)
employ measurements of total particulate matter, using dilution tunnels, also for residential
combustion sources. As this introduces major inconsistencies in emission inventories, the Task Force
on Emission Inventories and Projections under the Convention on Long‐range Transboundary Air
Pollution is currently developing procedures for international harmonization.
153 New technologies and best available technology
This section provides an overview of some new technologies that can reduce air pollutant emissions
from solid fuel combustion in installations for space heating and warm water preparation with a
nominal heat output of less than 100 kW, i.e., for fireplaces, stoves, cookers and boilers in the
residential, institutional, commercial and agricultural sector. It is for good reason a non‐exhaustive list
of new technologies, selected for broad information on the availability and tendencies on the market.
In addition, it summarizes the state of development and application of end‐of‐pipe technologies for
abatement of dust and particle‐bound pollutants (e.g., benzo(a)pyrene). For the purpose of this study,
only the emission‐relevant parts are taken into consideration; fuel storage, buffer storage systems and
distribution systems for heat and warm water are not included.
Based on literature data (e.g., the preparatory Study for the Ecodesign‐directive of Lot 155 or EMEP/EEA
Emission Inventory Guidebook 2016), market surveys, test reports and expert interviews, technologies
have been selected which are considered best available technologies for the use of solid fuels in this
sector. The main selection criteria were low emissions, high energy efficiency, state of technological
development, application, market diffusion and costs.
As regards emissions, only results from testing under laboratory conditions have been used for
assessing the performance of small combustion installations. The authors are aware that under real life
operating conditions emissions will be significantly higher due to site‐ and fuel specific factors.
However, it is assumed that the best performers under test‐bench conditions are also among the lowest
emitters under real life operating conditions.
Cost figures have been collected from manufacturers and are given as ranges to reflect differences in
size and type as well as the price difference across Member States. In general, only investment costs
are given, additional costs arising from installation, costs for fuel storage and heat distribution,
operation, cleaning and maintenance as well as costs for the chimney are not included. Also excluded
are costs which arise from combining the combustion installation with other zero‐emission systems
(e.g., solar heat).
Based on the selection criteria described above, four technologies of small scale combustion facilities
have been chosen and are described in more detail:
Wood chip boilers
Pellet boilers
Log wood boilers
Log wood stoves
Under real life operating conditions, emissions will be much higher due to variations related to products
of different manufacturers, fuel quality as well as quality of planning, installation, maintenance and
operation. While a comprehensive understanding of real life performance is still lacking, it is expected
that the selected technologies, when represented by type‐approved products and properly
implemented will cause comparable low emissions.
So far, the (EU‐wide) application of end‐of‐pipe technologies (like electrostatic precipitators) is limited,
mainly because of high investment costs, high expenses for cleaning and maintenance, lack of space
and construction constraints, and the availability of efficient systems.
5
Preparatory Studies for Eco‐design Requirements of EuPs (II) [Contract N°TREN/D3/390‐
2006/Lot15/2007/S07.74922], Lot 15 ‐ Solid fuel small combustion installations – Task 1 to 8, European
Commission DG TREN, December 2009
16TABLE 1: E MISSION LIMITS FOR ADMITTANCE OF SINGLE STOVES FROM 2022 ON AND OF CENTRAL HEATING FACILITIES FROM 2020 ON (R EGULATIONS EU 2015/1185 AND
2015/1189 ACCORDING TO EU ECODESIGN‐DIRECTIVE )
Type of small scale combustion Fuel Operation Rated heat Reference O2‐ Emission Emission Emission Emission
facility output Reference limits limits limits limits
value CO NOx PM OGC
[kW] [%] [mg/m³] [mg/m³] [mg/m³] [mg/m³]
Single stove with open combustion Solid biogenic
all ≤50 kW 2015/1185 13 2,000 200 50 120
chamber fuels
Single stove with closed Solid biogenic
all ≤50 kW 2015/1185 13 1,500 200 40 120
combustion chamber fuels
Solid biogenic
Single kitchen stove all ≤50 kW 2015/1185 13 1,500 200 40 120
fuels
Single stove with open combustion
Solid fossil fuels all ≤50 kW 2015/1185 13 2,000 300 50 120
chamber
Single stove with closed
Solid fossil fuels all ≤50 kW 2015/1185 13 1,500 300 40 120
combustion chamber
Single kitchen stove Solid fossil fuels all ≤50 kW 2015/1185 13 1,500 300 40 120
Single stove with closed
Wood pellets automatically ≤50 kW 2015/1185 13 300 200 20 60
combustion chamber
Solid biogenic
Central heating facility manually ≤500 kW 2015/1189 10 700 200 60 30
fuels
Central heating facility Solid fossil fuels manually ≤500 kW 2015/1189 10 700 350 60 30
Solid biogenic
Central heating facility automatically ≤500 kW 2015/1189 10 500 200 40 20
fuels
Central heating facility Solid fossil fuels automatically ≤500 kW 2015/1189 10 500 350 40 20
173.1 Wood chip boilers with low‐emissions
Innovation: Wood carburettor using updraft gasification with activated charcoal filter effect, enhanced
fuel suction technology, ultra‐low particulate matter emissions
Technology description: The wood gasification chamber is filled with wood chips. At the bottom a fire
bed causes carbonization of the wood chips above. This layer works as an activated charcoal filter.
Wood gas rises through the charcoal layer and the wood chips are finally burned. Additionally,
innovative and enhanced fuel suction technology broadens the scope of application.
Rated heat output: 7 to 60 kWth
Market launch of the described technology: 2016
Test bench emission for market approval: 0.9 mg/m³ PM and 5 mg/m³ CO at full load and 13 % flue gas
oxygen level, 1.0 mg/m³ PM and 11 mg/m³ CO at partial load and 13 % dry flue gas oxygen level.
Investment costs (without costs for the storage of wood chips, for heat distribution and for the chimney
and without planning and installation): 13,000 to 18,000 €
Technology distribution in Europe (non‐exhaustive list): Germany, Austria, Italy, Belgium, Luxembourg,
Hungary, Czech Republic, Spain, Slovenia, Slovakia, Poland, Sweden, The Netherlands, Lithuania,
Ireland, United Kingdom, Greece, France, Estonia, Denmark
Applicability: This technology is regarded general applicable throughout the EU. It can be used in new
or renovated smaller and larger buildings (low‐energy building, single‐family house, apartment building,
agriculture, services) and for small district heating systems (micro systems). The application is most
sustainable if the biomass is harvested locally to avoid additional emissions by transport.
3.2 Pellet boilers with low emissions, possibly in combination with zero‐
emission systems
3.2.1 Pellet boilers with low emissions
Innovation: Underfeed pellet combustion with integrated particulate separation using cyclone effect,
enhanced lambda probe technology, low particulate matter emissions.
Technology description: Underfeed combustion reduces dust turbulence, the fire bed stays stable. An
innovative broadband lambda probe and newly developed ceramic igniter elements reduce emissions
due to enhanced combustion control. Special heat exchange elements result in low flue gas
temperatures and 96 % combustion efficiency. Geometric design of the integrated particulate
separation using the cyclone effect causes turbulence in combustion gas. Therefore heavy dust particles
are separated.
Rated heat output: 8 to 35 kWth, minimum capacity of specific design: 2.5 kWth
Market launch of the described technology: Approximately 2009
Test bench emission for market approval: 5 mg/m³ PM and 11 mg/m³ CO at full load and 13% dry flue
gas oxygen level.
Investment costs: (without costs for the storage of pellets, for heat distribution and for the chimney
and without planning and installation): About 5,500 to 13,000 €
18Technology distribution in Europe (non‐exhaustive list): Germany, Austria, Italy, Belgium, Spain,
Slovenia, Hungary, Sweden, Ireland, United Kingdom, France, Denmark
Applicability: This technology is regarded general applicable throughout the EU, preferably in well
insulated buildings (new or renovated). It can be used in new or renovated smaller and larger buildings
(low‐energy building, single‐family house, apartment building, agriculture, services). The application is
most sustainable if the biomass is harvested locally to avoid additional emissions by transport, although
pellets imported from outside Europe have a large market share.
3.2.2 Pellet boilers with low emissions and integrated electricity generation (Micro‐
CHP)
Innovation: Condensing pellet boiler with up to 107 % thermal efficiency, efficient combustion control,
adjustable boiler temperature (28 °C to 85 °C), possibility to upgrade with Stirling engine for power
generation and combination with solar thermal collectors and photovoltaics.
Technology description: The combustion process is optimized by a multi‐segmented burner plate, an
advanced combustion chamber sensor and pressure monitoring. Energy efficiency is increased by using
condensing technology. The boiler provides user‐friendly interface and dust‐free emptying of the ash
container. The system`s features can be extended by electricity generation by using a Stirling engine.
Rated heat output: 3 up to 18 kWth
Market launch of the described technology: 2014 (2017 with power generation)
Test bench emission for market approval: 12 mg/m³ PM and 4 mg/m³ CO at 13 % dry flue gas oxygen
level.
Investment costs: (without costs for the storage of pellets, for heat distribution and for the chimney
and without planning and installation): About 9,000 to 11,500 € (without additional technologies such
as Stirling engine or Photovoltaics)
Technology distribution in Europe (based on the distribution system of one manufacturer): Germany,
Austria, Italy, Belgium, Czech Republic, Spain, Slovenia, The Netherlands, Ireland, United Kingdom,
France, Denmark
Applicability: This technology is regarded general applicable throughout the EU, preferably in well
insulated buildings (new or renovated). It can be used in new or renovated smaller and larger buildings
(low‐energy building, single‐family house, apartment building, agriculture, services). The application is
most sustainable if the biomass is harvested locally to avoid additional emissions by transport.
3.2.3 Pellet boilers with low emissions and integrated heat pumps
Innovation: Pellet boiler and heat pump hybrid system, combination with photovoltaics possible
Technology description: This product combines the use of pellets, ambient heat and electricity
production. A software adjusts the system to the most economical or efficient operational mode,
depending on the homeowners preferences.
Rated heat output: 10 to 16 kWth, minimum capacity of specific design: 2.5 kWth
19Market launch of the described technology: 2016
Test bench emission for market approval: 17 mg/m³ PM and 9 mg/m³ CO at 13 % dry flue gas oxygen
level.
Investment costs: (without costs for the storage of pellets, for heat distribution and for the chimney
and without planning and installation): About 9,000 to 10,000 € (combination with a heat pump with a
rated heat output of 10 or 16 kWth for ambient air would cause additional costs of 4,000 to 6,000 €).
Technology distribution in Europe (non‐exhaustive list): Germany, Austria, Italy, Czech Republic,
Hungary, Slovakia, Slovenia, Belgium, The Netherlands, Ireland, United Kingdom, Spain, France,
Denmark
Applicability: This technology is regarded general applicable throughout the EU, preferably in well
insulated buildings (new or renovated). It can be used in new or renovated smaller and larger buildings
(low‐energy building, single‐family house, apartment building, agriculture, services). The application is
most sustainable if the biomass is harvested locally to avoid additional emissions by transport.
3.3 Log wood boilers with low emissions and integrated heat pumps
Innovation: Wood carburettor boiler with rotating combustion chamber and heat pump hybrid system,
can be combined with photovoltaics
Technology description: This product combines the use of log wood, ambient heat and electricity
production. This technology combines the efficiency (up to 94 %) of the wood carburettor (with
temperatures of above 1,400 °C in the ember bed instead of only 1,000 for the improved combustion
quality) and the economic viability of a heat pump. The hot combustion zone for exceptionally tolerant
burnout characteristics is enabling the appliance to handle wood of varying quality. This technology
provides a tolerant combustion for different levels of moisture content in hard and softwoods, as well
as woodchips. A rotary combustion chamber for complete burnout with effective separation of airborne
ash, ensuring the best possible emission values supported by an advanced Lambda probe and dual‐
controlled preheated secondary air. An automatic hot air ignition system further serves convenient
operability with low emission in the combustion starting phase. Furthermore the automatically
sustained ember is reducing the number of starts. For high combustion energy efficiency in every
output range the facility is using downstream turbulators at the heat exchanger including semi‐
automatic cleaning. Regarding energy efficiency of the combined heat pump this part of the technology
is very efficient for the use with an ambient air temperature higher than 7 °C and a low temperature
heat distribution system with less than 35 °C. The intelligent management system automatically adjusts
the system to the most economical or efficient operational mode, depending on the homeowners
preferences.
Rated heat output: 14 to 30 kWth, modulation down to 2,5 kWth
Market launch of the described technology: Approximately 2014
Test bench emission for market approval: 11 mg/m³ PM and 89 mg/m³ CO at 13 % dry flue gas oxygen
level.
Investment costs: (without costs for the storage of fuels, for heat distribution and for the chimney and
without planning and installation; heat pump excluded): About 7,000 to 12,000 €
20Technology distribution in Europe (non‐exhaustive list): Germany, Austria, Italy, Czech Republic,
Hungary, Slovakia, Slovenia, Belgium, The Netherlands, Ireland, United Kingdom, Spain, France,
Denmark
Applicability: This technology is regarded general applicable throughout the EU, preferably in well
insulated buildings (new or renovated). It can be used in new or renovated smaller and larger buildings
(low‐energy building, single‐family house, apartment building, agriculture, services). The application is
most sustainable if the biomass is harvested locally to avoid additional emissions by transport.
3.4 Log wood stoves with low emissions and high energy efficiency
Innovation: Log wood stove with two combustion chambers, high energy efficiency with up to 93 %,
low particulate matter emissions compared to traditional stoves
Technology description: Two flames are burning in two directions: one upward and one downward. In
the first upper combustion chamber the log wood is dried and gasified in an almost oxygen‐free
atmosphere at a temperature between 1,000 and 1,200 °C. In the second combustion chamber the
resulting gases are converted into heat using fresh air. The system can be operated without using a fan.
A 180 ° sluggishness separation of the fine particulate matter in the exhaust gases is applied in the
lower combustion chamber to reduce emissions. The energy efficiency during a whole burning‐hour is
more than 90%. The technology is producing up to 40% less ash compared to usual stoves and provides
constantly low emission of particulate matter and CO including at partial and minimum heat output
load.
Rated heat output: 5 to 8 kWth. The minimum heat output load is 2 kWth.
Market launch of the described technology: 2007
Test bench emission for market approval: 20 mg/m³ PM and 625 mg/m³ CO at 13 % dry flue gas oxygen
level.
Investment costs: (without costs for the storage of log wood and for the chimney and without planning
and installation): About 2,500 to 6,500 €
Technology distribution in Europe (non‐exhaustive list): Germany, Sweden, Austria, Italy, Greece,
Latvia, Lithuania, Poland, Czech Republic, Hungary, Romania, Slovakia, Slovenia, Belgium, The
Netherlands, Luxembourg, Ireland, United Kingdom, Spain, France
Applicability: This technology is regarded general applicable throughout the EU, preferably in well
insulated buildings (new or renovated). It can be used in new or renovated smaller and larger buildings
(low‐energy building, single‐family house, apartment building, agriculture, services). The application is
most sustainable if the biomass is harvested locally to avoid additional emissions by transport.
3.5 Electrostatic precipitators
Innovation: Reduction of particulate matter in the flue gas of small scale combustion sources.
Technology description: Electrostatic precipitator (ESP) for the removal of fine particulate matter which
is installed either at the exhaust pipe between the small combustion plant for solid fuels and the
chimney or in the chimney itself. This ESP comprises the following main components: the filter
21cartridge, the high voltage electrode with 15 to 20 kV and the temperature sensor. The ESP can be used
up to a maximum exhaust temperature of 200 °C.
The facility needs a maintenance interval of one‐time per year for the entire facility and four‐times per
year for the cartridge for the soot.
The electric power consumption in operation is typically between 20 and 50 W (Standby 0.5 W). The
precipitation rate of particulate matter at the test bench of a high quality filter facility is between 57 %
and 81 % with 73 % in average. It is expected that up to 70 % reduction of particulate matter will be
achieved over longer operation periods.
The ESP can be applied at small combustion facilities for solid fuels with an appropriate rated heat
output up to 100 kWth
Market launch of this technology: 2014
Investment costs: (without costs of planning, installation, service and maintenance): About 800 to
4,000 €.
Technology distribution in Europe (non‐exhaustive list): Germany, Finland, Sweden, Austria, Italy,
Greece, France, United Kingdom, Belgium, The Netherlands, Luxembourg, Czech Republic, Hungary
Applicability: This filter technology is applicable at small scale combustion installations using solid fuels
at smaller buildings of all thermal quality and for energy efficient renovated larger buildings. A
successful application of this technology for emission reduction on medium and long‐term would need
high attention or control of quality of planning, installation, service, maintenance and of the proper use
of manually operated facilities – especially on appropriated and admitted fuel.
224 Good practice examples and case studies
The good practice examples presented in this section demonstrate the positive impact of strategies and
measures to implement new technologies and to promote the restructuring of heating system towards
less polluting forms of heating across the EU 28. These examples show how strategies and measures
impact on the implementation of new technologies and how the restructuring of heating systems
towards less polluting systems can be achieved. The following is a non‐exhaustive list of activities
relevant to consider for the reduction of emissions from domestic heating:
Administrative measures, including:
- Awareness raising for appropriate operation of household combustion devices, trainings
and information campaigns,
- Registration of combustion facilities and inspections,
- Provisions for proper installation and improved maintenance,
- Emission standards for household combustion appliances: regulations of in‐situ emissions
(e.g., emissions limit values for the operational phase),
- Ecodesign provisions for solid fuel stoves and boilers (addressing PM2.5, organic gaseous
compounds, CO and NOx.),
- Energy‐labelling provisions for solid fuel stoves and boilers (bench test for placing on the
market),
- Improved fuel standards (e.g., regarding sulphur content, moisture content, content of
ashes and heavy metals);
Strategies for phasing out high‐polluting solid fuel combustion, including:
- Substitution of solid fuels by zero‐emission technologies (e.g., ambient heat), low air‐
emission technologies (e.g., natural gas) or district heating,
- Fiscal incentives including scrapping schemes,
- Bans and restrictions on solid fuel use;
Strategies and measures to address energy efficiency, including:
- Energy‐efficient building renovation,
- Improved heat management;
Strategies and measures to address fuel poverty, including:
- Measures to avoid fuel poverty, overcome investment hurdles, and avoid illegal (waste)
burning,
- Combined measures addressing energy poverty and non‐discrimination of people with
lower incomes.
In the following examples and case studies will be presented (Section 4.10).
234.1 Awareness raising, training, and information campaigns
Awareness raising campaigns for appropriate operation of household combustion devices can be found
in many MS. In order to increase the citizens awareness of heating problem and to motivate them to
change their behaviour, e.g., the Czech Republic, Germany, Sweden, South Tyrol and Austria compiled
brochures, folders, and homepages with detailed information.
4.1.1 Environmental labelling
The Blue Angel is a certification for environmentally sound products and services in Germany and is
recognised as a member of the international Global Ecolabelling Network (GEN).
The Global Ecolabelling Network (GEN) is a non‐profit association of third‐party environmental
performance recognition, certification and labelling organisations. It was founded in 1994 to improve,
promote and develop the eco‐labelling of products and services, and has currently around 30 members.
Only environmentally‐friendly products and services proven to have lower environmental impact may
carry a GEN member ecolabel. Criteria and product categories differ among the member countries,
reflecting local and regional conditions, but all standards address multiple environmental attributes and
most have requirements for items such as toxicity, air quality, energy use, reusability and recyclability,
VOCs, carcinogens and other issues of concern.
Similar eco‐labelling programmes have been introduced by Sweden (environment labelling ‘TCO
Certified’ and ‘Good Environmental Choice’), in Nordic countries (environment labelling ‘Nordic Swan
Ecolabel’), and the European Union with the ‘EU Ecolabel’.
Since 1990, the Austrian ecolabel ‘Österreichisches Umweltzeichen’ provides guidance to consumers,
manufacturers and public procurement on environment, health and quality.
Sources: GEN (2016);
The Austrian Ecolabel – Das Österreichische Umweltzeichen (2017): Vision
https://www.umweltzeichen.at/cms/de/home/vision/content.html
Nordic Swan: http://www.nordic‐ecolabel.org/about/
General evaluations of environmental labelling systems are provided in:
http://ec.europa.eu/environment/ecolabel/documents/Report_from_the_Commission.pdf
https://www.umweltbundesamt.de/publikationen/25‐jahre‐blauer‐engel‐aelteste‐
umweltzeichen‐welt
4.1.2 Public education ‐ Italy
The public sharing of local air pollution monitoring with households with biomass heating appliances
has proved to increase the perception of health risk from emissions and the assimilation of information
regarding good burning techniques amongst end‐users in Italy. In addition, poor installations and fuel
management practices were identified to cause significant poor indoor air quality. Results were
discussed with the appliance owners leading to adoption of more effective practices to manage
emissions from their appliances during the following even colder winter period.
Sources: AIRUSE (2016) ; Piccardo et al. (2014)
244.1.3 Awareness campaigns ‐ Austria, Switzerland, Germany, Denmark
The Austrian campaign ‘Richtig Heizen’ (proper heating) was launched by the Federal Ministry of
Agriculture, Forestry, Environment and Water Management (BMLFUW). This initiative is carried out in
co‐operation with the national organization of chimney sweeper (‘Wärmetechnische Gesellschaft der
Rauchfangkehrer’), the national association for tiled stoves (‘Kachelofenverband’) and the initiative
‘Medicals for a Healthy Environment’ (‘Ärzte für eine gesunde Umwelt’). Additionally, similar
information and awareness initiatives are established in Austria by some regional authorities, mainly by
offering information on the Internet.
The aim of the campaign ‘Richtig Heizen’ is to provide technical information and support to the
consumers regarding energy efficiency and emission reductions. For instance, an easy way to effectively
reduce emissions from manually stoked wood stoves is the ignition technique from above. This
campaigning is intended to improve the use of appliances for household heating and heating of
buildings and for hot water preparation. In addition, the campaign aims to support decision makers to
invest in emission free and low emission facilities.
The homepage provides an online‐calculator, the folder ‘Richtig Heizen’ and informal events at
exhibitions. The folders are also distributed by the national organization.
The LIFE project ‘Clean Heat’ by Deutsche Umwelthilfe and the Danish Ecological Council provides
information on wood burning on their website. Information material, publications and movies were
prepared to inform on the environmental impact of wood burning and proper operation wood stoves.
Sources: http://www.richtigheizen.at/, http://www.clean‐heat.eu/en/home.html
Switzerland has established a similar awareness campaign, called ‘Fair Feuern’ (fair heating). The central
idea of this initiative is the dissemination of knowledge about innovative ignition of fire in manually
operated stoves with log wood starting the fire from the top. This reduces particulate matter emissions
dramatically in the starting phase. The campaign also provides information on energy efficient
operation with low emissions for all phases of the combustion cycle, as well as on maintenance of
equipment and the storage of wood, on different biomass fuels, on good practice in planning of small
scale combustion facilities with biomass and about regulations on these facilities. The initiative has been
based on local initiatives triggered by air quality problems due to adverse dispersion conditions in
valleys within the heating period.
Source: http://www.fairfeuern.ch/
4.1.4 The ‘Smoke‐man’ campaign ‐ Czech Republic
The comic figure ‘Smoke‐man’ was created at the Energy Research Center (ERC) in Ostrava in the 1970s.
The ERC also organizes an educational show ‘Smokeman in action’ for children and adults in order to
instruct the public about proper combustion practices in local heating.
Smokeman arrives in a mobile boiler home, in different towns and offers practical and interesting
demonstrations for kids like how to measure the flame temperature using a thermocouple or a thermal
camera or conduct an experiment where the children learn how they can at home create a temperature
inversion using kitchen salt, water and food dye. The audience learns about the basic types of
combustion installations, their basic characteristics, how to choose proper wood and how to handle
properly boilers, stoves and fireplaces.
25In addition, Smokeman comics, a Website for demonstrating a show, interviews in Czech Radio Ostrava
and TV and ‘Smokeman's ten commandments’ have been created.
Sources:
http://vec.vsb.cz/smokeman/o‐smokemanovi/smokemanovo‐desatero.html
http://vec.vsb.cz/smokeman/katalog‐obrazku/clanek‐32/462‐komix1.pdf
http://vec.vsb.cz/smokeman/katalog‐obrazku/clanek‐32/463‐komix2.pdf
http://www.tvnoe.cz/video/11032
4.1.5 The Interreg project PMinter ‐ Austria and Slovenia
The EU‐funded ‘PMinter’ project, which was completed in 2013, developed tools and air pollution
control plans for air quality management and health protection in small‐ and medium‐sized cities, in
particular for Leibnitz and Klagenfurt (Austria) and Maribor (Slovenia). The project created a regional,
problem‐oriented, multiscale model system for air quality management for the border region between
Austria and Slovenia, which then identified household heating (in particular emissions from woodstove
combustion) as a major source of high PM10 concentrations in this region. Subsequently, a new Air
Quality Management Plan was developed and implemented, accompanied by public awareness raising
campaigns.
The air quality model simulations and the demonstration activities identified the following measures as
highly efficient for reducing negative health impacts from wood combustion while at the same time
pursuing climate protection objectives:
Establishing biomass district heating systems in urban areas: Connecting households using old
single stoves to district heating systems has a large potential to reduce the annual number of
days with a daily mean PM10 value >50 μg/m³ in Klagenfurt;
Guidelines for low‐pollution heating‐systems;
Schemes to promote the replacement of old wood‐fired ovens (the need to use modern
biomass stoves);
26You can also read