Renewable and Sustainable Energy Reviews - IDEAS Lab
←
→
Page content transcription
If your browser does not render page correctly, please read the page content below
Renewable and Sustainable Energy Reviews 142 (2021) 110835
Contents lists available at ScienceDirect
Renewable and Sustainable Energy Reviews
journal homepage: http://www.elsevier.com/locate/rser
Data requirements and performance evaluation of model predictive control
in buildings: A modeling perspective
Sicheng Zhan, Adrian Chong *
Department of Building, School of Design and Environment, National University of Singapore, 4 Architecture Drive, Singapore, 117566, Singapore
A R T I C L E I N F O A B S T R A C T
Keywords: Model predictive control (MPC) has shown great potential in improving building performance and saving energy.
Model predictive control However, after over 20 years of research, it is yet to be adopted by the industry. The difficulty of obtaining a
Control-oriented model sufficient control-oriented model is one major factor that hinders the application. In particular, what data is
Data requirements
required to build the model and what control performance can be expected with a certain model remain unclear.
Level of detail
Performance evaluation
This study attempts to uncover the underlying reasons and guide future research to tackle the challenges. It starts
Model identification by clarifying a finer categorization of past studies with respect to both modeling methods and modeling purposes.
An extended Level of Detail (LoD) framework is proposed to quantify the data usage in each study. Accordingly,
meta-analyses are conducted to compare the data requirements of different modeling categories. The criteria and
approaches for model performance evaluation are summarized and classified into validation and verification
methods, followed by a discussion about the relationship between the model and control performance. The
critical review provides new perspectives on the data requirements and performance evaluation of control-
oriented models. Ultimately, the paper concludes with five directions for future research to bridge the gaps
between data requirements, model performance, and control performance.
1. Introduction attributed to the relatively high requirements on modeling, expertise,
data, hardware, usability, and costs [9,10]. Reducing the modeling
1.1. MPC and control-oriented models effort and enhancing the model reliability are still essential problems to
tackle.
Buildings take up 30–40% of global greenhouse gas emission and Fig. 1 displays the typical framework of MPC. Three main processes
energy consumption [1], among which up to 85% is consumed in the are involved in obtaining the control decision: disturbance forecast,
operation phase [2]. Building system control is a challenging task control-oriented model, and optimization. While all the three processes
because of the varying system dynamics and disturbances. At present, are essential, the control-oriented model has been acknowledged as the
PID control are mostly used in practice, yielding the unsatisfactory cornerstone of MPC [11,12]. Disturbance forecast provides the bound
performance if not well-tuned and the absence of multi-objective su ary condition for the control-oriented model over the prediction hori
pervisory control [3]. These suggest the great energy-saving potential of zon, such as ambient conditions [13], occupant presence [14], and
implementing advanced optimal control schemes. energy prices [15]. Under the boundary condition, the control-oriented
Model Predictive Control (MPC) was first applied for industrial model predicts the building’s thermal response and energy performance
process control [4] and has been tested in buildings since the 1990s [5, with different control decisions. Based on the model, optimization is
6]. It is capable of adapting different system dynamics and disturbances, applied to identify the optimal control decision. According to the
improving the thermal comfort conditions and energy performance modeling purposes and methods, building metadata and/or time series
simultaneously. The benefits are more prominent when the control task training data may be needed for model identification. The optimization
goes beyond setpoint tracking, such as occupancy-based control [7] or problem is defined by the objective function and the constraints, which
Demand Response (DR) applications [8]. However, not many actual are recently categorized in Ref. [16]. Different optimization algorithms
implementation cases are spotted over the years, which can be may be selected depending on the problem formulation and the model
* Corresponding author.
E-mail address: adrian.chong@nus.edu.sg (A. Chong).
https://doi.org/10.1016/j.rser.2021.110835
Received 26 July 2020; Received in revised form 24 January 2021; Accepted 15 February 2021
Available online 5 March 2021
1364-0321/© 2021 Elsevier Ltd. All rights reserved.
S. Zhan and A. Chong Renewable and Sustainable Energy Reviews 142 (2021) 110835
derivability [17]. To facilitate the optimization, a desirable model is accuracy. In the meantime, it is also deemed to be necessary that the
expected to have a simplified structure and high accuracy, requiring less models represent the building dynamics for better extrapolation capa
calibration and computational cost and maintaining certain physical bilities [27]. Control performance is reflected in the control results, such
significance [18]. as energy consumption, thermal comfort, and the like. Model and con
trol performance were shown closely related [28], but no quantitative
relationship has been established.
1.2. Past reviews and research gaps Besides, the comparison of modeling methods is conducted mainly
across the three fundamental categories. However, variations exist
To procure a satisfactory model is one of the main barriers to within the same category in terms of, for instance, data usage and pre
implementing MPC in buildings. As reported in Henze [19], building and diction performance. For example, while black-box models are generally
calibrating the models account for 70% of the total effort. In fact, it is not considered to be more accurate, different modeling techniques could
just modeling that is hard, but assessing the difficulty in advance as well result in up to 100% difference in prediction accuracy [29]. Also,
[11]. Due to the importance and difficulty of this process, extensive gray-box models are declared to require less building metadata than
research has been trying to tackle the challenge. Many review studies in white-box models and less training data than black-box models. Yet,
the past few years have discussed relevant issues. Fundamentally, the depending on different modeling purposes and model fidelity, gray-box
modeling methods are usually categorized into physical-based (white- models can use extensive metadata [30] or training data [31].
box), data-driven (black-box) and hybrid (gray-box) models [9,11,20]. Moreover, current discussions among different modeling methods
In addition to that, Li & Wen [12] covered the mechanism of different are conceptual and qualitative. The lack of quantitative investigation
building thermal response models, as well as models of energy storage leaves the modeling challenges unresolved. Hence, this study aims to
and generation systems. Afram & Janabi-Sharifi [21] summarized the promote the application of MPC in buildings by shedding some light on
specific modeling techniques used in each of the three categories and the modeling-related issues, specifically, two research questions:
introduced the general process from model creation to evaluation.
Mirakhorli & Dong [7] outlined the optimization techniques used cor • What is the necessary and desirable data to build a satisfactory
responding to different modeling methods. Hilliard et al. [17] catego control-oriented model? With the increasing deployment of
rized the modeling methods by different spatial scales and listed the building information modeling (BIM) and building management
inputs and outputs of representative studies. Atam & Helsen [22] systems (BMS), much more data is being generated over the building
reviewed and compared different modeling methods, specifically for life cycle, exerting a big challenge on data management and utili
Ground Source Heat Pumps (GSHP). Afram et al. [23] reviewed the data zation [32]. For MPC, among the numerous potentially useful data,
collection and handling issues specifically for the Artificial Neural Net what is really needed to build a satisfactory model remains an open
works (ANN) models. Rockett & Hathway [24] talked about the effect of question. Therefore, a framework to quantify the data usage in
model update, occupancy uncertainty, and data handling on the model different studies is needed to enable future studies and improve the
and control performance from a practical point of view. Afroz et al. [20] generalization capability.
defined the physical processes in the physical models of different • What is the minimum performance requirement of a control-
sub-systems, classified the sub-categories of black-box models (also oriented model? Root Mean Square Error (RMSE) is a typical
covered in Ref. [8]), and elaborated the pros and cons of the three metric that quantifies models’ prediction error, which has been
fundamental categories. The comparison is conducted with respect to shown insufficient to inform the control performance [33]. Mean
prediction accuracy, generalization capability, training data require while, there are other approaches and metrics for model evaluation.
ment, and complexity. Serale et al. [25] separated the white-box models On the other hand, only few studies have focused on how the model
into detailed simulation models and reduced-order models, and also performance would affect the control performance [33,34]. Thus,
differentiated the models as building, HVAC systems, and building with future research towards this direction could benefit from a system
HVAC systems. Fontenot & Dong [16] specified the main challenges in atic review and a deeper understanding of the model and controller
modeling as the high complexity of thermal models, and the un performance evaluation.
certainties in disturbances. Pallonetto et al. [26] also distinguished the
detailed and simplified white box, and thoroughly discussed the features
and calibration issues of detailed simulation models. 1.3. Scope and structure
There are three major gaps in the existing review studies. First,
despite the model’s well-known crucial role, a holistic review on model This paper gives a critical review on studies related to the control-
performance evaluation and its relationship with the control perfor oriented models used for MPC in buildings, mainly from the perspec
mance is missing. Model performance refers to the authenticity of tive of data requirements and performance evaluation. Section 2 pre
control-oriented models, which is usually evaluated by the prediction sents a new model categorization regarding modeling purposes and
Fig. 1. Typical MPC framework, control-oriented model as the cornerstone.
2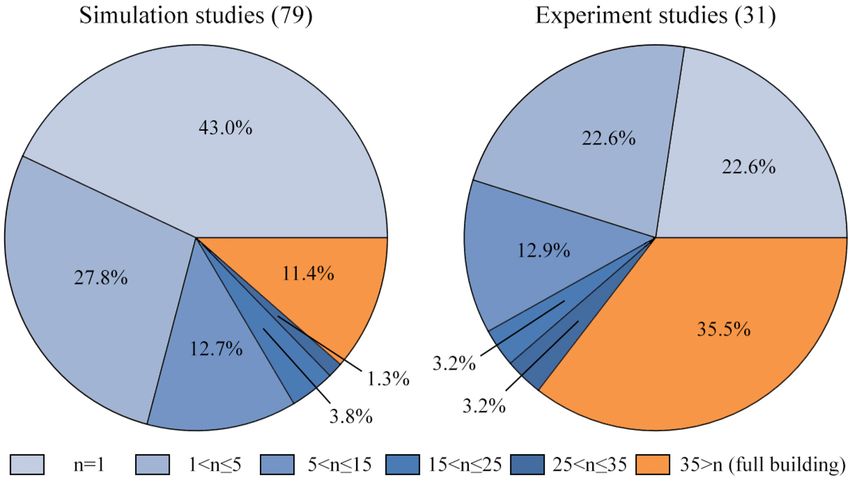
S. Zhan and A. Chong Renewable and Sustainable Energy Reviews 142 (2021) 110835
modeling methods. Section 3 proposes a novel Level of Detail (LoD) optimization problem tractable, especially when it comes to multi-zone
framework to quantify the data usage in model identification and con complex buildings [44]. Typical methods include Linear Approximation
ducts meta-analyses about the data requirements of different model [45], Balanced Truncation [46], Singular Decomposition [47], and
categories. Then, existing methods and conclusions of model and Proper Generalized Decomposition [48]. To maintain the physical
controller performance evaluation are reviewed in section 4. Section 5 structure in the reduced model, aggregation method [49] and iterative
discusses the major findings in this review and future research di trimming [50] were proposed. Considering the trade-off between model
rections. Finally, the study is concluded in section 6. complexity and accuracy, the minimum model complexity should be
preserved [34,51].
2. Model categorization Simulation-assisted identification uses high-fidelity models to
generate data for simplified model identification [52,53]. It is important
Past studies are first categorized according to the model types to to note the difference between these simulation-assisted identification
facilitate further analysis on data requirements and performance eval studies and simulation studies that use a high-fidelity model as a virtual
uation. In addition to the widely-accepted modeling method categori testbed to test the proposed gray or black-box model. The difference is
zation of white/gray/black-box, another dimension of modeling on the assumption that whether the detailed model is available in real
purposes is added to differentiate what the model predicts as load pre applications, in other words, what information is initially used to obtain
diction/thermal response/system performance. In this section, repre the controller model. In this sense, while the thermal network model
sentative studies are selected in each category to clarify the definitions structure, also known as the resistor-capacitor (RC) or lumped param
and variations. eter model, is more famous as a gray-box approach [54], it should be
considered a white-box if the parameters are determined by building
2.1. Modeling methods metadata.
The mechanisms and technical details of different modeling methods 2.1.2. Gray-box models
have been covered in several review papers [12,16,20]. These studies Gray-box models are typically based on the thermal network (RC)
classified model types based on the physical/hybrid/data-driven model model structure, using time series training data to identify the param
structures. Meanwhile, it is important to note the distinctions regarding eters [37]. There is no consensus on the optimal model complexity, i.e.
the data requirements. Table 1 summarizes the extended definitions of the number of R and C used to represent the building. While lower-order
white/gray/black-box models and their corresponding properties. models may not be able to catch the thermal dynamics, higher-order
model may reduce the parameter identifiability and lead to overfitting
2.1.1. White-box models problems [33]. Therefore, the model complexity is usually decided on a
White-box models, also known as physics-based models, are based on case-by-case basis and varies a lot. For instance, a 4R2C model was used
equations that describe the fundamental heat and mass balance, where to simplify the whole campus [55], yet a 6R2C model was applied to
the parameters are decided by domain knowledge, system specifica represent a single room [56]. Note that the RC models were transformed
tions, and actual measurements. In some cases, this category refers to into a State Space Model (SSM) form in many studies [57–59].
those well-established building simulation software that requires sub Compared with the SSM identified by Subspace State Space System
stantial metadata such as Energyplus [35,36]. As opposed to other Identification (4SID) [60], they are still gray-box models as the param
models that are built explicitly for control [37], those models are not eters have their physical meaning.
ideal for forming standard optimization problems. However, with the Algorithms used for parameter identification include Maximum
presence of derivative-free optimization methods such as Genetic Al Likelihood Estimation (MLE) [10], Least Squares [61,62], Interior Point
gorithm (GA) [38] and Particle Swarm Optimization (PSO) [39], and [56], GA [63], PSO [64], Non-Linear Programming (NLP) [65],
tools like JModelica [40], these programs are also applicable for MPC agent-based [66], and MPC Relevant Identification (MRI) [67].
and therefore are considered in this study. Complementarily, properly define the initial guesses and bounds for the
Still based on building metadata, simplified white-box models are parameters can improve the identification results [33]. The time series
developed to be more suitable for optimization. There are three kinds of data used for identification can be classified into real operation data and
approaches: physical inference, model reduction, and simulation- designed excitation data. Excitation experiments apply designed input
assisted identification. OptiControl is the most famous project using signals such as Pseudo-Random Binary Sequence (PRBS) [68] and step
physical inference, where a thermal network model was built for an function [69]. Having the opportunity to explore a wider range and
office building, and the parameters were decided according to the decompose the coupled thermal effects, the experiments do not guar
specifications [41]. Due to the nonlinear nature of the resulting model, it antee the thermal comfort and therefore is costly and intrusive. For real
was linearized at each time step, and Sequential Linear Programming operation data, MRI was shown to be able to compensate for the poor
was applied for control optimization [13]. This process of model con quality or excitation [27].
struction and parameter inference is not intuitive, so automation tools
have been built [42,43]. 2.1.3. Black-box models
Model reduction is applied to reduce the complexity or the number of The model structures used for black-box modeling are more diver
states of the full-order models so that the computational cost is reduced sified than the previous two categories, including linear regression [70],
with the expense of accuracy loss. This is a critical step to make the decision tree regression [71], SSM [72], Autoregressive Exogenous
Table 1
Characteristics of the three modeling methods.
Modeling methods Definitions Properties
Model structure Data requirements Calibration/identification efforta Optimization cost
White-box physics/simplified physics building metadata high low - highb
Gray-box simplified physics metadata & time series data medium low
Black-box machine learning, statistical, etc. time series data low low - highb
a
Qualitative need of expert knowledge and human interference when calibrating/identifying the models.
b
Depending on model structure. Optimization cost is low when derivative-based is applicable.
3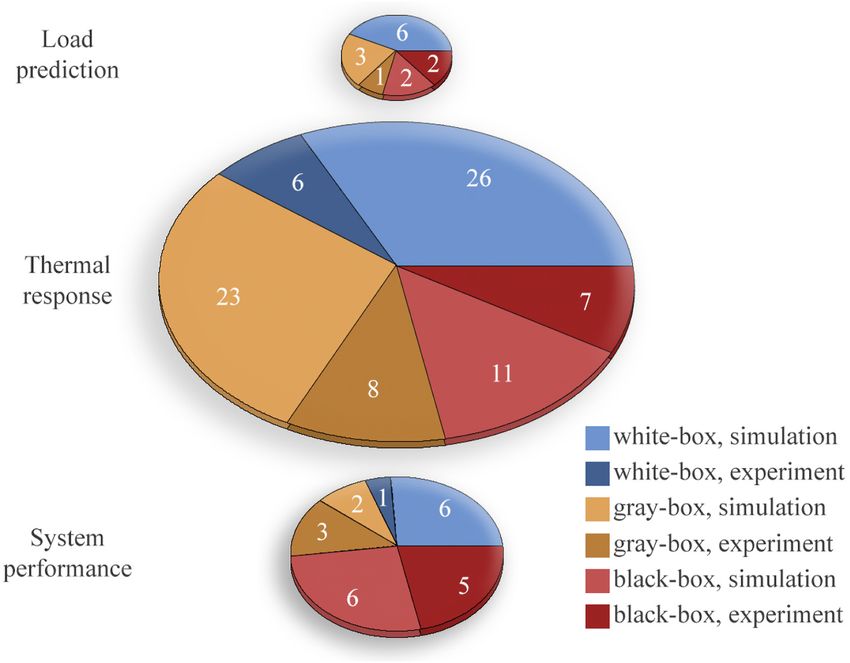
S. Zhan and A. Chong Renewable and Sustainable Energy Reviews 142 (2021) 110835
(ARX) type models [73,74], Support Vector Machine (SVM) [75], Arti tracking. West et al. [95] showed less energy consumption while
ficial Neural Networks (ANN) [76], and ensemble models [77,78]. maintaining a similar level of Predicted Percentage of Dissatisfied (PPD).
Model complexity selection is required for models such as SSM [29], More conservatively, Chen et al. [77] provided better thermal comfort
ARX [79] and ANN [80]. Similar to the gray-box models, too complex by using more energy than a well-tuned Rule-Based Control (RBC). It is
model could lead to overfitting [81]. Without the physical implication, worth noting that while load prediction models are solely applicable for
black-box models generally have worse extensibility (extrapolation DSM studies, plenty of thermal response models were also used in DSM
capability) [82]. Therefore, the training data is expected to cover the studies [10,70,96]. When necessary, the thermal comfort can be prior
seasonal variation [20]. itized over fulfilling Demand Response (DR) requests [68].
Though black-box models are claimed to be more suitable for large
scale systems [52], control-oriented modeling for multi-zone complex 2.2.3. System performance
buildings is still a challenge, regardless of the modeling methods [37]. In addition to the building thermal response, this category added
Simply aggregating single-zone models to form a centralized model detailed HVAC system performance models, bringing the benefit of
would lead to too many states and an intractable optimization problem further optimizing the system operating conditions. For example, Kusiak
[64]. On the other hand, decentralized models that neglect the thermal et al. [76] saved around 20% by avoiding unnecessary cooling and
interaction between adjacent zones cannot guarantee the performance reheating, Coninck & Helsen [97] improved system performance by first
[83]. Thus, distributed MPC was proposed to take advantage of decou using the system with higher efficiency, and Drgoňa et al. [98] achieved
pled optimization while considering the thermal interaction [84]. more than 50% energy saving by recirculating as much as possible hot
Meanwhile, depending on the building’s thermal characteristics, no water within the Thermally Activated Building System (TABS).
significant difference was found between centralized and decentralized Recently, Cupeiro Figueroa et al. [99] demonstrated the extra energy
methods [85], or even a single zone approximation achieved similar saving of having a nonlinear Coefficient of Performance (COP) model
performance [83]. and a dynamic borefield model, compared with simpler static models. As
more data and system dynamics are involved in this category, integrated
2.2. Modeling purposes modeling methods are sometimes used. In Ref. [69], 4SID was applied to
identify the zone thermal response model, while semi-physical models
Even within each of the three kinds of modeling methods, significant were built for sub-systems’ performance. By contrast, Coninck & Helsen
variations exist in the data requirements and performance evaluation. [97] used an RC model for the thermal dynamics of an office and linear
Therefore, the control-oriented models are further categorized by their regression to fit the COP equation.
purposes according to the predicted and controlled variables. Essen
tially, the three modeling purposes are differentiated by the underlying 2.3. Categorization
assumptions (Table 2).
113 studies about MPC in buildings during the past ten years were
2.2.1. Load prediction reviewed and categorized by their modeling purposes and methods
In load prediction models, only the electricity or thermal load during (Table 3). 33 (27.9%) of the studies are actual experiments, which are
the prediction horizon is predicted, assuming that ideal HVAC systems also distinguished from the simulation-based studies in the table and
track temperature setpoints well. Load prediction models are mainly Fig. 2. Five papers that used integrated models are assigned to two
used for Demand Side Management (DSM) applications involving grid categories and counted twice, resulting in 118 models. Based on the
interaction [86] or thermal storage systems [55]. Cole et al. [87] built an categorization results, several observations can be summarized:
Energyplus model and generated training data with perturbation to fit a
quadratic model for power prediction. Ogunsola et al. [88] applied an • Regarding modeling methods, white-box models have the largest
RC model without the indoor temperature node based on the idealistic population of 45, followed by gray-box (40) and then black-box (33).
assumption. Time series models were used more often in this context While the hybrid modeling method is considered promising with
[89,90]. Many grid-interactive studies emphasized the optimization and combined benefits of the other two, it is not adopted more
coordination between different sub-systems [26] and neglected the frequently. Interestingly, considering only the experimental studies,
uncertainty in load prediction. Perfectly known load profiles with [91] the ranking becomes black-box (14), gray-box (12), and white-box
or without [92] randomization are used for simulation, or even imitated (7). Black-box models being more welcome in actual experiments
in an experiment using a load bank of resistors [93]. may be attributed to the extra domain knowledge requirements of
the other two. The significantly lower percentage of experiments in
2.2.2. Thermal response white-box models affirms this. In general, none of the three methods
Thermal response models consider the thermal response of buildings shows the dominance in past studies.
to incorporate thermal comfort in the optimization problem. The • Among the three modeling purposes, thermal response accounts for
assumption of static or ideal HVAC system performance is still held. In the largest number of studies. This is because providing thermal
these studies, the indoor thermal condition is predicted, given certain comfort to occupants is one main function of the built environment,
disturbances and control inputs. The trade-off between thermal comfort and therefore the thermal response is not negligible when optimizing
and energy consumption can be dealt with by a) including comfort control. On the other hand, HVAC system models are more data-
violation in the optimization objectives [78] or b) applying thermal intensive and make the optimization problems nonlinear and non-
comfort constraints [94]. Ma et al. [73] demonstrated significant convex. Another potential reason is that this review mainly focuses
improvement in both energy performance and temperature setpoint on building-level modeling and control. Readers interested in more
Table 2
Characteristics of the three modeling purposes.
Modeling methods Definitions Properties
Predicted variables Assumptions Data requirements Applications
Load prediction electricity/thermal load ideal temperature setpoint tracking low demand response, microgrid, etc.
Thermal response building thermal response static/ideal HVAC system performance medium microgrid, building level control, etc.
System performance building load & thermal response None high building/system level control
4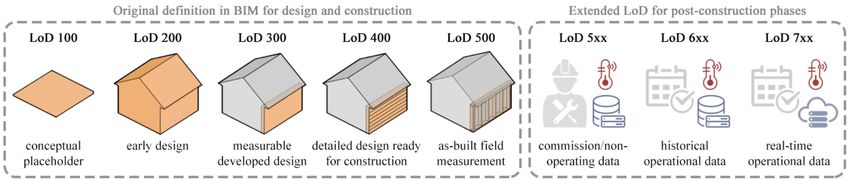
S. Zhan and A. Chong Renewable and Sustainable Energy Reviews 142 (2021) 110835
Table 3
Categorization of 113 papers according to model methods and model purposes.
Modeling Modeling methods
purposes
White-box Gray-box Black-box
Load prediction [53,87,91–93,104] [63,82,88], [55]a [86,89], [90,105]a
Thermal response ,[13–15,34,38–40,42,44,46,47,49,50,52,96, ,,,,,,,,,,,,,[27,28,30,33,43,56–58,64,65,67,83,85,122–131], [68–71,77,79,81,84,134–138], [72,74,
106–116], [94,117–121]a [10,59,61,62,95,97,132,133]a 78,80,139–141]a
System [99,142–146], [98]a [31,147], [66,69]a ,,,,,,[29,76,148–151], [55,73,97,132,
performance 152] a
a
Demonstrated with actual experiments.
Fig. 2. Proportion of each category in the reviewed studies.
details about grid-level or system-level models are referred to these 3. Data requirements
two review papers [16,100].
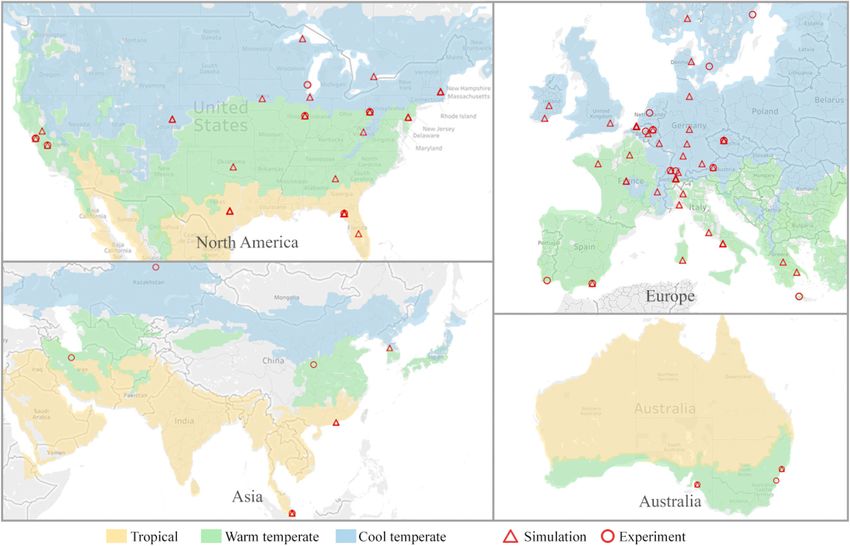
• The geographical distribution of these studies is displayed in Fig. 3, Depending on the modeling methods and purposes, as well as
where the color overlays represent the main climate zones [101], building systems, different data or information is used to build the
triangles are simulation studies, and circles are experimental studies. model. Data availability and resolution are critical for model calibration,
Most (83.9%) studies are located in the temperate, especially cool for either white-box methods [153] or data-driven methods [154].
temperate zones. Compared with the large population in North Meanwhile, data management and utilization have become a challenge
America and Europe, there might be great potential to exploit in the with the increasingly available data over the building life cycles [32,
large area with a similar climate in Asia. One desired building 155]. Hence, a framework based on extended Level of Detail (LoD) is
characteristic for MPC, especially for load shifting applications, is proposed to quantify and categorize data (including building metadata
higher thermal mass [102]. Therefore, the smaller number of studies and time series data) used for modeling in past studies.
in the tropical area is possibly due to the relatively lighter envelop.
However, performance improvement is still achievable [30], and
3.1. Definition of extended Level of detail
integrating renewable energy may bring better opportunities [103].
• Regarding the modeling and control scales, the proportions of the
In the context of Building Information Models (BIM), Level of Detail
number of controlled zones are displayed in pie charts (Fig. 4). In
(LoD), or Level of Development, defines and illustrates inputs and in
total, 34.7% (41) studies are demonstrated in single zones, while
formation requirements of the different levels for building elements.
only 16.9% (20) are full-scale applications. The lack of large-scale
This clear articulation allows model authors to define what their models
cases, regardless of simulation/experiment, agrees with Rockett &
can be relied on for, and allows downstream users to clearly understand
Hathway [24]. However, the ratio of full-scale demonstration in
the usability and the limitations of models they are receiving [156]. The
creases to 35.5% considering only experiments, whereas 70.8%
original theme of LoD aligns with the need for control-oriented models
simulation studies used less than five zones.
to clarify the required data and to further imply the performances.
However, as illustrated in the left part of Fig. 5, the original LoD defi
nition and some extension studies [157,158] all focused on the design
and construction phases, considering the static characteristics of
5
S. Zhan and A. Chong Renewable and Sustainable Energy Reviews 142 (2021) 110835
Fig. 3. Geographical distribution of the reviewed simulation and experiment studies. Color overlays reflect three main climate zones.
Fig. 4. Proportion of the number of controlled zones (n) in the reviewed studies. Full building applications are counted as >35.
building elements. Becerik-Gerber et al. [159] noted the increasing need data used for MPC. The extended LoD inherits the original form of using
for identifying non-geometric data requirements to apply BIM for fa three-digit numbers to describe certain levels, yet endowing every digit
cility management but overlooked the considerable variation in time with an actual interpretation: time validity, measurement granularity,
series data. and temporal resolution. Fig. 6 displays the definitions and in
This paper extends the original definition to take in time series sensor terpretations of each digit. The sankey flows denote possible
6
S. Zhan and A. Chong Renewable and Sustainable Energy Reviews 142 (2021) 110835
Fig. 5. The original LoD definition in BIM and the extended definition for time series sensor data.
Fig. 6. Definition of the extended Level of Detail (LoD). The sankey flows represent the LoD levels appearing in the literature. The widths of Sankey flows and the
heights of bars reflect the usage frequency of each possible level.
combinations of the three digits. Meanwhile, the usage frequencies of the system architecture [30]. For clarification, while real-time data is
each LoD in the reviewed papers are reflected in the widths of sankey normally used when implementing control, level 7 is meant to distin
flows and the heights of bars. In general, larger LoD implies a higher cost guish models that are regularly updated [95,140]. Compared with level
of data acquisition. Apart from the sensor and operating costs, data 5, time series data at level 6 and 7 are fully exposed to uncertainties and
storage, exchange, processing, and computing all introduce additional closer to real operation.
costs [160].
3.1.2. Measurement granularity
3.1.1. Time validity The second digit means the measurement granularity. Again, level
The first digit represents the time validity of data, i.e., how up-to- 0 is stuck to the BIM definition for building metadata. For time series
date the data is. LoD 400 is simply adopted from BIM for building data, level 1 includes the principal variables that are usually measured
metadata as detailed and accurate design information, ready for con for building operation, level 3 contains the detailed measurements to
struction. As an example, Kwak et al. [107] used design drawings to describe the object more accurately, and level 5 is the advanced mea
build an Energyplus model. Level 5 involves field measurement, surements taken for specific purposes, subject to customized change. As
including as-built metadata [14] and time series data from designed illustrated in Table 4, The four basic levels of LoD refer to different
experiments [139]. The measurement is typically conducted during specific variables for the six data categories: energy consumption, in
building commissioning or other non-operating periods to avoid door condition, internal disturbance, external disturbance, system con
intruding on occupants [73]. Since verification of metadata is usually dition, and envelop condition. The categories are inspired by the one
carried out, the white-box models are considered using level 5 unless proposed by Mahdavi & Taheri [161] and modified to fit the data re
explicitly pointed out. Although LOD 400 is rarely mentioned, evolving quirements of control-oriented models.
from that improves the compatibility with BIM definition. Level 6 refers
to historical data collected during real operation, which is commonly • Energy consumption (EN) of the entire building is usually
used for gray-box [33] and black-box [152] model identification. Level 7 measured for billing purpose, which forms level 1. Different energy
stands for real-time operation data, requiring data exchange modules in sources, such as electricity and gas, are separated if applicable [74].
7
S. Zhan and A. Chong Renewable and Sustainable Energy Reviews 142 (2021) 110835
Table 4
Detailed definition of measurement granularity for the 6 data categories.
Level 0 1 3 5a
Energy N/A Total consumption by energy sources Separated consumption by usage Separated consumption by sub-
consumption type components
Indoor condition N/A Indoor air temperature Variables affecting thermal Thermal comfort/sensation feedback
comfort
System condition System specifications On/off operating mode, thermostat Temperature and flow rate Static pressures
setpoints variables
Envelop condition Geometric and thermal properties N/A Surface or core temperature N/A
Internal Assumed operating schedules/ N/A Estimated operating profile Additional occupant sensors
disturbance profiles
External N/A Weather data of the city/region On-site weather station/sensors Solar heat gain on different
disturbance orientations
a
Level 5 here is illustrated with typical examples. Actual variables might be subject to customized change in specific studies.
For level 3 detailed measurements, the energy consumption is they imply the heat flow. As an advanced measurement example,
splitted into different end use, such as heating [84], cooling [82], supply air static pressure was taken for system performance esti
lighting [14], and plug [107]. As advanced measurements, the en mation [76].
ergy consumption is further disaggregated by sub-components, such • Envelop condition (EC) only has level 0 static characteristics and
as boilers [97], heat pumps [61], pumps [68], and fans [149]. level 3 detailed measurements. Level 0 may involve geometric
• Indoor condition (IC) means indoor thermal comfort conditions in properties like areas and volumes [30], and/or thermal properties
most cases and is usually represented by indoor air temperature [33, like U-value and Solar Heat Gain Coefficient (SHGC) [50]. Infor
57,58]. For detailed measurements, other factors affecting thermal mation like the number of rooms can be easily observed and there
comfort are involved, including mean radiant temperature [117], fore is not explicitly accounted for. For level 3, surface and/or core
humidity [80], and operative temperature [77]. At level 5, special temperatures of the envelops are measured. These variables are
measurements are taken to investigate specific problems. For usually found in buildings with radiant systems such as TABS or
example, occupant thermal comfort feedback is collected for an Concrete Core Activation (CCA).
occupant-oriented MPC [144], and illuminance is considered for
optimal control of blind position [52]. 3.1.3. Temporal resolution
• Internal disturbances (ID) are the sources of internal heat gain: Larger numbers as the third digit indicate higher temporal resolution
occupants, equipment, and lights. The metadata in this category re of the time series data. Level 0 includes the static building characteristics
fers to the assumed operating on/off schedules [55] or ratio based and time series data with the interval larger than an hour. Time interval
profiles [59]. The information can be based on standard or expert of less than or equal to an hour but larger than 30 min falls into level 1.
knowledge. There is no level 1 because they are not necessary for Similarly, less than or equal to 30 min but larger than 15 min belongs to
normal building operations. As level 3, the profiles are estimated level 2, and so forth. Thereby, level n corresponds to 2n− 1 to 2n data
based on electricity [97] or temperature [73] trends. CO2 concen points per hour.
tration is the most used advanced measuring method [122,132].
Passive infrared (PIR) sensors and people counters are also used 3.2. Data requirements of different models
[152]. Internal radiative and convective heat gain are used in many
simulation studies [33,58], but is hardly measurable in real opera The data usage of the 118 models is categorized and quantified ac
tion unless using load emulators [30,76]. cording to the extended LoD framework. The average LoD of the six
• External disturbances (ED) are the climate conditions that cause categories is also calculated for each study to enable the quantitative
external heat gain. While the dry-bulb temperature and solar irra comparison between different model types. Since the resulting data is
diance are used much more frequently than other variables like wind unpaired and non-Gaussian distributed, the Mann-Whitney U tests are
speed [77] and ground temperature [10], they are not differentiated applied. Representative studies are selected for presentation in Tables
in different levels given their similar availability with the existence 5–7. The selection is done by stratified sampling from each of the nine
of weather stations. Level 1 refers to the publicly available weather model types.
data of the city or the region [74,94]. On-site weather stations are
used to accurately measure the buildings’ ambient condition [69,97, 3.2.1. Comparing modeling purposes
107], therefore defined as level 3. The Typical Meteorological Year It is expected to see the most data used in system performance
(TMY) used in most simulation studies [33,58] are also considered models (Table 7), followed by thermal response models (Table 6), and
accurate measurements since the buildings are assumed to be under then load prediction models (Table 5). It is obvious that load prediction
these typical conditions. At level 5, solar heat gain on different models require the least. While the difference between thermal response
orientation serves as an example [43,106]. and system performance models may not be visually detected from Ta
• System conditions (SC) describe how the HVAC systems are oper bles 6 and 7, the Mann-Whitney U test on the average LoD gets 0.016 p-
ated. Level 0 as static information requires information such as ca value, indicating a significant difference. The medians are 626 for sys
pacity and COP [39]. Note that sometimes COP is assumed to be tem performance models and 528 for thermal response models. The
constant just to estimate energy consumption [65], which is not general data requirements of the three modeling methods are respec
considered to require level 0 SC information. Level 1 is usually tively summarized:
available in building operation, including the on/off operating mode
[140] and thermostat setpoints [55]. Detailed measurements cover • With the assumption on indoor condition, load prediction models
the flow rates and temperatures on the water side [62] and the air requires no IC data. They predict the total or thermal loads (level 1 or
side [73]. These points are often used to estimate thermal loads when 3 measurement granularity) based on past values [89,92,93] or the
the power meters are not in place [30,124]. Valve [81], damper disturbances [55,86,88]. Most studies assumed constant room
[150] and blind [129] positions are also categorized into level 3 as
8
S. Zhan and A. Chong Renewable and Sustainable Energy Reviews 142 (2021) 110835
Table 5
Data usage of load prediction models.
Modeling methods Reference Building type Primary HVAC system Data category
EN IC ID ED SC EC
White-box [87] Residential Ideal 500 500
[92] Residential Ideal 611
[93] Grid 613
Gray-box [55] University Chiller 631 500 611 611
[88] Office Ideal 631 651 631
Black-box [86] Residential Ideal 613 613
[89] Grid 611
Table 6
Data usage of thermal response models.
Modeling methods Reference Building type Primary HVAC system Data category
EN IC ID ED SC EC
White-boxa [14] Office TABS 500
[94] Office TABS 500 500
[96] Residential Heat pump 500 500
[107] Office VAV 500 500 400
[111] Grid 500 500
Gray-box [30] Office FCU 734 754 754 734 500
[43] University VAV 633 613 653 633 633 400
[59] Office TABS 612 500 612 632 632
[61] Residential Hybrid 554 514 554 534 534
[67] University Radiant 612 632 632
[83] Residential Radiant 733 713 753 733
[85] Residential Ideal 631 611 631 500
[95] Office VAV 734 734 734 734 734
[125] Office TABS 511 551 551 531 531
[126] Lab Ideal 534 514 534 534
[28] Office VAV 612 652 632 632 632
[131] Lab Hybrid 531 511 551 551 531
[133] Lab Radiant 612 632 632
Black-box [71] Residential GSHP 653 613 633 613
[72] University Radiant 611 631 631
[77] Office Hybrid 631 511 531 511
[79] University TABS 653 613 500 613
[84] Office Ideal 633 613 500
[135] Office Radiant 735 715 735 735
[140] Lab VRF 513 633 513 513
a
13 white-box thermal response models are selected by stratified sampling, where the data usages are mostly similar. Therefore, only 5 are displayed here to be
concise.
Table 7
Data usage of system performance models.
Modeling methods Reference Building type Primary HVAC system Data category
EN IC ID ED SC EC
White-box [98] Office TABS 500 500 500
[143] Residential Radiant 500 500 500
[144] Office Hybrid 651 500 500
Gray-box [31] Office FCU 653 613 653 633 633 633
[147] Office Radiant 614 634 614 634 634
Black-box [55] University Chiller 631 611 631
[73] Lab VAV 553 513 633 513 533
[76] Lab VAV 631 611 651 631 651
[149] Office TABS 651 631 651 631 651 631
[151] Office Radiant 652 612 652 652 632 632
temperature setpoints [86,89]. If not, the setpoint is used as a model inputs. These points are indispensable if no energy consumption data
input [55]. is used.
• To model the building’s thermal response, IC and EC data are added • For the system performance models, the most noticeable change is
for model identification. Almost all selected gray and black-box the increased use of component-level energy consumption. The
thermal response models used room temperature, except some [30, supply air static pressure is also measured [76,149]. These
95] required both temperature and humidity. Envelop surface [28] higher-granularity measurements help obtain information about the
or core [59] temperatures are sometimes required. Besides, more SC dynamic system performance. It is unforeseen that system perfor
data of level 3 measurement granularity is needed as the controlled mance models generally acquire more ID data than thermal response
9S. Zhan and A. Chong Renewable and Sustainable Energy Reviews 142 (2021) 110835
models to estimate internal heat gains (p-value 0.047). This could be Equation (3)), and Root Mean Squared Error (RMSE, Equation (4)) are
a side benefit of deploying more sophisticated sensing systems. normally used [50,86,123]. Concerning about the variation of error,
Maximum Absolute Error (MaxAE, Equation (5)) and Standard Devia
3.2.2. Comparing modeling methods tion of Absolute Error (StdAE, Equation (6)) were also used [29,124].
It can be seen that white-box models mostly use just building met These metrics are useful to avoid the potential thermal comfort violation
adata of LoD 400 and 500. One exception is Zhao et al. [144] embedded caused by the model mismatch [97,139]. There is no consensus on the
historical occupant thermal comfort feedback to predict thermal com acceptable error, but many studies tried to contain the errors within
fort. Most gray-box models need information such as the building layout, ±1∘ C.
which is not counted as using metadata. Some used metadata to provide n ( )
1∑
initial guesses [43] or value bounds [83] for parameter identification. MBE = ̂y i − yi (1)
The usage of metadata was shown crucial for some identification algo n i=1
rithms, especially in cases like MRI, when the optimization problem is
n ⃒ ( )⃒
non-convex [59]. It is worth noting that metadata, particularly the 1∑ ⃒ ⃒
MAE = ⃒ ̂
⃒ y i − yi ⃒⃒ (2)
operation profile, was also used in black-box models [79,84]. As another n i=1
example, Li et al. [151] used the system specification to obtain the heat
n ( )2
pump performance and other temperature measurements to model other 1∑
MSE = ̂y i − yi (3)
sub-systems. n i=1
Gray and black-box models use a similar amount of time series data.
√̅̅̅̅̅̅̅̅̅̅̅̅̅̅̅̅̅̅̅̅̅̅̅̅̅̅̅̅̅̅̅̅̅̅
The statistical test gives 0.232 p-value, showing no significant differ n ( )2
1∑
ence. In fact, gray-box models have slightly higher median average LoD RMSE = ̂y i − yi (4)
n i=1
(617 over 606). This observation disagrees with the conclusion in
Ref. [20] that gray-box models require less data. It is still arguable that ⃒( )⃒
⃒ ⃒
the difference lies in the training data length. The length is not quanti MaxAE = maxi∈[1,n] ⃒⃒ ̂y i − yi ⃒⃒ (5)
fied in this review because many studies did not report. However,
training data length varying from one day to one year is found in both √̅̅̅̅̅̅̅̅̅̅̅̅̅̅̅̅̅̅̅̅̅̅̅̅̅̅̅̅̅̅̅̅̅̅̅̅̅̅̅̅̅̅̅̅̅̅̅̅̅̅̅̅̅̅̅̅̅̅̅̅̅̅̅̅̅̅̅̅̅
√ i=1 (⃒ ( )⃒ )2
modeling methods. √ 1 ∑ ⃒ ⃒
StdAE = √ ⃒ ̂
⃒ y i − yi ⃒⃒ − MAE (6)
n− 1 n
3.2.3. Other comparisons
Although the modeling methods greatly impact the usage of meta To diminish the effect of absolute value scales when comparing
data, when it comes to time series data, the usage of level 5, 6, and 7 is different models, the error metrics are normalized to obtain percentages.
almost evenly distributed in different model types. Faster system dy Mean Absolute Percentage Error (MAPE, Equation (7)) and Coefficient
namics requires higher temporal resolution. For example, the average of Variation (RMSE) (CV(RMSE), Equation (8), also known as Normal
resolution level of Fan Coil Unit (FCU) models is 3.75, while the average ized RMSE) are commonly used [76,132]. Replacing the average of the
of TABS models is 2.11. To summarize, among the three dimensions of measured value in the denominator of equation (8) with the range of
LoD, time validity is partially influenced by the modeling methods, predicted values yields standardized RMSE [43]. However, comparing
measurement granularity is affected by the modeling purpose, and models with these normalized percentages still requires some caution.
temporal resolution is typically decided by the system dynamics. For instance, consider model A that predicts room temperature around
26◦ C with 1◦ C RMSE and model B that gives similar RMSE around 20◦ C,
4. Performance evaluation the lower CV(RMSE) of model A does not make it more accurate.
Alternatively, R squared (R2, Equation (9), sometimes referred to as the
A control-oriented model with acceptable prediction capability is the goodness of fit), estimating the ratio of explained variance in the pre
prerequisite to achieve good control. Potential model mismatch could diction, is frequently used as well [77,95].
lead to control performance degradation. Therefore, it is crucial to ( )
⃒ ⃒
obtain a structured perception of model performance evaluation and its ⃒ ̂y − yi ⃒
1 ∑⃒⃒ i
n ⃒
impact on control. With the intention to quantify the relationship, two MAPE = ⃒
⃒
⃒ (7)
n i=1 ⃒ yi
gaps are noticed: a) the absence of a standard or comparable approach ⃒
for model performance evaluation, and b) the paucity of research √̅̅̅̅̅̅̅̅̅̅̅̅̅̅̅̅̅̅̅̅̅̅̅̅̅̅̅̅̅̅̅̅̅̅
remarking the relationship. This section gives an overview on these two n ( )2
1 1∑
issues. CV(RMSE) = ̂y i − yi (8)
y n i=1
4.1. Model evaluation ∑n
( )2
i=1 y
̂ i − yi
The approaches to evaluate the credibility of a computerized model R2 = 1 − ∑n 2
(9)
i=1 (yi − y)
can be categorized into validation and verification [162]. Validation
substantiates that a model, within its domain of applicability, possesses Usually, closed-loop, or one-step ahead, prediction is validated. As a
a satisfactory range of accuracy. Verification substantiates that a model stricter approach, open-loop prediction was validated on occasion to
represents the conceptual model within specified limits of accuracy. examine the model performance over the horizon [44]. For example,
multi-step RMSE (MS-RMSE, Equation (10)) was applied [27]. In
4.1.1. Validation metrics equations (1)–(10), ̂ y is the model output, y is the test data, y is the
Most studies evaluate the model through validation. A number of average of test data, p is the prediction horizon, n is the length of test
them adopted a qualitative approach to plot the model outputs with the data, i and k refer to the time step.
test data and show a good tracking [62,72,73]. To quantify the error √̅̅̅̅̅̅̅̅̅̅̅̅̅̅̅̅̅̅̅̅̅̅̅̅̅̅̅̅̅̅̅̅̅̅̅̅̅̅̅̅̅̅̅̅̅̅̅̅̅̅̅̅̅̅̅̅̅̅̅̅̅̅̅̅̅̅̅
√ ( )2
over a period, Mean Bias Error (MBE, Equation (1)) is a basic metric. √ 1 ∑n− p ∑ p
However, it is rarely used because positive and negative errors cancel MS − RMSE = √ ̂y i+k|i − yi+k (10)
p(n − p) i=1 k=1
each other when summing up and may distort the results. Therefore,
Mean Absolute Error (MAE, Equation (2)), Mean Squared Error (MSE,
10S. Zhan and A. Chong Renewable and Sustainable Energy Reviews 142 (2021) 110835
One consideration is the dataset used for validation. The mostly categorized papers are demonstrated by simulation, out of which 41.2%
applied in practice is the historical data over a period of time. It can be (35) are idealized. Assuming that the controller model is perfectly rep
obtained either from the real operation or using a high-fidelity simula resenting the building overlooks the influence of the model performance
tion model. Otherwise, using real-time data, Finck et al. [90] validated on the control performance. Studies using white-box methods, such as
the model outputs against measurements during the control experiment. model reduction, typically tend to be idealized. Yet, without comparing
Several datasets were designed for the purpose of better examining the to experimental data or higher fidelity models, the effectiveness of
models’ prediction capability. Kim et al. [130] suggested validating the model reduction methods was claimed to be questionable [44].
model in a cross-validation manner if significant disturbances present in Unlike simulation-based demonstration, where different control
operations. Li et al. [82] tested the extensibility (extrapolating capa strategies can be compared under the same boundary conditions, the
bility) by designing scenarios when the boundary conditions exceed the comparison is not as straightforward in actual experiments. The most
range of the training dataset. Several studies made datasets with step used approach is normalizing the control results, usually energy con
signals to check impulse responses between input-output pairs [27,163]. sumption, by degree days [62,97] or outdoor temperatures [173].
These designed datasets are usually generated using a high-fidelity Alternatively, some studies showed that different strategies are applied
simulation model. It was noted in the field of hydrology that the un under similar averages [59] or profiles [98] of outdoor temperature.
certainty in measured data should be carefully contained to effectively Baseline selection is another concern when evaluating the control
validate the models [164], which was rarely concerned by building performance. The most convenient way is to compare with the default
control studies. control in the building. However, it was argued that the default settings
in BMS are possibly poor-tuned, disputing the improvement of control
4.1.2. Verification and identifiability performance [24]. It was noted that the saving potential brought by
It has been recognized that a desired control-oriented model should MPC could also be achieved by fine-tuning the rule-based controller
not only predict with small error but also represent the actual building (RBC) [152]. Accordingly, the RBC was pre-tuned to consolidate the
systems [27]. In line with this, a desired [58] or minimum [34] model control comparison [95,106]. Moreover, MPC with simpler configura
complexity is needed by different building systems. Verification can also tions were used to show the superiority of robust MPC [123], non-linear
be done by physically interpreting the model outputs or parameters. In MPC [117], and system performance MPC [99]. The upper performance
the frequency domain, model responses to different input stimuli were bound of MPC was quantified by using the perfect model and distur
compared. The zone thermal reaction to heat input at different fre bance prediction [13]. Additionally, different combinations of HVAC
quencies was examined [34], and “error with respect to input” was systems and control algorithms were considered as integrated baselines
defined to quantify the performance [163]. Privara et al. [52] examined [149].
the whiteness of residuals using a cumulative periodogram, confirming
that the system dynamics was properly modeled, and the residuals were 4.2.2. Affecting factors
caused by noises. For parameter inspection of gray box models, the The performance of MPC varied among different situations from
identified RC values were compared with the physical meaning [58, worse than baselines to over 100% better. Apart from the model per
125]. Significance index and correlation index were introduced to formance, the wide range is also affected by factors including building
evaluate how the parameters affect the model performance [66]. A characteristics [102], ambient conditions [94], operation constraints
model is expected to be less sensitive to parameter perturbation [37] and [39], disturbances [122], and etc. These factors function in a combined
have less correlated parameters [66]. and complicated way. For example, the impact of internal disturbance
As a model becomes more complex and has more degree of freedom, was moderated during the heating season, as compared with the cooling
identifiability comes to be an issue [126,153]. If a model is season [31]. Consequently, extracting the relationship between model
over-parameterized, i.e., has too many parameters to identify, param and control performance involves explicitly designed experiments,
eter estimation, model evaluation, and further application could be which is rare in the past years.
more difficult [56,165,166]. It has been shown that the parameter Several studies showed that model mismatch could result in more
values can be varied a lot without significantly changing the validation energy consumption [119,132] and/or discomfort [97,139]. To quan
results [83,151]. The parameter identifiability can be decomposed into tify, 10% error led to 5% more energy cost and 100% more comfort
structural and output identifiability [123]. To correctly identify the violation [28]. On the other hand, a more accurate model, in terms of
models instead of overfitting the training data, an appropriate model RMSE, did not necessarily lead to better control performance [33]. The
structure is the most important factor [167]. Therefore, model selection prediction horizon matters as well. Zong et al. [10] found the energy cost
methods were applied for both white-box [168], gray-box [43,127] and decreased and then increased as the prediction horizon increased, which
ANN models [80]. Further, Privara et al. [57] applied different model might be relevant to the open-loop prediction accuracy. Regarding the
selection criteria for probabilistic and deterministic identification model structure and characteristics, a multi-zone model achieved better
algorithms. thermal comfort than a simplified single-zone model with a similar
amount of energy [83], a certain number of states was found necessary
4.2. Relating to control performance to capture the thermal dynamics [34], and a non-convex model caused
multiple local optima in the optimization, some of which deteriorated
4.2.1. Control performance evaluation the control [174].
MPC in buildings aims at energy saving, thermal comfort improve
ment, peak load reduction, system efficiency improvement, etc. The 5. Discussion
effectiveness can be demonstrated through simulation or experiment. A
realistic simulation-based demonstration framework requires a control- Through the categorizations and discussions in the last three sec
oriented model and a high-fidelity simulation model. The simulation tions, several research gaps are spotted. This section summarizes the
model serves as a virtual testbed, to which the control action based on review with five directions for future study, three of which regarding the
the controller model is applied [25]. Tools and desired features of data requirements and the other two about the performance evaluation.
simulation models are reviewed in Ref. [169]. Typical tools include These topics interrelate and should be studied together systematically.
Building Controls Virtual Test Bed (BCVTB) [170], TRNSYS (type 15,17,
56,155) [171], and Modelica [172]. However, a number of
simulation-based studies deployed an idealistic framework by using the
same model for optimization and simulation. 72.0% (85) of the
11You can also read