MARS MARKET INSIGHTS - MARS DISCOVERY DISTRICT
←
→
Page content transcription
If your browser does not render page correctly, please read the page content below

October 2015

MaRS Market Insights
                                                              Colombia

          Market Information
          Report: Colombia

           MaRS Advanced Energy Centre

           Authors: Simeran Bachra, Mieka Buckley-Pearson, Nina Da Nobrega Garcia
           and Meg McQuillan

           Project Manager: Kathleen Gnocato

           Supervisors: Ron Dizy and Jesika Briones
INFORMATION REPORT: COLOMBIA

                     Country profile: Colombia

                                                                        Country Snapshot
                                                                        Population             48.93 million
                   Cartegena

                                                                        Nominal GDP (US$)      $373.8 billion

PANAMA                                                      VENEZUELA   GDP per capita (US$)   $7,960

                                              Bucaramanga               Major Cities           Bogota (capital), Medellin, Cali
                          Medellin
                                                                        Official language(s)   Spanish
                                     Bogota
                                                                        Currency               Colombian peso (COP)

                   Cali                                                 Exchange rate          1 COP = 0.0004 CAD (August 2015)

                                                                        Unemployment           9.6%
     Tumaco
                          COLOMBIA
                                                                        Major exports          Oil, coal, coffee and ferrous nickel

                                                                        Export destinations    United States, China, Spain,
         EQUADOR                                                                               Panama, The Netherlands
                                                             BRAZIL
                                                                        Major imports          Intermediate, capital and consumer
                                                                                               goods
                            PERU
                                                                        Import destinations    United States, China, Mexico, Brazil

              Figure 1. Colombia. Source: CDC 2013.

                                                                                               Market Information Report: Colombia | 2
INFORMATION REPORT: COLOMBIA

Preamble
The Going Global series provides a 360-degree view of the energy system in international priority markets for
export-ready Canadian energy companies. Each report not only examines the energy and electricity landscape of a
particular market, but also the business environment, the social, political and legal frameworks, and the country’s
macroeconomic drivers.

                                                                                                                                This
                                                                                                                       report not
                                                                                                                 only examines
                                                                    reader with a snapshot of
In short, the analysis is meant to help companies answer
                                                                    where a market stands                       the energy and
                                                                    in comparison with
two key questions:                                                  other key markets.
                                                                                                      electricity landscape,
                                                                    Each graph is followed             but also the business
                                                                    by an analysis of the
1   Are we a good fit for the market?                                                                        environment, the
                                                                    indicators, which
2   What are the opportunities and barriers to doing                provides more nuanced                 social, political and
    business, and do the former outweigh the latter?                information. Notably, this
                                                                    analysis is taken from                  legal frameworks,
In preparing this report, its authors examined a set of
                                                                    third-party sources and
quantitative indicators adapted from third-party sources                                                    and the country’s
                                                                    verified by energy experts
(the World Bank, the REN21, the U.S. Energy Information
Administration, and the United Nations). These indicators
                                                                    in these markets.                          macroeconomic
measure six key considerations for understanding the                There are limitations to the                       drivers.
challenges and opportunities for energy innovation in               insights this type of report can
Colombia: energy security and independence; quality and             provide. The information presented
resilience of electricity supply; control over rising electricity   is from secondary sources, and there are
costs; support for demand growth; environmental sustain-            often details that can only be gathered from a
ability; and the business environment. In addition, the             physical presence in the market. The report is therefore
report identifies the scope of support for cleantech offered        intended to serve as an initial resource in understanding
by national governments and utilities. At the beginning of          whether a market is suitable for your startup. The report
each section, the authors’ provide a high-level qualitative         will prompt more specific questions and should be supple-
assessment of the market. This research is also distilled           mented by a mission or visit to the market in question.
into graphs that allow for a visual comparison of Colombia’s
market in comparison to other priority markets, and Canada          It is also important to note that within the cleantech market,
as a benchmark. The graphs are meant to provide the                 the report focuses mainly on energy, and does not discuss
                                                                    technologies related to other cleantech subsectors (e.g.,
                                                                    waste and water management).

                                                                                                 Market Information Report: Colombia | 3
INFORMATION REPORT: COLOMBIA

Executive Summary                                                       For reference DFATD defines emerging markets with
                                                                       the best potential for broad Canadian commercial
The Advanced Energy Centre selected Colombia as a target               interests as those:
market for in-depth research along the specific criteria. First,       • 		That demonstrate high potential for economic
in a thorough analysis of market priorities in consultation                growth;
with provincial and federal partners, the Centre identified            • 		Where Canadian capabilities have the greatest
Colombia as a market that directly aligns with Canada’s                    potential for success;
international market priorities. The Department of Foreign             • 		Where government support can have the greatest
Affairs, Trade and Development (DFATD) identifies Colombia                 impact;
as an emerging and high potential market opportunity. *                • 		That are priorities for foreign direct investment,
                                                                           technology and/or talent; and/or
Second, the Centre considered corporate and non-corporate
                                                                       • 		That are part of regional trading platforms
partners’ presence in the Colombian energy market
                                                                       • 		DFATD Free Trade Agreements
including the presence of Canada’s foreign offices and the
                                                                       • 		Past and upcoming DFATD trade events
Centre’s corporate partners’ global operations. The Centre
                                                                       • 		EDC Past and Upcoming events 2015
also considered the momentum built in its existing interna-
                                                                         • EDC Trade Confidence Index based on 748
tional relationships including those developed in a series of
                                                                            responses to a telephone survey conducted from
exploratory trips to the Colombian market. Finally, drawing
                                                                            September 11 to September 26, 2014
from third-party assessments of the Colombian energy
                                                                         • MEDTE Upcoming (2015) Events & Missions
market, the Centre considered market receptivity and
                                                                         • ISTP International Programs
alignment with Canadian energy innovation entrepreneurial
network’s interests. The key findings from this assessment
are detailed in the table below.                                   *   [Source: DFATD – Global Markets Action Plan (Priority markets)]

  Opportunities In Cleantech                                       Barriers To Cleantech
 • Government target to double non-hydroelectric                   • Government incentives aren’t readily available for foreign
   renewable energy generation by 2020 (from 3.3% to                 companies, due in part to procurement policies
   6.5%)                                                           • Regulatory framework supporting renewables and
 • Large local utilities can act as a gateway market to other        cleantech is complex and may be difficult to understand
   Latin American countries (e.g. Peru)                            • The surcharge for energy reliability excludes renewable
 • Significant potential for energy efficiency savings in            energy sources
   industrial, commercial and residential sectors                  • Financial market limitations: The banking sector has little
 • New renewable energy law encourages companies to                  experience with cleantech and so limited financing is
   develop non-conventional renewable technologies (Law              available
   1715; mechanisms and incentives still in development)           • Private sector is not attuned to the economic advantages
 • Some tax exemptions are available for renewable energy            of sustainable energy
   projects and sales
 • With some of the highest energy potential in Latin
   America, Colombia’s climate and geography lend
   themselves to investment in renewable energy
   generation

  Business Opportunities                                           Barriers To Cleantech
 • One of the easiest Latin American countries to do               • Energy infrastructure has been damaged by guerrilla
    business in                                                      warfare in rural Colombia
 • Easiest cities in which to do business:                         • Access to electricity remains problematic
 • Manizales                                                       • Complex business tax structure
 • Ibague                                                          • Weak contract enforcement
 • Bogota                                                          • Transportation costs are very high due to a need for
 • Strengths of the market:                                          more infrastructure development
 • Ease of getting credit                                          • Corruption is prevalent—bribes in the course of business
 • Protection of minority investment                                 are common
 • Registration of property
 • Ease of resolving insolvency

                                                                                                         Market Information Report: Colombia | 4
INFORMATION REPORT: COLOMBIA

Table of contents
Country considerations                         Highlights of analysis                                                                                               Page

Methodology                                    . . . . . . . . . . . . . . . . . . . . . . . . . . . . . . . . . . . . . . . . . . . . . . . . . . . . . . . . . . . . . . . 7

Colombia’s electricity market snapshot         Overview of electricity market. . . . . . . . . . . . . . . . . . . . . . . . . . . . . . . . . . . . 10
                                               Market regulation. . . . . . . . . . . . . . . . . . . . . . . . . . . . . . . . . . . . . . . . . . . . . . . 12

Security of energy supply                      Generation and consumption. . . . . . . . . . . . . . . . . . . . . . . . . . . . . . . . . . . . . 14
                                               Energy imports and exports. . . . . . . . . . . . . . . . . . . . . . . . . . . . . . . . . . . . . . 16
                                               Proven reserves. . . . . . . . . . . . . . . . . . . . . . . . . . . . . . . . . . . . . . . . . . . . . . . . 16
                                               GDP growth . . . . . . . . . . . . . . . . . . . . . . . . . . . . . . . . . . . . . . . . . . . . . . . . . . .  17
                                               Network connectedness . . . . . . . . . . . . . . . . . . . . . . . . . . . . . . . . . . . . . . . . .  17

Quality and resilience of electricity supply   Reliability/quality . . . . . . . . . . . . . . . . . . . . . . . . . . . . . . . . . . . . . . . . . . . . . . 18
                                               Value lost . . . . . . . . . . . . . . . . . . . . . . . . . . . . . . . . . . . . . . . . . . . . . . . . . . . . . 19
                                               Exposure to severe weather. . . . . . . . . . . . . . . . . . . . . . . . . . . . . . . . . . . . . . 20

Efficiency of energy supply (control
over rising electricity costs)                 Wholesale market prices . . . . . . . . . . . . . . . . . . . . . . . . . . . . . . . . . . . . . . . . 21
                                               Household prices. . . . . . . . . . . . . . . . . . . . . . . . . . . . . . . . . . . . . . . . . . . . . . . 23
                                               Industry prices. . . . . . . . . . . . . . . . . . . . . . . . . . . . . . . . . . . . . . . . . . . . . . . . . 23
                                               Power transmission and distribution losses. . . . . . . . . . . . . . . . . . . . . . . . . 23

Support for demand growth                      Urban population growth . . . . . . . . . . . . . . . . . . . . . . . . . . . . . . . . . . . . . . . . 25
                                               Change in energy demand . . . . . . . . . . . . . . . . . . . . . . . . . . . . . . . . . . . . . . . 26

Environmental sustainability                   Renewable energy capacity . . . . . . . . . . . . . . . . . . . . . . . . . . . . . . . . . . . . . .                     28
                                               Pollution levels. . . . . . . . . . . . . . . . . . . . . . . . . . . . . . . . . . . . . . . . . . . . . . . . .         29
                                               Climate change targets . . . . . . . . . . . . . . . . . . . . . . . . . . . . . . . . . . . . . . . . .                  29
                                               National strategy for renewables. . . . . . . . . . . . . . . . . . . . . . . . . . . . . . . . . .                       29
                                               Smart grid overview . . . . . . . . . . . . . . . . . . . . . . . . . . . . . . . . . . . . . . . . . . . .               30

Business environment                           Corruption and government response . . . . . . . . . . . . . . . . . . . . . . . . . . . . . 32
                                               Ease of doing business . . . . . . . . . . . . . . . . . . . . . . . . . . . . . . . . . . . . . . . . . . 33
                                               Political stability and domestic security. . . . . . . . . . . . . . . . . . . . . . . . . . . . 34
                                               Foreign direct investment. . . . . . . . . . . . . . . . . . . . . . . . . . . . . . . . . . . . . . . . 35
                                               Financial system overview . . . . . . . . . . . . . . . . . . . . . . . . . . . . . . . . . . . . . . . 36
                                               Canada-Colombia relations. . . . . . . . . . . . . . . . . . . . . . . . . . . . . . . . . . . . . . . 37
                                               US-Colombia relations. . . . . . . . . . . . . . . . . . . . . . . . . . . . . . . . . . . . . . . . . . . 38
                                               Infrastructure. . . . . . . . . . . . . . . . . . . . . . . . . . . . . . . . . . . . . . . . . . . . . . . . . . 38
                                               International organization membership and engagement. . . . . . . . . . . . . 39
                                               Multilateral funding agency engagement. . . . . . . . . . . . . . . . . . . . . . . . . . . 40

Government and regulatory support              Financial incentives for renewables . . . . . . . . . . . . . . . . . . . . . . . . . . . . . . . 41
                                               Legislation . . . . . . . . . . . . . . . . . . . . . . . . . . . . . . . . . . . . . . . . . . . . . . . . . . . . 42
                                               Public financing . . . . . . . . . . . . . . . . . . . . . . . . . . . . . . . . . . . . . . . . . . . . . . . . 43
                                               Renewable energy programs . . . . . . . . . . . . . . . . . . . . . . . . . . . . . . . . . . . . . 44

Utilities                                      Smart grid pilot projects. . . . . . . . . . . . . . . . . . . . . . . . . . . . . . . . . . . . . . . . . 45

Appendix                                       Administrative structure: Colombia . . . . . . . . . . . . . . . . . . . . . . . . . . . . . . . 47
                                               Institutions in the electricity sector. . . . . . . . . . . . . . . . . . . . . . . . . . . . . . . 48
                                               Government institutions in the energy sector. . . . . . . . . . . . . . . . . . . . . . . 49
                                               Key smart grid organizations. . . . . . . . . . . . . . . . . . . . . . . . . . . . . . . . . . . . . 50
                                               Additional resources. . . . . . . . . . . . . . . . . . . . . . . . . . . . . . . . . . . . . . . . . . . .  51

                                                                                                                     Market Information Report: Colombia | 5
INFORMATION REPORT: COLOMBIA

                           Methodology
This report looks at Colombia from the standpoint of six national energy considerations and measures the support for
the adoption of innovation energy technologies within Colombia’s government and major utilities. The purpose of this
analysis is to help Canadian cleantech companies identify potential opportunities and understand barriers to energy
innovation in Colombia.
The report assesses six challenges (or, “country considerations”) using a total of twenty-eight metrics (see table below).
To remove any subjectivity or bias in our depiction of the indicators, they are presented as raw data obtained from trusted
third-party sources - including the World Bank, International Energy Agency (IEA) and U.S. Energy Information Administration
(EIA) - and compared to other priority markets for reference. Each challenge is represented visually and assessed qualitatively
in its respective section of the report. The analysis demonstrates areas of opportunity, as well as challenges, in deploying
cleantech in Colombia. Canada is referenced in each chart as a benchmark for Canadian entrepreneurs to contextualize each
comparison market.
Note: The source of each metric has been hyperlinked in the table below.

 Consideration                               Metric                         Description

                                            Total electricity generation    Electricity, billion kilowatt hours

                                            Electricity consumption         Gross production + imports – exports – losses

                                            Proven fossil fuel reserves     Billion barrels

       SECURITY OF
                                            Net electricity imports         Electricity imports – exports, in billion kilowatt-hours
      ENERGY SUPPLY
                                            GDP growth                      Annual percentage growth rate of GDP at market prices

                                            Access to electricity           Percentage of population with access to electricity

                                            Duration of interruptions       Average outage duration for each customer

                                            Frequency of interruptions      Average number of interruptions that customer experiences
       QUALITY AND
       RESILIENCE OF                        Value lost due to outages       Percentage of sales lost due to power outages
      ENERGY SUPPLY
                                                                            Measures susceptibility, coping capacities, adaptive capacities, expo-
                                            World risk index rating
                                                                            sure to national hazards and vulnerability
                                            Residential electricity price   Climatescope average residential electricity prices

                                            Industrial electricity price    Climatescope average industrial electricity prices

       EFFICIENCY OF                                                        Losses in transmission between sources of supply and points of
                                            Electricity transmission and
      ENERGY SUPPLY                                                         distribution and in distribution to consumers, including pilferage
                                            distribution losses
     (control over rising                                                   (percentage of output)
           costs)

                                                                                                                  Market Information Report: Colombia | 6
INFORMATION REPORT: COLOMBIA

 Consideration                 Metric                          Description
                                                               PM10 measures fine suspended particulates < 10 microns in diame-
                               PM10 particulate levels         ter. Estimates represent annual exposure level of the average urban
                                                               resident to outdoor particulate matter
                                                               Official climate change targets (such as reduction in greenhouse gas
                               Climate change targets
                                                               emissions)

                               Renewable energy target         Percentage of total energy mix by 2020
    ENVIRONMENTAL
                                                               Targeted share of renewables in electricity generation by 2020
    SUSTAINABILITY             Targeted share of renewables
                                                               (excluding hydropower)
                                                               Current share of renewables in electricity generation (excluding
                               Share of renewables
                                                               hydropower)
                               GDP growth                      GDP growth, annual percentage
                                                               Urban population refers to people living in urban areas as defined by
                               Urban population growth
                                                               national statistical offices, annual percentage

    SUPPORT FOR                                                Measures year-on-year change in energy use (kilogram of oil equiva-
   GROWING ENERGY              Per capita usage
                                                               lent per capita)
      DEMAND
                                                               The World Bank Group ranks economies on ease of doing business
                                                               from 1 to 189. High scores (where 1 is the highest) mean the regula-
                               Ease of doing business
                                                               tory environment is more conducive to starting and operating a
                                                               local firm
                                                               Transparency International Corruption Perceptions Index ranks
                               Corruption                      countries based on how corrupt a country’s public sector is per-
                                                               ceived to be. Scores: 0 (highly corrupt) to 100 (very clean)
                                                               Net inflows of investment to acquire a lasting management interest
                                                               in an enterprise operating in an economy other than that of inves-
                               Foreign direct investment
                                                               tor. Net inflows (new investment less disinvestment) in reporting
                                                               economy from foreign investors
                                                               Governance indicator capturing perceptions of the likelihood of
QUALITY OF BUSINESS            Political stability             political instability and/or politically motivated violence, including
   ENVIRONMENT                                                 terrorism
                                                               Governance indicator capturing perceptions of the ability of the gov-
                               Regulatory quality              ernment to formulate and implement sound policies and regulations
                                                               that permit and promote private sector development
                                                               Governance indicator capturing perceptions of the extent to which
                                                               agents have confidence in and abide by the rules of society (quality
                               Rule of law
                                                               of contract enforcement, property rights, the police and the courts)
                                                               as well as the likelihood of crime and violence
                               Roads paved                     Infrastructure indicator, roads paved (percentage of total roads)

The report also assesses the degree of support for cleantech in Colombia, relative to other countries. To gauge support
levels within the government of Colombia and among the country’s largest utilities, the report looks at the factors outlined
in the table below.

 Group                          Measuring support              Description
                               National strategy for renew-
                                                               Is there a national strategy for renewables?
                               ables
                                                               Capital subsidies, grants or rebates; tax incentives; energy produc-
                               Financial incentives
                                                               tion payments
      GOVERNMENT/              Public financing                Public investment through loans or public competitive bidding
      REGULATORY                                               Feed-in-tariff programs, utility quota obligations, net metering, trad-
        SUPPORT                Regulatory policy
                                                               able renewable energy certificates, obligations and mandates

Identifying and understanding Colombia’s relative energy considerations and levels of support can help Canadian cleantech
companies to identify key opportunities and recognize barriers to doing business in Colombia.

                                                                                                 Market Information Report: Colombia | 7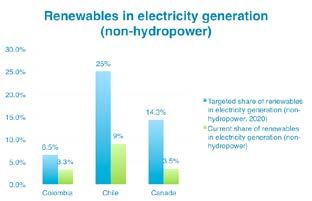
INFORMATION REPORT: COLOMBIA

                            Colombia’s electricity market
                            snapshot
OVERVIEW OF ELECTRICITY MARKET
Colombia has a wholesale energy market with an independent system operator, XM S.A. E.S.P. (a subsidiary of the
state-run energy company, ISA). Within it, power generation companies and public, private and mixed traders buy and
sell energy within a regulatory framework established by the Energy and Gas Regulatory Commission (CREG). There
are two markets:
    1 Bolsa de Energia: A market for short-term deals where players offer prices and the availability of energy through daily
      auctions
2 The market for long-term contracts, which provides agents with coverage against the volatility of energy prices in the
      short-term market

KEY BODIES WITHIN THE ELECTRICITY MARKET INCLUDE:
• Ministry of Mines and Energy                                                   • Energy and Gas Regulatory Commission (CREG)
• Mining and Energy Planning Unit (UPME)                                         • Superintendence of Public Services (SSPD)

                                                                         PRESIDENT
                                                                        OF COLOMBIA

                 Ministry of
                                                      Ministry of                            Ministry of                      National Planning
                 Economic
                                                   Mines and Energy                           Finance                           Department
                Development

              Superintendent                                                                                                  Energy Regulation
              Public Services                                                                                                    Commission

                                                                    Mining &
                                           Direction of              Energy
                                                                                                                              National Operation
             Delegate Energy             Electric Energy          Planning Unit
                                                                                                                                   Council
             Superintendent                                          (UPME)
                                                                                                                                    (CNO)

                                                                                                                                                  OPERATIONS
                     SURVEILLANCE                         PLANNING                                                               POLICIES
                                                                                                                                                  REGULATION

                                                                  ELECTRICITY INDUSTRY

    Figure 2. Structure of Colombia’s electricity industry. Source: Adapted from Hammons et al.,(1999). Competitive Generation Agreements in Latin American
                               Systems with Significant Hydro Generation. Powered Engineering Review, IEEE ( Volume 19, Issue: 9)1

A complete description of the tasks and responsibilities of these actors is outlined in the Appendix included at the end of this
report.

1     http://ieeexplore.ieee.org/xpl/login.jsp?tp=&arnumber=785784&url=http%3A%2F%2Fieeexplore.ieee.org%2Fiel5%2F39%2F17037%2F00785784.pdf%3Farnumber%3D785784?

                                                                                                                     Market Information Report: Colombia | 8
INFORMATION REPORT: COLOMBIA
The current structure of the market was established in 1994 by two national laws: 142 (Public Services Law) and
143 (Electricity Law). These laws divide the electricity market into generation, transmission, distribution and
commercialization.
ENERGY GENERATION Table 1. Electricity market overview
Generation is open to competition and the market
determines prices. Generation agents, including generators, Installed
minor plants, self-generators and co-generators, conduct generation 14.4 GW
transactions on the energy stock market. Energy is sold
through bilateral contracts to the regulated and unregulated
capacity
markets, energy exchange, secondary frequency regulation
service and reliability charges.2
Electricity
53 TWh
ENERGY TRANSMISSION generation
The National Transmission Network (STN) is operated by
Empresa de Energia de Bogota (EEB) and has a voltage of National Interconnected Sys-
220 kV. Transmission network planning and expansion is
tem (SIN): 1/3 of the country,
coordinated by the UPME. The state-owned energy company,
ISA, and its subsidiary, Transelca, control approximately
serving 96% of the popula-
80% of the transmission network. Other key transmission tion
Coverage
companies include Empresa de Energia de Bogota (EEB),
Empresas Publicas de Medellin (EEPPM), and Empresa de Non-Interconnected Zones
Energia del Pacifico (EPSA), among others. (ZNI): 2/3 of the country, serv-
ing 4% of the population
ENERGY DISTRIBUTION
Distribution of electric energy is fully regulated under a Electricity
voltage of 220 kV. CREG establishes and revises the distri- 57.8 GWh
bution price component every five years. Different voltage
exports
levels are defined by different methodologies: the distri-
bution price of Level 1 (1 kV), Level 2 (1 kV to 30 kV) and
Level 3 (30 kV to 57.7 kV) voltage levels corresponds to a
maximum price methodology, while the distribution price of Main export 85% of electricity exports to
Level 4 voltage (57.5 kV to 220 kV) corresponds to regulated markets Venezuela, 15% to Ecuador
revenue.
COMMERCIALIZATION
1,123 kWh (up from 1,009 in
This activity involves the purchase of electricity in the Per capita usage 2010)
wholesale market and its sale to end-users, whether
regulated or not.
2 http://www.securities.com/emis/sites/default/files/EMIS%20Insight%20-%20
Colombia%20Power%20Sector%20Report.pdf
Market Information Report: Colombia | 9INFORMATION REPORT: COLOMBIA
MARKET REGULATION
The deregulation of Colombia’s energy supply industry began in 1994 with the Electricity Law, following a period of
major national blackouts in 1992 and 1993. Adapted from the United Kingdom (UK) model, Colombia has the only
price-based electricity market in Latin America (other markets such as Chile and Brazil feature a cost-based scheme).
This means pool prices are settled in a bidding process. Market prices have remained low over time; however, regulated
(domestic) tariffs and subsidies have created problems for small distribution companies. Customers are unable to
pay for electricity, subsidies are insufficient, and in many affected areas, distribution companies still experience high
losses.3
Since 1994, with the passing of Laws 142 and 143 (the Public Service and Electricity Laws), the state through CREG has
strengthened its regulatory role over the electricity and gas sectors.4
Private investment in public services became possible following the deregulation of the electricity market. Privatization
increased most significantly in distribution and commercialization activities.5 Since the adoption of reforms, Colombia has
avoided service blackouts despite severe droughts during 1997–1998 and 2009–2010. Colombia has also become an electricity
exporter to Ecuador and Venezuela.6
Following reforms in 1994, customers in the electricity market were divided into two groups: regulated and non-regulated
users. Non-regulated users are able to negotiate electricity prices with retailing companies, whereas regulated users must
abide by tariffs defined by CREG (CREG Resolution 131, 1998).
Table 2. Development of Colombian electricity sector following deregulation7
Electricity pool begins 1995 Regulator creates one-day-ahead pool, adapted from the UK model
El Niño 1997 No blackouts occur during the century’s worst El Niño
Adjustments are made to capacity payments and to the minimum operation level of
Capacity payment adjustments 1999
hydroelectricity plants
Privatization announcement 2000 Grid utility company announces it will go private. It attracts over 60,000 new owners
Attacks occur at isolated, key generators and cost the government an estimated
Attacks on transmission infrastruc-
2001 US$500 million. These attacks affected power generation capacity. Prices rose
ture
dramatically
Resolution sets a bidding floor for plants with trapped power and a bidding ceiling for
CREG Resolution 034, 2001 2001 out-of-merit generating plants (units dispatched to provide reactive power to support
transmission grids).
Electricity Resolution 2005 Creation of new standardized electricity-contracts market
3 http://www.sciencedirect.com/science/article/pii/B9780080450308500199 5 http://ieeexplore.ieee.org/stamp/stamp.jsp?tp=&arnumber=6083204
4 http://ieeexplore.ieee.org/xpl/login.jsp?tp=&arnumber=785784&url=http 6 http://www.eprg.group.cam.ac.uk/wp-content/uploads/2014/02/1403-PDF.pdf
%3A%2F%2Fieeexplore.ieee.org%2Fiel5%2F39%2F17037%2F00785784.
pdf%3Farnumber%3D785784? 7 http://www.sciencedirect.com/science/article/pii/B9780080450308500199 (adapted
from Table 17.5)
Market Information Report: Colombia | 10INFORMATION REPORT: COLOMBIA
Security of energy supply
Indicators
Total generation GDP growth Net electricity imports
(billion kilowatt-hours) (2013) (2012, billion kilowatt-hours)
57.81 4.7% -0.709
Total consumption Reserves Electric network
(billion kilowatt-hours) (billion barrels) connectedness (low-high)
49.39 2.4 Medium
SUMMARY OF KEY FINDINGS
Security of energy supply is the “resilience of the energy TOTAL ELECTRICITY GENERATION AND
system to unique and unforeseeable events that threaten CONSUMPTION (BILLION KILOWATT-HOURS, 2014)
the physical integrity of energy flows or that lead to discon-
tinuous energy price rises, independent of economic 700
fundamentals” (OECD).
600
Relative to Canada and China, Colombia’s energy supply 500
is somewhat insecure as it relies heavily on fossil fuel and
400
hydropower for generation. However, it is more secure than
Chile due largely to its regional electric network connect- 300
edness, which allows for imports and exports of electricity.
200
It is a net exporter of more than 700GWh of electricity due
to its connectedness with Ecuador, Peru and Venezuela 100
(and a planned expansion of transmission lines to Panama). 0
More than 60% of its installed generation capacity is from Chile Colombia Canada
hydropower. This, combined with its fossil fuel reserves, has
Generation Consumption
put Colombia in a fairly secure position in recent years. It is
also a net exporter of oil, and has begun exporting natural
gas. However, with only 2.445 billion barrels of proven crude
Figure 3. Total electricity generation and consumption, billion kilowatt-
oil reserves remaining, Colombia is expected to run out of hours, 2014. Source: EIA and IEA.
oil in about seven years. As economic growth and energy Note: China numbers only available for 2012, not included above.
demand are expected to continue to expand, Colombia will
likely need to invest in other sources of energy to ensure
a secure supply. Recognizing this, the government has
launched several initiatives to promote the deployment of
non-hydroelectric renewables, such as biofuels and solar.
Market Information Report: Colombia | 11INFORMATION REPORT: COLOMBIA
PROVEN FOSSIL FUEL RESERVES
Table 3.
(BILLION BARRELS)
Electricity imports and exports,
billion kilowatt-hours, 2012.
Source: EIA (billion kwh, 2012)
Canada
172.48
Electricity Electricity Electricity
Country imports exports net imports
Colombia
2.38
Canada 11.39 57.97 -46.58
Chile 0.00 0.00 0.00 China
24.38
China 6.87 17.7 -10.78
Colombia 0.01 0.72 -0.71 Chile
0.2
0 20 40 60 80 100 120 140 160 180 200
Figure 4. Proven fossil fuel reserves, billion barrels, 2015. Source: EIA.
GENERATION AND CONSUMPTION
According to the U.S. Energy Information Administration, The total installed generation capacity in Colombia is
in October 2013, Colombia had 14.4 GW of installed equivalent to 53 TWh. The Colombian power system consists
of a single interconnected network (NIS) that supplies
electricity generation capacity, of which over 60% almost 99% of the total demand. The remaining demand is
was derived from hydropower. Colombia generated 5.3 covered with local generation.
terawatt hours (TWh) of electricity in October 2013, of Currently, half of the generation capacity in Colombia is
which 68% was provided by hydroelectric plants, 18% by privately owned, with three main companies, together,
gas, 8% by coal and less than 1% by oil. representing around 63% of the total electricity market
share (in 2012)8. Endesa SA, Gas Natural Fenosa and
Empresas Publicas de Medellin (EPM) are the three main
actors in terms of electricity generation in Colombia.
Market consumption volume increased with a compound
annual growth rate (CAGR) of 3.4% between 2008 and
SHARE OF ENERGY DEMAND 2012, reaching a total of 48.8 TWh in 2012. The market’s
volume is expected to rise to 59.0 TWh by the end of 2017,
representing a CAGR of 3.9% for the 2012–2017 period.
The residential segment was the market’s most lucrative
Transportation
in 2012, with total revenues of $2.7 billion, equivalent to
Industry
41.7% of the market’s overall value. The industrial segment
Public and Commercial contributed revenues of $2 billion in 2012, equating to
Residential 29.8% of the market’s aggregate value. The performance of
Unidentified
the market is forecasted to follow a similar pattern with an
anticipated CAGR of 6.8% for the five-year period of 2012 to
Construction
2017. This is expected to drive the market to a value of $9.1
Agriculture and Mining billion by the end of 2017. Comparatively, the markets of the
United States (US) and Mexico are expected to grow with
0 5% 10% 15% 20% 25% 30% 35% 40%
CAGRs of 3.7% and 1.1% respectively, over the same period,
to reach respective values of $435.7 billion and $24.7 billion
in 2017.9
Figure 5. Share of energy demand by sector.
8 MarketLine, “Electricity Industry Profile: Colombia” http://store.marketline.com/
Product/colombia_electricity?productid=MLIP1209-0009
9 MarketLine,p. 12.
Market Information Report: Colombia | 12INFORMATION REPORT: COLOMBIA
ENERGY IMPORTS AND EXPORTS
OIL ELECTRICITY
In 2012, Colombia’s oil exports amounted to Colombia is a net exporter of electricity. According
777,900 bbl/day, of which 432,000 bbl/day went to the UPME, in October 2013, Colombia exported
to the US, its top oil export destination, followed a total of 57.8 GWh of electricity, of a total 57.9
by Panama, China and Spain. Crude petroleum is Colombia’s GWh traded. Of total exports, 89% is exported to Venezuela
main export product. and the remainder to Ecuador.
In 2011, Colombia imported the equivalent of 10 bbl/day. Colombia imported 0.1 GWh from Ecuador in 2013.11
Refined petroleum represents 9.3% of products imported
into the country.10
10 http://www.eia.gov/countries/analysisbriefs/Colombia/colombia.pdf
11 http://www.eia.gov/countries/analysisbriefs/Colombia/colombia.pdf
NATURAL GAS
In 2007, natural gas production began to exceed
consumption, allowing for exports. Through the
Trans-Caribbean Gas Pipeline, Colombia began
exporting to Venezuela and has plans to expand to Panama
and Ecuador.
In 2011, Colombia produced 387 billion cubic feet (Bcf) of dry
natural gas and consumed 312 Bcf.
PROVEN RESERVES
According to the Oil and Gas Journal (OGJ), Colombia had
approximately 2.4 billion barrels of proven crude oil reserves
as of January 1, 2014. Although exploration is ongoing and
discoveries continue to be announced, Colombian officials
estimate that, at current reserve levels, its oil reserves will
last about seven years.12
Colombia produced 969,000 barrels per day (bbl/d) of oil
in 2012, up 61% from the 604,000 bbl/d produced in 2008.
The Ministry of Mines and Energy reported that Colombian
production is expected to reach 1.3 million bbl/d by 2020. In
2012, Colombia consumed 287,000 bbl/d, allowing it to export
most of its oil production.
12 http://www.eia.gov/countries/analysisbriefs/Colombia/colombia.pdf
Market Information Report: Colombia | 13INFORMATION REPORT: COLOMBIA
GDP GROWTH
Colombia’s 2014 nominal GDP was $377.8 billion, while consumption will be among the key drivers of economic
GDP per capita stood at $7,720, following a trend of steady activity, although a recent spike in unemployment (from
growth.13 Analysts at The Economist project the country’s 7.7% in November 2014 to 10.8% in January 2015) is cause
GDP growth to slow in 2015 to around 3.5% (from 4.8% for concern.14
year-on-year in 2014), but to increase thereafter, bolstered
by improvements to the business environment, sound 13 http://data.worldbank.org/country/colombia
macroeconomic management, investment growth and the 14 http://www.gbm.scotiabank.com/English/bns_econ/latin.pdf
expansion of the US economy. Nevertheless, weak global
oil prices present a risk to the economy. In 2015, domestic
ORIGIN OF GDP (% REAL CHANGE)
2015 2016
Agriculture
3.0
3.8
Industry
estimated
3.5%
2.0
2.5
growth
Services
3.3
4.2
Figure 7. Projected origin of GDP: Colombia 2015–2016.
in Colombia’s
Source: The Economist Intelligence Unit
GDP in 2015
GDP % GROWTH, ANNUAL
5.0
4.5
4.0
3.5
3.0
2.5
2.0
1.5
1.0
Colombia
0.5
0 Latin American
& the Carribean
2012 2013 2014e 2015f 2016f 2017f
Figure 6. Annual GDP growth: Colombia and Latin America and the Caribbean. Source: Global Economic Prospects. World Bank
Market Information Report: Colombia | 14INFORMATION REPORT: COLOMBIA
NETWORK CONNECTEDNESS
Colombia’s network is connected to its neighbours in a limited fashion. Some transactions take place with Ecuador, Peru and
Venezuela. The governments of Colombia and Panama have announced plans to build 614 km of transmission lines to connect
the two countries’ power grids, with an estimated transmission capacity of 300 MW and the option to expand this to 600 MW.15
While operations have been delayed, it is estimated that the system will launch in 2018.
15 http://www.securities.com/emis/sites/default/files/EMIS%20Insight%20-%20Colombia%20Power%20Sector%20Report.pdf
Interconnection
in construction
Interconnection
currently in
operation
Planned
interconnection
Studies
Figure 10: Planned interconnection lines between Bolivia, Peru and Chile. Source: Meeting the electricity supply/demand balance in Latin America and
the Caribbean, The World Bank, 2010.
Market Information Report: Colombia | 15INFORMATION REPORT: COLOMBIA
Quality and resilience of
electricity supply
Indicators
Average frequency Average duration of
of interruptions (per interruptions (hours per
subscriber) customer per year)
18.6 17.7
Value lost due to electrical Exposure to Access to electricity
outages (% of sales) severe weather (% of population)
1.8% Medium 96.8%
SUMMARY OF KEY FINDINGS
Although nearly 97% of Colombians have access to AVERAGE DURATION OF ELECTRICITY INTERRUPTIONS
electricity, they experience frequent, long interruptions. PER CONNECTION (HOURS)
Value lost as a result of these interruptions, at 1.8% of
20
sales, are relatively high compared to other developing
17.7
16
countries, as well as China, Canada, and Chile. However, 15
they are low compared to many countries in Latin
America and the Caribbean, where the average loss is 10
3.3% of sales. Regulations set in 2008 have led to an 5.9
improvement in distribution efficiency, despite increasing 5
consumer demand. Marked improvement has occurred in
1.5
average frequency of interruptions per subscriber, which 0
Colombia Chile China Canada
decreased from 42.4 per year in 2008, to 18.6 per year
in 2013. The cost of these improvements has largely been Figure 8. Average duration of electricity interruptions per subscriber
borne by the consumer, particularly those in rural and (hours per customer). Note: information for Chile is out of date (2005)
as recent data is not readily available. Source: World Bank Group
remote areas. Colombians in remote and rural areas that Benchmarking Analysis of Electricity Distribution in Latin America and
the Caribbean, and the University of Waterloo (2014).
are not interconnected often have electricity less than
eight hours per day. Cleantech facilitates access, builds
resilience, and reduces costs may provide solutions for
Colombian consumers, utilities, government, and other
actors in the electricity system.
Market Information Report: Colombia | 16INFORMATION REPORT: COLOMBIA
AVERAGE FREQUENCY OF INTERRUPTIONS PER VALUE LOST DUE TO ELECTRICAL OUTAGES
CONNECTION (NUMBER OF OCCURRENCES PER YEAR) (% OF SALES)
20
18.5 Canada 0.13%
China 1.30%
15
Chile 1.30%
10
10
Colombia 1.80%
5 0 0.5% 1.0% 1.5% 2.0%
2.5
Figure 10. Value lost due to electrical outages (as a percent of sales).
0 Source: World Bank, 2013.
Colombia Chile Canada
Figure 9. Average frequency of electricity interruptions per subscriber
(number of occurrences per year). Note: information for Chile is out of
date (2005) as recent data is not readily available. Source: World Bank
Group Benchmarking Analysis of Electricity Distribution in Latin America
and the Caribbean, and the University of Waterloo (2014).
Colombians
remote
in
and rural
areas that are Table 4. World Risk Index Rankings, measuring
not interconnected exposure to severe weather (where 1 is greatest
exposure). Source: United Nations University,
often have Institute for Environment and Human Security.
Country Rank
electricity less Canada 143
than eight
Chile 26
China 78
hours Colombia 79
per day.
Market Information Report: Colombia | 17INFORMATION REPORT: COLOMBIA
RELIABILITY/QUALITY According to Colombia Inteligente, roughly 2 million
Colombians do not have access to electricity. Moreover,
Electricity market losses in Colombia are moderately high non-interconnected zones of the country have very limited
compared to other developing countries. Although losses service—generally less than eight hours per day. In these
have fallen since deregulation, terrorist attacks aimed at the remote, non-interconnected zones, producing a kilowatt-
electricity system remain a challenge for the country. Over hour of electricity could cost as much as US $0.50. Although
time, the system operator has adapted and is able to keep reliability is improving in urban cores due to regulatory
the system on line. incentives, it still lags behind international standards.
Power interruptions occur in Colombia. In 2001, the country
had an average of 60 interruptions per year, resulting in
a total of 58 hours of interrupted service.16 The length of
electricity interruptions has improved as a result of new
VALUE LOST
regulations set by CREG in 2008. A 2014 study found that According to a survey carried out by the World Bank,
electricity distribution efficiency in Colombia has improved Colombia experiences an average of 1.2 power outages in a
since 2008, and that energy losses and the length of service typical month. The value lost due to these power outages
interruptions have decreased, despite significant annual is estimated to be around 1.8% in terms of sales (compared
demand growth rates (which reflects new customers).17 to 3.3% of sales in the region of Latin America and the
However, this improvement in service quality has come at a Caribbean). Often the government blames power outages on
price: the tariff per kWh has also increased over during this rebel attacks, given the vulnerability of electricity towers.
time and the proportion received from distribution costs has
also increased relative to other components of the tariff.18
16 http://ac.els-cdn.com/B9780080450308500199/3-s2.0-B9780080450308500199-
main.pdf?_tid=9ffc70d8-cd93-11e4-a1b6-00000aacb361&acdnat=1426699645_113df
With approximately 46 people per square kilometre, 4818de08dedfe5076c5074726d8
Colombia should have a system average interruption 17 http://www.eprg.group.cam.ac.uk/wp-content/uploads/2014/02/1403-PDF.pdf
duration index (SAIDI) of approximately 120 minutes. 18 http://ac.els-cdn.com/B9780080450308500199/3-s2.0-B9780080450308500199-
However, in certain urban areas, the SAIDI is over 600 main.pdf?_tid=9ffc70d8-cd93-11e4-a1b6-00000aacb361&acdnat=1426699645_113df
4818de08dedfe5076c5074726d8
minutes.
50 SAIFI SAIDI
45
40
42.4
35
30
29.4
25 27.0
25.4 25.9
24.1 23.0
20
20.2 21.5
15 17.5 18.6
15.7
10
5
0
2008 2009 2010 2011 2012 2013
Figure 11. Colombia SAIDI and SAIFI 2008–2013. Source: EPSA 2014 (http://siper.cecacier.org/assets/es/docs/presentaciones/12-smart-grid-colombia.pdf)
Market Information Report: Colombia | 18INFORMATION REPORT: COLOMBIA
EXPOSURE TO SEVERE WEATHER
The World Risk Index measures a country’s vulnerability Colombia has a relatively high adaptive capacity, which is
and exposure to severe weather, disaster risk and environ- related to its ability to adapt to future natural events and
mental degradation. According to the World Risk Report climate change. However, it also has a relatively high lack
(2012), relative to other countries Colombia has a medium of coping capacity due to weak governance and material
level of exposure to natural hazards including earthquakes, security. The following are the details of Colombia’s scores
storms, floods, droughts and sea level rise. Colombia ranked per the 2012 World Risk Report:20
81st out of 173 countries. The main natural hazards to which
Colombia is exposed are volcanic eruptions in the highlands 19 http://ieeexplore.ieee.org/xpl/login.jsp?tp=&arnumber=785784&url=http
(the last one occurring in 2010), occasional earthquakes, and %3A%2F%2Fieeexplore.ieee.org%2Fiel5%2F39%2F17037%2F00785784.
pdf%3Farnumber%3D785784?
periodic droughts and floods.
20 https://www.ehs.unu.edu/file/get/10487.pdf
Due to El Niño and La Niña events and the country’s
high reliance on hydropower, Colombia has historically
experienced energy shortages every three to five years.19
Through reduced reliance on hydro resources over time, the
government has become increasingly adept at managing
the impacts of El Niño on energy supply and the country has
• Exposure = 13.84% (medium): Related
become less vulnerable.
to exposure of population to natural hazards,
earthquakes, storms, floods, droughts and sea level
rise
• Vulnerability = 49.8% (medium): Sum of
susceptibility, lack of coping capacities and lack of
adaptive capacity
Value lost • Susceptibility = 29.73% (medium):
Measures public infrastructure, nutrition, income and
to electrical economic framework
• Lack of coping capacity = 76.89% (high):
outages was Measures governance, medical care and material
security
1.8% of • Lack of adaptive capacity = 42.75% (low):
Related to future natural events and climate change
total sales
compared to a
regional average
of 3.3%
Market Information Report: Colombia | 19INFORMATION REPORT: COLOMBIA
Efficiency of electricity supply
(Control over rising electricity costs)
Indicators
Residential prices Industrial prices Power transmission and
(US$/MWh) (US$/MWh) distribution losses (2011)
$192.25 $126.62 12%
SUMMARY OF KEY FINDINGS
Colombia’s residential energy prices are among the most expensive in Latin America, higher than Chile, Brazil and Peru. This
is due in large part to its residential energy tariff which is the most expensive in Latin America at US$192.25 per MWh as
compared to US$188.19 per MWh in Chile, US$141.52/MWh in Peru, and US$132.4/MWh in Brazil. Industrial prices are similarly
high, though they are lower than in Chile. Both residential and industrial prices are significantly higher than in Canada. Power
losses also contribute to high prices, and are overwhelmingly concentrated in distribution. Though they have decreased
significantly in the past few years and are now below the average for Latin America and the Caribbean, they are still higher
than countries such as Canada. These high prices combined with challenges to quality and resilience of the supply may lead
consumers to seek alternative energy sources and home energy management systems to reduce their costs. Although these
technologies are not yet popular in Colombia, increasing market presence and initiatives undertaken by the government and
other organizations are leading to raised awareness and interest. Canadian cleantech companies will have much to offer this
growing market as opportunities arise.
ELECTRIC POWER TRANSMISSION AND DISTRBUTION LOSSES (% OF OUTPUT)
25
20
15
10
5
0
2005 2006 2005 2008 2009 2010 2011
Canada Colombia Latin America & Caribbean
Figure 12. Transmission and distribution losses, as percent of output (2005-2011). Source: World Bank Group.
Market Information Report: Colombia | 20INFORMATION REPORT: COLOMBIA
AVERAGE RESIDENTIAL ELECTRICITY PRICE (USD/MWH)
WHOLESALE MARKET PRICES
$250
In 2014, average energy stock prices were 4.71 COP/KWh
higher than in 2012. $200 $192.25
$188.19
In 2008 and 2009, there was a rapid increase in wholesale
$150
electricity prices in Colombia. In 2009, Frank Wolak of
Stanford University identified four issues with the existing $94.55
$100 $82.05
electricity market design that may have contributed to
periods of high short-term prices: $50
1 The limited flexibility in the offer curves that suppliers
$0
submit to the wholesale market enhances the ability of
Colombia Chile China Canada
suppliers to exercise unilateral market power
2 The immediate public release of information on market Figure 13. Average residential electricity price, 2014. Source:
Climatescope and IEA
behaviour enhances the ability of suppliers to raise
wholesale prices
3 The use of the same offer price in the supply curve as
the one a generation unit owner submits to the Bolsa
and to the pay-as-bid auction for automatic generation
control services
4 The challenge of how to allow co-generation units AVERAGE INDUSTRIAL ELECTRICITY PRICE (USD/MWH)
owned by large industrial and commercial customers to $150.66
$160 $142.71
participate in the short-term wholesale market21
$140 $126.02
$120
$100
HOUSEHOLD PRICES $80 $69.89
$60
In 2013, Colombia’s residential energy tariff totaled US$0.19/
kWh, making it among the most expensive in Latin America. $40
$20
In 2014, Colombia’s average residential electricity price was
US$192.25/MWh—higher than Chile, Peru and Brazil. In 2014, $0
costs in Chile were US$188.192/MWh. In Peru household Colombia Chile China Canada
prices were US$141.522/MWh, and in Brazil, average Figure 14. Average industrial electricity price, 2014. Source:
residential prices were US$132.404/MWh. Climatescope.
21 http://web.stanford.edu/group/fwolak/cgi-bin/sites/default/files/files/sspd_report_
wolak_july_30.pdf
600
500
400
300
200
100
0
-12
-13
12
13
12
14
13
12
12
-12
13
13
JU 3
13
14
12
12
12
13
13
13
12
13
2
3
-1
G-
G-
V-
V-
L-1
L-1
R-
N-
R-
N-
N-
N-
C-
C-
P-
T-
P-
T-
AR
AR
B-
B-
B-
AY
AY
NO
NO
AU
AU
OC
OC
AP
AP
JU
JU
JU
DE
DE
JA
JA
SE
SE
FE
FE
FE
M
M
M
M
National Exchange Price COP/KWh Average Contracts Price COP/KWh Scarcity Price (COP)
Figure 15. Wholesale market prices 2014. Source: EMIS 2014
Market Information Report: Colombia | 21INFORMATION REPORT: COLOMBIA
350,000
CSP
300,000 0,6 < pf < 0,3
250.000 PV
0,25 < pf <
200,000 Geothermal
0,9 < pf < 0,7
150,000
Hydro
100,000 Biogas
Wind
0,6 < pf < 0,3
0,35 < pf < 0,3 0,8 < pf < 0,7
Biomass
50,000 0,81 < pf < 0,7
0
JAN 11 FEB 11 MAR 11 APR 11 MAY 11 JUN 11 JUL 11 AUG 11 SEP 11 OCT 11 NOV 11 DEC 11
Argentina Bolivia Colombia Equador Peru Uruguay
Figure 16. Levelized cost of renewable energies versus 2011 wholesale energy prices. Source: REGSA Project 2012, www.regsa-project.eu/downloads/Public%20
documents/regsa_summary.pdf
INDUSTRY PRICES
According to the IADB, Colombia’s electricity losses ratio in
The average industrial electricity price in Colombia in 2014
2012 was 20%, slightly above the Latin American country
was $126.62, coming in significantly higher than the average
average of 17%.22 Colombia’s ratio has increased by about
price in Peru (US$76.11 per MWh), slightly higher than Brazil
one percentage point since 2010.23 Colombia’s electricity
(US$125.22) and markedly lower than in Chile (US$150.67).
losses ratio is greater than that of Brazil, Argentina and
Figure 16 shows data from the REGSA Project that compares Chile. Similar to other countries in Latin America, losses are
2011 wholesale energy prices in Colombia and other Latin overwhelmingly concentrated in energy distribution (only
American countries to the levelized cost of energy for 1.9% of losses occur in transmission). The cost of electricity
different renewable energies. losses in Colombia is estimated at between 0.22% and
0.32% of GDP.
Colombia’s pricing scheme promotes a reduction in
transmission and distribution losses through rewarding
POWER TRANSMISSION AND over-performance and penalizing underperformance. The
DISTRIBUTION LOSSES regulator has established a cap on losses that can be passed
on to consumers through tariffs, meaning utilities have to
Total losses in Colombia decreased between 2010 and 2011, cover additional losses.24
leaving total losses in 2011 at 7,430,000,000 kWh. These
losses are considerably higher than in Chile, which also 22 http://www10.iadb.org/intal/intalcdi/PE/2014/14933.pdf
showed decreased losses between 2010 and 2011, with a 23 http://www10.iadb.org/intal/intalcdi/PE/2014/14933.pdf
total of 4,687,000,000 kWh lost in 2011. However, losses 24 http://www10.iadb.org/intal/intalcdi/PE/2014/14933.pdf
were considerably lower than in Brazil, which saw losses
of 87,524,000,000 kWh in 2011 (a growth of just under
2,000,000,000 kWh over 2010).
Market Information Report: Colombia | 22INFORMATION REPORT: COLOMBIA
Support for demand growth
Indicators
Urban population GDP growth Per capita usage
growth (annual) (year-on-year change)
1.7% 4.7% 44 ktoe
(7%)
SUMMARY OF KEY FINDINGS
Energy demand in Colombia is steadily growing, strategy to increase hydroelectric, gas-fired and coal
particularly in urban centres such as Bogota, Cali, power generation. In addition, a law passed in 2014
Medellin and Barranquilla. This is due in large part to the seeks to advance the integration of non-conventional
growing urbanization of Colombia’s population, as well as renewable energy sources into the national energy
strong economic growth. Coverage rates are significantly system. As it has only recently come into effect, specific
higher in large cities compared to smaller ones, where it incentives and mechanisms to promote investment,
can be as low as 40%. While national per capita energy research, and deployment of cleantech in the energy
use has only increased 7% from 2007-2012, demand is system are still being developed. However, this shift in
much higher in the country’s biggest cities. To satisfy regulation as well as unmet demand should lead to new
growing demand, the government has developed a market opportunities for cleantech deployment.
Table 5.
Support for electricity demand growth. This table considers six indicators that offer insights into projected
changes in demand for electricity. Source: World Bank Group.
Per capita energy
Urban population Economic growth Per capita energy Per capita energy use: difference 2007-
Country growth (2013) (GDP, 2013) use 2007 (kg of oil) use 2012 (kg of oil) 2012
Canada 1.4% 2.0% 8262 7270 -12%
Chile 1.1% 4.1% 1834 1874 2%
China 2.9% 7.7% 1551 2029 31%
Colombia 1.7% 4.7% 627 671 7%
Market Information Report: Colombia | 23INFORMATION REPORT: COLOMBIA
URBAN POPULATION TRENDS
URBAN POPULATION GROWTH (AS A PERCENTAGE OF TOTAL POPULATION)
100
Colombia is a highly urbanized country: 75% of the
93
population lives in cities, with 30% of the population 90 89 88
83 82 84
concentrated in Bogota, Cali, Medellin and Barranquilla.25 80
72 76 76
There are also a growing number of small and mid-sized
70 68
cities in the country. In 2006, the number of cities with more
60
than 100,000 inhabitants grew to 33. 54
50
Figure 18 shows how access to basic services, including Canada
40 Chile
electricity, has evolved in cities of different sizes. It shows
China
that coverage rates for smaller cities in Colombia are lower, 30 26
Colombia
at approximately 40%. 20
10
0
25 http://elibrary.worldbank.org/doi/book/10.1596/978-0-8213-9522-6 1990 2014 2050
Figure 17. Urban population trends, measured as a percentage of total
population. Source: United Nations
A ACCESS TO ELECTRICITY B ACCESS TO WATER C ACCESS TO SANITATION
100% 100% 100%
75% 75% 75%
50% 50% 50%
20% 20% 20%
BOGATA SMALLEST BOGATA SMALLEST BOGATA SMALLEST
LARGEST LARGEST LARGEST
1964 1993 2005
Figure 18. Evolution of access to services based on city size. Source: World Bank 2012
Market Information Report: Colombia | 24INFORMATION REPORT: COLOMBIA
CHANGE IN ENERGY USAGE
Electricity growth (year-on-year) was 4% in 2013, down from Table 6: National electricity demand (GWh) forecast
4.7% in 2005. This growth was fuelled by rising consumption
from both private and household users. The strong growth National electricity demand (GWh) forecast
of the Colombian economy also contributed to growth rates Medium
for the power generation sector, due to increasing electricity Year Low scenario scenario High scenario
consumption by public companies.26 2015 63,983 65,526 67,070
2017 68,572 70,172 71,7733
UPME’s 2013–2027 electricity strategy is to enhance
power sector capacity and encourage investment in the 2019 74,276 75,944 77,613
energy sector to satisfy growing electricity demand. The 2021 78,040 79,786 81,531
government plans to increase Colombia’s power generation 2023 82,995 82,825 84,654
during the period by an annual average of 3.4% to 76.0 TWh. 2025 84,610 86,529 88,448
This includes an average annual increase of: 2027 88,250 90,265 92,279
• Hydroelectric power generation by 3.6%
• Coal generation by 2.9% Table 7: Forecast of national maximum capacity
• Gas-fired generation by 2.7% Forecast of national maximum capacity (MW)
Tables 3 and 4 are adapted from UPME. They provide low, Medium
medium and high forecast scenarios for Colombia’s national Year Low scenario scenario High scenario
electricity demand and national maximum capacity through 2015 10,272 10,524 10,776
2027. 2017 10,662 10,923 11,184
2019 11,124 11,396 11,668
26 http://www.securities.com/emis/sites/default/files/EMIS%20Insight%20-%20 2021 11,641 11,926 12,120
Colombia%20Power%20Sector%20Report.pdf
2023 12,202 12,500 12,798
2025 12,800 13,113 13,426
2027 13,434 13,673 14,091
Market Information Report: Colombia | 25INFORMATION REPORT: COLOMBIA
Environmental sustainability
Indicators
Share of non-hydroelectric Pollution levels Climate change target
renewable generation (PM10)
3.3% 19.73 g/m3µ
none
(Low)
Targeted share of non- Renewable energy target
hydroelectric renewable (total energy mix
generation by 2020)
6.5% 5%
(by 2020)
Colombia’s climate and renewable energy targets are less
SUMMARY OF KEY FINDINGS ambitious than other markets in Latin America, such as
Chile. Though Colombia is party to the Kyoto Protocol,
as an Annex II country they are not required to make
The majority of Colombia’s renewable generation is large
carbon emissions reduction commitments. Without such a
hydro, with only 3.3% coming from non-hydroelectric commitment there is less pressure to invest in renewable
sources. This is similar to Canada’s 3.5% share, as energy for environmental sustainability. However, to reach
existing targets as well as meet unmet demand and secure
both countries have significant hydroelectric resources
the energy supply, increases in smart grid and other
and fewer other sources of renewable generation in cleantech deployment will be required.
the mix. The Colombian government seeks to nearly
Table 8.
double that number by 2020, as well as increase the
Pollution levels, as measured by PM10 particulate
amount of renewable energy in the total energy mix. (µg/m3). Source: World Bank Group.
This similarity may create opportunities for Canadian Country Rank
companies with expertise and technology suited for Canada 10 (Low)
hydroelectric generation. Furthermore, Colombia has Chile 46.2 (Medium)
some of the highest energy potential in Latin America China 60.24 (High)
due to its climate and geography which are well suited Colombia 19.73 (Low)
for investment in renewable energy generation.
Market Information Report: Colombia | 26You can also read