Leaks, maintenance and emissions: Refrigeration and air conditioning equipment - Prepared for the Department of Agriculture, Water and the ...
←
→
Page content transcription
If your browser does not render page correctly, please read the page content below
Leaks, maintenance and emissions:
Refrigeration and air conditioning
equipment

Prepared for the Department of Agriculture, Water and the Environment
                                                       February 2021

                                  Phone              Web
                                  +61 3 9592 9111    www.expertgroup.com.au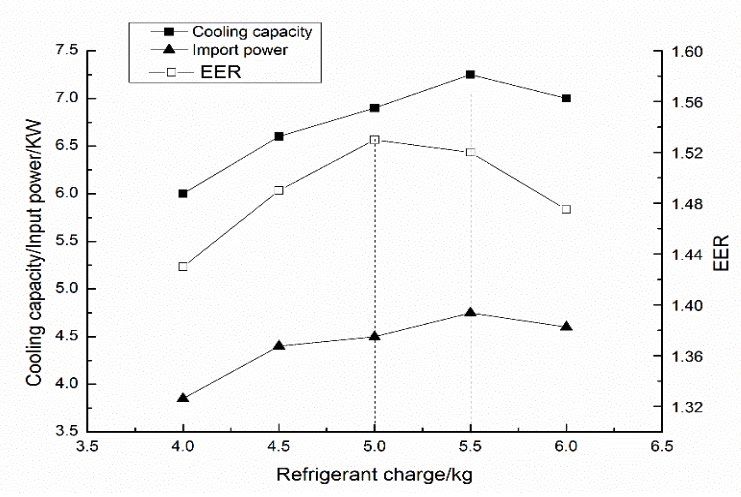
Table of Contents
1     Executive summary ................................................................................................................... 5
2     Introduction ............................................................................................................................... 7
2.1     Scope and method .................................................................................................................................. 8
2.2     Why does it matter?................................................................................................................................ 9
2.3     Previous review of leak reduction strategy and maintenance activities ............................................... 10
2.4     Equipment types targeted for efficiency improvements ....................................................................... 11
3     Common faults ......................................................................................................................... 13
3.1     The common faults ............................................................................................................................... 13
            Stationary air conditioning specific faults .................................................................................... 13
            Commercial refrigeration specific faults ...................................................................................... 14
3.2     How common and how bad: Prevalence and severity .......................................................................... 15
3.3     Prevalence ............................................................................................................................................ 16
3.4     Severity................................................................................................................................................. 16
3.5     Energy penalty or opportunity.............................................................................................................. 17
3.6     Sources and causes of mechanical refrigerant losses ........................................................................... 19
3.7     Energy penalty of sub-optimal refrigerant charges .............................................................................. 21
            Studies on energy penalty of sub-optimal charges ........................................................................ 21
            Modelling of the energy penalty of sub-optimal charges .............................................................. 23
4     Common faults detailed .......................................................................................................... 26
4.1  Refrigerant: Undercharge ..................................................................................................................... 26
4.2  Refrigerant: Overcharge ....................................................................................................................... 27
4.3  Condenser fouling ................................................................................................................................ 28
4.4  Evaporator issues.................................................................................................................................. 30
4.5  System capacity: Over or undersizing .................................................................................................. 31
4.6  Controls, sensors and wiring issues ...................................................................................................... 32
4.7  Poor equipment location....................................................................................................................... 34
4.8  Liquid line issues .................................................................................................................................. 35
4.9  Refrigerant health and non-condensables............................................................................................. 36
4.10 Minimal documentation ....................................................................................................................... 39
4.11 Specific to air conditioning .................................................................................................................. 40
         Airflow: Air distribution/duct sizing, dampers and fans ............................................................... 40
         Airflow: Filters .............................................................................................................................. 41
         Duct insulation and leakage .......................................................................................................... 42
4.12 Specific to commercial refrigeration .................................................................................................... 43
         Excessive heat load ....................................................................................................................... 43
5     Market failures, commissioning and maintenance ............................................................... 45
5.1     Least cost purchasing and information failure ..................................................................................... 45
5.2     Commissioning failure ......................................................................................................................... 45
5.3     Maintenance ......................................................................................................................................... 47
5.4     What can be addressed with maintenance ............................................................................................ 47
5.5     Characterising maintenance ................................................................................................................. 48
            Maintenance strategies ................................................................................................................. 48
            Levels of maintenance ................................................................................................................... 49
5.6     Maintenance procurement .................................................................................................................... 50
5.7     What is energy efficiency maintenance? .............................................................................................. 51
5.8     Smart maintenance ............................................................................................................................... 51
6     Conclusion ................................................................................................................................ 53

                                                                                                                                                  Page 2 of 56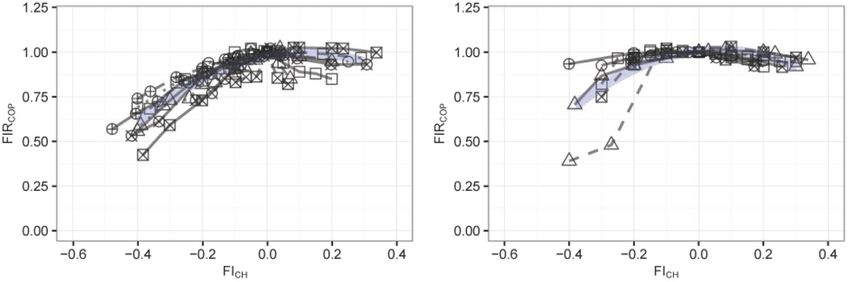
7 Appendix A1: Technology format: Opportunity table ........................................................ 54
8 Appendix A2: The basics ........................................................................................................ 55
Attached Appendices
Appendix B: References
List of Figures
Figure 1: Sources of refrigerant leaks identified by refrigeration technicians and contracting businesses. ................... 20
Figure 2: Key causes of refrigerant leaks observed by refrigeration technicians and contracting businesses. .............. 20
Figure 3: Meta-analysis of energy penalty versus refrigerant charge variation. ............................................................ 21
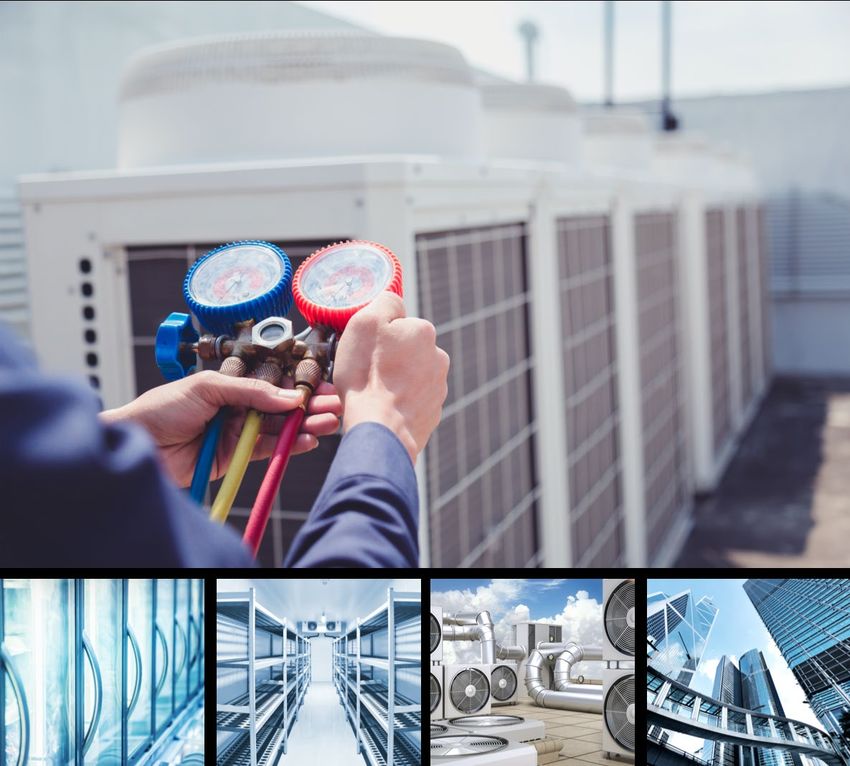
Figure 4: Energy penalty versus refrigerant charge curve of 9 kW ducted split system. ............................................... 22
Figure 5: Energy penalty curve of walk-in cold room with a remote condensing unit with a cooling capacity of 6.5 kW
operating on HFC-404A. ...................................................................................................................................... 23
Figure 6: Energy penalty versus refrigerant charge of a ducted split air conditioning system. ..................................... 24
Figure 7: Energy penalty versus refrigerant charge of a commercial refrigeration system with remote condenser. ..... 25
Figure 8: Typical single stage vapour compression refrigeration system. ..................................................................... 55
List of Tables
Table 1: Technology Format Opportunity Table. ............................................................................................................ 6
Table 2: Direct and in-direct emissions from RAC equipment in Mt CO2e in Australia 2019. ....................................... 7
Table 3: Stocks and electricity consumption of larger energy using segments of RAC equipment in 2019.................. 12
Table 4: Common faults in air conditioning equipment and systems. ........................................................................... 14
Table 5: Common faults in commercial refrigeration equipment and systems. ............................................................. 15
Table 6: Potential energy uplift from applying RAC maintenance. ............................................................................... 48
Table 7: Characterising maintenance. ............................................................................................................................ 49
Table 8: Maintenance strategy prevalence within the RAC sectors. .............................................................................. 50
Page 3 of 56This paper has been prepared for the Australian Government Department of Agriculture, Water and the
Environment,
Prepared by Peter Brodribb of the Expert Group (A.C.N. 122 581 159) and Michael McCann of Thinkwell
Australia Pty Ltd (A.C.N. 113 454 112) with Vincent Aherne, Graham Anderson and Phil Wilkinson.
Suite 9, Level 1, 214 Bay Street, Brighton, Victoria 3186
Ph: +61 3 9592 9111
Email: inquiries@expertgroup.com.au
Web address: www.expertgroup.com.au
Disclaimer
The views and opinions expressed in this publication are those of the authors and do not necessarily reflect
those of the Australian Government or the Department of Agriculture, Water and the Environment.
While due care and skill have been exercised in preparing and compiling the information and data in this
publication, the authors and the Department of Agriculture, Water and the Environment, its employees and
advisers disclaim all liability, including liability for negligence and for any loss, damage, injury, expense or
cost incurred by any person as a result of accessing, using or relying on any of the information or data in this
publication, to the maximum extent permitted by law.
© Commonwealth of Australia 2021
Ownership of intellectual property rights
Unless otherwise noted, copyright (and any other intellectual property rights) in this publication is owned by
the Commonwealth of Australia (referred to as the Commonwealth).
Creative Commons licence
All material in this publication is licensed under a Creative Commons Attribution 4.0 International Licence
except content supplied by third parties, logos and the Commonwealth Coat of Arms.
Inquiries about the licence and any use of this document should be emailed to copyright@awe.gov.au.
Cataloguing data
This publication (and any material sourced from it) should be attributed as: Expert Group 2021, Leaks,
maintenance and emissions: Refrigeration and air conditioning equipment, prepared for the Department of
Agriculture, Water and the Environment, Canberra. CC BY 4.0.
ISBN 978-1-76003-378-1
This publication is available at environment.gov.au/protection/ozone/publications/leaks-maintenance-
emissions-refrigeration-and-air-conditioning-equipment.
Department of Agriculture, Water and the Environment
GPO Box 858 Canberra ACT 2601
Telephone 1800 900 090
Web awe.gov.au
Page 4 of 561 Executive summary
This project assessed the potential for improvements to maintenance regimes on refrigeration and air
conditioning (RAC) equipment to deliver meaningful reductions in electricity use, refrigerant leaks and
indirect emissions. As a major cross-cutting technology, present in all sectors of the economy RAC
equipment was estimated to produce more than 11% of Australia’s annual greenhouse gas emissions in 2019.1
An extensive survey of the international literature on common faults in RAC equipment was conducted and
revealed a range of potentially large energy saving, leak reduction and emissions reduction opportunities.
The study confirms that there are a limited number of common faults reported across large stocks of RAC
equipment that result in the great majority of energy penalties and refrigerant leaks.
An energy penalty is defined as electricity consumed by a piece of equipment, over and above the optimal
electricity consumption levels of the equipment, as a result of poor installation and/or operating conditions.
These are the most common faults responsible for the largest portion of energy penalties and refrigerant leaks
across the stocks of both refrigeration and air conditioning equipment:
Sub-optimal refrigerant charge (over or undercharge, refrigerant leakage).
Dirty condensers and mechanical issues (fouling, faulty fan).
Dirty evaporators and mechanical issues (fouling, ice-up, obstructions, faulty fan).
System capacity (no heat load calculation, disconnect between owner and designer, safety margins) and
mismatched components.
Control systems, sensors and wiring issues.
Poor equipment location.
Liquid line issues (including restrictions).
Degraded and contaminated refrigerant.
Minimal or no documentation (installation, commissioning baseline data, operation, maintenance).
Excessive heat load (applies only to refrigeration).
Airflow: Air distribution, duct sizing, dampers and fans (applies only to air conditioning).
Airflow: Filters (applies only to air conditioning).
Duct insulation and leakage (applies only to air conditioning).
These common faults occur across most equipment segments. A large majority of these faults are related to
maintenance or can be addressed by routine maintenance. These common faults are discussed in detail in
Section 4.
The most commonly recurring fault in commercial refrigeration and air conditioning equipment, is
refrigerant undercharge - which is directly related to refrigerant leakage. Refrigerant undercharge results in
significant ongoing energy penalties, as discussed in detail in Section 3.
Possibly the single most important measure to improve RAC equipment performance is to eliminate leaks of
refrigerant gas. Apart from reducing direct emissions, ensuring equipment is operating on an optimal
refrigerant charge delivers the additional benefit of reducing electricity use and electricity-related greenhouse
gas emissions. However, there are important differences in how the opportunities in those two broad classes
of technology might be addressed.
A significant finding is that by establishing a few important installation and maintenance practices as routine
activities, there is the potential to capture large electricity savings across a wide variety of equipment formats.
Equipment formats that are considered most prospective for delivering electricity savings are tabulated
below.
Page 5 of 56Table 1: Technology Format Opportunity Table.
Technology Opportunity Opportunity for leak Opportunity for Emission benefit
format at installation minimisation maintenance (Direct and
indirect)
Small AC (Self No None identified No Minimal
contained)
Small AC (Non- Yes Some Some Yes
ducted)
Ducted AC (Split Yes Commercial only - Yes, mostly Yes
and package) and manual every 6 to 12 commercial only
light commercial months (incl. ducted
AC systems upwards)
Central plant Yes Manual every 6 to 12 Yes Yes
(Chillers) months with auto on
larger systems
Self-contained Some types Mostly none - manual Yes, some types (for Minimal, some types
equipment every 12 months on example, harsh can be identified
larger systems applications only, etc.)
Remote condensing Yes Manual every 6 to 12 Yes Yes
units months with auto on
larger systems
Supermarket Yes Automatic leak Yes Yes, mostly
detection independents
Central plant (Cold Yes Automatic leak Yes Yes, only regulated
storage and detection refrigerants are
process) within scope
AC = Air Conditioner
Leading contracting businesses in the heating, ventilation, air conditioning and refrigeration (HVAC&R)
industry have long term data collections at various levels of sophistication that could be used to validate the
prevalence, against the severity, of common faults and potentially calculate the cost-benefits of particular
practices with a reasonable degree of accuracy.
The project outcomes also include an extensive bibliography of recent research findings and programs
addressing the energy efficiency of RAC equipment. This report and the project findings provide a basis on
which to target further work to validate the costs and benefits of various possible policy approaches and
active measures.
Page 6 of 562 Introduction
This report explores opportunities to reduce emissions from refrigerant leaks and unnecessary electricity
consumption due to faults in the installation, operation and maintenance of stationary refrigeration and air
conditioning equipment.
In most modern economies refrigeration and air conditioning equipment is one of the largest, if not the single
largest consumer of electricity. This fact, coupled with the high GWPs of the majority of refrigerants in use,
puts this nearly ubiquitous technology at the focus of measures aimed at slowing impacts of climate change.
In 2016 a global phase down of hydrofluorocarbon (HFC) manufacture and imports was agreed under the
Kigali amendment to the Montreal Protocol. HFCs are a suite of synthetic greenhouse gases (SGGs) that are
very effective and long-lasting thermal media, and at present, the most common refrigerants used globally.
This ‘technological forcing’, driven by international treaty and national regulation, is a major step towards
reducing the overall environmental impact of RAC systems.
However, the overall climate impact of emissions of refrigerants to atmosphere are dwarfed by the
energy-related emissions from the electricity that powers the billions of pieces of RAC equipment around
the world.
The Expert Group estimated that, in Australia, losses of refrigerant from operating RAC equipment was
responsible for approximately 1.2% of national emissions in 2019. However, in that year RAC equipment
was estimated to consume more than 24% of all electricity generated in the economy, resulting in a combined
total of direct and indirect emissions of 61.28 million tonnes carbon dioxide equivalent (Mt CO2e) or
approximately 11.5% of national emissions.1
Table 2: Direct and in-direct emissions from RAC equipment in Mt CO2e in Australia 2019.
Direct In-direct Total
emissions emissions emissions (1)
(Mt CO2e) (Mt CO2e) (Mt CO2e)
Stationary AC 2.43 28.56 30.98
Mobile AC 1.40 2.94 4.34
Refrigerated cold food chain 3.16 15.80 18.96
Domestic refrigeration 0.03 6.97 7.00
Total 6.56 54.27 61.28
(Source: Cold Hard Facts 2020)1
Notes:
1. Excludes end-of-life emissions.
2. Sum of values in table do not add up to totals due to rounding.
There are hundreds of different RAC equipment formats in the economy, ranging from countertop portable
refrigerators to huge air conditioning systems that condition buildings the size of airport terminals. Nearly
all RAC equipment, irrespective of the equipment format, have common operational requirements. They all
need sufficient air flow across heat exchange surfaces to transfer heat. Most RAC equipment employ common
mechanical elements, such as the compressor that compresses and recirculates the refrigerant and the
expansion device used to help create the cooling effect through heat exchangers.
The common features in this very broad class of equipment create opportunities to identify and apply
remedial actions that could deliver efficiency improvements and reduce electricity consumption at a scale
that is meaningful to the environment and the national energy economy.
Page 7 of 562.1 Scope and method
The primary objective of this project was to identify the main causes of refrigerant leaks, energy inefficiency,
the contribution that refrigerant leaks and sub-optimal refrigerant charges make to inefficient operation, and
opportunities for energy savings across the stock of stationary RAC equipment in the economy. Heat pump
equipment were also considered as part of the research, the very large majority of air conditioners are heat
pumps due to their ability to deliver both heating and cooling. Other types of heat pumps include pool heaters,
domestic and commercial hot water heat pumps and heat pump clothes dryers. These types of heat pumps
were excluded as they are either small sealed systems, or there are relatively small stocks of this type of
larger equipment employed.
The review aimed to identify all relevant prior research into the most common causes of refrigerant leaks and
energy inefficiencies, or energy penalties, in RAC equipment.
An energy penalty is defined as electricity consumption by a piece of equipment, over and above the designed
consumption levels of the equipment, as a result of poor installation and/or operating conditions.
To provide a basis on which to assess these opportunities, this study first examined two main propositions:
1. There are common ‘faults’, including refrigerant leaks, across large stocks of RAC equipment that result
in the great majority of energy inefficiencies incurred.
2. There is sufficient commonality of RAC equipment components and design that establishing a few
important practices as routine activities, such as regular cleaning of coils and condensers, has the
potential to reduce refrigerant leaks and deliver large electricity savings across a wide variety of
equipment formats.
The first phase of the study involved undertaking a wide-ranging Australian and international literature
review.
The global literature review was conducted by a team of experts with extensive experience across the RAC
industry from equipment design to the complexities of industry supply lines, and fundamentals of installation
and maintenance of equipment of all sizes.
The desktop research started with the exploration of several key terms and variations including:
Refrigerant leakage: Detection and optimisation;
Optimal refrigerant charge: Nominal refrigerant charge, measurement, verification;
Faults: Various types and levels including building, HVAC, refrigeration, air conditioning and heat pump
(RACHP), compressor and component;
Fouling: Condenser, evaporator, filter and refrigerant dryer;
AC, heating, ventilation and air conditioning and refrigeration (HVAC&R) – commissioning,
recommissioning, optimisation, total equivalent warming impact (TEWI) and life-cycle climate
performance (LCCP);
Poor building performance: HVAC&R systems;
Automated fault detection and diagnosis, metering, monitoring, maintenance, internet of things (IoT) and
software as a service (SaaS); and,
Maintenance, encompassing air conditioning, refrigeration, energy efficiency, leak minimisation and
smart maintenance.
The research covered Australia and other regions including New Zealand, North America, the European
Union, Japan, Singapore and Hong Kong. These broad geographies and economies were selected because
they have similar technical and economic characteristics as Australia, have minimum energy performance
standards (MEPS) or equipment energy efficiency labelling and standards in place, they employ similar
training/trade skills competence regimes, and exhibit similar levels of market penetration of leading product
types.
Page 8 of 56Reports collected were scanned for the research focus and findings, and then rated by relevance to the scope
of this project as either high, medium or low. Highly relevant reports were reviewed in more detail.
Commonly reported faults, including refrigerant leaks, and causes of energy penalties were assessed to
determine whether they were applicable to RAC equipment overall, or across large parts of the stock of
equipment. From this work a list (refer Tables 4 and 5) was created of those common faults that had the
potential to produce large energy penalties across significant stocks of equipment.
In parallel, the major classes of RAC equipment were characterised to identify those stocks that are more
likely to present economic and addressable opportunities for reductions in refrigerant leaks and in electricity
use. This involved, for instance, identifying those equipment segments that were the largest electricity users,
and that might deliver the largest economic returns to equipment owners with better maintenance.
These reviews established a matrix of equipment types (refer Appendix A1: Technology format: Opportunity
table) that were judged as being the most likely areas in which economic and addressable opportunities for
electricity savings could be found.
The literature search looked for reports that investigated or quantified the effect of addressing the refrigerant
leaks and other commonly identified faults. A particular area of interest was hard data from studies into the
energy penalties caused by sub-optimal refrigerant charges.
Losses of refrigerant to air in Australia were reported as being responsible for approximately 6.56 Mt CO2e
in 2019.1 These losses represent only 1.2% of the entire Australian National Greenhouse Gas Inventory for
the year. However, if large stocks of equipment are consuming more electricity than they should be, because
of refrigerant losses, this compounds the total environmental warming impact of the synthetic greenhouse
gas emissions by increasing energy related emissions. Essentially the question is:
‘How much of the energy related emissions created by vapour compression refrigerating systems can be
attributed to equipment operating with sub-optimal charges?’
While some data was identified that is relevant to this question, more research is needed to substantiate the
estimates of additional emissions that have been made. But in short, the answer is yes, some large stocks in
high electricity consuming segments of RAC equipment use more electricity than they should. This occurs
as a result of operating with less than optimal refrigerant charge which produces significantly more energy
related emissions than if they were operating on optimal refrigerant charge.
While achieving an accurate calculation of the energy penalty incurred over large stocks of equipment as a
result of sub-optimal charges is worthy of investigation, possibly the more important question is, ‘How much
of this energy penalty can be practically avoided?’.
2.2 Why does it matter?
The implications of the fact that cooling services are consuming more than a fifth of all the electricity
generated in Australia is still not widely appreciated.
Electricity production is the largest single source of greenhouse gas emissions in the Australian economy,
producing 34% of all emissions in the year ending December 2019.2
Cooling demand is temperature driven to a great extent. This is most directly the case with air conditioning
working to deliver comfort conditions in buildings but also for commercial and industrial refrigeration of all
types, even though those applications are more likely to employ effective insulation.
The increasing range of temperatures experienced with climate change, and the longer periods of high
temperatures being recorded, means there will be more days when RAC equipment is working harder, and
for longer durations. When RAC equipment is working harder, losses of refrigerant gas increase. Hotter
component temperatures soften seals, harder working equipment vibrates more, connections loosen, and
equipment life overall is reduced by wear and tear. When refrigerant charges fall, RAC equipment must work
Page 9 of 56even harder to circulate the remaining refrigerant to transfer heat, consuming ever more electricity right when
the electricity networks are under most pressure.
In most Australian cities, the peak demand on the electricity supply system also triggers higher prices charged
to commercial equipment owners. In commercial buildings peak demand charges can be as much as 50% of
total electricity charges in the summer months.
Cold Hard Facts 2020 estimated that total energy related greenhouse gas emissions of RAC equipment in
Australia was 54.27 Mt CO2e, more than 8 times greater than the greenhouse gas emissions due to direct
emissions of refrigerants (6.56 Mt CO2e). However, it is the interaction between all these elements at the
core of our electro-technical economy on hot days that increases peak demand on electricity supply when the
grid is at its most strained.
These feedback loops in the national electricity infrastructure underline why the energy efficiency of RAC
equipment and systems is such an important focus for policy makers and business leaders.
The life-cycle assessment methodologies (TEWI, LCCP, etc.) that are applied to RAC systems account for
direct emissions due to refrigerant leakage to atmosphere.3 However, they do not account for the increase in
electricity consumption, and resulting increase of indirect emissions, associated with systems that are
operating with reduced refrigerant charge or other common faults resulting in energy penalties.
2.3 Previous review of leak reduction strategy and maintenance activities
The Assessment of environmental impacts from the Ozone Protection and Synthetic Greenhouse Gas
Management Act 1989 study undertaken in 2015 considered a wide range of emission reduction
opportunities, two of which relate to this project:4
1. A leak reduction strategy involving leak inspection routines and automatic leak detection on certain
classes of commercial RAC equipment from 2017 to 2030 was estimated to be able to avoid the
equivalent of 8.5 Mt CO2e (0.15 Mt CO2e ozone depleting substances (ODS)/8.32 Mt CO2e synthetic
greenhouse gases (SGGs)) in direct emissions as compared to business as usual, and deliver indirect
emissions savings as a result of improved efficiency of 4.7 Mt CO2e.
2. Maintenance activities on certain classes of commercial RAC equipment from 2017 to 2030 delivering
indirect emissions savings as a result of improved efficiency of 38.1 Mt CO2e.
The maintenance practices proposed were consistent with the International Organization for
Standardization’s (ISO), ISO 5149-4: ‘Refrigerating systems and heat pumps - Safety and environmental
requirements - Part 4: Operation, maintenance, repair and recovery’, and include, as examples of highly
effective and simple preventative maintenance program elements interventions such as:
a) Regular inspection and cleaning of air filters, or replacement if required.
b) Regular inspection and clearing of the surfaces of condensers, evaporators, fans blades and fan
guards.
c) Improved containment practices on equipment connections, hoses, pipes and accessories.
d) Regular inspection and repairs improving vapour sealing of cold rooms by replacing door gaskets
and sealing of insulation to minimise ambient air/moisture ingress to the refrigerated space.
As the technicians employed for the proposed activities would be capable of carrying out all suggested work,
and as many of the equipment types were very similar, the maintenance activities could simultaneously
support the delivery of the leak reduction strategy.
At the time of that study, the authors’ estimates of potential electricity savings and reductions of indirect
emissions was consciously conservative, applied to relatively limited stocks of equipment, and using flat
estimates of electricity savings of just 10%.
Page 10 of 56The International Institute of Refrigeration (IOR) provided a global estimate that ‘Better optimisation,
monitoring, and maintenance of cooling equipment has the potential to save 30 giga tonnes (Gt) of CO2e
emissions by 2050, contributing a further 38% of savings on those delivered through the planned phase down
of high GWP refrigerants agreed at Kigali.’ The IOR estimates optimisation, monitoring and maintenance
can reduce total greenhouse gas emissions by 13%.5
2.4 Equipment types targeted for efficiency improvements
Not all RAC applications and equipment types have readily addressable opportunities for efficiency
improvements. With more than an estimated 50 million individual pieces of RAC equipment employed in
the Australian economy, any practical approach to identifying addressable and economic opportunities must
first determine what attributes an equipment segment must have in order to potentially present an
economically attractive opportunity for improved efficiency.
These attributes include:
Equipment stocks that incorporate large individual pieces of equipment that on their own are significant
electricity consumers;
Equipment types that are ‘mission critical’, i.e. for them to malfunction or perform poorly risks economic
loss;
Equipment types that are more likely to leak refrigerant or be subject to common component faults;
Equipment that is more likely to have a maintenance regime or be subject to monitoring and maintenance
at some level by technically skilled personnel; and,
Equipment designs that present easy opportunities for improvements that could potentially be delivered
by low skilled personnel.
The inventory of RAC equipment in Australia, as modelled for the Cold Hard Facts research series, was
screened to identify the segments that exhibit all or some of these attributes. Appendix A1: Technology
format: Opportunity table provides a summary of the main equipment segments and identifies where
opportunities for improved installation, leak minimisation or maintenance practices could deliver emissions
savings.
The results tabulated below, represent the broad equipment segments where the largest opportunities are
expected to be found.
Page 11 of 56Table 3: Stocks and electricity consumption of larger energy using segments of RAC equipment in 2019.
Electricity consumption
(GWh/yr)
2019 Stock
Residential Commercial
Stationary AC
Split AC (Non-ducted) 10,665,000 5,700 3,500
Ducted AC (Split and package) and light commercial AC 2,797,000 5,100 10,100
Central plant (Chillers) 25,300 0 11,700
Commercial refrigeration (CR)
Self-contained equipment 1,375,000 0 6,800
Remote condensing units 350,000 0 7,300
Central plant (Supermarkets and other) 4,200 0 >4,000
1
(Source: Cold Hard Facts 2020)
An immediate outcome of the process of seeking addressable opportunities for energy savings, was the
identification of some RAC equipment segments, that for various reasons, explained below, have largely
been excluded from further study at this time.
These segments include:
Domestic refrigeration;
Small self-contained AC including window/wall units and portable AC;
Transport refrigeration;
Cold storage and process applications operating on ammonia;
Small mobile air conditioning (MAC) includes air conditioning equipment in passenger vehicles, light
commercial vehicles, trucks and commuter buses; and,
Large MAC includes air conditioning equipment in a diverse range of registered, unregistered and
off-road vehicles, such as: larger buses and coaches; locomotives, passenger trains and trams;
recreational vehicles and caravans; boats and pleasure craft; aircraft systems; mobile cranes; combine
harvesters; and road construction equipment.
These segments have mainly been excluded because of one or more of the following reasons:
1. The individual pieces of equipment involved contain very small refrigerant charges, often less than a few
hundred grams, and individually consume small quantities of electricity.
2. The stock of equipment has largely migrated to a low or zero GWP refrigerant (in the case of domestic
and portable refrigerators and freezers both 1 and 2 apply).
3. It was considered unlikely that any compelling economic or environmental benefit could be captured by
changes to installation or maintenance procedures of the stock of equipment.
4. The stock of equipment is of a specialised nature, there are relatively small stocks of this type of
equipment employed, or it is most likely to be maintained regularly by competent engineering personnel
due to the mission critical nature of the equipment or the specialised application.
Page 12 of 563 Common faults
3.1 The common faults
This report aimed to identify all relevant prior research into the most common causes of refrigerant leaks,
energy inefficiencies, or energy penalties, in RAC equipment. In the review many studies and meta studies
were discovered listing common installation and maintenance related faults found in these systems. Although
there are many similarities between the common faults found on both refrigeration and air conditioning
systems there were also some significant differences. The common faults are listed in Tables 4 and 5 below
and a detailed explanation of each fault is provided in Section 4 (including literature references).
Stationary air conditioning specific faults
The effective and efficient performance of reverse cycle air conditioning systems is ultimately determined
by having sufficient ‘refrigeration capacity’ (i.e. heating and cooling), combined with effective ‘air flows’
via the air delivery system (i.e. registers, ductwork, air reticulation and zoning), and following the relevant
technical standards and ‘Good Practice’ design (i.e. heat load calculations and product selection), installation,
commissioning and maintenance guidelines.
All the main installation and operational faults identified in Table 4 can be attributed to either inadequate
refrigeration capacity, inadequate air flow, not following good practice guidelines, or a combination of all
the above.
Page 13 of 56Table 4: Common faults in air conditioning equipment and systems.
Fault Split AC Ducted AC Central Installation Maintenance Opportunity/ Section
(Non- (Split and Plant related related fault priority
ducted) package) fault
(Chillers)
1 Refrigerant (sub-optimal Y Y Y Y Y 1 4.1 and
charge, over or undercharge, 4.2
refrigerant leakage)
2 Airflow: Air distribution, duct N Y Y Y S 1 4.11.1
sizing, dampers and fans
3 Airflow: Filters Y Y Y N Y 1 4.11.2
4 Control systems, sensors, and N Y Y Y Y 1 4.6
wiring issues
5 Condenser issues (fouling, Y Y Y S Y 2 4.3
faulty fan)
6 Evaporator fouling Y Y Y N Y 2 4.4
7 System capacity (no heat load, N Y Y Y N 2 4.5
disconnect between owner and
designer, safety margins) and
mismatched components
8 Refrigerant health and non- S Y Y Y Y 3 4.9
condensables
9 Poor equipment location N Y S Y N 3 4.7
10 Duct insulation and leakage N Y Y Y N 3 4.11.3
11 Liquid line issues (including S Y Y Y Y 4 4.8
restrictions)
12 Minimal documentation (i.e. Y Y Y Y Y 4 4.10
installation, commissioning
baseline data, operation,
maintenance)
Notes:
S = Some applications or circumstances.
The building fabric and thermal and air sealing performance of the building is a significant driver of HVAC
energy consumption. However, these aspects are considered a market failure rather than a fault and are
discussed in Section 5.
Commercial refrigeration specific faults
The effective and efficient performance of commercial refrigeration systems is similarly determined by
having sufficient refrigeration capacity and effective heat exchange mechanisms as well as appropriate
controls and correct component sizing and location.
Table 5 provides a list of the common installation and operational faults specific to commercial refrigeration,
the majority of which relate to not following good practice guidelines.
Page 14 of 56Table 5: Common faults in commercial refrigeration equipment and systems.
Fault Self- Remote Central Installation Maintenance Opportunity/ Section
contained condensing plant related related fault priority
units fault
1 Refrigerant (sub-optimal N Y Y Y Y 1 4.1 and
charge, over or undercharge, 4.2
refrigerant leakage)
2 Condenser issues (fouling, Y Y Y S Y 1 4.3
faulty fan)
3 Excessive heat load N Y Y Y Y 1 4.12.1
4 Evaporator issues (fouling, S Y Y N Y 2 4.4
ice-up, obstructions, faulty
fan)
5 System capacity (no heat N Y N Y N 2 4.5
load, disconnect between
owner and designer, safety
margins) and mismatched
components
6 Control systems, sensors and N Y Y Y S 3 4.6
wiring issues
7 Poor equipment location S Y S Y N 3 4.7
8 Liquid line issues (including N Y Y Y Y 4 4.8
restrictions)
9 Refrigerant health and non- N Y Y Y Y 4 4.9
condensables
10 Minimal documentation (i.e. N Y Y Y Y 4 4.10
installation, commissioning
baseline data, operation,
maintenance)
S = Some applications or circumstances.
As can be seen from Tables 4 and 5 there are a range of technical faults that commonly occur across all
equipment/stock sectors and a large majority of these faults are related to maintenance or can be addressed
by routine maintenance.
3.2 How common and how bad: Prevalence and severity
A fault or problem that is reported as common, is a fault that has been referred to in numerous studies and
text. As a result of the universal use of some elements of RAC equipment design (for example use of
refrigerants, condenser coils and compressors) prevalent faults are often the same across different equipment
types, and across the two broad applications of refrigeration and stationary air conditioning.
However, when considering the effect of a commonly reported fault, or problem, across large stocks of
equipment, it is not enough just to understand how often it occurs but also its prevalence and severity. It is
both the prevalence, and the severity of a problem that is important in understanding the resulting energy
penalty.
There is a tendency in any industry, to report more often on instances where faults are severe, where they
drastically impact the operation of equipment. This reporting of severe impacts suggests that certain faults
Page 15 of 56can cause equipment to operate at a fraction of design capacity, or in the worst instances, fail altogether.
However, that does not answer the question of how often a common fault can result in a severe impact. Even
if a commonly reported fault can cause severe malfunctions, under performance and energy penalties, it does
not mean that it always does, or that it does so immediately.
One way of scaling severity is based on which faults can cause equipment failure or severe malfunction, as
opposed to reduced performance. For instance, a compressor failure is catastrophic, whereas the fouling of
the condenser by dust, lint and grime, while allowing the equipment to continue to operate can drastically
erode performance. That approach however does not support an analysis focused on assessing the energy
penalty of a fault. Compressor failure brings electricity consumption to a very sudden halt.
Another approach to assessing severity is understanding the degree to which a fault could degrade
performance and increase electricity consumption, without causing total equipment failure. Using this
measure, condenser fouling has a much higher probability of causing a major energy penalty as compared to
catastrophic compressor failure. Even minor faults can be cumulatively significant if they occur within a
large installed base of equipment.
The following sections of this Chapter explore the above approaches to identify the scale of energy penalties
that common faults can produce. However, in the absence of significant samples of hard data from the field,
these approaches can only provide indications of the energy penalty of a fault or set of faults, or conversely
the energy opportunity of repairing them.
3.3 Prevalence
In terms of prevalence, the faults that are reported in the literature as common in all stocks of RAC equipment
selected for this study are listed below. These are the faults that can occur in most refrigeration and air
conditioning vapour compression system and likely to be the most prevalent faults across several equipment
segments. For equipment not regularly maintained, it can be expected that the equipment will develop faults
and performance degrade over time, depending on a range of environmental factors.
Most prevalent faults across all RAC equipment segments within scope, the common faults, are:
Sub-optimal refrigerant charge (undercharge most common);
Condenser fouling and restricted airflow;
Evaporator fouling and restricted airflow;
Refrigerant contamination, degradation, fractionation, non-condensables and flow;
Control system faults; and,
System sizing and equipment location.
Refer to Section 4 for a detailed explanation and analysis of these common faults.
3.4 Severity
For this study the severity of the faults was considered from two aspects:
1. The magnitude of the fault (fault level) – How intense is the fault on a defined scale? Fault level is
generally defined as a percentage, such as the percentage refrigerant undercharge, the percentage airflow
reduction, the percentage fouling of heat exchanger surfaces, as applicable.
2. The performance impact of the fault at various fault levels (fault impact) – In this case, for energy
penalties - defined by the percentage reduction in system coefficient of performance (COP) at a specific
fault level.
Page 16 of 56Therefore, one can consider ‘Fault Severity’ as being the product of ‘Fault Level’ x ‘Fault Impact’.
For individual faults the relationship between fault level versus fault impact (energy consumption) can be
represented by curves, such as those shown in Section 3.6 for refrigerant charge faults. Several studies have
developed similar curves for other fault types.7
3.5 Energy penalty or opportunity
The potential energy penalty or energy saving opportunity presented by each fault type across a stock of
equipment can be assessed by the relationship between ‘Fault Prevalence’ x ‘Fault Severity’.
Energy Penalty = Fault Prevalence x (Fault Level x Fault Impact)
Therefore, Energy Penalty = Fault Prevalence x Fault Severity
In the context of this report fault impacts have been researched and are relatively well understood.
The two main variables with the greatest uncertainty when assessing energy penalty are: fault prevalence and
fault level, i.e. the distribution of these faults across the various RAC stock segments and the severity of the
occurrence.
Note that there are also non-energy impacts associated with faults, for example compliance, safety,
productivity, comfort, and service life of equipment. Increased electricity use and increased direct and
indirect emissions are not the only negative outcome created by common RAC faults.
Refer to Section 4 for a detailed discussion on the prevalence, energy penalty and drivers of common faults.
Multiple simultaneous faults
The effect of having several individual equipment faults occurring on a system simultaneously should be
considered when assessing the impact of common faults on RAC equipment. In some situations, particularly
in the absence of a maintenance program, systems will experience more than one of these equipment faults
which compound the performance degradation that results. The likelihood of multiple faults occurring is
higher for new systems that are not properly installed or commissioned and for existing systems that are not
regularly maintained.
Modelling of double faults has shown the energy penalty of some fault pairs is not related and little changes
relative to the single fault condition. However, for other fault pairs, the energy penalty for the double fault
condition can be multiplied.6
In the absence of detailed bench and field testing, the extent of fault compounding can only be broadly
estimated. The component energy penalty of individual equipment faults versus the system energy penalty
of multiple simultaneous equipment faults is evidenced in:
Laboratory tests on equipment that report equipment energy increases/performance reductions;
Surveys on systems and buildings that report whole building energy increases/savings; and,
Modelling of system in buildings that estimate whole building lifecycle energy increases/savings.
Several different methodologies have been used to estimate the aggregate energy penalty of RAC faults or
RAC maintenance across regions or sectors.8, 9, 10, 5 Most of these models generate outputs by employing
broad assumptions that are themselves based on limited hard data.
Some hard data on the effect of individual faults was discovered during the literature survey13, 11, 14, 12 such as
the effect of sub-optimal charges of refrigerant modelled on its own for certain equipment types using some
limited test data.
The other common faults listed and their effect on electricity consumption in particular segments, and
potential opportunities to address these problems are explored in more detail in Section 4.
Page 17 of 56Addressable faults
Some faults tend to build up over time. These faults include incorrect refrigerant charge, dirty filters, fouled
evaporators and condensers, refrigerant contamination, and inappropriate changes to control settings. These
faults can be easily addressed and corrected by routine good practice maintenance and monitoring techniques.
Other faults are related to the original design and installation of the system. These faults include undersized
ductwork, leaking ductwork, mis-sized or mis-matched equipment, incorrect location or poor equipment
control. These faults tend to be more difficult to address as they cannot be corrected by maintenance alone,
and require optimisation, recommissioning or upgrade to repair the fault or reduce the energy penalty.
Owner versus user motivation is another factor in fault resolution. Without providing a persuasive economic
argument or identifying compelling alternative benefits to change behaviour some stakeholder groups will
not act on a fault, even after it has been identified.15 In some scenarios there can be a split-incentive
disconnect between those paying for the fault correction and those benefitting from the improved
performance and lower operating costs.
Technology changes
A further issue to consider is the rate of innovation across the industry. Modern RAC equipment now utilise
microchannel technology, speed controllable compressors, fans and pumps, electronic sensors and
components, advanced controls, new refrigerant types and digital communications abilities which can all
improve system COP. The industry is innovative, competitive and technology is constantly improving.
Modern equipment has progressively been designed to operate more efficiently with components and
refrigerant charges optimised.
This has several implications:
New equipment is less likely to leak than legacy equipment;
New equipment is more likely to be more energy efficient than existing equipment;
New equipment is more likely to be easier to integrate into a system and accurately control; and,
Optimised new equipment and components may be more susceptible to individual component level
faults. For example, due to the more refined designs and closely matched component capacities, a fault
that might have caused older styles of equipment to simply run harder, consuming more electricity, may
in some instance in new equipment designs cause an automatic alarm, and even a shut down.
The replacement of old equipment with modern typically reduces power consumption and refrigerant losses.
However, modern equipment and components may be more susceptible to performance degradation from
lack of maintenance or refrigerant leakage when compared to older, less optimised systems.
Modern equipment typically has an optimised or critical refrigerant charge, optimised speed (frequency)
controlled compressors, advanced surface heat exchangers (i.e. micro-channel), and intelligent electronic
sensors and controls. By design there is minimal ‘spare capacity’ in the system, which relies on the correct
optimal performance of each component to meet its tested/rated performance capabilities. Therefore, the
specific fault responses for modern equipment may be different to the responses for older generation
equipment, and maintenance may be even more important for high/super-high efficiency equipment to allow
them to achieve their full operational potential.
Conversely the new capabilities of modern technology, such as wireless monitoring, automatic fault detection
and diagnosis and cloud-based machine-learning algorithms can facilitate, flag and optimise the maintenance
delivery process.
Page 18 of 563.6 Sources and causes of mechanical refrigerant losses
The main types of direct emissions from RAC equipment in general, are:
Losses during installation.
Gradual leaks during normal operation.
Catastrophic losses during normal operation.
Losses during equipment service and maintenance.
Losses at end of equipment life.
Refrigerant emissions in Australia, Sources, causes and remedies, 2010 provides detailed insights into the
sources and causes of mechanical refrigerant losses.16 Sources of leaks can be broadly defined by the
location/component at which the leak occurs. Causes of leaks can be thought of as system design/performance
characteristics, or workplace practices, that increase the likelihood of leaks – often through accelerating the
degradation and eventual failure of components.
The 2010 study surveyed over 150 refrigeration technicians and contracting businesses involved in installing,
servicing and repairing refrigeration equipment. Participants were asked to nominate and comment on the
major sources and causes of leaks they had encountered or repaired over the previous 12 to 24 months.
The results of the survey are provided in Figures 2 and 3.
These results are also reflected in international studies on the causes and sources of refrigerant leakage in
commercial refrigeration, including findings from the USA Environment Protection Agency Greenhill
program17, 18 a UK study of two supermarket chains28 and the European Real Zero work.20, 21
There are many potential leak locations, especially on larger systems that have numerous joints, valves and
compressors. If leakage is slow it can go unnoticed for long periods and result in direct emissions, poor
refrigeration plant performance and a significant energy penalty due to long hours of operation of an
undercharged system.
Page 19 of 56Sources of refrigerant leaks
Figure 1: Sources of refrigerant leaks identified by refrigeration technicians and contracting businesses.
(Source: Refrigerant emissions in Australia, Sources, causes and remedies, 2010, now the Department of Agriculture,
Water and the Environment)16
Key causes of leaks
Figure 2: Key causes of refrigerant leaks observed by refrigeration technicians and contracting
businesses.
(Source: Refrigerant emissions in Australia, Sources, causes and remedies, 2010, now the Department of Agriculture,
Water and the Environment)16
Notes:
1. Survey respondents were asked to number the most common causes of leaks from 1 to 10 from a list of 20 possible
causes. Survey results were used to create a comparative score for each cause listed and the scores were then scaled
against 100 in the chart above.
Page 20 of 563.7 Energy penalty of sub-optimal refrigerant charges
Studies on energy penalty of sub-optimal charges
There is currently limited hard data available on the energy penalties incurred from operating on sub-optimal
refrigerant charges, sufficient evidence was discovered to demonstrate that across stocks of large,
hardworking equipment, sub-optimal charges are cumulatively incurring significant electricity costs for
equipment owners and the community.
These costs, coupled with the direct and indirect emissions that result, suggest a strong case can already be
made for exploring all options for low cost internet enabled automatic leak detection systems for application
in some equipment classes.
The research found several meta studies and a dozen research papers that contained system performance
curves (COP, EER) at different refrigerant charge levels, for stationary RAC and mobile AC equipment.
The general observations of the research are:
All systems show an efficiency impact when undercharged.
The severity of the energy penalty depends on the type of system, ancillaries and the extent of under or
overcharge (i.e. percentage of optimal).
Performance significantly declines below 60% of optimal charge to the extent it might be expected to
prompt a service call.
There is less impact with air conditioners in heating mode than in cooling mode.
Systems with receivers react differently and the expansion device used (fixed orifice, thermostatic,
electronic) influences the efficiency impact.
With respect to overcharging, some types of air conditioning equipment appear to be relatively unaffected
from 100 to 120% of charge. Refrigeration equipment appear to be more affected by overcharge than
air conditioning equipment.
Sections 4.1 and 4.2 provide details on over or undercharge faults including definitions, relevant equipment
types, causes, fault level drivers and discussion on system impacts.
Figure 3 shows the aggregated performance curves of air conditioning systems from a meta-analysis of 25
studies on performance variables of air conditioners and heat pumps.
Air conditioners and heat pumps
a) b)
Figure 3: Meta-analysis of energy penalty versus refrigerant charge variation.
Page 21 of 56You can also read