2013 Air Quality Progress Report for - Fareham Borough Council In fulfillment of Part IV of the Environment Act 1995 Local Air Quality Management
←
→
Page content transcription
If your browser does not render page correctly, please read the page content below
2013 Air Quality Progress Report for
Fareham Borough Council
In fulfillment of Part IV of the
Environment Act 1995
Local Air Quality Management

August 2013
Local Authority
                   Heather Cusack
Officer

Department         Regulatory Services
                   Civic Offices
                   Civic Way
Address            Fareham
                   Hampshire
                   PO16 7AZ
Telephone          01329 236100
e-mail             hcusack@fareham.gov.uk

Report Reference
                   LAQM PROGRESS REPORT 2013
number
Date               September 2013

                   Alex Moon
Prepared by        Technical Officer
Date               September 2013

                   Ian Rickman
Approved by        Shared Head of Environmental Health Partnership
Date               September 2013

Signature
Executive Summary
Fareham Borough Council have undertaken this 2013 progress report in fulfilment of
the Local Air Quality Management process as set out in Part IV of the Environment
Act (1995), the Air Quality Strategy for England, Scotland, Wales and Northern
Ireland 2007 and the relevant Policy and Technical Guidance documents.

Two Air Quality Management Areas (AQMAs) are still currently in place at Gosport
Road and Portland Street for nitrogen dioxide. Following the conclusions of this
report it is recommended that the present AQMA declarations should remain.

The monitoring data for 2012 has indicated that the annual mean NO 2 objective was
achieved at all monitoring locations except two, site G7 (193 Gosport Road) and PS3
(Portland Street). These sites only marginally exceeded the annual mean objective
and it is hoped that further monitoring will show a further downward trend as shown
in the majority of sites and in the AQMAs with the opening of the new Bus Rapid
Transit route and the conversion of the Quay Street roundabout to a “throughabout”.
The beneficial effects of these developments will not have been fully realised in this
round of review and assessment and are expected to reduce local congestion and
emissions over the next 2-3 years.

The 2012 NO2 diffusion tube results show a slight increase compared to 2011
however, the overall trend shows a regional decrease in ambient NO 2 concentrations.
It is not believed that more monitoring sites will be needed; instead the Council will
continue to monitor the existing sites to investigate where the results are a short-term
deviation driven by meteorological and other regional factors.
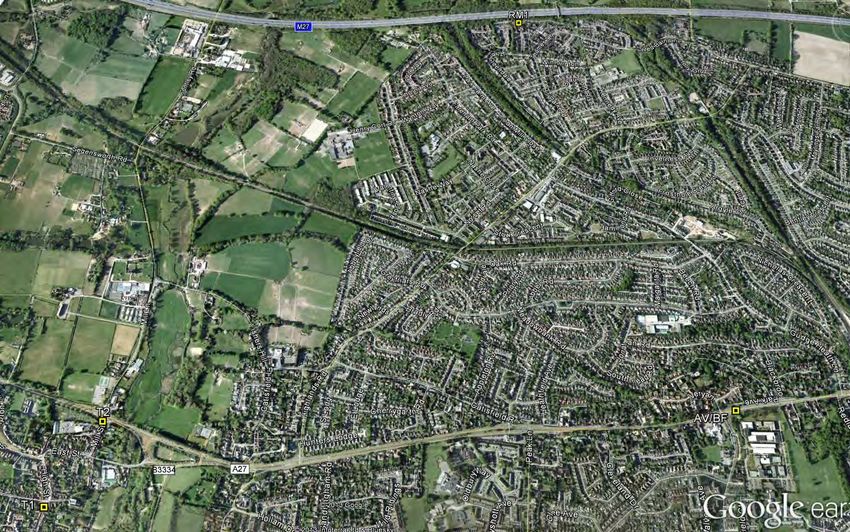
Table of Contents

1   Introduction                                                         5
    1.1   Description of Local Authority Area                             5
    1.2   Purpose of Progress Report                                      5
    1.3   Air Quality Objectives                                          6
    1.4   Summary of Previous Review and Assessments                      8
2   New Monitoring Data                                                  14
    2.1   Summary of Monitoring Undertaken                               14
    2.2   Comparison of Monitoring Results with Air Quality Objectives   29
3   New Local Developments                                               45
    3.1   Road Traffic Sources                                           45
    3.2   Other Transport Sources                                        45
    3.3   Industrial Sources                                             46
    3.4   Commercial and Domestic Sources                                47
    3.5   New Developments with Fugitive or Uncontrolled Sources         47
4   Local / Regional Air Quality Strategy                                48
5   Planning Applications                                                49
6   Air Quality Planning Policies                                        51
7   Local Transport Plans and Strategies                                 56
8   Implementation of Action Plans                                       58
9   Conclusions and Proposed Actions                                     86
    9.1      Conclusions from New Monitoring Data                        86
    9.2      Conclusions relating to New Local Developments              86
    9.3      Proposed Actions                                            87
10 References                                                            88
Appendices
    Appendix A QA/QC Data
    Appendix B Nitrogen Dioxide Diffusion Tube Results 2012
    Appendix C StAG Measures Identified Through Transport Policy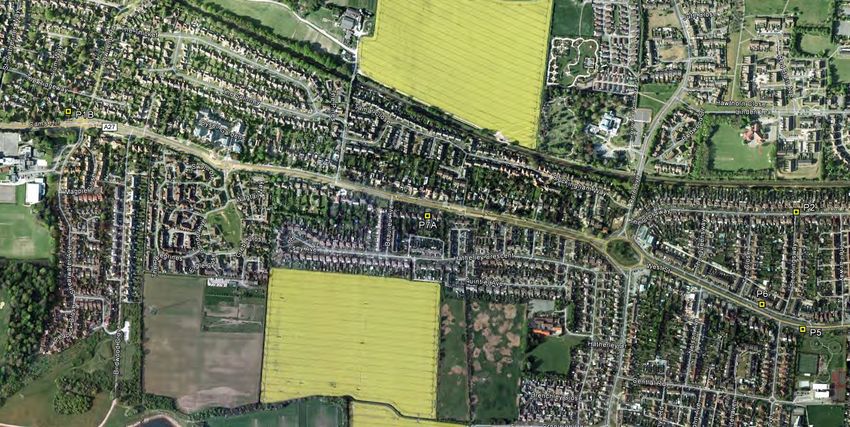
Fareham Borough Council

1          Introduction
1.1        Description of Local Authority Area
Covering an area of nearly 30 square miles, the Borough of Fareham lies on the
south coast of England close to both Southampton and Portsmouth and has an
approximate population of 108,000.

With approximately 60% countryside, the Boroughs five main urban areas are
Fareham, Portchester, Stubbington, the Western Wards and Whiteley.

Fareham is the largest town in the Borough; Locks Heath, Sarisbury, Park Gate,
Warsash and Titchfield Common, collectively known as the Western Wards, are
slightly smaller. Urban development over the years has seen Portchester and
Stubbington Hill Head grow from small villages to large residential suburbs with over
6,000 dwellings within each.

With mainline rail stations linked with Portsmouth, Southampton and London as well
as the M27 motorway running east to west through the northern part of the Borough,
Fareham is easily accessible for residents and tourists alike. In terms of local
commerce and employment the Borough has two international sea ports close by:
the Portsmouth European Ferryport and the Southampton Cruise Liner and
Container Port.

The area is also well served by air via the regional international airports of
Southampton Eastleigh Airport and Bournemouth Airport.

With consideration to local air quality, the primary source of air pollution in the
Borough is road traffic emissions, notably along the M27, the A27 Eastern
Way/Western Way and the A32 Gosport Road which passes through Fareham town
centre. Other notable local/regional pollution sources, including commercial,
industrial and domestic sources, also make a contribution to background pollution
concentrations.

Through the Local Air Quality Management (LAQM) process the Council has
declared two Air Quality Management Areas (AQMA); one at the junction of Gosport
Road and Newgate Lane, and the second in Portland Street near the Quay Street
roundabout. Both declarations were as a result of identified exceedences of the
annual mean Air Quality Strategy (AQS) objective for nitrogen dioxide (NO2), with
traffic congestion being the main identified source of emissions.

1.2        Purpose of Progress Report
This report fulfils the requirements of the Local Air Quality Management process as
set out in Part IV of the Environment Act (1995), the Air Quality Strategy for England,
Scotland, Wales and Northern Ireland 2007 and the relevant Policy and Technical
Guidance documents. The LAQM process places an obligation on all local authorities
to regularly review and assess air quality in their areas, and to determine whether or
not the air quality objectives are likely to be achieved. Where exceedences are
considered likely, the local authority must then declare an Air Quality Management

                                                                                            5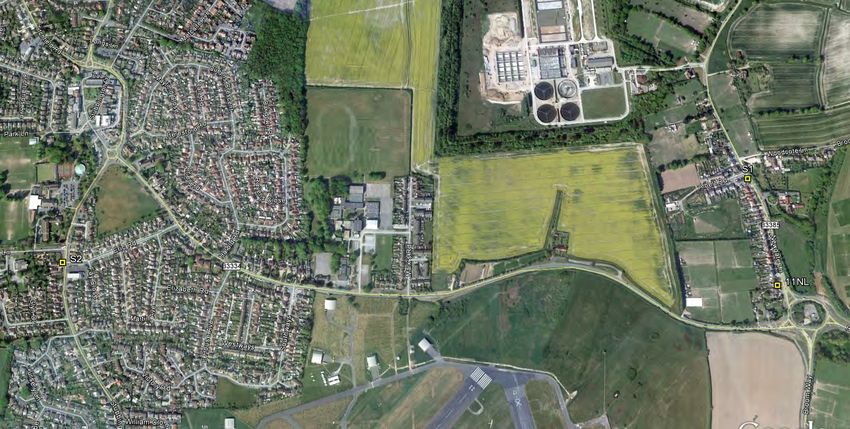
Fareham Borough Council

Area (AQMA) and prepare an Air Quality Action Plan (AQAP) setting out the
measures it intends to put in place in pursuit of the objectives.

Progress Reports are required in the intervening years between the three-yearly
Updating and Screening Assessment reports. Their purpose is to maintain continuity
in the Local Air Quality Management process.

They are not intended to be as detailed as Updating and Screening Assessment
Reports, or to require as much effort. However, if the Progress Report identifies the
risk of exceedence of an Air Quality Objective, the Local Authority (LA) should
undertake a Detailed Assessment immediately, and not wait until the next round of
Review and Assessment.

1.3       Air Quality Objectives
The air quality objectives applicable to LAQM in England are set out in the Air
Quality (England) Regulations 2000 (SI 928), The Air Quality (England) (Amendment)
Regulations 2002 (SI 3043), and are shown in Table 1.1. This table shows the
objectives in units of microgrammes per cubic metre µg/m3 (milligrammes per cubic
metre, mg/m3 for carbon monoxide) with the number of exceedences in each year
that are permitted (where applicable).

                                                                                          6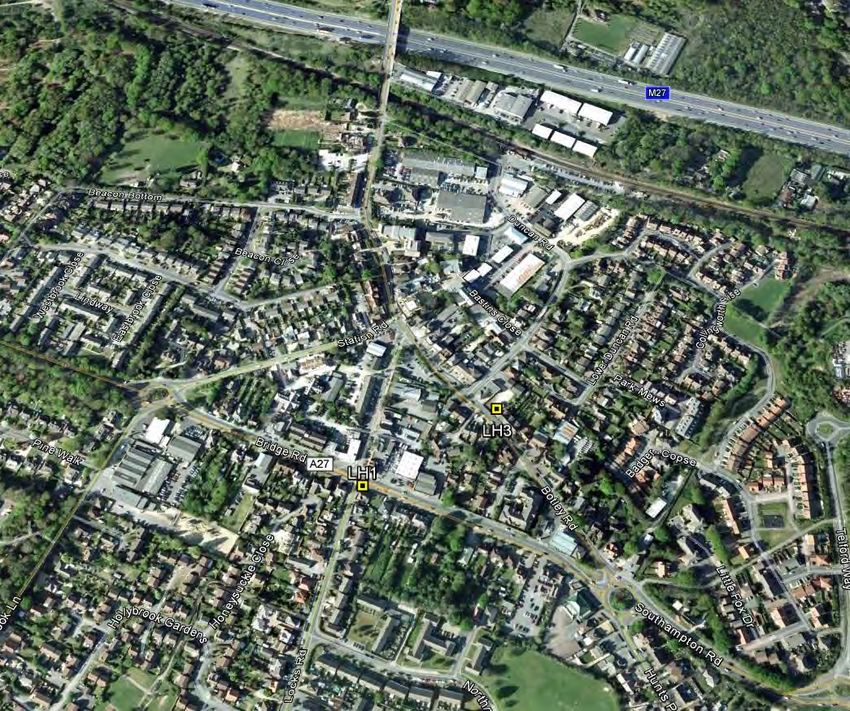
Fareham Borough Council

Table 1.1 Air Quality Objectives included in Regulations for the purpose of
LAQM in England
                             Air Quality Objective               Date to be
    Pollutant
                       Concentration       Measured as          achieved by
                                          Running annual
                        16.25 µg/m3                              31.12.2003
    Benzene                                    mean
                         5.00 µg/m3         Annual mean          31.12.2010
                                           Running annual
  1,3-Butadiene          2.25 µg/m3                              31.12.2003
                                               mean
                                           Running 8-hour
Carbon monoxide          10 mg/m3                                31.12.2003
                                               mean
                         0.50 µg/m3         Annual mean          31.12.2004
      Lead
                         0.25 µg/m3         Annual mean          31.12.2008
                     200 µg/m3 not to be
                       exceeded more
                                            1-hour mean          31.12.2005
Nitrogen dioxide       than 18 times a
                            year
                          40 µg/m3          Annual mean          31.12.2005
                     50 µg/m3, not to be
Particulate Matter     exceeded more                             31.12.2004
                                           24-hour mean
      (PM10)           than 35 times a
  (gravimetric)             year
                          40 µg/m3          Annual mean          31.12.2004
                      350 µg/m3, not to
                     be exceeded more
                                            1-hour mean          31.12.2004
                       than 24 times a
                             year
                      125 µg/m3, not to
 Sulphur dioxide     be exceeded more      24-hour mean          31.12.2004
                     than 3 times a year
                      266 µg/m3, not to
                     be exceeded more      15-minute mean        31.12.2005
                       than 35 times a
                             year

                                                                                    7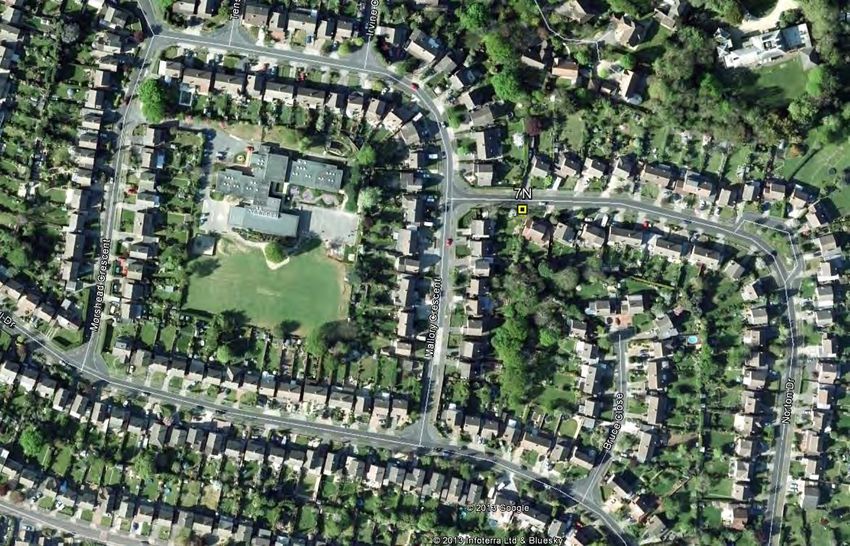
Fareham Borough Council

1.4       Summary of Previous Review and Assessments
1.4.1     First Round of Review and Assessment
Between 1998 and 2001, Fareham Borough Council undertook its First Round of
review and assessments of air quality which assessed the sources of seven air
pollutants of concern to health: carbon monoxide, benzene, 1,3 butadiene, lead,
nitrogen dioxide, sulphur dioxide and fine particulates (PM10). The First Round
assessments (Stages 1, 2 and 3) concluded that all AQS objectives were expected to
be met by the target dates, based on the available information at that time.
1.4.2     Second Round of Review and Assessment
The Second Round of Review and Assessment began with a USA in 2003. Fareham
Borough Council completed this stage in August 2003. The report concluded that as
all AQS objectives were expected to be met, a Detailed Assessment was not
required.

Fareham Borough Council completed an air quality Progress Report in May 2004.
The report provided an update regarding air quality monitoring with new data from
2003, and concluded that several diffusion tubes were exceeding the annual mean
NO2 objective at Osborne Road, Hartlands Road and Gosport Road (A32), South
Fareham. The Council therefore proceeded to a Detailed Assessment in these areas.
The assessment was carried out using detailed dispersion modelling based on traffic
data provided by Hampshire County Council, and compared the results with 2004
monitoring data.

The report was completed in June 2005 and concluded that the annual mean NO 2
objective for 2005 would be met at Osborne Road. The modelling predicted no
exceedence of the NO2 AQS objectives in Hartlands Road, although diffusion tube
results at that location were showing concentrations above the annual mean
objective of 40 µg/m3. Monitoring and dispersion modelling results showed that the
annual mean NO2 objective was likely to be exceeded in both 2005 and 2010 in
Gosport Road, at the junction with Newgate Lane and Redlands Lane. It was
recommended that the Council install a continuous analyser to monitor NO X and NO2
concentrations in the area for a minimum period of 6 months, to confirm whether an
AQMA should be declared. However, DEFRA required the Council to declare an
AQMA without waiting for the monitoring results. Consequently, an AQMA was
declared in April 2006. Continuous monitoring of NOX and NO2 concentrations was
carried out between December 2005 and July 2006.

Figure 1 depicts the Gosport Road AQMA, an area encompassing the junction of
Gosport Road, Redlands Lane and Newgate Lane, and the surrounding area.

                                                                                       8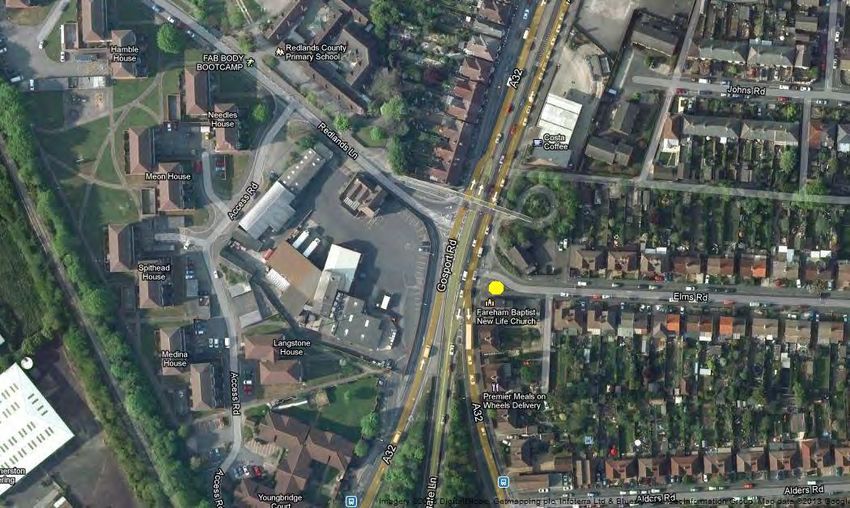
Fareham Borough Council
Figure 1: Fareham 2006 Gosport Road Air Quality Management Area
Figure 1 map reproduced with permission of Fareham Borough Council. Licensed original presented on
http://www.fareham.gov.uk/council/departments/healthcommunity/airqualmap.aspx
1.4.3 Third Round of Review and Assessment
The Third Round of Review and Assessment began with a USA, completed in 2006.
The USA included updated monitoring data for 2005 and showed that several
diffusion tubes results were above the annual mean NO2 Objective of 40μg/m3 at the
following locations (all outside the current boundaries of the Gosport Road AQMA in
Fareham):
Portland Street (PS1);
31 Hartlands Rd (Y/HR1);
Junction of Earl‟s Road and Gosport Road (G1); and
Gosport Road (G3).
9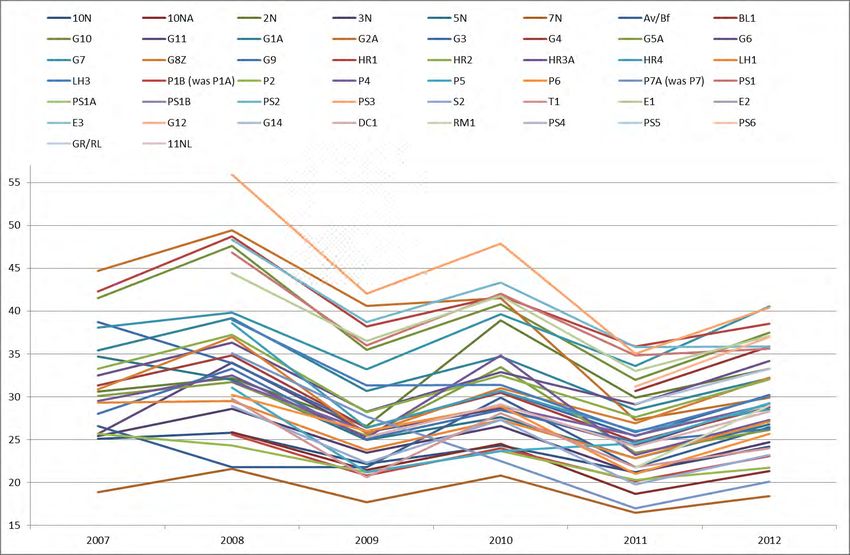
Fareham Borough Council

As the Council was required to proceed to a Further Assessment of the AQMA in
Gosport Road, it was suggested that the assessment of the G1 and G3 locations
should be incorporated. It was also concluded that as the diffusion tubes in Portland
Street and Hartlands Road were not representative of public exposure, a Detailed
Assessment was not required for these locations.
Further study of the area suggested that as local roads were used significantly by
buses accessing the bus station in Hartlands Road, an updated traffic count should
be undertaken to assist in LAQM decision making. Based on these new traffic data, it
was decided to proceed to a new Detailed Assessment in Hartlands Road / Portland
Street.
The Further Assessment of Gosport Road AQMA was carried out in 2007 together
with the Detailed Assessment of Hartlands Road / Portland Street.

Gosport Road Further Assessment 2007
The report concluded that the AQMA in Gosport Road should remain, although there
was no need to extend the AQMA boundaries further.

The results of the source apportionment indicated that background NOX remained the
main contributor, ranging from 45% to 70% of the overall NOX concentration
(depending on the distance of the receptor to the road). Cars and HGVs were the
main contributors of traffic related NOX emissions in the AQMA, with a maximum of
nearly 20% each at diffusion tube G7 and specific receptors 12 and 29. LGVs
accounted for 5% to 10% of the overall NOX concentrations, while buses contributed
between 3% and 7%. Motorcycles represented less than 1% of the total NO X
concentrations. Buses and HGVs together (HDVs) accounted for up to 25% of the
total contribution.

These contributions, when compared to the relative weight of traffic flow from each
vehicle category, as shown in Table 4.3 (of the Further Assessment report) showed
that approximately 75% of the traffic was made up of cars, versus 15% of LGVs, 4%
of HGVs and 2% to 3% of motorcycles. Buses accounted for 1% to 2% of the total
traffic flow.

The report also concluded that a new AQMA was required for NO2 in Portland Street,
following exceedences of the annual mean objective. The Portland Street AQMA was
declared in December 2007. The AQMA covers an area encompassing residential
properties and the Sacred Heart Catholic Church on Portland Street (see Figure 2).

                                                                                        10
Fareham Borough Council
Figure 2: Fareham 2007 Portland Street Air Quality Management Area
Figure 2 map reproduced with permission of Fareham Borough Council. Licensed original presented on
http://www.fareham.gov.uk/pdf/healthregs/portlandmap.pdf
The Council completed an Air Quality Progress Report in March 2008. Updated
monitoring data indicated that the annual mean NO2 objective was still being
exceeded in the two AQMAs.
Portland Street Further Assessment 2009
The Further Assessment of Portland Street AQMA was completed in April 2009.
Updated monitoring data and modelled results confirmed that the AQMA was still
required, as the NO2 annual mean NO2 objective was still likely to be exceeded in
this area. The results confirmed that the extents of the AQMA were appropriate.
Source apportionment showed that local traffic accounted for 55% to 60% of the
overall NO2 annual mean concentration in Portland Street (including a 30%
contribution from HDVs), while local background contributions accounted for 30%.
Overall it was concluded that a reduction of 70 μg/m3 in NOX concentration
(equivalent to a 16 μg/m3 reduction in NO2) was required to meet the annual mean
NO2 objective.
11Fareham Borough Council
Joint Area Air Quality Action Plan 2008
In parallel with the Detailed and Further Assessments, the Council developed a joint
Air Quality Action Plan for both AQMAs in 2008, which presented mitigation
measures to help reduce NO2 levels along Gosport Road and Portland Street.
1.4.4 Fourth Round of Review and Assessment
The Fourth Round of Review and Assessment started in 2009 with a new Updating
and Screening Assessment. The USA 2009 concluded that, although updated NO 2
monitoring showed the annual mean NO2 objective was still exceeded at a number of
sites in the Borough, the majority of these exceedences were monitored either at
sites within the AQMAs declared in Fareham for NO2, or at sites not representative of
public exposure. An exceedence of the annual mean NO2 objective was measured at
site G10, north of the AQMA in Gosport Road. As this site was located at the façade
of a property, a Detailed Assessment was required.
Subsequent Detailed Assessment work concluded from further monitoring that the
site of concern on Gosport Road would meet the annual mean NO 2 objective.
Dispersion modelling indicated that the area of exceedence was limited to the
Gosport Road and did not include the facades of any properties outside the AQMAs.
Monitoring and modelling concentrations indicated that there remained exceedences
of the annual mean NO2 objective at locations relevant of public exposure within the
Portland Street and Gosport Road AQMAs. From these results it was concluded that
amendments of the existing AQMAs were not required.
As presented in the 2010 Air Quality Progress Report, updated monitoring results for
2009 suggested exceedences of the NO2 annual mean objective remained in the two
AQMAs. A further site outside the AQMAs also showed an exceedence of the annual
mean objective. However, the site was not representative of relevant exposure.
The 2010 Progress Report also identified new planned developments in Fareham
that could impact on local air quality. These included the new food retail development
at Quay Street Fareham and the proposed Bus Rapid Transit. The Council
committed to further monitoring in these locations to assess their impact. One future
development which was noted in the report was the Strategic Development Area of
10,000 houses planned for the north of Fareham.
Updated monitoring results for 2010, presented in the 2011 Air Quality Progress
Report, indicated that exceedences of the annual mean NO2 objective continued at
locations within the two AQMAs. One site outside the AQMA boundaries also showed
an exceedence of the annual mean NO2 objective; this site is representative of
relevant exposure. The Council proposed to carry out an additional year of
monitoring and review the situation through the 2012 Updating and Screening
Assessment and to make a decision at that time on the need to undertake a Detailed
Assessment for this location.
The 2011 Progress Report identified no new local developments additional to those
detailed in the 2010 Progress Report which were likely to lead to significant increases
in any pollutant prescribed in the Air Quality Strategy.
12Fareham Borough Council
1.4.5 Fifth Round of Review and Assessment
The fifth round of review and assessment started in 2012 with a new updating and
screening assessment. The 2012 USA outlined the diffusion tube and continuous
analyser data, analysis of which showed there to be no exceedences of the NO2
objectives at relevant locations outside or inside the existing AQMAs.
In April 2012 a new continuous automatic analyser was installed at Portland Street to
measure nitrogen dioxide. This was secured via a section 106 agreement with the
developer of a new food retail store at Quay Street. The initial results of this are
shown and discussed in this report.
The previous rounds of review and assessment identified no new risk of
exceedences from new road sources and update traffic data showed no significant
changes in daily traffic flows. The conversion of the Quay Street roundabout to a
“throughabout” was completed in November 2011 and will result in traffic coming
from Gosport via the A32 and out onto the M27 via Eastern Way. Traffic will no
longer pass through Portland Street. This new road layout will hopefully reduce
emissions in the Portland Street AQMA. Traffic data for Quay Street indicated no
need for a detailed assessment.
The 2012 USA revealed a number of new or previously unidentified local
developments which could have impacted on air quality. It was determined that a
Detailed Assessment would not be required for these sources.
13Fareham Borough Council
2 New Monitoring Data
2.1 Summary of Monitoring Undertaken
During 2012, the Council operated 49 NO2 diffusion tube sites and 2 continuous
automatic sites for monitoring ambient air quality within the Borough. The new
continuous site at Portland Street was installed in April 2012 and new data has been
collected since then.
2.1.1 Automatic Monitoring Sites
The Elms Road continuous automatic site (Table 2.1) monitors for NO2 via
chemiluminescence and is located at Elms Road at the junction with the A32 Gosport
Road, within the Gosport Road AQMA (Figure 2.1.1). The site has been running
since 24th June 2008.
The new Portland Street continuous analyser was supplied and installed by
SupportingU in April 2012 and is a Teledyne Technologies Company model 200E
Chemiluminescence NO/NO2/NOx analyser housed in a Kaizen enclosure. Its
location is shown within the Portland Street AQMA in Figure 2.1.2.
Fareham and Gosport subsequently joined SupportingU in a joint three year contract
for data collection, service and maintenance of the Elms Road, Portland Street and
Tichborne Way (Gosport) from April 2012.
14Fareham Borough Council
Figure 2.1.1 Elms Road Automatic Monitoring Site
Figure 2.1.2 Portland Street Automatic Monitoring Site
15Fareham Borough Council
Table 2.1 Details of Automatic Monitoring Sites
Relevant
Exposure?
Distance Does this
(Y/N with
to Kerb of Location
OS distance
Site Pollutants In Monitoring Nearest Represent
Site Grid (m) from
Type Monitored AQMA? Technique Road (m) Worst-
Ref monitoring
(N/A if not Case
site to
applicable) Exposure?
relevant
exposure)
Elms Road 457594
NOx/NO2 Y Chemiluminescence N (3.5m) 1.5m Y
Road Side 105280
Portland Road 457954
NOx/NO2 Y Chemiluminescence N (17.30m) 1.5m Y
Street Side 106027
2.1.2 Non-Automatic Monitoring Sites
The Council now has 49 diffusion tubes sited at various locations around the Borough for monitoring NO2, these include triplicate co-
location at the continuous sites in Elms Road and Portland Street. There are 3 new sites PS4, PS5, PS6 which is the new triplicate
site located at the newly installed Portland street continuous monitor. The other 2 sites are located at the corner of Gosport Road and
Redlands lane (GR/RL) and 11 Newgate Lane (11NL). Figure 2.2 maps showing locations of the monitoring sites. Site details are
given in Table 2.2.
16Fareham Borough Council
Figure 2.2Map(s) of Non-Automatic Monitoring Sites
17Fareham Borough Council
18Fareham Borough Council
19Fareham Borough Council
20Fareham Borough Council
21Fareham Borough Council
22Fareham Borough Council
23Fareham Borough Council
24Fareham Borough Council
Table 2.2 Details of Non- Automatic Monitoring Sites
Co-located
Distance
OS with a
Site Site Pollutants Relevant to kerb of Worst-case
Site Name Grid In AQMA? Continuous
Ref. Type Monitored Exposure? nearest Location?
Ref Analyser
road
?
457800,
10N Farrier Way B NO2 N N Y - 8m 0.4m Y
104833
457775,
10NA 3 Farrier Way R NO2 N N Y - 0m 9.5m Y
104846
2 Osborne Road 457651,
2N R NO2 N N Y - 0m 3m Y
South 106244
457643,
3N 14 Osborne Road R NO2 N N Y - 0m 6m Y
106326
457234,
5N Grove Road R NO2 N N Y - 4.5m 0.5m Y
106329
457235,
7N Norton Road B NO2 N N Y - 6m 0.5m Y
107156
Avenue / 456408,
Av/Bf R NO2 N N N 2.2m Y
Bishopfields Road 106125
458376,
BL1 11 Bath Lane NR NO2 N N Y - 0m 16.0m N
106109
457675,
G10 107 Gosport Road R NO2 N N Y - 0m 14m Y
105616
457668,
G11 2 Earls Road R NO2 N N Y - 0m 5m Y
105461
30 Old Gosport 457732,
G1A R NO2 N N Y - 0m 10m Y
Road 105625
457627, Y – Gosport
G2A 138 Gosport Road NR NO2 N Y - 0m 9.5m Y
105138 Road
457726,
G3 202 Gosport Road R NO2 N N Y - 0m 9m Y
104869
457598, Y – Gosport
G4 122 Gosport Road R NO2 N Y - 0m 6m Y
105213 Road
457681,
G5 275 Gosport Road R NO2 N N Y - 0m 13m Y
104907
G6 171 Gosport Road R 457599, NO2 Y – Gosport N Y - 0m 6m Y
25Fareham Borough Council
Co-located
Distance
OS with a
Site Site Pollutants Relevant to kerb of Worst-case
Site Name Grid In AQMA? Continuous
Ref. Type Monitored Exposure? nearest Location?
Ref Analyser
road
?
105410 Road
457583, Y – Gosport
G7 193 Gosport Road R NO2 N Y - 0m 6.5m Y
105354 Road
457656,
G8Z 156 Gosport Road R NO2 N N Y - 0m 4m Y
105049
457745,
G9 11 Eden Rise R NO2 N N Y - 0m 13m Y
105730
Lamppost, 8 457870,
HR1 K NO2 N N Y – 3.5m 1.8m Y
Hartlands Road 106071
457822,
HR2 17 Hartlands Road R NO2 N N Y - 0m 11m Y
106107
457787,
HR3A 7 Hartlands Road R NO2 N N Y - 0m 7m Y
106140
457860,
HR4 25 Hartlands Road R NO2 N N Y - 0m 6.5m Y
106077
451584,
LH1 41 Bridge Road R NO2 N N Y - 5m 2m Y
108270
451720,
LH3 36 Botley Road R NO2 N N Y - 0m 5m Y
108361
P1B
459446,
(was 3 The Ridgeway R NO2 N N Y - 0m 20m Y
106106
P1A)
461134,
P2 141 The Crossways R NO2 N N Y - 10m 1m Y
105806
459054,
P4 22 Cams Hill R NO2 N N Y - 24m 2m Y
106162
26Fareham Borough Council
Co-located
Distance
OS with a
Site Site Pollutants Relevant to kerb of Worst-case
Site Name Grid In AQMA? Continuous
Ref. Type Monitored Exposure? nearest Location?
Ref Analyser
road
?
Silvermist, 461139,
P5 R NO2 N N Y - 20m 1.5m Y
Portchester 105532
461046,
P6 169 West Street R NO2 N N Y - 3.5m 1.5m Y
105594
P7A
77 West Street, 460272,
(was R NO2 N N Y - 5m 1.5m Y
Portchester 105831
P7)
PS1
457939, Y - Portland
PS1A 1 Sentinel Cottages R NO2 N Y - 0m 6.5m Y
106012 Street
PS1B
457937, Y - Portland
PS2 2 Sentinel Cottages R NO2 N Y - 0m 6.5m Y
106021 Street
457935, Y - Portland
PS3 38 Portland Street R NO2 N Y - 0m 3.5m Y
106033 Street
Albert Road / 457069,
S1 R NO2 N N Y - 12m 2m Y
Newgate Lane 102952
Stubbington Lane 455398,
S2 R NO2 N N Y - 14m 2m Y
(Erice Road) 102811
South St Dental 453996,
T1 R NO2 N N Y - 0m 1.5m Y
Health, Titchfield 105758
19 Mill Street, 454158,
T2 R NO2 N N Y - 2.2 m 1.6 m Y
Titchfield 106060
E1
Co-located with 457590, Y – Gosport
E2 R NO2 Y N - 3.5m 1.5m Y
Elms Road Monitor 105281 Road
E3
Two Saints, 101 457684, Y – Gosport
G12 R NO2 N Y-1m 1.1m Y
Gosport Road 105630 Road
Bottom of 457631,
G14 NR NO2 N N Y - 5m 6.9m Y
Beaconsfield Road 105494
27Fareham Borough Council
Co-located
Distance
OS with a
Site Site Pollutants Relevant to kerb of Worst-case
Site Name Grid In AQMA? Continuous
Ref. Type Monitored Exposure? nearest Location?
Ref Analyser
road
?
Maytree Drive
457182,
DC1 (lamppost) opposite R NO2 N N Y - 40 m 0.5m Y
106203
Delme Court
455745,
RM1 Runnymede R NO2 N N Y - 6m 49m N
107825
PS4
Portland Street 457954,
PS5 R NO2 Y Y Y – 18m 1.8m Y
Continuous Monitor 106027
PS6
Corner of Gosport
457564,
GR/RL Road & Redlands R NO2 Y N Y
105300
lane
457114,
11NL 11 Newgate Lane R NO2 N N Y – 0m 16m Y
102689
28Fareham Borough Council
2.2 Comparison of Monitoring Results with Air Quality
Objectives
2.2.1 Nitrogen Dioxide (NO2)
In order to assess the measured concentrations against the annual mean nitrogen
dioxide air quality objective, both the tubes and the data need to be subject to quality
assurance/quality control protocols. These allow for inherent uncertainty in the
measured concentrations to be minimised.
All details of the QA/QC procedures that have been applied to the diffusion tube
monitoring are given in Appendix A.
The purpose of reviewing the monitoring data is to identify any possible exceedences
of the relevant air quality objectives. In doing so, it is vital to consider not only the
measured concentrations in relation to the objectives, but also whether the locations
represent relevant exposure.
In cases where monitoring locations do not represent relevant exposure the façade
distance calculation method, as described in LAQM.TG(09), has been used. This has
been clearly stated in the report.
The two air quality objectives that ambient concentrations of NO2 need to be
assessed against are as follows:
An annual mean of 40 µg/m3; and
The number of exceedences of the 1 hour mean of 200 µg/m3 (18 allowable
exceedences in total).
It should be noted that it is only possible to directly assess against the 1 hour
objective if hourly monitoring data are available. As most local NO2 monitoring within
the Borough is conducted with diffusion tubes the approach suggested in
LAQM.TG(09) has been adopted. The approach, based on empirical studies,
suggests that where the annual mean is less than 60 µg/m 3, exceedences of the
short term objective are unlikely.
2.2.2 Automatic Monitoring Data
The Council has undertaken continuous monitoring of NO2 at the Elms Road site
since 2008. The site is located within the Gosport Road AQMA at the junction with
the A32 Gosport Road. As the site is 3.5 metres closer to the A32 than the nearest
receptor, measurements can be considered worst case.
The station was installed in June 2008, so the data for the 2008 monitoring data
(June to December 2008) were period adjusted, in accordance with LAQM TG.09,
using local AURN background sites at Bournemouth and Portsmouth to estimate the
annual mean NO2 concentration.
29Fareham Borough Council
The Portland Street automatic analyser has only been in operation since April 2012.
Good data capture was achieved at Elms Road in 2012 (91.3%). The annual mean
NO2 concentration for 2012 was 35.5 µg/m3, which is similar to the annual mean
concentrations recorded in 2008, 2009 and 2011 (Table 2.3 and Figure 2.3). The
higher NO2 annual mean result in 2010 should be treated with caution due to a lower
data capture as a result of incorrect filters being used.
Data capture from the new Portland Street site was very good for the period (94.6%)
but as the site was only running from April 2012 the data had to be annualised
(details found in appendix A). The annualised annual mean concentration is below
the objective at 34.9 µg/m3. Figure 2.3 provides an indication of the trend in annual
mean NO2 concentration since monitoring began in 2008.
There have been no monitored exceedences of the hourly NO2 standard of 200
µg/m3 since monitoring began at Elms Road in 2008. The new Portland Street site
recorded 2 exceedences of the standard during April to December 2012. The hourly
NO2 objective allows for 18 hours of NO2 greater than 200 µg/m3 per year, therefore
there have been no exceedences of the hourly NO2 objective since monitoring began
at Elms Road or Portland Street (Table 2.4).
30Fareham Borough Council
Table 2.3 Results of Automatic Monitoring for NO2: Comparison with Annual Mean Objective
Valid Data Annual Mean Concentration (µg/m3)
Valid Data
Within Capture for
Site ID Site Type Capture 2012
AQMA? Monitoring 2008* c 2009* c 2010* c 2011* c 2012 c
%b
Period % a
Elms
Road, R Y 91.3% 91.3% 33.7 35.9 41.8 33.2 35.5
Fareham
34.9
Portland
R Y 94.6% 71.0% N/A N/A N/A N/A (Annualised
Street
*0.82)
3
In bold, exceedence of the NO2 annual mean AQS objective of 40µg/m
a
i.e. data capture for the monitoring period, in cases where monitoring was only carried out for part of the year
b
i.e. data capture for the full calendar year (e.g. if monitoring was carried out for six months the maximum data capture for the full calendar year would be 50%)
c
Means should be “annualised” as in Box 3.2 of TG(09) (http://laqm.defra.gov.uk/technical-guidance/index.html?d=page=38), if valid data capture is less than
75%
* Annual mean concentrations for previous years are optional
31Fareham Borough Council
Figure 2.3Trends in Annual Mean NO2 Concentrations Measured at Automatic Monitoring Sites
45
40
Concentration (µg/m3)
35
Elms Road
Portland Street
30
Mean Objective
25
20
2008 2009 2010 2011 2012
32Fareham Borough Council
Table 2.4 Results of Automatic Monitoring for NO2: Comparison with 1-hour Mean Objective
Valid Data Number of Hourly Means > 200µg/m3
Valid Data
Site Within Capture for
Site ID Capture 2012
Type AQMA? Monitoring 2008* c 2009* c 2010* c 2011* c 2012 c
%b
Period % a
Elms Road,
R Y 91.3% 91.3% 0 0 0 0 0
Fareham
Portland
R Y 94.6% 71.0% N/A N/A N/A N/A 2
Street
3
In bold, exceedence of the NO2 hourly mean AQS objective (200µg/m – not to be exceeded more than 18 times per year)
a
i.e. data capture for the monitoring period, in cases where monitoring was only carried out for part of the year
b
i.e. data capture for the full calendar year (e.g. if monitoring was carried out for six months the maximum data capture for the full calendar year would be 50%)
c th
If the data capture for full calendar year is less than 90%, include the 99.8 percentile of hourly means in brackets
* Number of exceedences for previous years is optional
33Fareham Borough Council
2.2.3 Diffusion Tube Monitoring Data
The Council has been monitoring NO2 using passive diffusion tubes for a number of
years. Diffusion tube sites that did not meet the 75% (9 months) data capture
criterion in 2012 sites have been annualised to estimate the annual mean for 2012.
The details of annualisation are given in Appendix A. Results at these sites are
subject to greater uncertainty. The 2012 results for all sites including data capture
percentages are given in Table 2.5. The full dataset (raw monthly values) are
included in Appendix B.
The results in Table 2.5 show that there were only two marginal exceedances of the
annual mean NO2 objective in 2012 at G7 (193 Gosport Road) and PS3 (38 Portland
Street). Site G7 and PS3 both are within the AQMA and have a history of
exceedences of the annual mean objective.
Table 2.6 below shows annual results for existing tubes since 2008 and Figure 2.4
below shows annual results since 2007 for all the long term sites. They show a
downward trend in NO2 concentrations over the years, with 2011 showing no
exceedences of the annual mean. The fact that most sites show a similar pattern,
suggest these increases may be as a result of meteorological effects over a wider
regional area.
34Fareham Borough Council
Table 2.5 Results of NO2 Diffusion Tubes 2012
2012 Annual
Mean
Triplicate or Full Calendar Concentration
Site Within Annualised Distance 3
Site ID Location Co-located Year Data (µg/m ) –
Type AQMA? Y/N Corrected a
Tube Capture 2012 Local Bias
Adjustment
b
factor = 0.98
10N Farrier Way B N N N N 83.3% 24.20
10NA 3 Farrier Way R N N N N 91.7% 21.36
2N 2 Osborne Road South R N N Y N 41.7% 33.28
3N 14 Osborne Road R N N N N 91.7% 24.68
5N Grove Road R N N N N 83.3% 26.76
7N Norton Road B N N N N 91.7% 18.45
Av/Bf Avenue / Bishopfields Road R N N N N 91.7% 26.49
BL1 11 Bath Lane NR N N N N 91.7% 35.88
G10 107 Gosport Road R N N N N 91.7% 37.48
G11 2 Earls Road R N N N N 91.7% 29.23
G1A 30 Old Gosport Road R N N N N 91.7% 32.14
Y – Gosport
G2A 138 Gosport Road NR N N N 91.7% 29.90
Road
G3 202 Gosport Road R N N N N 83.3% 30.20
Y – Gosport
G4 122 Gosport Road R N N N 83.3% 28.81
Road
G5A 275 Gosport Road R N N N N 91.7% 26.17
35Fareham Borough Council
2012 Annual
Mean
Triplicate or Full Calendar Concentration
Site Within Annualised Distance 3
Site ID Location Co-located Year Data (µg/m ) –
Type AQMA? Y/N Corrected a
Tube Capture 2012 Local Bias
Adjustment
b
factor = 0.98
Y – Gosport
G6 171 Gosport Road R N N N 83.3% 34.18
Road
Y – Gosport
G7 193 Gosport Road R N N N 91.7% 40.57
Road
G8Z 156 Gosport Road R N N N N 91.7% 32.24
G9 11 Eden Rise R N N N N 91.7% 26.28
HR1 Lamppost, 8 Hartlands Road K N N N Y 75.0% 38.50
HR2 17 Hartlands Road R N N N N 91.7% 32.06
HR3A 7 Hartlands Road R N N N N 91.7% 27.28
HR4 25 Hartlands Road R N N N N 91.7% 28.52
LH1 41 Bridge Road R N N N N 91.7% 27.10
LH3 36 Botley Road R N N N N 91.7% 30.11
P1B (was P1A) 3 The Ridgeway R N N N N 91.7% 23.07
P2 141 The Crossways R N N N N 91.7% 21.72
P4 22 Cams Hill R N N N N 91.7% 29.14
36Fareham Borough Council
2012 Annual
Mean
Triplicate or Full Calendar Concentration
Site Within Annualised Distance 3
Site ID Location Co-located Year Data (µg/m ) –
Type AQMA? Y/N Corrected a
Tube Capture 2012 Local Bias
Adjustment
b
factor = 0.98
P5 Silvermist, Portchester R N N N N 91.7% 29.26
P6 169 West Street R N N N N 91.7% 25.70
P7A (was P7) 77 West Street, Portchester R N N N N 91.7% 20.11
PS1 N N 91.7% 35.58
Y - Portland
PS1A 1 Sentinel Cottages R N N N 91.7% 34.49
Street
PS1B N N 91.7% 35.08
Y - Portland
PS2 2 Sentinel Cottages R N N N 91.7% 35.84
Street
Y - Portland
PS3 38 Portland Street R N N N 91.7% 40.43
Street
Stubbington Lane (Erice
S2 R N N N N 91.7% 23.24
Road)
South St Dental Health,
T1 R N N N N 91.7% 23.97
Titchfield
E1 N N 83.3% 37.07
Co-located with Elms Road Y – Gosport
E2 R Y N N 75.0% 35.37
Monitor Road
E3 N N 83.3% 37.65
Two Saints, 101 Gosport Y – Gosport
G12 R N N N 91.7% 37.00
Road Road
G14 Bottom of Beaconsfield Road NR N N N N 91.7% 33.29
37Fareham Borough Council
2012 Annual
Mean
Triplicate or Full Calendar Concentration
Site Within Annualised Distance 3
Site ID Location Co-located Year Data (µg/m ) –
Type AQMA? Y/N Corrected a
Tube Capture 2012 Local Bias
Adjustment
b
factor = 0.98
Maytree Drive (lamppost)
DC1 R N N N N 91.7% 28.25
opposite Delme Court
RM1 Runnymede R N N N N 91.7% 28.97
PS4 Y N 58.3% 32.40
Portland Street Continuous
PS5 R Y Y Y N 58.3% 32.70
Monitor
PS6 Y N 58.3% 32.70
Corner of Gosport Road &
GR/RL R Y N Y N 33.3% 26.55
Redlands lane
11NL 11 Newgate Lane R N N Y N 91.7% 22.94
3
In bold, exceedence of the NO2 annual mean AQS objective of 40µg/m
3
Underlined, annual mean > 60µg/m , indicating a potential exceedence of the NO2 hourly mean AQS objective
a
Means should be “annualised” as in Box 3.2 of TG(09)( http://laqm.defra.gov.uk/technical-guidance/index.html?d=page=38), if full calendar year data capture is
less than 75%
b
If an exceedence is measured at a monitoring site not representative of public exposure, NO 2 concentration at the nearest relevant exposure should be
estimated based on the “NO2 fall-off with distance” calculator (http://laqm.defra.gov.uk/tools-monitoring-data/no2-falloff.html), and results should be discussed in
a specific section. The procedure is also explained in Box 2.3 of Technical Guidance LAQM.TG(09) (http://laqm.defra.gov.uk/technical-
guidance/index.html?d=page=30).
38Fareham Borough Council
Table 2.6 Results of NO2 Diffusion Tubes (2008 to 2012)
Annual Mean Concentration (µg/m3) - Adjusted for Bias a
Within 2008 (Bias 2009 (Bias 2010 (Bias 2011 (Bias 2012 (Bias
Site ID Site Type Adjustment Adjustment Adjustment Adjustment Adjustment
AQMA? Factor = Factor = Factor = Factor = Factor =
1.05) 0.84) 1.01) 0.85) 0.98)
10N Farrier Way N 25.8 22.2 24.3 21.2 24.20
3 Farrier
10NA N 25.9 21.5 24.5 18.7 21.36
Way
2 Osborne
2N N 32.2 26.6 38.9 29.9 33.28
Road South
14 Osborne
3N N 28.6 23.5 26.6 21.1 24.68
Road
5N Grove Road N 32 25 27.6 22.8 26.76
7N Norton Road N 21.6 17.7 20.8 16.5 18.45
Avenue /
Av/Bf Bishopfields N 21.8 21.8 29.9 21.8 26.49
Road
11 Bath
BL1 N N/A N/A N/A 30.7 35.88
Lane
107 Gosport
G10 N 47.6 35.5 40.8 32.0 37.48
Road
2 Earls
G11 N 34 25.9 28.7 24.3 29.23
Road
30 Old
G1A Gosport N 39.2 30.7 34.7 28.5 32.14
Road
Y–
138 Gosport
G2A Gosport 49.4 40.6 41.5 27.3 29.90
Road
Road
202 Gosport
G3 N 33.9 26.4 30.7 25.4 30.20
Road
Y–
122 Gosport
G4 Gosport 34.8 26.4 30.5 24.8 28.81
Road
Road
275 Gosport e e e
G5A N 31.7 25.4 33.5 23.5 26.17
Road
Y–
171 Gosport
G6 Gosport 36.3 28.3 32.9 29.1 34.18
Road
Road
Y–
193 Gosport
G7 Gosport 39.8 33.2 39.6 33.6 40.57
Road
Road
156 Gosport
G8Z N 37 25.7 31.0 26.9 32.24
Road
11 Eden
G9 N 33.3 25.1 28.5 24.7 26.28
Rise
Lamppost, 8
HR1 Hartlands N 48.7 38.2 41.8 35.9 38.50
Road
39Fareham Borough Council
Annual Mean Concentration (µg/m3) - Adjusted for Bias a
Within 2008 (Bias 2009 (Bias 2010 (Bias 2011 (Bias 2012 (Bias
Site ID Site Type Adjustment Adjustment Adjustment Adjustment Adjustment
AQMA? Factor = Factor = Factor = Factor = Factor =
1.05) 0.84) 1.01) 0.85) 0.98)
17 Hartlands
HR2 N 37.2 28.2 32.5 27.6 32.06
Road
7 Hartlands
HR3A N 32.5 25.2 34.8 23.2 27.28
Road
25 Hartlands
HR4 N 38.6 26.4 30.7 26.0 28.52
Road
41 Bridge
LH1 N 29.5 23.8 27.3 22.8 27.10
Road
36 Botley
LH3 N 39 31.3 31.4 25.9 30.11
Road
P1B
3 The
(was N 25.6 20.8 24.0 20.2 23.07
Ridgeway
P1A)
141 The
P2 N 24.3 21.2 23.7 20.3 21.72
Crossways
P4 22 Cams Hill N 31.8 26 28.9 25.5 29.14
Silvermist,
P5 N 31.1 21.2 23.7 24.6 29.26
Portchester
169 West
P6 N 30.2 26 28.9 21.0 25.70
Street
77 West
P7A
Street, N 35.1 27.7 22.5 17.0 20.11
(was P7)
Portchester
PS1
Y-
1 Sentinel
PS1A Portland 46.8 36.0 42.0 34.8 35.05
Cottages
Street
PS1B
Y-
2 Sentinel
PS2 Portland 48.3 38.7 43.3 35.8 35.84
Cottages
Street
Y-
38 Portland
PS3 Portland 55.9 42.0 47.9 35.0 40.43
Street
Street
Stubbington
S2 Lane (Erice N 28.9 22.3 27.3 19.8 23.24
Road)
South St
Dental
T1 N 29.8 20.6 28.1 21.8 23.97
Health,
Titchfield
E1
Co-located
Y–
with Elms
E2 Gosport 44.4 36.5 41.8 33.0
Road 36.70
Road
Monitor
E3
40Fareham Borough Council
Annual Mean Concentration (µg/m3) - Adjusted for Bias a
Within 2008 (Bias 2009 (Bias 2010 (Bias 2011 (Bias 2012 (Bias
Site ID Site Type Adjustment Adjustment Adjustment Adjustment Adjustment
AQMA? Factor = Factor = Factor = Factor = Factor =
1.05) 0.84) 1.01) 0.85) 0.98)
Two Saints, Y–
G12 101 Gosport Gosport N/A N/A N/A 31.2 37.00
Road Road
Bottom of
G14 Beaconsfield N N/A N/A N/A 29.2 33.29
Road
Maytree
Drive
DC1 (lamppost) N N/A 25.3 29.1 24.2 28.25
opposite
Delme Court
RM1 Runnymede N N/A N/A N/A 21.7 28.97
PS4
Portland
Street
PS5 Y N/A N/A N/A N/A 32.60
Continuous
Monitor
PS6
Corner of
Gosport
GR/RL Road & Y N/A N/A N/A N/A 26.55
Redlands
lane
11 Newgate
11NL N N/A N/A N/A N/A 22.94
Lane
E1
Co-located
Y–
with Elms
E2 Gosport 44.4 36.5 41.8 33.0
Road 36.70
Road
Monitor
E3
Two Saints, Y–
G12 101 Gosport Gosport N/A N/A N/A 31.2 37.00
Road Road
Bottom of
G14 Beaconsfield N N/A N/A N/A 29.2 33.29
Road
Maytree
Drive
DC1 (lamppost) N N/A 25.3 29.1 24.2 28.25
opposite
Delme Court
RM1 Runnymede N N/A N/A N/A 21.7 28.97
PS4
Portland
Street
PS5 Y N/A N/A N/A N/A 32.60
Continuous
Monitor
PS6
41Fareham Borough Council
Annual Mean Concentration (µg/m3) - Adjusted for Bias a
Within 2008 (Bias 2009 (Bias 2010 (Bias 2011 (Bias 2012 (Bias
Site ID Site Type Adjustment Adjustment Adjustment Adjustment Adjustment
AQMA? Factor = Factor = Factor = Factor = Factor =
1.05) 0.84) 1.01) 0.85) 0.98)
Corner of
Gosport
GR/RL Road & Y N/A N/A N/A N/A 26.55
Redlands
lane
11 Newgate
11NL N N/A N/A N/A N/A 22.94
Lane
3
In bold, exceedence of the NO2 annual mean AQS objective of 40µg/m
3
Underlined, annual mean > 60µg/m , indicating a potential exceedence of the NO2 hourly mean AQS
objective
a
Means should be “annualised” as in Box 3.2 of TG(09) (http://laqm.defra.gov.uk/technical-
guidance/index.html?d=page=38), if full calendar year data capture is less than 75%
42Fareham Borough Council
Figure 2.4Trends in Annual Mean Nitrogen Dioxide Concentrations Measured at Diffusion Tube Monitoring Sites
43Fareham Borough Council
2.2.4 Other Pollutants Monitored
Fareham Borough Council does not currently monitor for any other pollutant other
than NO2.
2.2.5 Summary of Compliance with AQS objectives
Fareham Borough Council monitors for the pollutant NO2 by way of two continuous
analysers and 49 diffusion tubes.
Assessment of the 2012 dataset showed there to be two monitoring sites (sites G7
and PS3) measuring annual means NO2 concentrations above the objective for 2012.
Both these sites are within the existing AQAMs declared by the Council so a further
detailed assessment is not required in either case.
Fareham Borough Council has examined the results for monitoring within the Borough and the
identified exceedences of the NO2 air quality objective are within existing AQMA so detailed
assessments are not required.
44Fareham Borough Council
3 New Local Developments
The Council has reviewed the key changes in the Local Authority area that have the
potential to impact significantly on local air quality. In line with the criteria set out
below, only those changes deemed to have been significant have detailed. The
assessment of any significantly changed sources have been considered in terms of
whether the Council needs to move to a Detailed Assessment.
3.1 Road Traffic Sources
The report has assessed any changes to the following since the last updating and
screening assessment:-
Narrow congested streets with residential properties close to the kerb;
Busy streets where people may spend one hour or more close to traffic;
Roads with a high flow of buses and/or HGVs;
Junctions;
New roads constructed or proposed since the last updating and screening
assessment;
Roads with significantly changed traffic flows;
Bus or coach stations.
With consideration to the above, no significant changes have been identified which
require assessment. However, a number of local/regional schemes have been
identified which are anticipated to have beneficial impacts on local congestion and
emissions over the next 2-3 years. These are:-
The Quay Street roundabout was redeveloped to a "throughabout" in
November 2011. It is a new type of traffic light junction for Hampshire with
traffic lights placed on the roundabout as well as on a number of approaches
to it. The new layout takes traffic heading from Gosport to the M27 straight
through the middle of the roundabout away from the houses on Portland
Street. It is hoped that the resulting "throughabout" in close proximity to the
Portland Street AQMA will assist in reducing nitrogen dioxide levels and lead
to a revocation of the latter. The "throughabout " may also be helping to
reduce congestion on the A32 too.
The Eclipse Busway is a 4 km long dedicated busway and cycle route on the
8km stretch between Gosport and Fareham, using a former railway corridor.
It opened in April 2012. The busway allows high specification low emission
buses to avoid congested parts of the busy A32 and reduce the percentage
of bus traffic on these roads. At present, First have 14 Euro V buses using
the route; by the end of 2013, the number of Euro V buses is expected to
rise to 19. Relevant exposure is not within 10m of this high flow of buses.
The annual bus patronage on all the Fareham & Gosport corridors has
increased by 10% since the opening of the busway. The busway has also
become very popular with cyclists. A survey on a Friday in September 2012
recorded 790 cyclists between 0700 - 1900 hours including 150 children.
45Fareham Borough Council
Two new dedicated bus lanes opened in Fareham in April 2012 as part of
Hampshire County Council's Fareham Town Access Plan. It is hoped that
the new bus infrastructure and the new busway will improve journey times
and make bus travel a more attractive alternative to the car thereby helping
to reduce congestion and reduce pollution on local roads. The bus lanes are
operational 7 days a week 24 hours a day on an 18 month trial basis. A
report on their impact is due shortly.
A planning application for the opening of the Yew Tree Drive bus gate at
Whiteley to cars may be submitted by Hampshire County Council this year.
The provision of the bus gate to increase the use of buses between Fareham
and Whiteley was an original AQAP target. Advice has been given to
Hampshire County Council in respect of possible air quality and noise impact
assessments.
3.2 Other Transport Sources
No other significant local transport sources have been identified since the previous
LAQM assessment.
3.3 Industrial Sources
The report has assessed any changes to the following since the last Updating and
Screening Assessment in 2012:-
New or proposed installations for which an air quality assessment has been
carried out;
Existing installations where emissions have increased substantially or new
relevant exposure has been introduced;
New or significantly changed installations with no previous air quality
assessment;
Major fuel storage depots storing petrol;
Petrol stations and
Poultry farms.
Changes to industrial processes governed under the Local Authority Environmental
Permitting regime are:-
BP Rolls (vehicle refinishers) permit revoked January 2013;
New concrete crusher permit for Mayfair Developments granted December
2012 and
New abatement equipment installed at Portchester Crematorium in
September 2012 has significantly reduced emission of pollutants.
.
46Fareham Borough Council
3.4 Commercial and Domestic Sources
The expansion of the Warren Farm waste transfer station in 2012 to take bulky and
fly tipped waste in addition to compost storage has not resulted in any significant
emissions. The opening of the Fareham Tesco store in December 2011 on Quay
Street roundabout is associated with the comments above in 3.1 in respect of the
"throughabout".
3.5 New Developments with Fugitive or Uncontrolled
Sources
Fareham Borough Council previously identified the following local developments
which may impact on air quality in the local authority area in the future:-
Industrial, commercial and residential development at Daedalus airfield;
Change of use of previous green waste composter site at Down End
quarry which was closed in December 2012 and
The residential, commercial and industrial development north of Fareham
in 2016 to be known as Welborne.
These will be taken into consideration in the next progress report scheduled for
2014.
Fareham Borough Council confirms that there are no new or newly identified local
developments which may have an impact on air quality within the Local Authority
area.
Fareham Borough Council confirms that all the following have been considered:
Road traffic sources
Other transport sources
Industrial sources
Commercial and domestic sources
New developments with fugitive or uncontrolled sources.
47Fareham Borough Council
4 Local/Regional Air Quality Strategy
4.1 Air Quality Action Plan - Implementation Group
The AQAP was approved by the Farnham Borough Council Executive on 8
December 2008 with the recommendation that a member led implementation group
be developed to pursue the improvement actions.
The group is chaired by Councillor T Cartwright, Deputy Executive Leader and
Executive Portfolio holder for Public Protection. Councillor Mrs K Mandry, Chairman
of PPPDRP (Public Protection Policy Development and Review Panel) and
Councillor P J Davies are also members of the group as is Councillor K D Evans,
Executive Member for Strategic Planning and Environment. The group has met
regularly since 2008 and continues to receive updates in respect of the actions from
the following sub groups:-
Public Transport - led by Alison Hull, Hampshire County Council, Principal
Transport Officer, Passenger Transport Infrastructure & Information.
Road Network Infrastructure - led by Steve Faulkner, Hampshire County
Council, Transport Planner, Strategic Transport Team.
Sustainability - led by Mark Chevis, Fareham Borough Council, FBC
Sustainability Officer (20 hours a month).
Promotion/Publicity - led by Heather Cusack, Fareham Borough Council,
Principal Environmental Health Officer (EHO).
Monitoring - led by Heather Cusack, Fareham Borough Council, Principal
EHO.
The Council has applied for air quality grants for the AQAP and so far £4,400 has
been used to assist in the purchase of two fuel saving devices for the refuse vehicles
and £1,300 of a further grant of £12,600 received in 2010, was used for the
administration of the Big Green Commuter Challenge (BGCC) in 2011 and 2012. The
grant was also used to produce a health and air quality leaflet compiled by the
Implementation Group and NHS Hampshire. This leaflet is on our website and has
been distributed to local GP surgeries, libraries etc. The provision of green travel
awareness banners on the A32 will take place once the lamp columns have been
replaced by the PFI contractor in 2013.
48Fareham Borough Council
5 Planning Applications
The following are forthcoming major project planning developments which have the
potential to affect local air quality:-
5.1 The Daedalus Redevelopment
A planning application has been submitted to Fareham Borough Council for a
development at the Daedalus airfield which comprises of:
An employment led scheme to provide up to 21,912sqm of employment floor
space in new buildings and re-use of existing buildings in Hangars West (use
classes B2 and B8);
Up to 25,990 m2 of employment floor space to be provided in new buildings
and re-use of existing buildings at Hangars East (use classes B2 and B8);
Up to 2,300 m2 of B1 floor space at Hangars East;
Clubhouse of 1,710 m2 in the Martsu building (class D2);
New and upgraded vehicular access and pedestrian access arrangements;
Hard standing for open storage and parking areas;
Allotments and open space provision at Hangars West;
Landscaping and associated works.
The Council considered that a development of this size had the potential to
significantly impact on local air quality, especially through increased local/regional
road traffic. Therefore the Council requested that an air quality assessment be
undertaken to quantify any such impacts. The resulting Environmental Statement
indicated that the residual impacts of the development on air quality are predicted to
be adverse but of neutral -minor significance in the long term. The increase in traffic
levels and congestion are to be minimised through sustainable transport
arrangements. A site travel plan is to be implemented for the site. Planning
permission has yet to be granted.
5.2 Yew Tree Drive bus gate
Earlier this year, Hampshire County Council undertook public consultation on
whether opening Yew Tree Drive in Whiteley to all traffic would be the best approach
to managing traffic growth in Whiteley and the surrounding area.
Fareham Borough Council as the planning authority and Hampshire County Council
as the highway authority will use the results of the public consultation to help decide
whether to go ahead with any changes to Yew Tree Drive in the near future.
Residents in the immediate area were sent a consultation questionnaire; over 2000
responses were received.
For a number of years consideration has been given to the opening of the bus gate at
Yew Tree Drive to all traffic. The County Council and Borough Council are now
considering a formal six month trial opening to all traffic and to gauge the current
views of residents on this.
Hampshire County Council previously sought your opinion on the opening of Yew
Tree Drive in April 2010.Since then the County Council has considered the effects of
49Fareham Borough Council
opening Yew Tree Drive for a three week period in July 2012 to allow for service
works. Automatic traffic counters were located on neighbouring roads and they
collected traffic flow data before the opening of the bus gate (in May) and during the
opening (in July).
The average daily number of vehicles using the Yew Tree Drive link by the end of the
trial period was approximately 3300. The impact of the bus gate being opened was
shown to have varying impacts on the level of traffic on the surrounding road
network.
The main changes to daily 12 hour two way flows between May and July 2012 were:
Yew Tree Drive Bus Gate had an increase of 3300 vehicles
Botley Road north had an increase of 1600 vehicles +18%
Botley Road south: had an increase of 1700 vehicles, +20%
Swanwick Lane had an increase of 300 vehicles +7%
Yew Tree Drive east: had an increase of 400 vehicles +5%
Leafy Lane had no change in traffic flow
Whiteley Way had a reduction of 2500 vehicles -11%
It is important to note that the opening of the bus gate in July 2012 was not a formal
trial and therefore it was not publicised. Also, July is not an ideal month to survey
because the roads tend to be quieter and this is reflected in the data collected, which
show lower levels of traffic making it harder to detect changes in flows. The survey
information therefore gives an indication of what the effects of opening Yew Tree
Drive to all traffic could be, but should not be seen as a comprehensive assessment
of impacts.
5.3 Change of use of composter site
The 10 year commercial composting activities on the old Down End Road quarry site
more or less ceased at the end of 2012 but a variation of condition 2 of planning
permission P/10/1152/MW allowed a further period of time to operate the site for
wood waste storage, sorting and transfer, highways salt store and bin storage. No
further applications have been made in respect of the site to date.
50Fareham Borough Council
6 Air Quality Planning Policies
6.1 Fareham Borough local Plan (Saved Policies)
On commencement of the Planning and Compulsory Purchase Act 2004, the Local
Plan Review was incorporated within the Local Development Framework (LDF) with
policies saved for three years. As of the 27th September 2007 expiry date, the
Council sort the Secretary of State‟s approval to save several key of policies until the
approval of the Development Plan Documents. Of the saved policies, the following
covers the potential for development to impact on local air quality.
Policy DG1: Environmental Impact
Development will be permitted provided that:
(A) It does not detract from the use and enjoyment of adjacent land or have an
adverse impact on the wider environment by reason of noise, dust, fumes,
heat, smoke, liquids, vibration or light.
6.2 Local Development Framework
The Local Development Framework (LDF) is a suite of documents which must be
taken into account when forming local policy. These documents include an adopted
Core Strategy, the draft Development Sites & Policies Plan and the draft Welborne
Plan. The Local Development framework must reflect the requirements of the
Regional Spatial Strategy for the South East, known as the South East Plan,
including a South Hampshire Sub-Regional Strategy.
6.3 Core Strategy - Local Plan Part 1
The Core Strategy is a Development Plan Document (DPD) that sets out the key
elements of the planning framework for the Borough. It includes policies for areas
and issues requiring development or protection. Proposals for strategic sites will
provide the principles to be worked up in more detail through specific plans for the
New Community North of Fareham to be known as Welborne, Fareham Town Centre
and the Coldeast and Daedalus sites.
The Core Strategy was approved by the Planning Inspector in July 2011 and adopted
by the full Council on 4 August 2011. The Core Strategy now forms part of the
Development Plan and replaces, in whole or part, a number of policies in the
Fareham Borough Local Plan Review (June 2000). Construction at Welborne should
commence in 2016.
The key objectives and policies within the Core Strategy pertinent to air quality are
set out below:-
51You can also read