Estimation of changes in air pollution emissions, concentrations and exposure during the COVID-19 outbreak in the UK - UK Air
←
→
Page content transcription
If your browser does not render page correctly, please read the page content below
AIR QUALITY EXPERT GROUP

Estimation of changes in air
pollution emissions, concentrations
and exposure during the COVID-19
outbreak in the UK.

Rapid evidence review – June 2020.

Prepared for:
      Department for Environment, Food and Rural Affairs;
      Scottish Government; Welsh Government;
      and Department of Agriculture, Environment and Rural Affairs in Northern Ireland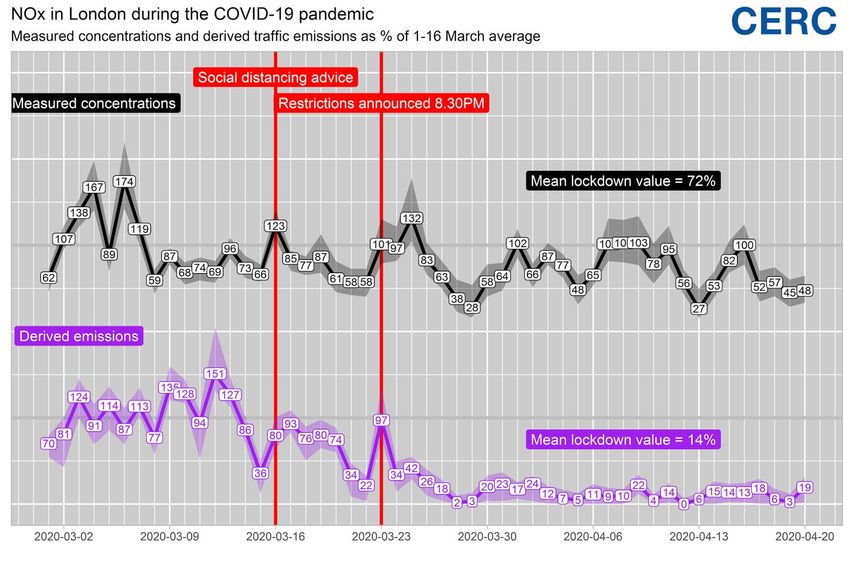
This is a report from the Air Quality Expert Group to the Department for Environment, Food and
Rural Affairs; Scottish Government; Welsh Government; and Department of Agriculture,
Environment and Rural Affairs in Northern Ireland, on the estimation of changes in air pollution
emissions, concentrations and exposure during the COVID-19 outbreak in the UK. The information
contained within this report represents a review of the understanding and evidence available at the
time of writing, and is based on information received via a public call for evidence.
© Crown copyright 2020
United Kingdom air quality information received from the automatic monitoring sites and forecasts
may be accessed via the following media:
Freephone Air Pollution Information Service    0800556677
Internet    http://uk-air.defra.gov.uk
PB 14624

                                                                                                    2
3
Terms of Reference
The Air Quality Expert Group (AQEG) is an expert committee of the Department for
Environment, Food and Rural Affairs (Defra) and considers current knowledge on air
pollution and provides advice on such things as the levels, sources and characteristics of air
pollutants in the UK. AQEG reports to Defra’s Chief Scientific Adviser, Defra Ministers,
Scottish Ministers, the Welsh Government and the Department of Agriculture, Environment
and Rural Affairs in Northern Ireland (the Government and devolved administrations).
Members of the Group are drawn from those with a proven track record in the fields of air
pollution research and practice.
AQEG’s functions are to:
   •   Provide advice to, and work collaboratively with, officials and key office holders in
       Defra and the devolved administrations, other delivery partners and public bodies,
       and EU and international technical expert groups;
   •   Report to Defra’s Chief Scientific Adviser (CSA): Chairs of expert committees will
       meet annually with the CSA, and will provide an annual summary of the work of the
       Committee to the Science Advisory Council (SAC) for Defra’s Annual Report. In
       exception, matters can be escalated to Ministers;
   •   Support the CSA as appropriate during emergencies;
   •   Contribute to developing the air quality evidence base by analysing, interpreting and
       synthesising evidence;
   •   Provide judgements on the quality and relevance of the evidence base;
   •   Suggest priority areas for future work, and advise on Defra’s implementation of the
       air quality evidence plan (or equivalent);
   •   Give advice on current and future levels, trends, sources and characteristics of air
       pollutants in the UK;
   •   Provide independent advice and operate in line with the Government’s Principles for
       Scientific Advice and the Code of Practice for Scientific Advisory Committees
       (CoPSAC).
Expert Committee Members are independent appointments made through open competition,
in line with the Office of the Commissioner for Public Appointments (OCPA) guidelines on
best practice for making public appointments. Members are expected to act in accord with
the principles of public life.

Further information on AQEG can be found on the Group’s website at:
https://www.gov.uk/government/policy-advisory-groups/air-quality-expert-group

                                                                                               4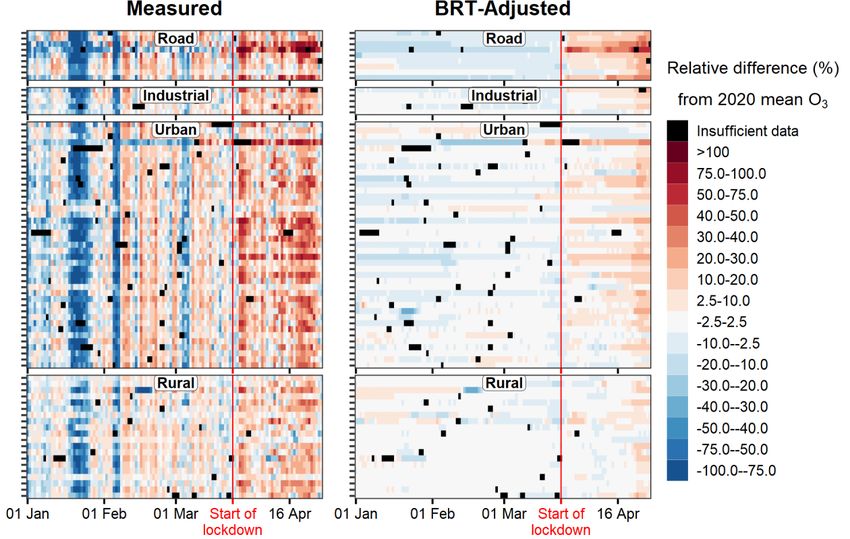
Membership
Chair
Professor Alastair Lewis
National Centre for Atmospheric Science, University of York

Members
Dr James Allan
National Centre for Atmospheric Science, University of Manchester
Dr David Carruthers
Cambridge Environmental Research Consultants
Dr David Carslaw
Ricardo Energy and Environment and University of York
Dr Gary Fuller
King's College London
Professor Roy Harrison OBE
University of Birmingham
Professor Mat Heal
University of Edinburgh
Dr Eiko Nemitz
UK Centre for Ecology & Hydrology
Professor Claire Reeves
University of East Anglia
Professor Martin Williams
King's College London

Ad hoc members
Professor David Fowler CBE
Formerly the Centre for Ecology and Hydrology
Dr Ben Marner
Air Quality Consultants
Dr Andrew Williams
University of Chester
Professor Nicola Carslaw
University of York

                                                                    5
Ex officio members
Dr Sarah Moller
National Centre for Atmospheric Science, University of York and Senior Research
Fellow, Department for Environment, Food and Rural Affairs Systems Research
Programme
Central Management and Control Unit of the automatic urban and rural networks: Dr
Richard Maggs, Bureau Veritas
National Atmospheric Emissions Inventory: Dr Tim Murrells, Ricardo Energy and
Environment
Non-automatic hydrocarbon monitoring networks and metals monitoring network: Dr
Paul Quincey, National Physical Laboratory
Quality Assurance and Quality Control of the automatic urban network and the non-
automatic monitoring networks: Dr Paul Willis, Ricardo Energy and Environment

Assessors and observers
Roger Herbert
Welsh Government
Barry McCauley
Department of Agriculture, Environment and Rural Affairs in Northern Ireland
Andrew Taylor
Scottish Government
Alison Gowers
Public Health England

Secretariat
Shaun Brace
Department for Environment, Food and Rural Affairs
Dr Mohamed Ghalaieny
Department for Environment, Food and Rural Affairs
Michelle Brailey-Balster
Department for Environment, Food and Rural Affairs

                                                                                    6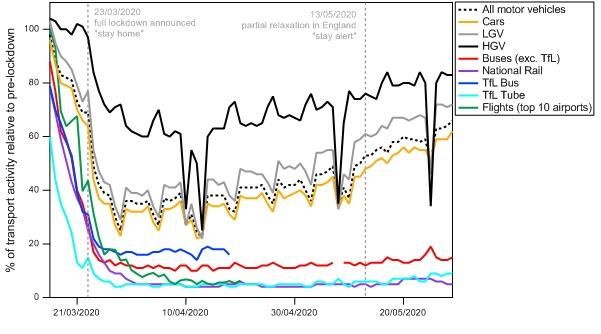
Introduction and Scope of the report
The Air Quality Expert Group (AQEG) in conjunction with Defra issued a call for
evidence on 7th April 2020, identifying seven areas of current scientific uncertainty
related to the potential interactions between COVID-19 and UK air pollution.

See: https://uk-air.defra.gov.uk/news?view=259

The initial aim of the evidence review was to support a rapid expert assessment of
available data sources and analyses that had been recently completed by the
academic community and the air quality consulting and management sector. The call
was structured around seven questions posed by Defra:
   1. What sectors or areas of socioeconomic activity do you anticipate will show a
      decrease in air pollution emissions, and by how much? Are there any
      emissions sources or sectors which might be anticipated to lead to an
      increase in emissions in the next three months?
   2. Can you provide estimates for how emissions and ambient concentrations of
      NOx, NO2, PM, O3, VOC, NH3 etc. may have changed since the COVID-19
      outbreak? Where possible please provide data sets to support your response.
   3. What changes do you anticipate in indoor air quality as a result of the COVID-
      19 pandemic?
   4. How might public exposure to air pollution have changed as a consequence of
      recent restrictions on movement?
   5. How might altered emissions of air pollutants over the next three months
      affect UK summertime air quality?
   6. Based on what is already known about air pollutants as respiratory irritants or
      inflammatory agents, can any insights be gained into the impact of air quality
      on viral infection?
   7. Are there any insights that can be gained from aerosol science on possible
      viral transmission mechanisms?
By close of the call on 30th April over 50 responses had been received from a range
of organisations including research groups at universities and institutes, commercial
organisations, industry bodies and Local Authorities. Annex 1 shows the contributing
organisations. This has provided a body of information that is particularly useful for
assessing emerging issues associated with changes in emissions, concentrations
and exposure to air pollution since the UK lockdown was imposed during the COVID-
19 pandemic.
This report has been prepared by AQEG with input from a number of ad hoc
members and the Defra secretariat. Question 6 was passed to the secretariat and
members of the Committee on the Medical Effects of Air Pollutants (COMEAP) and
their response is included in this report along with details of the contributors.

                                                                                        7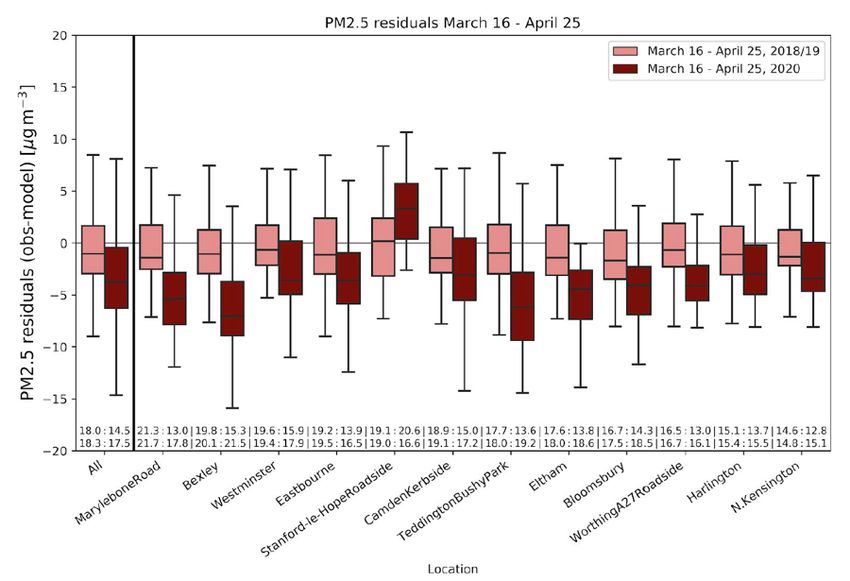
It is important to stress that this report predominantly evaluates air pollution data
available up to 30th April 2020. It does not draw conclusions on air quality or
emissions changes that may have arisen in the UK as a result of the government
easing of lockdown restrictions in May 2020.
Unusually for AQEG reports, this analysis is based predominantly on scientific and
technical material that is not yet peer-reviewed, and indeed it often draws on
observational data that has yet to receive final quality assurance ratification from the
data providers. An expert judgement has therefore been made with regard to the
weight given to different evidence sources and the associated uncertainties when
drawing conclusions. In this rapidly evolving situation, it would be anticipated that a
large body of peer-reviewed scientific literature will become available later in 2020,
and beyond.
Initial conclusions
There have been significant changes in the emissions of air pollutants from
several sectors, but, with the exception of the transport sector which showed a
marked decrease, availability of activity and emissions data for the lockdown
period is still limited.
UK air quality has been negatively influenced by a significant change in
meteorology between the weeks preceding and following the lockdown in
addition to changes (both positive and negative) arising from actions in response
to COVID-19.
The most pronounced changes in UK air quality during lockdown have been in
the urban environment, notably for nitrogen oxides (NOx). Once weather effects
are accounted for, mean reductions in urban NOx averaged over the lockdown
period considered have been typically 30-40%, with mean NO2 reductions of 20-
30%. In general, NOx and NO2 reductions have been greater at roadside than at
urban background sites. These reductions would typically correspond to
decreases in concentrations of 10-20 g m-3 if expressed relative to annual
averages.
Meteorological conditions have led to higher PM2.5 during lockdown than the
average experienced in equivalent calendar periods from previous years.
Analysis combining observations and models indicates however that PM2.5
concentrations were of the order 2 - 5 g m-3 lower in Southern England than
would have been expected under a business-as-usual emissions scenario. The
changes to UK PM2.5 in terms of contributing sources and transboundary
influences have yet to be determined.
Changes to population exposure to air pollution are variable and more uncertain
than estimates of changes in ambient concentrations. Some urban locations
have seen significant falls in NO2, and wider working from home has reduced
travel exposure more generally in cities. In London, initial estimates of reduction
8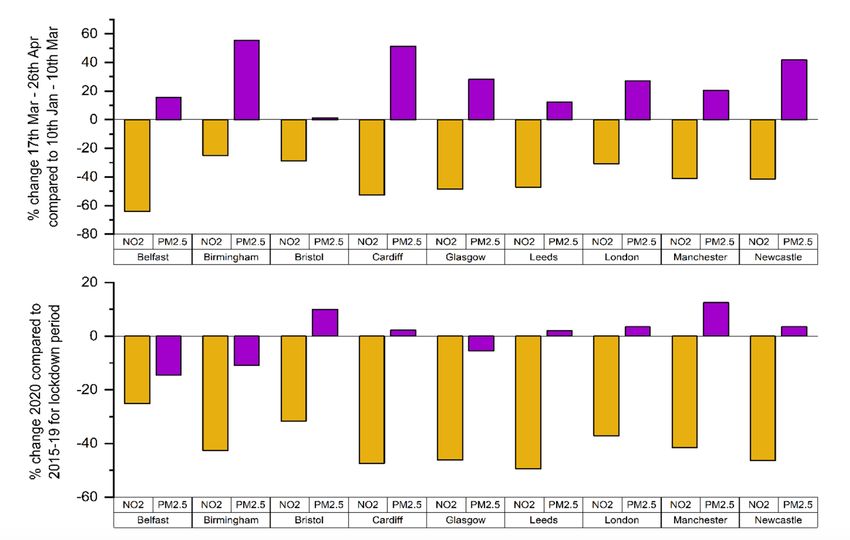
in PM2.5 exposure compared to business-as-usual are in the range 5-24%
depending on factors such as commuting mode.
Little is known about the impact of lockdown on indoor air quality, since homes
are not routinely monitored in the UK. Whilst exposure to pollution in the
workplace and during commuting will have likely reduced for many people,
increased time spent on activities in the home such as cooking and cleaning
may have increased emissions and concentrations of pollutants such as PM2.5
and Volatile Organic Compounds (VOCs).
Increased ozone has been observed at some urban monitoring stations, a result
of lower local NO. Models suggest the responses in UK ozone for this summer
compared to business-as-usual are variable, with no single direction of change,
although there may be some modest increases in urban areas and in central and
south-eastern parts of the UK.
Long-term exposure to air pollution is associated with increased morbidity and
mortality from chronic diseases, some of which have also been identified as
increasing the risk of severe COVID-19 symptoms. Given this, it would not be
surprising if there was a link between exposure to air pollution (past or present)
and the occurrence or severity of COVID-19 infection. Whilst several
unpublished studies have examined this effect, and have reported associations
with past exposure to both PM2.5 and NO2, there is currently no consensus on
the pollutant responsible or the magnitude of any effect. Such studies require
very careful control for confounding influences, and further work is needed
before there can be confidence in their findings.
Very small amounts of RNA from SARS-CoV-2 have been observed in outdoor
particulate matter but it is not yet known whether breathing air outdoors provides
a significant route for transmission of live virus or infection. Whilst aerosol
containing the virus can build up indoors in poorly ventilated rooms, dilution is
rapid in an open outdoor environment, which is likely to reduce the dose of virus
inhaled compared to indoors. The lifetime of active virus in the outdoor
atmosphere has yet to be determined.
9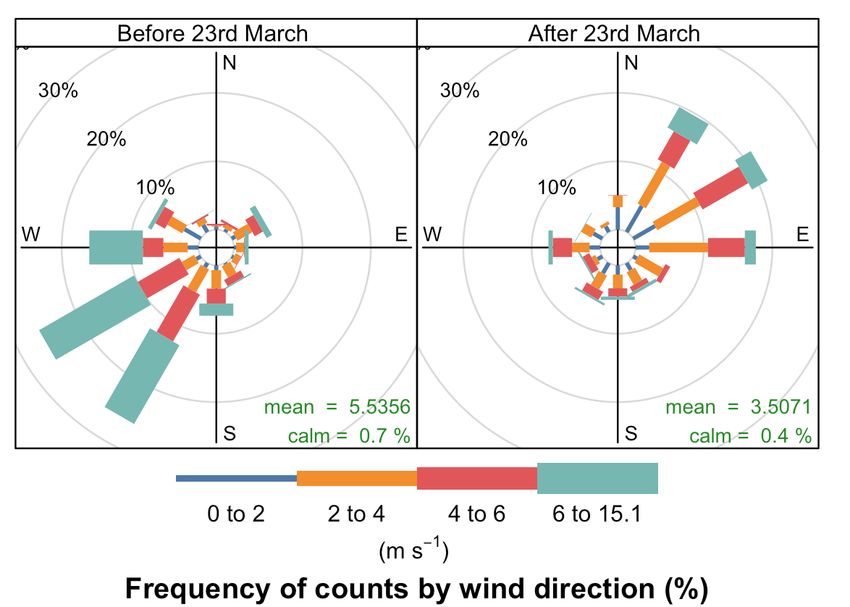
Evidence gaps
The call for evidence highlighted that extensive research work has already been
completed in the UK quantifying reductions in air pollution during lockdown,
particularly for NO2 and its links to changes in transport and mobility patterns. It
would be anticipated that a significant body of peer-reviewed literature will emerge
on this topic. The evidence review has revealed a number of areas where there are
however key gaps, and where generating new knowledge would be particularly
valuable to inform policy and regulation.
The impacts of lockdown on PM2.5 may shed valuable observational constraint to
support future air quality target setting in the UK. The full value of blended
datasets drawing on, for example, PM chemical composition, PM precursors,
network PM data and regional and urban models have yet to be realised.
Initial modelling of summertime ozone with reduced NOx emissions from
transport is reflective of possible UK urban atmosphere around 2030. The
possible changes this induces in ozone are however finely balanced in many
places, and ozone modelling is notoriously non-linear. Greater confidence would
be gained from coordinated multi-model assessment, validated against
observations. There is a significant opportunity here for basic research to directly
inform national emissions reduction plans.
Links between atmospheric concentration response and underlying emissions
activity appear robust for urban NOx and road transport, but for many other
pollutants and processes emissions and activity data are not currently available.
Emissions data for 2020 at UK level from sectors such as energy, industry,
commercial, and domestic will likely emerge as part of inventory reporting
activities, and the research value of these activity datasets should be maximised
alongside observational information and models. There will likely remain greater
uncertainties on how activities and emissions have been affected at local level
and over shorter time periods during the year.
Virtually no research-grade observations are available to quantify changes to
exposure to air pollution in UK homes, despite the major behavioural changes
occurring during the COVID-19 lock-down. This absence of evidence on in-home
exposure then adds very large uncertainties to estimates of overall population
impacts. There are however, some opportunities to further explore non-
traditional data sources, for example from sensors built into internet-enabled
indoor air purifiers operating during this period. Whilst low cost sensor data may
give some indication of past indoor air quality, establishing some basic UK
observing capability appears urgent, given the possibility of further lockdown
periods should virus infection rates increase.
Changes to the emissions profile during COVID-19 will likely have fed through
into not only changed overall ambient concentrations and exposure to particulate
10matter, but also to changes in the size distribution and chemical composition of
those particles. The impacts of these changes are not known, but the datasets
already collected, including from online instruments and offline samples,
provides the necessary starting point to explore this further.
There is currently very limited evidence to support the concept of transmission of
viable live SARS-Cov-2 virus via ambient (outdoor) particulate matter, something
that requires further evaluation through a range of laboratory experiments
alongside ambient sampling and analysis.
111. Expected changes in air pollution
emissions
Emissions during COVID-19 lockdown to 30th April 2020
Changes in activity need to be interpreted in the context of the timeline of the
introduction of lockdown in the UK: the UK government advised against all non-
essential travel and contacts on 16th March 2020, closed schools and restaurants on
20th March and announced full lockdown on 23rd March. This report covers the
period to 30th April. Subsequently, restrictions were partially eased in England on
13th May 2020 when government advice switched to “stay alert”. Many businesses
had already started to switch to homeworking in the two weeks prior to lockdown and
many industries ceased or reduced operation.
To date there has been data showing the reduction in transport activities, particularly
road traffic, rail services and aviation, as well as a reduction in overall energy use. In
addition, there is a general consensus that the lockdown has reduced activities and
therefore emissions from construction, commercial heating, combustion and
processes in industry and power generation, but the underlying statistical data are
still lacking. Whilst this section focuses on UK emissions it should be noted there
have also been large reductions in air pollution emissions across Europe as a
consequence of COVID-19. International reductions in emissions can have
significant impacts on the UK particularly for longer-lived pollutants such as PM2.5
and ozone that are subject to transboundary transport.
Transport Sector
The reduction in mobility decreased vehicle traffic by about 70% by mid-April
according to Department for Transport (DfT) data (Figure 1), with various Local
Authorities seeing overall reductions of 50% (London), 62% (Central London), 60 to
70% (Leeds), 60% (Newcastle), 55-60% (East & West Sussex) and 60 to 75%
(Manchester) (GLA, 2020; Ropkins et al., University of Leeds, 2020; Fawcett and
Chan, ARUP, 2020; Jenkins et al., Phlorium Ltd, 2020; Alfarra et al., University of
Manchester, 2020). Traffic volumes have since gradually increased again. Weekend
reductions were greater than weekday reductions on some rural and urban roads
(and in London), but weekday reductions were greater on other urban roads. The
diurnal traffic pattern has changed closer to Sunday conditions and there have been
changes in relative vehicle fleet composition, with likely a much smaller reduction in
HGV traffic on motorways and outside town centres. Until 18th May, the congestion
charge, LEZ and ULEZ charges in London were suspended to help key workers
travel allowing the use of older, higher emitting vehicles in the LEZ/ULEZ charging
zone.
As seen in data from the Waze For Cities Programme, the length of congested road
segments in Greater London dropped by more than 75% and the free-flowing traffic
12and higher vehicle speeds will likely have decreased urban emission factors i.e.
decreased the emissions per vehicle km for a given vehicle, a conclusion supported
by the Breathelondon submission (Carruthers and Jones et al. CERC / University of
Cambridge, 2020) which used an urban model inversion to estimate reductions of
order 80% in road traffic emissions of NOx in London (see Figure 2).
Figure 1. Relative reductions in traffic according to the data shown at the government’s
COVID-19 briefing on 31st May 2020 (Prime Minister’s Office, 2020). The flight data were taken
from the absolute values from flightradar24 data as reported by the BBC (2020) and rescaled
assuming 100% activity was occurring on day 1.
Overall, the reduction in transport will have led to a marked decrease in road
transport emissions of NOx, exhaust PM and non-exhaust PM. Road transport
normally accounts for 49% of the NOx emissions in London according to the London
Atmospheric Emissions Inventory (LAEI, 2016). Where LEZ/ULEZs were introduced
in the past 18 months it becomes challenging to distinguish the impact of COVID-19
related restrictions from those due to ongoing changes in traffic management on
traffic numbers and fleet average emission factors. However, a reduction in NOx
emissions in London has been supported by evidence for a reduction in roadside
hydrocarbon concentrations at Marylebone Road, analysis of NOx at roadside sites
and CO2 flux measurements in London, all being broadly consistent with a 50-60%
reduction in traffic.
The reduction in traffic will also have led to a reduction in other pollutants emitted
from vehicle exhausts, including volatile organic compounds (VOCs) and ammonia
(NH3). Although traffic is a relatively small source of NH3 compared with agriculture,
the emissions are co-located with high NOx emissions in an urban environment and
are therefore, on a per mass basis, more efficient in acting as PM2.5 precursors than
emissions in the rural environment. A submission from the UK Centre for Ecology and
13Hydrology (Braban et al., UKCEH, 2020) estimated that urban on-road and roadside
emissions of NH3 might have decreased by as much as 90% since the start of the
lockdown. The introduction of more Selective Catalytic Reduction systems to
remove NOx emissions from diesel vehicle, as well as any increase in the use of
petrol vehicles, is predicted to increase on-road NH3 emissions.
Figure 2. London measured concentrations (black) and derived road traffic emissions
(purple), both as a percentage of the average over the 1-16 March pre-lockdown period.
Measured concentrations are from all available sites in the LAQN, AQE and BL networks
(184 sites in total); traffic emissions have been derived by assimilating measurements using
the ADMS-Urban model. The numbers indicate the median value; the shaded areas give the
inter-quartile range. Key dates are shown by the red lines, as are the mean lockdown values
(24th March onwards).
Reproduced from: Carruthers, D. and Jones, R.L. on behalf of Breathe London partners.
CERC and University of Cambridge, 2020. “Breathe London submission to the Defra /
AQEG COVID-19 call.”
The decrease in road traffic was mirrored by even larger declines in other transport
activity (Figure 1). The drop in flight departures was accompanied by reduced airport
traffic on and around the airports. Figure 1 hides the fact that a smaller relative drop
at the UK’s busiest airport (Heathrow) is masking larger reductions elsewhere.
Passenger rail services in terms of number of journeys had dropped by over 90% by
the end of April according to DfT and by almost 40% on average in terms of mileage
according to the Office of Rail and Road over the same period. According to National
Rail, there has been a smaller reduction in freight services although these normally
account for only 25% of the rail sector’s diesel fuel consumption. Clearly, reductions
of all modes of transport started well before 23rd March.
14The situation for shipping appears more complex with large decreases in activities
for some vessel types (particularly offshore, passenger vessels and fishing) and little
change in others, depending on cargo type. Whilst there are no confirmed data
currently available, the view of the shipping industry is that there has been an overall
reduction in movements globally. However, there is some evidence of ships being
laid up in UK ports leaving auxiliary engines running which could increase emissions
locally.
Emissions from commercial and residential properties
In particular in cities, emissions would be expected to be reduced from commercial
heating and commercial cooking. There are some recognised differences between
the NAEI and LAEI in the estimated size of these emissions for London. Commercial
heating is estimated to account normally for 44% of the NOx emissions and cooking
for 55% of the primary PM2.5 emissions in central London according to the LAEI
(2016). Observational evidence of a reduction in PM2.5 from cooking based on
changes in ambient concentrations is not currently available; the COVID-19
lockdown period may provide a useful test for this component of emissions
inventories. Nationally, according to various industry indicators for the sector,
construction activity was down by around 25% in April and this sector is estimated to
normally account for 35% of the PM10 emission in London as a whole (LAEI, 2016).
Whilst not a pollutant of direct health concern, daytime CO2 emissions have fallen by
55% in central London (Nemitz et al., UKCEH, 2020). This can act as a
measurement-based marker of the overall reduction in fossil fuel combustion from all
sources, which in turn dominate the primary emissions of NOx and contributes to
primary PM. By contrast, at the country scale, e.g. including industry and energy
generation not located in urban centres, daily CO2 emissions are thought to be down
by 20% from typically 1.0 to 0.8 Mt CO2 per day (Liu et al., 2020).
With the move to home working, reductions of emissions in commercial areas (shops
and offices) will have been partly compensated by increases from homes, but still
resulting in a net decrease in most emissions, but also a change in the spatial
pattern. There has not been a detectable surge in residential gas use, which is
strongly influenced by ambient temperatures not just by home occupancy. Overall
gas distribution is down by 11% (International Energy Agency (IEA), 2020). It is likely
that future analysis of gas consumption data corrected for meteorological conditions
will give further insight on the impact of restrictions on domestic gas consumption
and therefore domestic heating emissions.
There is evidence that solid fuel combustion in domestic fires and stoves went up
initially after lockdown and that the emissions peak shifted to later in the day.
However, this initial increase is likely to have subsided with rising ambient
temperatures and would also be limited by fuel stocks. Nuisance reports linked to
bonfires and burning of garden waste have risen since the lockdown began despite
discouragement and even banning by some local authorities (e.g. in Edinburgh,
(CIEH, 2020)).
15It should be noted that the reporting level by the public might also have changed: it
might have gone up as people spend more time at home to notice the burning of
garden waste, or down, as people have become more tolerant. It is also possible that
increased public perception of a link between air quality and COVID-19 has changed
reporting of local pollution events. An increase in emissions from domestic
combustion is supported with evidence associated with the detection of certain
markers of particulate matter from wood burning at monitoring sites in Manchester
and London.
Power generation and industry
Overall electricity generation has decreased by 10-20% driven by less demand from
industry and the commercial sectors (e.g. IEA, 2020), but partly offset by the
residential sector. Emission reductions from the power generating sector will be
larger, however, because renewables have claimed a greater share as demand has
fallen. According to Drax Electric Insights the UK has been able to go without coal
power since 11th April, with the COVID-19 reductions adding to a long-term trend.
Industrial emissions (including combustion in industry) are clearly down, but robust
industrial output statistics are not yet available for the first quarter of 2020. It is likely
that there is a larger relative reduction from smaller industries. Demand for mineral
production (sand & gravel) has fallen by about 50% according to one local authority
source (CIEH, 2020).
There are a number of other fairly specific sources for which emissions are likely to
have changed since the lockdown began, but for which there is currently no firm
supporting evidence to support this. Some sources may have shown an increase in
emissions since lockdown started, while others have decreased. Current estimates
of emissions of each of these individual sources may be relatively small and
therefore of no great significance to air quality, but when considered together, their
impact could become more significant, particularly in the case of VOC emissions
which are affected by emissions from a very diverse range of different sources.
These potentially changed sources and the pollutants emitted are summarised in
Table 1. The symbol ↑ indicates an increase in emissions may be expected, ↓ a
decrease may be expected. To put the source into overall context, the table also
shows the percent contribution of the source to total UK emissions in 2018,
according to the National Atmospheric Emissions Inventory (NAEI, see
https://naei.beis.gov.uk). The reasoning behind these anticipated changes is shown
and is largely based on expert opinion, but in some cases it is supported by
anecdotal evidence from industry on trends previously observed. One local authority
also reported that emissions of VOCs from industrial production of solvents were
declining locally by around 30%.
Emissions (e.g. of mercury) from medical waste incinerators and crematoria will have
increased due to increased activity, and locally traffic around hospitals including the new
16Nightingale hospitals. This will continue to be closely related to the progression of the
pandemic in the UK.
Table 1: Emissions from UK sources that may have changed since the start of the COVID-
19 lockdown period based on expert opinion but for which there is currently no formal
emissions reporting or activity data.
Reproduced from: Murrells, T. et al., Ricardo Energy and Environment, 2020. “Response
from Ricardo to Key Questions”
Emission source Pollutants Directional % UK Reasoning
change totals in
2018
Burning of garden waste NOx ↑ 0.02% Increase in bonfires due to reductions in
PM2.5 1.3% garden waste collections and with people
Benzo(a)pyrene 0.12% spending more time at home. Possible
increase in emissions from outdoor cooking
and barbeques
Composting/anaerobic NH3 ↓↑ 2.3% Lower emissions from fewer council waste
digestion collections offset by possibly more
agricultural/ commercial waste from food
waste and domestic composting
Recycling/disposal of NH3 ↑ 0.66% Higher quantities of household waste
household waste, Hg 11.4% collected as people spend more time at home
including wastewater
treatment
Clinical waste NOx ↑ 0.02% Increase in hospital admissions and activities,
incineration PM2.5 0.01% increased usage of PPE
Crematoria NOx ↑ 0.05% Increased hours of crematoria activity to cope
PM2.5 0.02% with increased number of deaths
Hg 15.8%
House & garden NOx ↑ 0.10% Increase due to people spending more time at
machinery PM2.5 0.02% home to do gardening / DIY
VOCs 0.16%
Inland waterways NOx ↓ 0.01% Decrease in recreational craft and
PM2.5 0.01% tourist/pleasure boats on rivers and canals
Beer brewing VOCs ↓ 0.93% Decrease in brewing to meet demands of
pubs and restaurants unlikely to be offset by
increase in domestic consumption at home
Production and use of VOCs ↑ Not Increased production, including at some
sanitisers estimated distilleries, and consumption by general
population
Aerosol and non-aerosol VOCs ↑ 7.7% Increased by people spending more time at
household cleaning and home. Possible increases in use of cosmetic
cosmetic products products during periods of uncertainty
Non-aerosol products - VOCs ↑ 2.3% Increased by people spending more time at
Domestic adhesives, home doing DIY
paint thinners
Car care products VOCs ↓ 4.4% Less use of cars
(screenwash)
Commercial cleaning VOCs ↓ 1.6% Less demand because of lower commercial
products activities
Commercial, industrial VOCs ↓ 5.7% Less industrial and commercial activities
paints, coatings, particularly among smaller businesses
adhesives, sealants
Dry cleaning VOCs ↓ 0.08% Lower demand
Refineries - fugitives VOCs ↓ 2.6% Refineries may be operating at lower levels
with less demand for fuels
Petrol distribution VOCs ↓ 2.1% Less fuel being distributed as fuel demand
decreased
17Agriculture and natural emissions
As with industrial statistics, agricultural output statistics are not yet available for
2020, but it is likely that agriculture has changed little over the lockdown period,
leaving agricultural emissions (NH3, primary PM, CH4, N2O) largely unchanged.
Because NH3 emissions are influenced by meteorology, the unusually dry and sunny
April may have increased emissions compared with the long-term mean for this time
of year; similarly, the dry conditions would have favoured agricultural PM emission
from tilling activities. Equally not associated with COVID-19 but with meteorology,
the dry April has seen a number of wildfires across the country that need to be
considered when interpreting measurement data.
Overall picture of emissions including greenhouse gases
The EU H2020 CONSTRAIN project (Forster and Rosen, University of Leeds, 2020)
has estimated changes in daily UK emissions for a range of pollutants for 6 selected
sectors based on currently available proxies for activities (smart meters, mobility
data from Google and Apple, flight data) (Figure 3). It is important to note that the
total fractional emissions (black lines) only cover those sectors included. For
example, for NH3 the 45% reduction in emission from these non-agricultural sources
is consistent with estimates of on-road and roadside emission reductions of 30% and
90% estimated by another study (Braban et al., UKCEH, 2020).. However, the
agricultural sector accounts for 85% of the emission under normal conditions, so
assuming that agricultural NH3 emissions have continued unchanged (agricultural
statistical data pending), total emissions would have decreased by only 2% (Braban
et al., UKCEH, 2020).
Anticipated emission changes over the next three months and beyond
Some concerns have been raised about an increase in emissions from outdoor
burning as the UK enters the warmer summer season (CIEH, 2020). This includes
possible burning of commercial waste on building sites as well as fly-tipped waste.
Several local authorities have expressed the need for national government to send
out a stronger message to the public to store or compost garden wastes, support the
re-opening of waste sites and garden waste collection, ban the use of charcoal
BBQs and fire-pits in urban areas over the upcoming summer season. A moratorium
on prescribed muirburn was also suggested.
The evolution of air pollution emissions in the near future will depend on how the
government decides to ease restrictions and society’s response. With the
government advice currently (in May 2020) to avoid public transport and car sharing
incompatible with social distancing, there is some risk that traffic volumes might
increase above pre-lockdown levels despite continuation of home working by many.
If the advice against foreign travel stays in place, rural areas could see unusual
levels of traffic associated with holidaying in the UK.
18In the longer run, emissions will also depend on the economy and the “new normal”
society might adapt to. This applies to the level of aviation, homeworking (and
related commuter traffic), use of delivery services and a potential long-term increase
in walking and cycling. Traffic levels have already started to increase again (as of
end May 2020) with the easing of lockdown restrictions. Traffic may return to pre-
lockdown levels to a different extent in different areas. Relative changes in daily
regional mobility data from the Google Community Mobility Reports provides a
breakdown by category (grocery stores, parks, residential, workplaces, transit
stations, and retail) in changes to daily movement at a regional level. As the UK
comes out of lockdown measures, these considerations are particularly important as
some regions of the country will be more adept to supporting larger portions of their
workforce staying at home, therefore maintaining lower level of emissions, than
others. Areas with a high proportion of manufacturing work, where the workforce is
less able to work from home, may experience a greater rate of increase in home-to-
work traffic than those areas with less manufacturing and more office-based
employment.
19Figure 3. Fraction of UK pollutant emissions from selected sectors vs days from start of the
pandemic. Note: the total does not reflect the country total as not all sectors are included.
Reproduced from: Forster, P. and Rosen, D.Z. University of Leeds, 2020. “Submission to
DEFRA on COVID-19 by the EU H2020 CONSTRAIN project.”
New car sales have fallen substantially in recent months and if they remain low this
will impact on the future rate of vehicle fleet turnover, slowing down the penetration
of lower emitting vehicles in the fleet, resulting in larger emissions in future years
than originally projected. One NAEI-based study cited by Murrells et al. Ricardo,
(2020) estimated a potential 4% increase in urban NOx emissions for 2021 compared
with the current (pre-lockdown) forecast resulting from the slower fleet turnover,
assuming the traffic flow projections remain unaffected
202. How have ambient concentrations of
NOx, NO2, PM, O3, VOC, NH3 etc.
changed since the COVID outbreak?
Meteorological Context
When considering the analysis of ambient pollutant concentrations and their potential
change due to COVID-19 interventions, it is important to understand the general
climatology. The weather during 2020 up to May has been exceptional in many ways
across the UK. February 2020 was characterised as having much higher wind
speeds than long-term average values and high rainfall levels. In the 6 weeks
following the lockdown date, most of the UK experienced a high proportion of
easterly air flows, very low rainfall (reducing wet deposition) and significantly higher
than average sunshine hours (potentially increasing photochemistry). Figure 4 shows
the wind rose for London Heathrow split by the before and after periods.
Figure 4. Wind roses from London Heathrow from 1 January 2020 to 18 May 2020 split by
before and after the lockdown date.
These meteorological factors are of direct importance when considering changes in
pollutant concentrations due to COVID-19 for all sites and all pollutants.
Furthermore, the lockdown period covering late March, April and most of May also
coincides with a time of year where O3 concentrations tend to be elevated in the UK
and there is an increased frequency of regional PM2.5 pollution episodes from
mainland Europe. In addition, the combination of the application of fertilizers and
manure spreading which increases NH3 emissions and concentrations at this time of
year with still relatively cool temperatures is also of importance for PM2.5. In this
21respect, the timing of the lockdown and the high frequency of winds from Europe
could well prove useful in the longer term for understanding how continental
reductions in emissions affect the UK air pollution picture.
The responses to the AQEG call for evidence cover a wide range of measurement
approaches including the analysis of data from continuous analysers from the
AURN, local authority data, low cost sensors and measurements made by satellites.
Additionally, air quality models have been used either directly or in tandem with
measurements to understand potential changes.
Approaches to analysis
Several types of analysis can be broadly identified:
Simple before / after comparisons making direct use of measurement data.
These types of approach have the benefit of simplicity but can be strongly
influenced by meteorological and seasonal changes. Many of the responses
from local authorities fall into this category. A variation on this approach
involves the direct comparison of measurements from paired roadside and
background instruments, which provides some control for confounding
effects.
Comparison of a post-lockdown period with a summary of previous periods
e.g. the average (or variation) of the 5 previous years. Many organisations
used this or a similar approach. Most of these studies show that the period
after lockdown had markedly lower concentrations of pollutants such as NOx
and NO2. These approaches have the benefit of averaging-out previous
meteorological variability through the consideration of several years of data.
On the other hand, for pollutants such as NOx and NO2 there has been a
clear downward trend at most urban / roadside sites over the past few years,
which means the most recent measurements would tend to show lower
concentrations than previous periods irrespective of any additional changes
due to COVID-19 actions specifically.
The use of ‘meteorological normalisation’ (sometimes referred to as
deweathering’) to account for the variation in concentrations due to changes
in meteorology. These methods use statistical models to explain
concentrations in terms of commonly measured (or modelled) variables such
as wind speed, wind direction and ambient temperature. Submissions
included the use of multi-linear regression, Boosted Regression Trees and
Random Forests. These methods have been used in two ways: to provide an
estimate of pollutant concentrations if COVID-19 actions had not taken place,
and to run many simulations to average the meteorological variation over the
period of interest. The former approach attempts to provide a counterfactual
i.e. estimated concentrations of pollutants had COVID-19 not occurred.
Many studies also considered the evidence of ‘change-points’ in the
concentrations of different species. These studies provide an extra level of
22inference in that the timing of the change(s) calculated in pollutant time series
can be compared with the lockdown date or changes in activity data such as
traffic flows.
For some pollutants and some locations such as roadside NOx, the scale of the
reduction in concentrations (over 50%) is large enough to reasonably be detected by
most of the methods described above, including satellite measurements described
below. The difficulty arises when attempting to robustly quantify these changes
because biases can easily be introduced depending on the approach used e.g. due
to varying meteorological conditions and imperfect models.
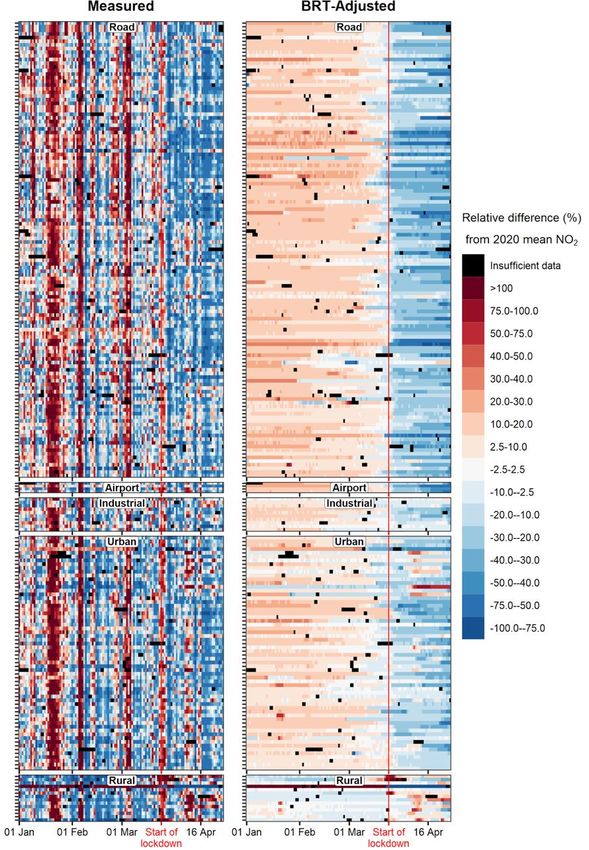
Figure 5 shows how meteorology can mask the underlying trends in concentrations.
The first column shows the relative variation in measured daily mean NO 2
concentrations in 2020 across 225 UK monitoring sites. The second column then
shows the equivalent concentrations following statistical analysis to remove the
variability caused by differences in the weather. While there is an obvious trend for
lower measured NO2 concentrations at many sites following the lockdown, the scale
of this reduction only becomes clear after removing the confounding effects of
meteorology.
Pollutants and data sources considered
Most of the responses considered changes in NOx, NO2 and O3 concentrations from
the AURN and other local networks. However, there are also examples of data from
sensor networks being used and two examples of DOAS (Differential Optical
Absorption Spectroscopy). Less attention was paid to PM10 and PM2.5. There were
also a few examples of the analysis of speciated data on PM composition and VOC
measurements. Overall, the analysis of data reflects both its ubiquity and
accessibility.
It seems likely that the lockdown, and its subsequent easing, will provide significant
opportunities for future analyses to better understand atmospheric chemistry in the
UK and, in particular, the role of road transport. These future analyses will be reliant
on current measurements, and the point was made that some pollutants (notably
NH3) may not be optimally represented in roadside monitoring networks at present.
Satellite measurements of air quality
Several of the responses consider the use of satellite measurements, focusing
mostly on column densities of NO2 using the Sentinel-5p satellite. These studies
have the advantage of providing useful spatial information on the distribution of NO2
that cannot be provided by point sampling methods. However, there are many
challenges in working with satellite data, some of which are common to all
approaches used to analyse the effect of COVID-19. For example, the analysis of
satellite data is still prone to meteorological variation, which is an issue for most
approaches. There have been some specific limitations in retrieving column NO2
data from satellites for the pre-lockdown periods of February and early March 2020
when there was extensive cloud cover over the UK. Whilst satellite observations
23showed anecdotal examples of lower NO2 on selected days pre-lockdown there was
a lack of quantitative information on the before-after changes from the submissions
received. With more data and more time to analyse satellite data it is likely that
improved quantitative information will become available, potentially also for NH 3.
Figure 5. Relative change in daily-mean NO2 between 1st Jan and 29th April 2020 at 225
monitoring sites on the AURN and other UK Networks. Each row of pixels represents a
single site, with individual sites denoted by tick marks on the y axis. First column (left)
shows raw measured data. Second column (right) shows equivalent values with the effects
of meteorological variability removed using Boosted Regression Trees through the
deweather package in openair.
24Reproduced from Marner, B., Laxen D., Gellatly, R., Liska, T. Air Quality Consultants, 2020
“Response to AQEG Request for Rapid Evidence on COVID-19 & UK Air Quality.”
Use of models to estimate changes in concentrations
Several submissions used air quality models to provide insight into changes in
ambient concentrations of different pollutants. These models range from local (street
level) to regional scales. Two main approaches were used. The first approach used
models to run simulations of estimated emission reduction scenarios to explore the
response in concentration of different pollutants. The challenge here is that at this
time the actual change in emissions is still somewhat uncertain and must be
estimated.
The second more sophisticated methods were to conduct inverse modelling to infer
an emission reductions that could be explained based on observed concentration
values, and also the use of machine learning approaches to develop a predicted
counterfactual (similar to the meteorological normalisation methods). The initial
findings from local-scale model inversion are promising because they can be related
in a direct way to specific changes in emissions required to explain the observations.
A more complex GEOS-GF global forecasting model that was ‘corrected’ using
machine learning approaches to explain sub-grid scale measurements (e.g. for
roadside monitoring locations and data), suggested that there was approximately a
30% reduction in NO2 across a wide range of sites, similar to many of the analyses
of air quality network data.
Changes to NOx and NO2 concentrations
Many submissions provided quantitative information on how concentrations of
pollutants changed. This information focused mostly on the changes in the
concentrations of NOx, NO2 and O3. A direct comparison between the studies is
frustrated by the different periods and sites considered, and the methods used to
quantify the change. A summary of the key studies providing quantitative information
is given in Table 2. Despite issues related to the analysis approaches, Table 2
reveals some good consistency in relative concentration changes across monitoring
sites.
Figure 6 summarises the relative changes in calculated NO2 during the lockdown
from the four studies which applied some form of deweathering to multiple sites to
calculate comparable statistics. Each of these studies takes a different
methodological approach and also focuses on different monitoring periods. It is
nevertheless clear that each of the studies shows quite similar results: both when
comparing individual monitoring sites and when viewed more broadly across the UK
as a whole.
25Figure 6. Changes in mean NO2 during lockdown at 224 non-rural UK monitoring sites
calculated using four alternative approaches to weather normalisation: A) Relative change in
mean NO2 during lockdown vs long-term (Jan 2017- Dec 2019) mean NO2; and B)
Comparison of approaches where equivalent sites are used (x axis shows the change
calculated by the first listed study, y axis shows the second listed study). AQC, Ricardo and
Reading all present % changes and these have been used directly. The Swansea study
presents absolute changes which have been expressed relative to the 3-year mean.
Data reproduced from: Marner, B. et al. Air Quality Consultants, 2020; Murrells, T. et al.,
Ricardo Energy and Environment, 2020; Lewis, P.D., Seller, V., Price, T., and Eskandari, H.,
Swansea University, 2020; and Dacre, H., and Mortimer, H., University of Reading / STFC,
2020
In general, there have been greater reductions in NOx than in NO2 and other air
pollutants. Analyses which have applied some form of deweathering, and which have
included substantial numbers of sites, show mean reductions in urban NOx,
averaged over the period of lockdown considered, of typically 30-40% and mean
NO2 reductions of 20-30%. These reductions might typically correspond to
decreases in NO2 concentrations of 10-20 μg m-3 if expressed relative to annual
means.
Analyses of changes in NOx and NO2 based directly on measured data tend to
suggest greater relative changes than those undertaking some form of normalisation,
presumably reflecting confounding issues of weather and/or seasonal and longer-
term trends on air pollutant concentrations.
There is a trend for reductions in NOx and NO2 to be greatest where NOx and NO2
concentration were high, thus there are greater reductions (both proportional and
absolute) at roadside sites compared with urban background sites. This clearly
reflects the direct impact of local traffic reduction at sites where traffic is the
dominant contribution to NOx and NO2. Figure 6 highlights this general trend, but
also shows considerable between-site variability at similar ambient concentrations.
26Analyses of diurnal cycles in NO2 concentrations show reductions are dominated by
decreases during the daytime and the loss of typical morning and afternoon rush-
hour maxima in concentrations, consistent with the change to a weekend driving
pattern reported above. The major influence of changes in traffic on NOx and NO2
concentrations is supported by the decline in roadside increments of NO x and NO2 in
London during the pre-lockdown period (12-23 March 2020) which continued to
reduce after the full lockdown. Weekday/weekend ratios of NOx and NO2 suggest
traffic activity reduced at weekends more than during the week.
There is, however, considerable variation in the magnitude of reduction across sites,
including some sites where NOx and NO2 is estimated to have increased. The
reasons for this are not clear but may be caused by site-specific local traffic or other
source changes. Increases in NOx and NO2 at some rural sites may reflect the
regional scale pollution conditions encountered post-lockdown. It is also important to
note that NOx and NO2 concentrations are much lower at rural sites so absolute
concentration changes are often small.
Changes to ozone concentrations
Measurements show significant increases in O3 at roadside sites (mean increases
averaged over the period of lockdown considered of the order of 15-20%), and
smaller increases at urban background sites (mean increases of ~5%) although
again with significant between-site variability. The increase in urban O3 is a
consequence of the reductions in primary NO emissions decreasing the extent of
chemical loss of O3 through reaction with NO. In urban areas there has likely been a
redistribution in the constituents of Ox (= NO2 + O3) from NO2 to O3.
In urban NOx regimes, reductions in NO emissions not only redistribute Ox into O3,
but also lead to the reduction of loss of ROx via OH + NO2. Reducing NOx
concentrations in high NOx urban conditions can also lead to increased
concentrations of peroxy radicals (HO2 and RO2) with the potential to increase
photochemical production of O3. The relative contributions from these two effects is
not yet quantified, nor the impact of possible changes that may have occurred to
VOC emissions on O3. These uncertainties could be addressed with further chemical
modelling.
Applying a deweathering approach to ozone observations in the UK provides some
indication of the scale of change of ozone compared to business as usual, accepting
that there are transboundary contributions to ozone that are not always accounted
for by local meteorological normalisation. Figure 7 shows the raw ozone data and
deweathered data for urban, rural, roadside and industrial sites across the UK, with
largest relative increases in ozone seen roadside for reasons described earlier.
There is some indication however of higher rural ozone than under a business as
usual scenario.
27Figure 7. Relative change in daily-mean ozone between 1st January and 29th April 2020 at
75 monitoring sites in the AURN and other UK Networks. First column shows raw measured
data. Second column shows equivalent values with the effects of meteorological variability
removed using Boosted Regression Trees through the deweather package in openair. Each
row of pixels represents a single site, with individual sites denoted by tick marks on the y
axis.
Reproduced from: Marner, B. et al., Air Quality Consultants, 2020 “Response to AQEG
Request for Rapid Evidence on COVID-19 & UK Air Quality.”
Changes to PM2.5 concentrations
Quantifying the changes in PM2.5 concentrations during the lockdown period is a
more complex problem than for NO2, because it is affected by both local sources and
the transport of pollution from wider regions, and indeed from well beyond UK
borders. Southern and Eastern parts of the UK can be particularly susceptible to
higher PM2.5 during anticyclonic conditions, drawing air already elevated in PM2.5
from mainland Europe, and this has been a dominant type of weather pattern over
much of April and May. Statistical methods for removing the effects of meteorology
are not as effective as they are for NO2, since variability of PM2.5 is influenced by not
only local emissions and meteorology, but also longer-range air mass trajectory and
origins.
The changes in NO2 emissions have been sufficiently large that over the early
lockdown period (17th Mar to 29th Apr 2020) concentrations are clearly lower than
when compared to the pre-lockdown period from 1st Jan to 16th March 2020. This is
shown as a percentage difference on Figure 8 for nine UK cities. Figure 8 (top)
28shows that PM2.5 during the lockdown period was in most places higher than was
seen before lockdown in 2020. This was a consequence of cleaner than normal
periods with high winds and rain in February 2020 (pre-lockdown) and then greater
anticyclonic transboundary transport of PM2.5 from mainland Europe during the
lockdown period. Figure 8 (bottom) shows the lockdown period in 2020 and
compares this against the same calendar period for the average for 2015-2019.
When the lockdown period in 2020 is compared to previous years it is clear that NO2
is lower everywhere, but the picture for PM2.5 is mixed compared to previous years.
Figure 8: Top: Percentage change in NO2 (orange) and PM2.5 (purple) for nine UK cities for
pre- and post-lockdown period (1st Jan -16th March and 17th Mar – 29th Apr 2020). Bottom:
the lockdown period in 2020 and compared to the same calendar period averaged over
2015-2019.
Reproduced from: Lee, J.D., Drysdale, W., Wilde, S., National Centre for Atmospheric
Science / University of York, 2020. “Air Quality in the UK during the COVID-19 pandemic –
evidence from national monitoring stations.”
One evidence submission used observational data from the AURN over the period
2018-2020 and compared this with the GEOS Composition Forecasting (GEOS-CF)
system, using the GEOS-Chem gas and aerosol chemical scheme. Models such as
this provide a means to account also for the pollution history of an air mass as it is
transported. The model was run for the period 2018-2020 compared against surface
observations and any bias removed using machine learning methods. Once the bias
was removed from the whole dataset any remaining bias seen for given periods was
then attributed to the reduction in emissions of PM2.5 (and precursors) right across
29the model domain. The model showed a bias that over-predicted PM2.5 during the
lockdown period. The Keller and Evans submission does not attempt to quantify how
much emissions have reduced, or where those reductions occurred, but does
provide an ‘air mass corrected’ estimate of how COVID-19 period concentrations
have differed compared to what would have been expected under business-as-
usual.
Figure 9 shows the residuals from the model minus measurement, once machine
learning trained, for 2018/2019 for a representative sample of AURN monitoring
locations. It also shows the residual of model - measurement specifically for the early
lockdown period. Some significant residuals emerge in this period, indicative of
reductions in PM2.5 concentrations relative to those that would be expected under
business-as-usual, of the order 2 - 5 g m-3. Some fraction of this reduction will
undoubtedly have been caused by wider reductions in continental European
emissions, also affected by national lockdowns.
Figure 9. Distribution of AURN observations minus model residuals of PM2.5 from 16th March
to 25th April for a number of sites in the Southern England. Pink boxplots show the
difference between observed and predicted PM2.5, or the period 16th March to 25th April for
2018 and 2019, once the model had been trained and bias corrected. The dark red boxplots
show the difference between observed and model-predicted PM2.5 for the COVID-19
restriction period (16th March to 25th April 2020) once the model had been trained and bias
correct. Coloured bars indicate the 10-90% percentile, black line within the bar given the
median change, error bars indicate the 5-95% percentile change. The average for all sites is
shown in the left-most boxplot. The numbers at the bottom of the figure indicate the mean
concentrations as observed (upper row) and modelled (lower row), for 2018-2019 (left) and
30You can also read