What is a healthy river? - REPORT NO. 3035 - Funded by Cawthron Foundation - Cawthron Institute
←
→
Page content transcription
If your browser does not render page correctly, please read the page content below
What is a
      healthy river?
                      REPORT NO. 3035

         Funded by Cawthron Foundation
OCTOBER 2018							     REPORT NO. 3035 | CAWTHRON INSTITUTE   1
ISSUE DATE: OCTOBER 2018

                                         RECOMMENDED CITATION:
              Young R, Wagenhoff A, Holmes R, Newton M, Clapcott J 2018. What is a healthy river?.
                     Prepared for Cawthron Foundation. Cawthron Report No. 3035. 45 p.

               © COPYRIGHT: Cawthron Institute. This publication must not be reproduced, electronically or otherwise, in whole or in
                                       part without the written permission of the Cawthron Institute.

2   CAWTHRON INSTITUTE | REPORT NO. 3035 							OCTOBER 2018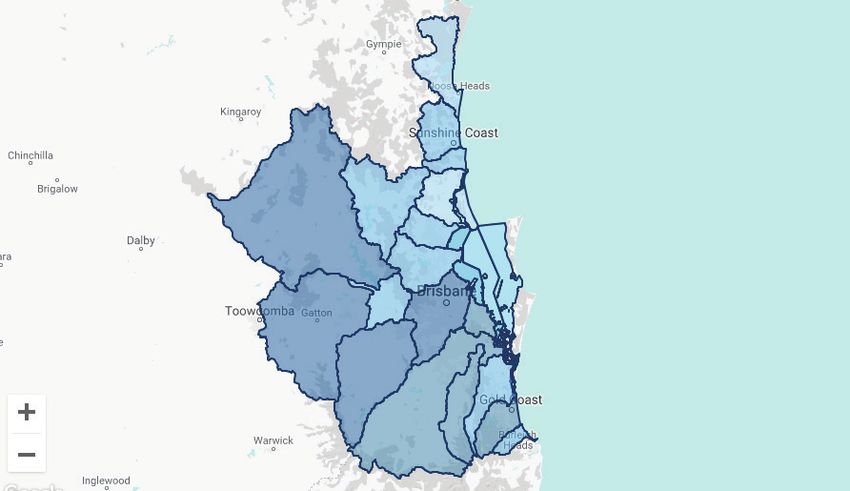
CONTENTS

     EXECUTIVE SUMMARY                                    6

     INTRODUCTION                                         8

     WHAT IS A HEALTHY RIVER?                             9

     INDICATORS OF RIVER ECOSYSTEM HEALTH               14

     WHAT’S HAPPENING ELSEWHERE?                        20

     HOW CAN RIVER HEALTH ASSESSMENT BE                 32
     IMPROVED IN NEW ZEALAND?

     SUMMARY                                            36

     ACKNOWLEDGEMENTS                                   38

     REFERENCES                                         39

     GLOSSARY                                           44

OCTOBER 2018							                  REPORT NO. 3035 | CAWTHRON INSTITUTE   3
4 CAWTHRON INSTITUTE | REPORT NO. 3035 OCTOBER 2018
WHAT IS A
                     HEALTHY RIVER?

     A discussion of the concepts and practice relating to river
               monitoring, reporting and management.

                                  ROGER YOUNG

                             ANNIKA WAGENHOFF

                                  ROBIN HOLMES

                                  MARK NEWTON

                              JOANNE CLAPCOTT

        Prepared for Cawthron Foundation

        CAWTHRON INSTITUTE
        98 Halifax Street East, Nelson 7010 | Private Bag 2, Nelson 7042 | New Zealand
        Ph. +64 3 548 2319 | Fax. +64 3 546 9464
        www.cawthron.org.nz

OCTOBER 2018							                                                REPORT NO. 3035 | CAWTHRON INSTITUTE   5
EXECUTIVE SUMMARY
New Zealand’s rivers provide habitat for a wide range of species.
People cherish rivers for the cultural, social and economic values that water bodies provide. The public is anxious
about the plight of our rivers and streams, believing the ecosystem health of these waterways must be diagnosed
and upheld just as we care for our own health. While most of us agree that ecosystem health is a worthy goal,
there is confusion about just what the term means, and whether we are measuring it correctly.
To promote more informed debate on the topic, this report presents a review of the science of ecosystem health
in rivers. It describes how indicators of river health are currently used in freshwater policy and management
in New Zealand. We look at overseas approaches to the development and use of freshwater indicators and
how these might apply in New Zealand. Finally, we identify some key requirements for improved river health
assessment and management in New Zealand.
A complete assessment of river health measures physical
structure, water flow, biological community composition,
and ecosystem processes and functioning, along with
the water quality parameters which have dominated river
assessments in the past.
People intuitively recognise the value of the ecosystem health concept, although they may describe it in different
ways. This diversity of views suggests that a range of interested groups should join to collectively decide society’s
goals for ecosystems, and how these can be achieved. In science, there is some overlap between ecosystem
health with the concepts of ecological integrity, ecosystem services and life-supporting capacity. The law, via
the National Policy Statement for Freshwater Management, defines ecosystem health in a narrower way than its
use in the scientific literature, which focuses on both ecological and human use values. Human use values are
addressed separately in the National Policy Statement for Freshwater Management.
Ideally, river health indicators give an early warning of impending concerns, show whether conditions meet
acceptable limits and help diagnose the causes of poor health. However, a single indicator will never fulfill
all these purposes. A complete assessment of river health measures physical structure, water flow, biological
community composition, and ecosystem processes and functioning, along with the water quality parameters
which have dominated river assessments in the past. The scale of indicator measurement is important in both
space and time, since some factors influence river health locally or over specific periods while others can have
widespread effects. Interpretation of indicator results often requires knowledge of expected reference condition
(the river’s benchmarked or desired state), so assessments can take account of natural differences in climate,
geology and species distributions. Indicators can provide a picture of current river health and show if conditions
are improving or getting worse.
6 CAWTHRON INSTITUTE | REPORT NO. 3035 OCTOBER 2018Reporting of river health needs to be as simple as possible, while capturing the key ecological features described
above. Indices that combine information from all these elements show some promise, but users must ensure
that no information is lost in the mix and results remain intuitive and easy to understand. To this end, ‘report
cards’ are becoming an increasingly popular approach to presenting information on the health of rivers.
Our review of river ecosystem health monitoring and management approaches in Europe, the United States,
Australia and Canada identified several crucial elements that are relevant to New Zealand. These are worth
considering in future efforts to improve our river health assessment and management programmes. Strong
national policy drivers for the management and monitoring of river ecosystem health are critical, with stakeholder
participation in planning and implementation. Policy should include clearly stated, overarching goals for river
ecosystem health as well as measurable, numeric objectives. Managers need a range of biological measures
(metrics) as well as measures of pollutants, water quality, flow regime and habitat condition to diagnose issues
and guide effective management interventions. Policy and management actions also need to consider the
cumulative effects of multiple pressures (stressors). Standardisation of field and laboratory protocols across water
management authorities is required to capitalise on the value of large monitoring datasets. Finally, effective
communication of the results of river health assessment to politicians and the wider public is important. Some
of these critical elements are already in place in New Zealand, but for others more effort is required.
To improve the current practice of river health assessment and management in New Zealand,
we recommend the following actions:
Review Encourage Explore Empower Develop
policy to ensure that further development further development of citizens by giving them and embrace new
there is clear recognition and use of kaupapa report cards and support the tools to collect technologies that
that a healthy river Māori frameworks for on-line reporting of river information themselves will provide better
requires more than just assessing river condition health information to and contribute to a information on river
good water quality. to help recognise enable communities better understanding health and help
and incorporate the to better understand if of river health in New ensure that our rivers
interconnections their objectives for river Zealand. maintain or reach the
between ecological health are being met ecological structure
and human use values. and what can be done if and functioning that
This will enable better they aren’t. is needed to support
linkage between society’s uses and values
indicators of river of fresh water.
health and freshwater
values expected by the
community.
OCTOBER 2018 REPORT NO. 3035 | CAWTHRON INSTITUTE 71. INTRODUCTION
New Zealand’s freshwater ecosystems
are under pressure.
New Zealanders are passionate about our freshwaters. The National Policy Statement for Freshwater Management
For many people the ability to swim, fish and gather food 2014 (updated 2017) (NPS-FM) requires regional councils and
from our freshwater systems is an iconic part of being a New communities to define freshwater values, identify specific
Zealander. Our rivers, lakes, aquifers and wetlands are home freshwater objectives and set limits and implement plans to
to an abundance of life, some found nowhere else on the achieve them. The NPS-FM identifies ecosystem health and
planet. Our freshwaters are also vital to New Zealand’s tourism human health for recreation as compulsory national values
industry, and our primary production and energy sectors. that all freshwaters around the country need to be managed
However, New Zealand’s freshwater ecosystems are under for. This means every river has to eventually at least meet or
pressure. Intensive land use, urban development and aging surpass the national bottom line when it comes to ecosystem
wastewater infrastructure, water abstraction, invasive species health. Furthermore, the NPS-FM states that ecosystem health
and climate change are damaging the health of our freshwater has to be maintained in rivers where community values are
ecosystems. (Gluckman 2017; Ministry for the Environment currently supported, or improved where community values
(MfE) and Statistics NZ 2017). are not being met.
There is considerable public interest and concern relating While most people would agree this is a worthy goal, there
to these threats, with water-related concerns consistently is considerable concern and confusion about what is really
perceived by New Zealanders as the most important meant by ecosystem health and whether the tools and
environmental issue facing the country (Hughey et al. 2016). approaches being used to measure it are appropriate.
To promote more informed debate on the topic, this report:
Presents a science-based Describes how a range of Considers international Demonstrates that a
review of the concept indicators of river health trends in the healthy river requires
of ecosystem health in are currently used in development and use of more than just good
rivers. freshwater policy and freshwater indicators. water quality, it needs
management in New to be a fully functioning
Zealand. ecosystem.
8 CAWTHRON INSTITUTE | REPORT NO. 3035 OCTOBER 20182. WHAT IS A HEALTHY RIVER?
The concept of a healthy river appears intuitive to most
people and is useful for engaging with the public.
(Fairweather 1999; Karr 1999).
At a Cawthron Institute open day about freshwater ecosystem
health in 2017, about 450 members of the public were invited
to identify what a healthy freshwater ecosystem means
to them. As reported in formal studies of this question (e.g.
Pinto et al. 2012), many of the respondents expect healthy
freshwater systems to provide for human use values (e.g.
swimming, fishing, drinking, boating, family time, good food),
while some named ecological properties as key aspects (e.g.
safe habitat for native species, thriving life, clear water).
Interestingly, several people struggled to define what a
healthy river should be. Perhaps they understood that, at
its heart, ecosystem health is a complex concept and not
easily defined. It is important to think carefully about how we
define the ‘health’ of rivers, especially when developing and
calibrating tools to help communities determine whether a
freshwater body meets an ecosystem health goal set by the
community. To assist in this process, we consider scientific and
social attributes that contribute to this definition.
Perhaps they understood that, at its heart,
ecosystem health is a complex concept
and not easily defined.
OCTOBER 2018 REPORT NO. 3035 | CAWTHRON INSTITUTE 9A MODEL OF RIVER HEALTH
The concept of river ecosystem health has been described This model of ecosystem health incorporates the ecological
and debated in the scientific literature for decades. integrity of the ecosystem (what lives there and the ecological
(Rapport et al. 1998; Norris & Thoms 1999; Lackey 2001; functions they perform) along with society’s expectations as
Vugteveen et al. 2006; Elosegi et al. 2017). critical parts of the concept (Boulton 1999; Lackey 2001). This
model, as shown in Figure 1, is of an ecosystem that provides
Although there is no universally-agreed definition, Meyer for the needs of all associated organisms (including humans)
(1997) usefully defined a healthy river as an ecosystem that is and that can bounce back from natural disturbances. It is
sustainable and resilient, maintaining its ecological structure important to note that, under this definition, human use of
and function over time while continuing to meet societal rivers doesn’t automatically mean that ecosystem health is
needs and expectations. being degraded.
Ecological integrity:
capacity to support/maintain natural
and balanced, integrative, adaptive Ecological
biologic system. values
Services:
cleansing/detoxifying water; producing
Resilience to stress: fish and shellfish; providing aesthetic
ability to recover to disturbances pleasure; maintaining water supply;
relative to “reference” rivers.
RIVER HEALTH storing/regenerating essential
elements.
Human Goods:
values water supply for irrigation and industry;
clean water for drinking and washing;
environment for recreation and
spiritual renewal.
Figure 1. River ecosystem health is a broad concept incorporating both ecological
values and the human values expected by society (from Boulton 1999).
Some in the scientific community worry about Karr 1999; Lackey 2001). Elosegi et al. (2017) took the analogy
incorporating value judgements along with objective between human health and river health even further and
science in ecosystem health assessments showed how environmental management could benefit from
(Scrimgeour & Wicklum 1996; Lancaster 2000). the robust framework and principles developed over millennia
in medicine.
Ecosystem health is certainly much more than a scientific
concept, but this is not a weakness and actually broadens They suggest that river ‘doctors’ should embrace the strict
its usefulness. By encompassing both science and values, process that medical doctors use to assess and diagnose
ecosystem health implies the need for ecologists and human patients, strive for a better mechanistic understanding
environmental managers to engage with the public to of the causes of ecosystem impairment, and ensure that the
determine what society’s goals are for ecosystems and the effectiveness of treatments are monitored and reported on,
feasibility of achieving them (Meyer 1997; Rapport et al. 1998; enabling learning and better practice in the future.
10 CAWTHRON INSTITUTE | REPORT NO. 3035 OCTOBER 2018ECOSYSTEM INTEGRITY
As we focus on the top half of the river health model shown The way ecological integrity is often described requires it to
in Figure 1, we note that some scientists have used the terms be assessed using measures of organisation (the diversity
ecosystem health and ecosystem integrity interchangeably of organisms present and the interactions between them),
(Karr 1992), while others have suggested significant distinctions vigour (the activity and productivity of the system) and
between them (Karr 1995; Meyer 1997; Oliveria & Cortes 2006). resilience (the system’s ability to withstand or bounce
Ecological integrity is generally considered a more objective back from stress) (Schaeffer et al. 1988; Rapport et al. 1998).
concept and has been defined as the ability to support and Schallenberg et al. 2011’s definition of ecosystem integrity
maintain a balanced, integrated, adaptive biologic system identified four key components; nativeness (the degree of
having the full range of elements and processes expected in dominance by indigenous flora and fauna), pristineness
the natural habitat of a region (Karr 1996). In New Zealand, a (degree of departure from an appropriate reference condition
review of approaches for assessing ecological integrity defined and including connectivity), diversity (the number of taxa
it as the degree to which the physical, chemical and biological and the distribution of individuals among taxa) and resilience
components (including composition, structure and process) of (long-term viability).
an ecosystem and their relationships are present, functioning
and maintained close to a reference condition reflecting The big difference between health and integrity is that
negligible or minimal anthropogenic impacts (Schallenberg human use values are not incorporated within the
et al. 2011). ‘Reference condition’ is an important concept and ecosystem integrity concept, but are an important part of
we will refer to it throughout this report. The term is used to the health concept. Therefore, ecological integrity is one
describe the standard or benchmark against which current part of a healthy ecosystem but not the only part.
condition is compared. Depending on how it is determined it
is a measure of condition that may be “minimally disturbed “,
“historical “, “least disturbed “ or “best attainable “.
THE SOCIAL ASPECT OF ECOLOGICAL INTEGRITY
Several assumptions, inherent in these definitions of Landis 1998). As a result, some ecologists are calling for a less
ecosystem integrity, reflect societal values (Lackey 2001). emotive and more tolerant view of introduced species that
perform benefits within disturbed ecosystems (e.g. riparian
For example, natural systems with a dominance of native plants that provide erosion control and native bird habitat)
species are often considered healthier than human-altered (e.g. Davis et al. 2011).
systems or those affected by introduced species (Lélé &
Norgaard 1996). Similarly, biological diversity is widely seen as a It is also often assumed that natural ecosystems are balanced
positive element of a healthy ecosystem, one that contributes and stable over time—the balance of nature concept—
to the resilience and stability of the ecosystem (Ives & and that this is should be a management goal. However,
Carpenter 2007). Conversely, additional diversity associated ecosystems are typically in a state of flux due to both natural
with introduced or invasive species is not considered and human influences and not approaching a balanced
favourable, although others have used this as an example of equilibrium (Botkin 1992; Belovsky 2002; Scarsbrook 2002).
where scientists incorporate their own beliefs, morals and Therefore, the desire to maintain ecosystems in a static state
values into the properties of healthy ecosystems (Kapustka & may not be ecologically appropriate over long time frames.
OCTOBER 2018 REPORT NO. 3035 | CAWTHRON INSTITUTE 11RIVER HEALTH AND HUMAN VALUES
As mentioned earlier, a healthy river provides for society’s discussions and goal setting are required. Should local people
needs and expectations. living in a river catchment have sole rights to make decisions
on the expectations of ‘their’ waterway? Or should others that
However, society as a whole does not have a single set of visit the waterway occasionally or just value the existence of
expectations. Furthermore, different sectors of society often special characteristics of a particular waterway also have input
have conflicting goals. For example, one person may seek to to decision making?
have sufficient water available for irrigating their land, while
another may demand that water is left in the river to maintain The challenges inherent within these questions are key
the intrinsic ecological values. drivers for environmental management being described
as a ‘wicked problem’ (Brown et al. 2010); that is, a problem
The question of who is an appropriate stakeholder to be that is so socially complex that no single static solution will
included in goal setting and decision making is also worth suit everybody involved. Resolving such problems requires
considering. The health of the lower reaches of a river is collective action from different sectors of the community to
profoundly linked with activities occurring upstream, possibly define the problem and seek solutions that are usually case-
a considerable distance away. Therefore, catchment-scale specific (Brown et al. 2010).
Resolving such problems requires collective
action from different sectors of the community to
define the problem and seek solutions...
HEALTHY ECOSYSTEMS PROVIDE SERVICES TO SOCIETY
Related to the concept of ecosystem health is the idea of estimated as being many times the annual global gross
ecosystem ‘services’ (lower right in Figure 1). This idea refers to national product (Costanza et al. 2014), which demonstrates
the benefits people obtain from ecosystems and has attracted how much we rely on these ecosystem services. As well as
increasing attention over the last few decades (Millennium having significant intrinsic ecological values, river ecosystems
Ecosystem Assessment 2005). The annual economic value of provide a wide range of goods and services to society such as
all ecological goods and services across the globe has been (Hanna et al. 2018):
• Erosion control • Nutrient cycling
• Waste treatment • Raw materials
• Food production • Cultural needs
• Water regulation and supply • Recreation
Many of these goods and services are reliant on healthy river
ecosystems and, by definition, continued provision of these
services is fundamental to whether river ecosystems are
considered to be healthy.
12 CAWTHRON INSTITUTE | REPORT NO. 3035 OCTOBER 2018ECOSYSTEM HEALTH
AND NEW ZEALAND LEGISLATION
In New Zealand, the Resource Management Act 1991 It is interesting to note that the definition of ecosystem
promotes sustainable management where the use of natural health in the NPS-FM more closely reflects definitions of
and physical resources is enabled while safeguarding the life- ecosystem integrity in the scientific literature than ecosystem
supporting capacity of air, water, soil and ecosystems (RMA health. Societal values associated with freshwater are listed
Section 5, 2b). Life-supporting capacity is not specifically separately in the NPS-FM. These include: human health for
defined in the Act and thus there is no guidance on what recreation; mahinga kai; fishing; irrigation, cultivation and food
level of life-supporting capacity is required. Even a severely production; animal drinking water; wai tapu; domestic water
compromised ecosystem will have the capacity to support supply; commercial and industrial use; hydro-electric power
some life, but the intention of the Act was to prevent the generation; transport and tauranga waka. It is also worth
degradation of ecosystems. noting that the reference to ‘resilience to change’ in the NPS-
FM definition presumably refers only to systems in a current
The National Policy Statement for Freshwater Management healthy state and resilient to any degradation. Resilience
(2014) is one of a number of statements issued under section to any improvements for a degraded system is clearly not a
52(2) of the Resource Management Act 1991, giving objectives desirable characteristic.
and policies for matters of national significance. The NPS-FM
(MfE 2017) recognises Te Mana o te Wai (the integrated and
holistic well-being of a freshwater body) as an integral part
of freshwater management. Upholding Te Mana o te Wai SUMMARY
acknowledges and protects the mauri of the water. Doing
so ensures that the health of the environment (Te Hauora o There is widespread recognition of the value of the
te Taiao), the health of the water body (Te Hauora o te Wai) ecosystem health concept.
and the health of the people (Te Hauora o te Tangata) are all It is intuitively understood by most people and implies
provided for. the need for multiple groups with an interest in
freshwater to collectively determine society’s goals for
The NPS-FM goes beyond the concept of life supporting ecosystems and how they can be achieved. There is some
capacity and identifies ecosystem health as a compulsory overlap among ecosystem health and related concepts
national value that all freshwaters around the country need to such as ecological integrity, ecosystem services and life-
be managed for. It defines ecosystem health as: supporting capacity. Similarly, to uphold Te Mana o te
Wai requires that in using water you must also provide
“The freshwater management unit supports a healthy for health of the environment (Te Hauora o te Taiao), the
ecosystem appropriate to that freshwater body type (river, health of the water body (Te Hauora o te Wai) and the
lake, wetland, or aquifer). In a healthy freshwater ecosystem health of the people (Te Hauora o te Tangata).
ecological processes are maintained, there is a range and
diversity of indigenous flora and fauna, and there is resilience The definition of ecosystem health in the NPS-FM is
to change. Matters to take into account for a healthy freshwater narrower than many in the scientific literature, focussing
ecosystem include the management of adverse effects on flora primarily on ecological values with human use values
and fauna of contaminants, changes in freshwater chemistry, being addressed separately. This makes the NPS-FM
excessive nutrients, algal blooms, high sediment levels, high definition more similar to the scientific concept of
temperatures, low oxygen, invasive species, and changes in ecological integrity. The remainder of this report will
flow regime. Other matters to take into account include the discuss ecosystem health as defined in the NPS-FM, but
essential habitat needs of flora and fauna and the connections recognises that human use values are also important and
between water bodies.” need joint consideration.
OCTOBER 2018 REPORT NO. 3035 | CAWTHRON INSTITUTE 133. INDICATORS OF RIVER
ECOSYSTEM HEALTH
... a full understanding of river ecosystem health incorporates much more
than just measurements of the quality of the water...
Flow Regime Physical Habitat Energy and
Structure Nutrient Dynamics
• Flow Regulation • Sinuosity • Organic Enrichment
• Velocity • Instream Cover • Season Cycles
• Volume • Substrate • Sunlight and Shading
• Flow Extremes • Gradient • Organic Matter input
• Rainfall and Runoff • Bank Stability (e.g. tree leaves)
• Abstraction • Riparian Vegetation • Algal Growth
• Groundwater • Fine Sediment
• Widths/Depths
ECOLOGICAL
INTEGRITY OF WATER
RESOURCES
Water Quality Biotic Community
Structure and Dynamics
• Pesticides • Predation/Competition
• Dissolved Oxygen • Macroinvertebrates
• Suspended Sediment • Microorganisms
• Dissolved Organic Matter • Exotic Species
• Conductivity • Disease
• Tempurature • Macrophytes
• Nutrients • Fish
• pH • Harvest
• Algae
Figure 2. The five main factors that make up aquatic ecosystem integrity, all of
which are frequently altered by human activities (modified from Karr & Chu 2000).
14 CAWTHRON INSTITUTE | REPORT NO. 3035 OCTOBER 2018CLASSES OF INDICATORS
Freshwater monitoring programmes around the world assessment of ecosystem integrity and health. The value of
initially used chemical measures of water quality to infer measuring ecosystem processes (its physiology) in ecosystem
the ecological health of these ecosystems1. health assessment is also increasingly being recognised (Bunn
et al. 1999; Gessner & Chauvet 2002; Young et al. 2008, 2016).
However, a full understanding of river ecosystem health Such measurements of ecosystem function (e.g. the rates
incorporates much more than just measurements of the of primary production, organic matter decomposition and
quality of the water, as shown in Figure 2. The importance nutrient cycling) can complement information from other
of incorporating a biological component to ecosystem indicators by providing insight on the vigour and energy
health assessment is now well recognised, since the aquatic sources for ecosystems (Young & Collier 2009; Wagenhoff et
organisms present at a site reflect the cumulative effects of al. 2017; Figure 2), and also provide information on the causes
environmental condition (Karr & Chu 2000; Boothroyd & Stark and potential treatment of ecosystem health issues, rather
2000; Figure 2). Assessment of the biological structure of an than just identifying problems (Palmer & Febria 2012; Elosegi
ecosystem (its anatomy) is also just one part of the overall et al. 2017).
Ideally a good indicator will be accurate, easy to measure, repeatable, sensitive to
impacts, robust to natural variability, inexpensive and provide credible information
that can be easily understood (Boulton 1999). Unfortunately, many of these criteria are
mutually exclusive. An indicator that is highly sensitive is also likely to respond to natural
variability. Similarly, an inexpensive and simple indicator may be less likely to provide
accurate and credible information.
Cairns & McCormick (1992) identified three purposes of composition and water depth/velocity are strong drivers of
ecological indicators for assessing ecosystem health: river condition at a scale of less than tens of metres, whereas
early warning indicators that point out impending decline indicators like water temperature, dissolved oxygen, water
in health; compliance indicators that can measure deviations clarity and nutrient concentrations will reflect conditions
from acceptable limits; and diagnostic indicators that can help at a reach (i.e. hundreds of metres) or sub-catchment (i.e.
determine the causes of poor health. Ideally a good indicator kilometres) scale. Other indicators such as habitat connectivity
will be accurate, easy to measure, repeatable, sensitive to need to be recognised at an even larger scale.
impacts, robust to natural variability, inexpensive and provide
credible information that can be easily understood (Boulton For example, the presence of a fish migration barrier in
1999). Unfortunately, many of these criteria are mutually one part of a river catchment may strongly influence the
exclusive. An indicator that is highly sensitive is also likely to abundance and types of fish present at a site many hundreds
respond to natural variability. Similarly, an inexpensive and of kilometres away. Time scale is also important. For instance,
simple indicator may be less likely to provide accurate and mean annual river flow may have little influence on ecosystem
credible information. health at a given site, because the lowest flow that is typically
reached in a year is often a habitat bottleneck that controls the
Ecosystem heath indicators also need to be measured at space available for animals in an ecosystem, such as a river’s
an appropriate spatial scale. For example, shade, riverbed fish population (Jowett et al. 2008).
1. Indeed, water quality itself is sometimes defined more broadly to include some indicators of ecosystem health.
OCTOBER 2018 REPORT NO. 3035 | CAWTHRON INSTITUTE 15THE NEED FOR REFERENCE CONDITION
OR OTHER STANDARDS
Most definitions of ecosystem health gauge assessments minimally disturbed state for some particular water body
against what is expected in the natural habitat of the types (Norris & Thoms 1999). In these situations, historical
region (Karr 1996), records, predictive models and expert opinion can sometimes
be used to estimate reference conditions (Parsons & Norris
or to conditions close to a reference condition (Schallenberg 1996; Clapcott et al. 2016).
et al. 2011). The NPS-FM’s ecosystem health goal is that
freshwater management units should support healthy An alternative approach that is often applied to assessing
ecosystems appropriate to that freshwater body type (river, water quality with respect to ecosystem health is the use of
lake, wetland, aquifer). Therefore, to determine the state of an standards. Water quality standards are usually defined based
ecosystem, benchmarks must be set to define the preferred on a particular ecological effect or value, and represent the
conditions while taking into account the natural climatic, threshold between what is deemed acceptable and what is
geological and biogeographic context. If possible, the unacceptable. For example, a standard could be the level of
preferred approach for determining a benchmark to compare a particular chemical that will only have a minimal effect on
an ecosystem against is to select minimally disturbed aquatic life. Standards are set to provide guidance on levels
neighbouring reference sites which represent the ecosystem of a water quality parameter that are acceptable, irrespective
state least disturbed by humans for a particular area. However, of what the levels of that parameter would be naturally. If the
throughout history humans have been interacting with and water quality parameter meets the standard then conditions
changing waterways around the world. Hence, it is impossible are deemed suitable, but if the standard is not met then action
to find sites that entirely represent a pre-human state or even is required.
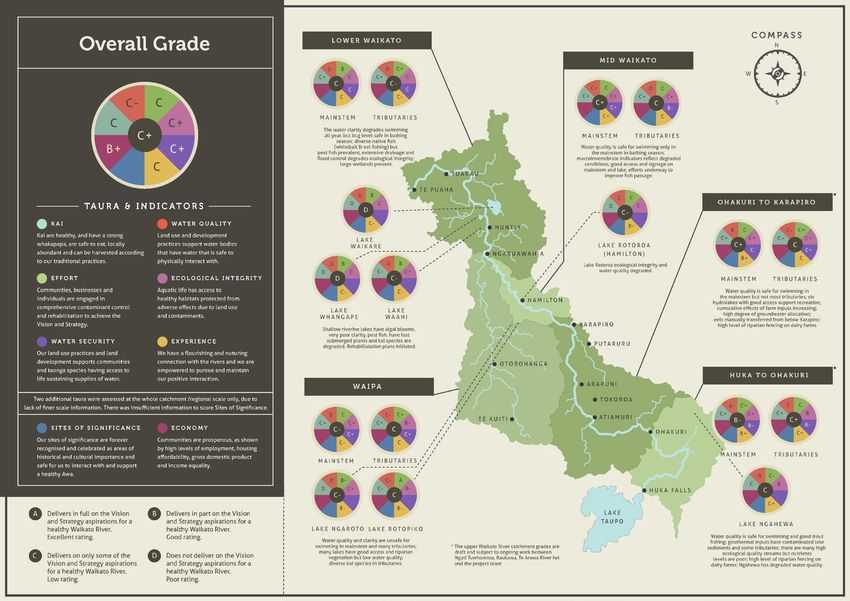
COMBINING INDICATORS FOR REPORTING
Managers want simple tools to report on the state and
trajectory of river ecosystem health. parts that contribute to the health status of a river are easily
unpicked. To address this issue, ‘report cards’ are an increasingly
However, many indicators are needed to capture the key popular approach for aggregating a wide variety of indicators
ecological components of river ecosystem health, including into a simplified message on the health and well-being of a
physical habitat structure, energy sources, flow regime, water catchment and its people. One New Zealand example is the
quality, biological community composition and ecological Waikato River Report Card (Williamson et al. 2016; Figure 3).
processes (Figure 2). A multimetric index (one that uses It includes ecological components along with cultural and
many measures) that combines information from all these economic aspects based on bicultural values encapsulated
components into a single value would appeal to resource in Te Ture Whaimana—the Vision and Strategy for restoration
managers because it would make reporting much simpler. of the Waikato River. It uses eight Taura (Māori for ‘strands
Multimetric indices have been developed and used both of a rope’, i.e., kai (food), water security, ecological integrity,
overseas and in New Zealand, however, most of the these still experience, sites of significance, economy, water quality, sites
only use just one ecological aspect (e.g. macroinvertebrates of significance) in an A to D grading system calculated from
(visible insects, worms, snails and the like) (Karr 1999) or fish 64 indicators. Grades are assigned by Taura and overall at two
(Joy & Death 2004)). levels of spatial resolution; (i) whole catchment and (ii) report
card unit (similar to NPS-FM Freshwater Management Units).
Care must be taken when aggregating indicators into a single More detailed and specific information is available within each
score to ensure that information isn’t lost and the component part of the catchment, or within the grading for each Taura.
16 CAWTHRON INSTITUTE | REPORT NO. 3035 OCTOBER 2018Figure 3. The Waikato River Report Card showing the overall grade and grades for different parts of the river,
each assessed for the eight Taura (accessed from http://versite.co.nz/~2016/19099/#2).
RIVER HEALTH INDICATORS USED IN NEW ZEALAND
A wide range of scientific indicators, relevant to ecosystem o Turanganui a Kiwa and Gisborne District Council to report
health assessment, are currently used in New Zealand the current state of waterways (https://www.mauricompass.
(Table 1). Some of these indicators are legislated reporting com/).
requirements as set out in the NPS-FM, while others are
measured but are not compulsory for ecosystem reporting Scientific indicators are primarily used to assess the state of
(Table 1). Macroinvertebrate monitoring is now required in the river ecosystem health at local, regional or national scales and
NPS-FM. However, the Macroinvertebrate Community Index also to determine if there are any trends over time. Examples
(measuring the type and abundance of macroinvertebrates of these applications are the recent national reports on water
in the stream or river) on its own, or along with a few water quality in New Zealand (Gluckman 2017; MfE/Statistics NZ
quality parameters, will be insufficient to robustly determine if 2017) and the information presented on the Land, Air Water
we are meeting the compulsory ecosystem health value. Aotearoa website (www.lawa.org.nz). Regional councils also
regularly prepare State of the Environment reports for their
There are also several kaupapa Māori approaches for assessing region. In all these reporting mechanisms, current ecological
aspects related to river ecosystem health. These include the health can be compared with relevant guidelines, standards or
Waikato River Report Card mentioned above (Williamson et al. limits to determine if specified objectives are being met and if
2016), the Wai Ora Wai Māori Framework which was developed conditions are changing over time. Comparisons of indicator
specifically for Waikato-Tainui (Awatere et al. 2017), the Cultural scores among similar water bodies can also be informative
Health Index which was developed by Ngai Tahu to assess river and provide context for the status of a particular site. At a
values of cultural importance (Tipa & Teirney 2006), the Mauri- more localised scale, indicators can be used to determine if
o-meter which is a decision making framework that combines specific activities such as discharges, habitat alterations, water
a stakeholder assessment of worldviews (Morgan 2006), and abstractions or stream rehabilitation initiatives are altering
the Mauri Compass which is a framework used by Te Runanga ecosystem health for better or worse.
OCTOBER 2018 REPORT NO. 3035 | CAWTHRON INSTITUTE 17INDICATOR TYPE INDICATOR
Physical habitat Gradient Table 1.
structure Channel morphology Measures that contribute to an
Substrate composition, deposited fine sediment overall picture of the ecological
Instream cover for biota components of river ecosystem
Riparian vegetation, shading
health. Measures specified for
Floodplain connectivity
rivers within the attribute tables
Downstream connectivity to the sea
of the NPS-FM are in bold.
Sinuosity
Indicators currently measured in
Water Quality Water temperature some regional council monitoring
Dissolved oxygen2 programmes are italicised.
Conductivity
pH
Nutrient concentrations
Water clarity, turbidity, suspended solids
Toxic contaminants3 (e.g. ammonia, nitrate,
heavy metals, hydrocarbons, pharmaceuticals)
Faecal indicator bacteria (E. coli)4
Flow Regime Allocated flow
Mean annual low flow
Median flow, mean flow
Flow variability
Annual maximum flood
Flood frequency
Footnotes:
Ecosystem Gross primary productivity, eutrophication
2. Dissolved oxygen concentrations only
Function Ecosystem respiration below discharges are considered in the
Organic matter decomposition NPS-FM.
Nutrient cycling
3. The only toxic contaminants specifically
referred to in the NPS-FM are nitrate
Biology Microbes (community composition) and ammonia.
Periphyton (cover, biomass and community
composition) 4. E. coli is primarily measured as an
indicator for drinking water, cultural
Cyanobacteria (presence and cover)
or recreational values, not specifically
Aquatic plants ecosystem health.
Macroinvertebrates (e.g. MCI, EPT Richness)5
Fish (presence, abundance, population structure, 5. The NPS-FM requires monitoring of
macroinvertebrate communities using
health)
the MCI score and investigations of the
Food web interactions cause of any declining trends or scores
Exotic species below 80.
18 CAWTHRON INSTITUTE | REPORT NO. 3035 OCTOBER 2018Ecosystem health indicators are also used to identify trends ... indicators are also used to identify
that can signal the need for policy development to address
trends that can signal the need for
issues, or measure the effectiveness of existing policies.
Evidence for a positive or negative trend can be provided policy development to address issues,
through statistical trend analysis. However, there are some or measure the effectiveness of
caveats to trend analysis as the statistical power to detect a
existing policies.
trend depends on data record length, the frequency that
samples are collected and the natural variability of the indicator
(often referred to as ‘data noise’). For many types of ecosystem
indicators, long sampling records (of at least five years) with
frequent sampling (e.g. monthly) are required (McBride et al.
SUMMARY
2014; Larned et al. 2016). This means that it may take many
years of data collection to statistically detect a positive trend River health indicators ideally provide an early
in response to efforts to improve ecosystem health, making warning of impending concerns, determine
it hard to prove the effectiveness of new policies or on the compliance with acceptable limits and help
ground rehabilitation efforts by councils or local communities. diagnose the causes of poor health.
Similarly, it may take years to statistically detect negative
trends in ecosystem health, leading to a considerable lag time A single indicator will never be able to meet all these
before any restorative actions can be put in place. purposes. Therefore, a complete measure of river health
requires scientific indicators of biological community
Ideally, indicators will help inform the diagnosis of any composition, ecosystem processes/functioning, flow
causes of poor ecosystem health. However, most indicators regime, and physical habitat structure, as well as the
of ecosystem health are affected by a broad range of factors water quality parameters (measures) which have
and therefore it is difficult to determine the cause of impaired dominated river assessments in the past. The scale of
ecosystem condition and identify suitable treatment options. indicator measurement is important, both spatially
For example, the Macroinvertebrate Community Index (MCI) and over time. Interpretation of indicator results
widely used in New Zealand as an indicator of ecosystem often requires knowledge of expected reference
health is potentially affected by organic enrichment, sediment condition, so assessments can take account of natural
deposition, water temperature, algal proliferation, dissolved variation in climate, geology and species distributions.
oxygen concentrations, pH and physical habitat changes Measurements at reference sites or information from
(Clapcott et al. 2017). Therefore, it is difficult to attribute historical records, predictive models or expert opinion
any change in MCI at a site to a particular cause. There have can be used to estimate reference condition. Indicators
been efforts to develop macroinvertebrate indicators that can provide a picture of current river health and also
respond more strongly to specific environmental stressors identify if conditions are improving or degrading.
(e.g. acid mining MCI in Gray & Harding 2012; sediment and Reporting of river health needs to be as simple as
algal blooms in Clapcott et al. 2017) but more effort is needed possible, but capture all the key ecological components
to scientifically validate their diagnostic power. Similarly, the including physical habitat structure, flow regime,
absence of a type of fish (e.g. inanga) from a particular stream water quality, biological community composition and
where they have been found previously may be due to ecological processes. Multimetric indices combining
downstream migration barriers, inadequate physical habitat, information from all these elements can be useful for
an unsuitable flow regime, poor water quality, a lack of food, or reporting on state and trends, but must ensure that
any combination of these factors (Jellyman & Harding 2012). not too much information is lost in the aggregation
Professional judgement by a freshwater ecologist is typically process. Report cards are becoming an increasingly
still required to identify cause and effect relationships for popular approach to presenting information on the
specific freshwater issues. health of rivers.
OCTOBER 2018 REPORT NO. 3035 | CAWTHRON INSTITUTE 194. WHAT’S HAPPENING
ELSEWHERE?
Scientists from around the world (particularly Europe, North
America, Australia and New Zealand) have contributed to
discussion and research relating to the concept of river
ecosystem health.
There is a reasonable level of international consistency in how the
concept is perceived. However, differences do arise in the way the
concept is applied, mainly because of differences in legislation. The
approaches used in some other parts of the world are presented
and discussed below to identify any potential lessons for New
Zealand.
20 CAWTHRON INSTITUTE | REPORT NO. 3035 OCTOBER 2018THE DIRECTIVE APPROACH TO
ECOSYSTEM HEALTH ASSESSMENT
EUROPE
The Directive requires that ecological quality of river
The European Water Framework Directive (from now
ecosystems is measured using biological metrics
on referred to as the Directive) is recognised as one of
(measures) based on abundance and community
the most ambitious and substantial pieces of European
composition of a range of organism groups, including
environmental legislation (Voulvoulis et al. 2017).
benthic macroinvertebrates, fish, and aquatic plants
(macrophytes, algae and phytoplankton).
Since it became effective in 2000, all member states of the
European Union (EU) were tasked to manage their freshwater
The most widely adopted methods use macroinvertebrates,
ecosystems according to this legislation. Here we present the
employing metrics of sensitivity (to forms of pollution)
Directive’s fundamental objectives, the framework itself and
and ecological traits (how organisms respond to their
how well it has achieved its objectives so far.
environment) (Birk et al. 2012). Information on pollutants,
physico-chemical water quality (e.g. temperature, oxygen,
pH, nutrient concentrations) as well as the flow regime and
FUNDAMENTAL OBJECTIVES OF THE physical habitat structure are also required for the assessment.
EU WATER FRAMEWORK DIRECTIVE
Ecosystem health assessment is based on five classes of
The Directive aims to protect and enhance the health of ‘high, ‘good’, ‘moderate’, ‘poor’ and ‘bad’. These classes reflect
aquatic ecosystems while successfully maintaining social and the degree of change from reference condition. Good status
economic systems (Antunes et al. 2016). All European Union is defined as a ‘slight’ deviation from reference conditions
member states were tasked to achieve at least ‘good ecological (European Commission 2003). Natural differences in reference
status’ for all ‘natural’ water bodies by 2015 and at the latest condition are addressed using stream groupings and
by 2027. However, it is recognised that good ecological establishment of type-specific reference conditions. This allows
status cannot be achieved within some ‘heavily modified comparison of like with like and ultimately enables better
water bodies’ without significantly affecting an existing water precision for ecological assessment. Ecological assessment
use of social or economic importance. Actions required to is initially based on each different organism group, along
reduce pressure and restore aquatic ecosystems have to be with supporting information on pollutants, water quality,
implemented through river basin management plans. Like the flow regime and habitat structure. The results are combined
‘maintain and improve’ elements within New Zealand’s NPS- using a ‘one out, all out’ principle where the lowest score of
FM, deterioration of ecological status is generally prohibited in the individual biological quality elements defines the overall
the Directive (Hering et al. 2010). ecological status.
OCTOBER 2018 REPORT NO. 3035 | CAWTHRON INSTITUTE 21WHAT HAS BEEN ACHIEVED AND WHAT
ARE THE SHORTCOMINGS?
Overall, the Directive has led to fundamental change in
management objectives from a focus on pollution control to
safeguarding ecosystem integrity (Hering et al. 2010).
Traditionally, the focus of monitoring and assessment was mainly on
physical and chemical parameters (e.g. nutrients, organic pollution
and other pollutants), with biological methods only used by some
member states to assess organic pollution (Arle et al. 2016).
Since implementation of the Directive’s monitoring requirements,
biological monitoring has become the primary means to assess
ecological status, based on a range of organism groups and aimed
at detecting the effects of multiple pressures. For example, a review
showed that almost half of the assessment systems targeted
acidification, eutrophication, organic pollution, heavy metals and
organic contaminants (Hering et al. 2010). Other frequently targeted
pressures included general degradation, flow regime changes,
and habitat destruction (Hering et al. 2010). Hence, water status
assessment has become much more holistic and allows pressure-
specific assessment (Arle et al. 2016). Major improvements have also
been made with respect to water planning. Water management
plans are drafted for entire catchments irrespective of administrative
borders (Hering et al. 2010).
The Directive has now been implemented in several member states
and data have now been collected over many years. This allows
assessment of how well the approach is working and if the goal
of good ecological status in most water bodies has been achieved.
Fifteen years after the Directive was introduced, 47% of the surface
water bodies within the EU have not reached good ecological
status, raising the question of the Directive’s effectiveness as a
policy tool (Voulvoulis et al. 2017). The unrealistic timeframes to
reach good ecological status is a common criticism of the Directive.
Some authors estimated average recovery times of 10-20 years
for a water body (Hering et al. 2010). Recovery, however, could
take much longer given the amount of effort needed to reverse
the large and widely-spread impacts on flow regimes and river/
floodplain geomorphology (Hering et al. 2010).
22 CAWTHRON INSTITUTE | REPORT NO. 3035 OCTOBER 2018Perhaps the greatest value that emerged from the Directive implementation
process itself has been an increased understanding of applied ecology shared
by the people involved including scientists, water managers, policy people,
and to some degree politicians and stakeholders.
A shortcoming of the Directive arises from the requirement in ways that allow continuation of exploitative activities. An
for taxonomy-based metrics to measure ecological status, intercalibration exercise has helped define and standardise
defined as ‘an expression of the quality of the structure and ecological status class boundaries and improved comparability
functioning of aquatic ecosystems associated with surface across some, but not all, national assessment systems (Poikane
waters’. Member states mostly rely on these metrics of et al. 2014).
species composition and abundance (ecosystem structure)
thereby assuming that good structure indicates good The ‘one out, all out’ principle used to combine indicators into
ecological functioning (Birk et al. 2012). Moss (2008) raised a single assessment has also received criticism. It is in line with
concerns that a snapshot inventory of species lists and the precautionary principle to protect the most vulnerable
concentrations of substances cannot indicate whether a river organism group from the most dominant pressure (Hering et
expresses fundamental ecological quality characteristics such al. 2010). However, it is also prone to erroneously classifying a
as efficient recycling of elements, adaptation of organisms water body into a less than good status (type I error), therefore
to natural environmental drivers, resilience to change, and triggering management action even though it is not strictly
connectivity among ecosystems at an appropriate scale. He needed (Hering et al. 2010).
argues that all of these characteristics are required if overall
functioning of an ecosystem is not to be compromised. Finally, the WFD’s integrative and participatory requirements,
which aim at cross-sector cooperation and public involvement,
Another criticism is that management actions tend to focus have also often been poorly implemented, mainly because
on the traditional practice of regulating individual pollutants. it was easier to stick to traditional management approaches
This approach has often failed as it neglects the complexity (Voulvoulis et al. 2017). Perhaps the greatest value that
of how multiple stressors act cumulatively and interactively to emerged from the Directive implementation process itself
affect ecosystem status, nor is it aligned with the Directive’s has been an increased understanding of applied ecology
aspirations of adopting a systems approach (Voulvoulis shared by the people involved including scientists, water
et al. 2017). Furthermore, a lack of clarity in the Directive managers, policy people, and to some degree politicians and
or its guidance documents has led to a lot of margin for stakeholders (Hering et al. 2010). Furthermore, biomonitoring
interpretation and flexibility in how targets are being met methods and data quality have improved with development
(Voulvoulis et al. 2017). Moss (2008) noted that the definition of standardised protocols.
of good ecological status representing a slight deviation
from reference condition has sometimes been interpreted
OCTOBER 2018 REPORT NO. 3035 | CAWTHRON INSTITUTE 23AUSTRALIA
Water management in Australia is complex with important community metrics calculated from taxa observed at a test
roles for local, state and federal authorities in monitoring site against metrics calculated from the predicted taxon list for
and management of healthy aquatic ecosystems. that site under reference condition. The ratio of the observed
vs. predicted metric provides an assessment of the river health
State of the Environment reporting occurs at both the or degradation. The predictive model has been developed
national and state/territory level, although some regional- using data collected from a network of reference sites for each
scale reporting also occurs in many areas throughout state and territory (e.g. Smith et al. 1999; Turak et al. 1999) and
Australia. Increasing emphasis on water use and supply, as for the main habitat types that can be found in Australian
well as contrasting social, environmental and economic river systems. Invertebrate metrics are also used outside
interests, have put pressure on the government to implement of AUSRIVAS. For example, SIGNAL has been developed to
management plans to ensure appropriate water use and respond to a variety of stressors including salinity, turbidity
conservation (Dovers & Hussey 2007). and nutrients and is used for rapid health assessment in
Australia in a similar way to how the MCI is used in New
The traditional focus on water quality has shifted towards Zealand (Chessman 2003).
regular monitoring of biological communities to gauge the
health of river systems (Norris & Thoms 1999). Significant
efforts have been made to develop a standardised approach
to using invertebrate communities to assess river health across
Australia. Australian water management authorities (states Significant efforts have been made
and territories) primarily use the Australian River Assessment to develop a standardised approach
System (AUSRIVAS: Davies 2000; Simpson & Norris 2000) which
to using invertebrate communities to
was developed according to a similar approach developed in
the United Kingdom (Wright et al. 2000). The system is based
assess river health across Australia.
on a model that predicts the occurrence of taxa at a test site
under hypothetical reference condition. Reference condition
in this approach is considered equivalent to ‘minimally
disturbed’ status. AUSRIVAS then compares invertebrate
24 CAWTHRON INSTITUTE | REPORT NO. 3035 OCTOBER 2018... measures of ecosystem function
have been included in the regional
monitoring programme arising from
the South East Queensland Healthy
Waterways Partnership. This programme
provides a holistic view of river
ecosystem health and incorporates
indicators of water quality, ecosystem
processes, nutrient processes,
macroinvertebrates and fish.
The need to incorporate ecosystem processes in river health Several key lessons have been learnt from the South East
assessment has been embraced in Australia (e.g. Bunn & Queensland Healthy Waterways Programme that are
Davies 2000). For example, measures of ecosystem function transferable to other regional programmes (Bunn et al. 2010).
have been included in the regional monitoring programme These include the importance of early inclusion of multiple
arising from the South East Queensland Healthy Waterways stakeholders such as state and local government officers,
Partnership (Bunn et al. 2010). This programme provides scientists, non-government representatives from industry,
a holistic view of river ecosystem health and incorporates fishing, conservation, catchment management, landcare and
indicators of water quality, ecosystem processes, nutrient indigenous groups as well as consultation with the wider
processes, macroinvertebrates and fish (Figure 4; Table 2; see community. This wide community input has provided support
http://hlw.org.au/ for more information). Data from across all and guidance for ongoing development of this particular
indicator groups are averaged to produce a single score for programme. Further key elements were the formulation
each reporting region with an ‘A’ representing conditions close of a clear vision for the future health of the region’s rivers,
to reference condition and an ‘F’ indicating that ecological identification of values and measurable water quality and
condition fails to meet the agreed freshwater objectives for ecosystem health objectives to protect these values, and
the water bodies concerned (Bunn et al. 2010). The outcomes the need for defensible science. Finally, the importance of
and careful selection of indicators should be able to guide effective communication has been emphasised (Bunn et al.
investments in catchment protection and rehabilitation. 2010). In this programme, annual report cards are used to
effectively present the monitoring results to local politicians
and the wider community in a public ceremony.
OCTOBER 2018 REPORT NO. 3035 | CAWTHRON INSTITUTE 25You can also read