Health Workforce Microsimulation Model Documentation - May 2020 Version 5.19.20 - IHS Markit
←
→
Page content transcription
If your browser does not render page correctly, please read the page content below
Health Workforce
Microsimulation Model
Documentation
Version 5.19.20

May 2020

Tim Dall
Executive Director

Ryan Reynolds
Senior Consultant

Ritashree Chakrabarti
Senior Consultant

Will Iacobucci
Senior Consultant

Kari Jones
Associate Director

                        Life Sciences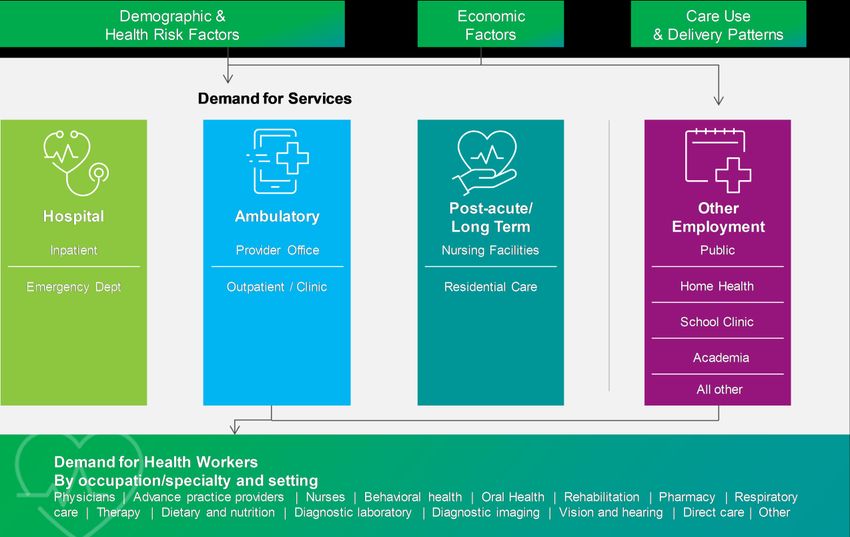
IHS Markit | HWMM Documentation

Contents
Introduction .......................................................................................................................................... 1
Background ............................................................................................................................................ 1
Microsimulation model overview ............................................................................................................. 3
Healthcare Demand Microsimulation Model....................................................................................... 5
Overview ................................................................................................................................................ 6
Population files ....................................................................................................................................... 7
Healthcare use patterns ....................................................................................................................... 10
Health workforce staffing patterns ........................................................................................................ 18
Scenarios ............................................................................................................................................. 19
Input summary ..................................................................................................................................... 21
Health Workforce Supply Model........................................................................................................ 22
Starting supply input files ..................................................................................................................... 22
New entrants ........................................................................................................................................ 23
Hours worked patterns ......................................................................................................................... 24
Labor force participation ....................................................................................................................... 27
Retirement ........................................................................................................................................... 27
Geographic migration ........................................................................................................................... 31
Scenarios ............................................................................................................................................. 32
Workforce implications of strategies to prevent or manage chronic disease ............................... 32
Model validation, strengths, and limitations .................................................................................... 35
Validation activities ............................................................................................................................... 36
Model strengths.................................................................................................................................... 36
Model limitations .................................................................................................................................. 37
References.......................................................................................................................................... 40

© 2020 IHS Markit. All rights reserved.                                          ii                                                                    May 2020
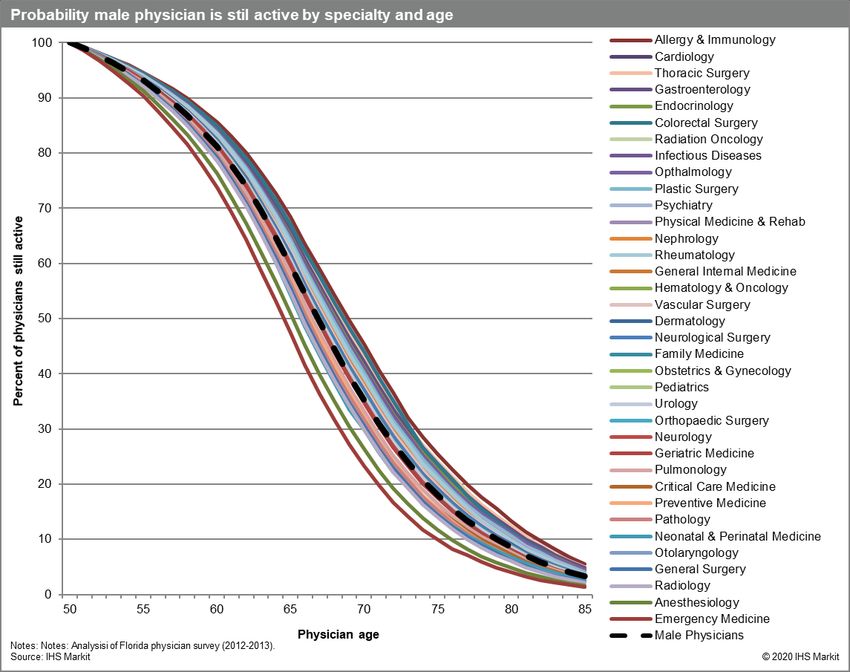
IHS Markit | HWMM Documentation

Exhibits
Exhibit 1 Integrated Health Workforce Microsimulation Model ............................................................ 4
Exhibit 2 Health occupations and specialties modeled........................................................................ 5
Exhibit 3 Schematic of Healthcare Demand Microsimulation Model ................................................... 6
Exhibit 4 Population database mapping algorithm............................................................................... 8
Exhibit 5 Characteristics available for each person in representative population sample .................. 9
Exhibit 6 Sample regressions: adult use of cardiology services ....................................................... 12
Exhibit 7 Patient characteristics on rate of primary care office visits for adults ................................ 13
Exhibit 8 Logistic regression for emergency department consultation .............................................. 15
Exhibit 9 Illustration of probability of emergency department consultation ....................................... 16
Exhibit 10 Average prescriptions per healthcare visit ........................................................................ 17
Exhibit 11 HDMM calibration: physician office visits .......................................................................... 18
Exhibit 12 Demand model input data summary ................................................................................. 22
Exhibit 13 Data sources for number and characteristics of new entrants ......................................... 24
Exhibit 14 OLS regression example: weekly patient care hours for general internal medicine ....... 25
Exhibit 15 OLS regression coefficients predicting weekly hours worked for select occupations ..... 26
Exhibit 16 Odds ratios predicting probability active ........................................................................... 27
Exhibit 17 Physician retirement patterns by age and sex .................................................................. 29
Exhibit 18 Probability male physician is still active by specialty and age ......................................... 30
Exhibit 19 Overview diagram of the Disease Prevention Microsimulation Model ............................. 34
Exhibit 20 Overview diagram of body weight component in DPMM ................................................. 35

© 2020 IHS Markit. All rights reserved.                             iii                                                        May 2020
IHS Markit | HWMM Documentation

Acronyms used in report
 AACN                                     American Association of Colleges of Nursing
 AAPA                                     American Academy of Physician Assistants
 ACS                                      American Community Survey
 ADA                                      American Dental Association
 AMA                                      American Medical Association
 APRN                                     Advanced practice nurse
 BLS                                      Bureau of Labor Statistics
 BRFSS                                    Behavioral Risk Factor Surveillance System
 CDC                                      Centers for Disease Control and Prevention
 CMS                                      Centers for Medicare and Medicaid Services
 DPMM                                     Disease Prevention Microsimulation Model
 HDMM                                     Healthcare Demand Microsimulation Model
 HRSA                                     Health Resources and Services Administration
 HWSM                                     Health Workforce Supply Model
 IPEDS                                    Integrated Postsecondary Education Data System
 LPN/LVN                                  Licensed practical/vocational nurse
 MEPS                                     Medical Expenditure Panel Survey
 NAMCS                                    National Ambulatory Medical Care Survey
 NCLEX                                    National Council Licensure Examination
 NCSBN                                    National Council of State Boards of Nursing
 NCCPA                                    National Commission on Certification of Physician Assistants
 NHAMCS                                   National Hospital Ambulatory Medical Care Survey
 NIS                                      National Inpatient Sample
 NP                                       Nurse practitioner
 NSSRN                                    National Sample Survey of Registered Nurses
 PA                                       Physician assistant
 PCMH                                     Patient centered medical home
 RN                                       Registered nurse
 SNF                                      Skilled Nursing Facility

Note: Earlier versions of this technical documentation are available upon request from tim.dall@ihsmarkit.com.

© 2020 IHS Markit. All rights reserved.                          iv                                      May 2020
IHS Markit | Title of Report

Health Workforce Microsimulation Model Documentation
Version 5.19.2020

Introduction
This report provides technical documentation of the health workforce microsimulation models developed by IHS
Markit, with contributions to model development from the various organizations for which studies have been
conducted using these models. The following section provides background information and an overview of the
workforce models. Next, we document the data, methods, assumptions and inputs for the demand model—
referred to as the Healthcare Demand Microsimulation Model (HDMM)—as well as the supply model—referred
to as the Health Workforce Supply Model (HWSM), and provide a brief overview of the Disease Prevention
Microsimulation Model (DPMM) used to model the workforce implications of strategies to prevent or manage
chronic disease.1 The final section describes work to validate the models, model strengths and limitations, and
areas of ongoing and future research. An appendix contains additional information about model inputs.

We continue to maintain and refine the models as new data and research become available; additionally, we
continue to develop new modules and scenario modeling capabilities. This documentation is intended to help
make the models transparent and provide the opportunity for feedback to improve these models. This report is
updated periodically to reflect refinements to the models and updated data sources. Hence, application of the
model to previous studies might have used earlier data sources than documented in this report.

Background
The workforce models described here are unique in their approach, breadth and complexity. Health workforce
projection models have been used for decades to assist with workforce planning and to assess whether the
workforce is sufficient to meet current and projected future demand (or need) at the local, regional, state, and
national levels. The models described here use a microsimulation approach where individual people (patients and
clinicians) are the unit of analysis. While microsimulation models have been used to study complex policy and
health issues2–6, the models described here are the first broad application of microsimulation modeling for
developing health workforce projections.

Approaches used historically in the U.S. to model the demand for health workers include: (1) convening expert
panels that consider patient epidemiological needs and provider productivity7; (2) extrapolating care use and
delivery patterns from beneficiaries in health maintenance organizations8,9; (3) extrapolating trends based on an
econometric approach of the correlation between provider-to-population and population characteristics and
economic measures10–12; and (4) developing demand models that use historical patterns of healthcare use and
delivery to create detailed provider-to-population ratios.a Such “macro” approaches that model demand at the
population level have limited ability to model policy changes or paradigm shifts in care delivery because most
coverage and treatment decisions are determined by individual patient circumstances. While approaches used
historically for modeling demand vary widely, the approach to supply modeling has been relatively similar across
studies, and models the likely workforce decisions of provider cohorts as they enter and progress through their
careers. Similar modeling approaches have been used across health professions.

Modeling approaches used in the past faced many challenges—data limitations, computing resources, and gaps in
research and understanding of health workforce issues. The use of microsimulation modeling to study the

a
    For example, workforce models used by the Health Resources and Services Administration from the 1990s to approximately 2012.

© 2020 IHS Markit. All rights reserved.                                          1                                      May 2020
IHS Markit | HWMM Documentation
healthcare system was proposed in the early 1970s by Yett and colleagues, but data and computer computational
constraints prevented the full implementation of such a model.13 Improved computing power and wider access to
data and research have enabled development of more sophisticated workforce models that provide more reliable
projections and that can be forward looking in terms of a changing healthcare delivery and policy landscape. The
microsimulation models described here were designed to help address limitations of earlier models.
These microsimulation models have been adapted to model national, state and local area supply and demand for
many organizations. These include:
• Federal Bureau of Health Workforce (to model physicians, advanced practice providers, nurses, oral health
providers, behavioral health providers, and many other health occupations) at the national, state, and urban/rural
levels;14,15
• States—including Arkansas (primary care providers), Florida (physicians), Georgia (nurses, physicians, and
physician assistants), Hawaii (multiple occupations), Maryland (select physician specialties), New York (multiple
occupations), South Carolina (multiple occupations), Texas (multiple occupations), and Vermont (multiple
occupations);16–22
• Trade and professional associations;23–26
• Hospitals and health systems—including market assessment and regional planning, and the workforce implications
of strategies to restructure the healthcare delivery system;27–32 and
• Independent analyses.33,34
DPMM, which models strategies to prevent or manage chronic disease and the resulting implications for
healthcare use and provider demand, has also been used for work with:
• Life sciences companies -- to model burden of disease and strategies to prevent or delay onset of diabetes,
cardiovascular disease and other chronic conditions associated with obesity;35–38 and
• Trade associations and non-profit organizations -- to model burden of chronic disease and strategies to reduce
future burden including lifestyle interventions to promote improved diet and increased physical activity, smoking
cessation programs, improved screening and treatment, and improved medication adherence (to control blood
pressure, cholesterol, and blood glucose levels).39,40
The goals behind development and maintenance of these microsimulation models include:
• Providing the most accurate workforce supply and demand projections possible, as well as timely updates to reflect
the latest data, trends, policies, and research in the field;
• Informing strategies and policy decisions with health workforce implications;
• Integrating supply and demand across many occupations and specialties into a dynamic model; and
• Adapting the models to state and sub-state levels.
Confidential. © 2020 IHS Markit. All rights reserved. 2 May 2020IHS Markit | HWMM Documentation
Microsimulation model overview
To provide maximum flexibility for adapting the model to different populations and to unique supply and demand
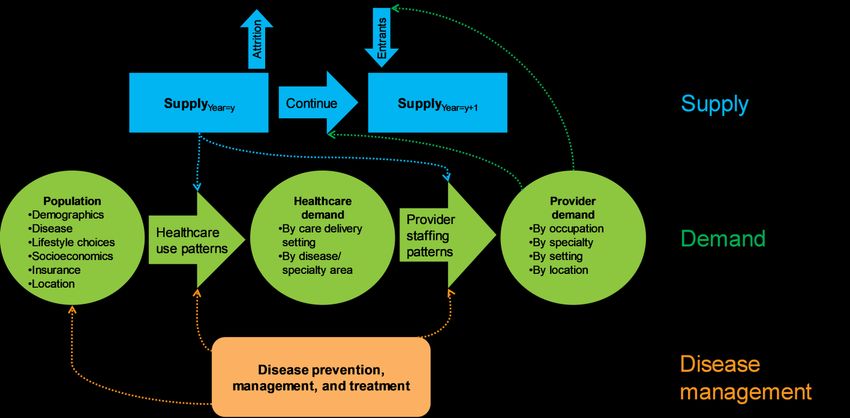
scenarios, these models use a microsimulation approach. As depicted in Exhibit 1, there are three major modeling
components: (1) modeling demand, (2) modeling supply, and (3) modeling disease management and prevention.
Consistent with recommended standards, we developed and validated self-contained modules that describe
different components of the healthcare system.41
• Demand: HDMM has three major components: (a) characteristics of each person in a representative sample of the
current and future population (demographics, socioeconomics, health-related behaviors, presence of chronic
conditions, insurance type/status, etc.), (b) healthcare use patterns that relate patient characteristics to annual use of
healthcare services by delivery setting and medical condition/provider specialty, and (c) staffing patterns that
translate demand for healthcare services into requirements for full time equivalent (FTE) providers by
occupation/specialty and by care delivery setting. Healthcare use and staffing patterns are influenced by changing
demographics and trends in care reimbursement and delivery.
• Supply: HWSM simulates workforce decisions for each person in a representative sample of providers based on
the person’s demographics, profession and specialty, and characteristics of the local or national economy and labor
market. Components include: (a) characteristics of the starting supply, (b) characteristics of new entrants to the
workforce, (c) attrition, (d) geographic mobility, and (e) work patterns.
• Disease management: DPMM simulates treatment/intervention scenarios to quantify their impact on preventing or
delaying onset of chronic disease and sequelae.
These three models are partially integrated as depicted by the dotted lines in Exhibit 1. For example, the available
supply influences staffing patterns; provider demand influences career decisions of individual providers; and
disease prevention and management strategies influence patient health outcomes and the derived demand for
services and providers. The three models are programmed in R, which is open source software.
Confidential. © 2020 IHS Markit. All rights reserved. 3 May 2020IHS Markit | HWMM Documentation Exhibit 1 Integrated Health Workforce Microsimulation Model Integrated Health Workforce Microsimulation Model Source: IHS Markit © 2020 IHS Markit The health occupations and medical specialties included in this model are summarized in Confidential. © 2020 IHS Markit. All rights reserved. 4 May 2020
IHS Markit | HWMM Documentation

Exhibit 2. Not all occupations are included in the supply analysis, often because of data limitations on entry and
exit from low compensated occupations with low barriers to entering the profession.

Confidential. © 2020 IHS Markit. All rights reserved.        5                                              May 2020
IHS Markit | HWMM Documentation

Exhibit 2 Health occupations and specialties modeled

 Health occupations and specialties modeled
 Occupations & Specialties                              Occupations & Specialties, cont.
 Physicians & physician assistants                      Advanced practice nurses
     Primary Care                                           Nurse anesthetists
       Family Medicine                                      Nurse midwives
       General Internal Medicine                            Nurse practitioners (by specialty)
       Geriatric Medicine                               Nursing
       General Pediatrics                                   Registered nurses
     Medical Specialties                                    Licensed practical/vocational nurses
       Allergy & Immunology                                 Nurse assistants/aides (incl. home health)
       Cardiology                                       Behavioral health (incl. psychiatrists and NPs/PAs)
       Critical Care/Pulmonology                            Psychologists
       Dermatology                                          Addiction counselors
       Endocrinology                                        Social workers
       Gastroenterology                                     Mental health counselors
       Hematology & Oncology                                School counselors
       Infectious Disease                                   Marriage and family therapists
       Neonatal-perinatal                               Oral health
       Nephrology                                           General dentists
       Rheumatology                                         Specialist dentists
     Surgery                                                Dental hygienists
       General Surgery                                  Pharmacy
       Colorectal Surgery                                   Pharmacists
       Neurological Surgery                                 Pharmacy technicians
       Obstetrics & Gynecology                              Pharmacy aides
       Ophthalmology                                    Respiratory care (therapists & technicians)
       Orthopedic Surgery                               Rehabilitation Services
       Otolaryngology                                       Occupational therapists & assistants
       Plastic Surgery                                      Physical therapists & assistants
       Thoracic Surgery                                     Therapeutic Services
       Urology                                              Chiropractor
       Vascular Surgery                                     Podiatrists
     Other Specialties                                  Vision Services
       Anesthesiology                                       Opticians
       Emergency Medicine                                   Optometrists
       Neurology                                        Nutritionists
       Pathology                                        Select diagnostic laboratory professions
       Physical Medicine & Rehabilitation               Select diagnostic imaging professions
       Psychiatry                                       Long term services and support professions
       Radiation Oncology
       Radiology
       Other Med Spec
     Hospitalist
 Source: IHS Markit                                                                                           © 2020 IHS Markit

Healthcare Demand Microsimulation Model
This section provides a brief overview of HDMM and describes creation of the major components: the population
file, healthcare use prediction equations, and provider staffing parameters. Data sources and methods for
producing national, state, and county demand projections are described. A description of the scenarios HDMM
was designed to model is also provided.

Confidential. © 2020 IHS Markit. All rights reserved.     6                                                        May 2020
IHS Markit | HWMM Documentation Overview HDMM models demand for healthcare services and the number of providers required to meet demand for services. Demand is defined as the level and mix of healthcare services (and providers) that are likely to be used based on population characteristics and economic considerations such as price of services and people’s ability and willingness to pay for services. HDMM was designed also to run a limited set of scenarios around “need” for services. Need is defined as the healthcare services (and providers) required to provide a specified level of care given the prevalence of disease and other health risk factors. Need is defined in the absence of economic or cultural considerations that might preclude someone from using available services. Other scenarios model the evolving care delivery system. HDMM has three major components: (1) a population database with information for each person in a representative sample of the population being modeled, (2) healthcare use patterns that reflect the relationship between patient characteristics and healthcare use, and (3) staffing patterns that convert estimates of healthcare demand to estimates of provider demand (Exhibit 3). Demand for services is modeled by employment or care delivery setting. Demand is also modeled by (a) diagnosis category for hospital inpatient care and emergency department visits, and (b) healthcare occupation or medical specialty for office, outpatient and home health visits. The services demand projections are expressed in terms of workload measures, and demand for each health profession is tied to one or more of these workload measures. For example, current and future demand for primary care providers is tied to demand for primary care visits, demand for dentists is tied to projected demand for dental visits, etc. External factors—such as trends or changes in care delivery—can influence all three major components of HDMM. Exhibit 3 Schematic of Healthcare Demand Microsimulation Model Schematic of Healthcare Demand Microsimulation Model Source: IHS Markit © 2020 IHS Markit Confidential. © 2020 IHS Markit. All rights reserved. 7 May 2020
IHS Markit | HWMM Documentation

Population files
The population files used in the model contain person-level data for a representative sample of the population of
interest. The population of interest might be the entire U.S., an individual state, a county within a state, or some
other geographic unit such as a region, metropolitan area, or hospital service area defined by a set of ZIP codes.
When a population file is created for a specified area, demand estimates can be produced for subsets of the
population—e.g., subsets defined by insurance type, patient demographic, or other tracked characteristic of the
population. Prior to 2019, the population database was created at the state level and could be aggregated to the
national level. Starting in 2019, the population files were constructed for each of the 3,142 counties or county
equivalents in the U.S. The county population files can be summed to produce either state or national estimates
and by National Center for Health Statistics (NCHS) urban-rural county designation.42 The population file is
updated each November to incorporate the latest versions of the following data sources:

•    American Community Survey (ACS). Each year the Census Bureau collects information on approximately three
     million individuals grouped into roughly one million households. For each person, information collected includes
     demographics, household income, medical insurance status, geographic location (e.g., state and sub-state [for
     multi-year files]), and type of residency (e.g., community-based residence or nursing home).

•    U.S. Census Bureau Population Estimates. The U.S. Census Bureau produces current population totals for each
     county by demographics including five-year age groups, sex, and race/ethnicity.

•    Behavioral Risk Factor Surveillance System (BRFSS). The Centers for Disease Control and Prevention (CDC)
     annually collects data on a sample of over 500,000 individuals. Similar to the ACS, the BRFSS includes
     demographics, household income, and medical insurance status for a stratified random sample of households in
     each state. The BRFSS, however, also collects detailed information on presence of chronic conditions (e.g.,
     diabetes, hypertension) and other health risk factors (e.g., overweight/obese, smoking). One limitation of BRFSS is
     that as a telephone-based survey it excludes people in institutionalized settings (e.g., nursing homes) who do not
     have their own telephone. We combine the latest two years of BRFSS files to provide records for approximately
     one million individuals. Since BRFSS reports some variables biennially (e.g., hypertension, which is omitted from
     the even year files), we used a predictive equation to estimate the probability of having those conditions in even
     years based on known characteristics of the individual.

•    Medicare Beneficiary Survey (MCBS). Starting in 2017, the health characteristics of the residential care
     population were modeled using individuals in the MCBS living in residential care facilities (with the 2017 MCBS
     data being the most recent available). Prior to 2017, individuals living in residential care were merged with the
     BRFSS—thus taking on the health risk profile characteristics of a community-based population that is healthier, on
     average, than the population in residential care facilities.

•    CMS’s Long-Term Care Minimum Data Set (NHMDS). Starting in 2017a, we used the NHMDS to develop a
     representative sample of residents in nursing homes in each state. This data source contains information on disease
     prevalence and health risk factors for each person residing in a nursing home. From the NHMDS we drew a
     random sample of resident records where the size of each sample was determined based on CMS published data of
     the average number of nursing home residents in each state by age group.

Creation of the state population database merges information from these sources using a statistical matching
process that combines patient health information from the BRFSS, MCBS and NHMDS with the larger ACS file

a
 Previously, we used the 2004 National Nursing Home Survey (NNHS) combined with CMS estimates of nursing home residents in each state to develop a
representative sample of the nursing home population in each state. The NNHS collected information on chronic conditions and health risk factors of this
population.

Confidential. © 2020 IHS Markit. All rights reserved.                                8                                                               May 2020
IHS Markit | HWMM Documentation
that has a representative population in each state (Exhibit 4). Creation of county-level population files uses a
similar process that is described later.
For the non-institutionalized population, each individual in the ACS was matched with someone in the BRFSS
from the same gender, age group (15 age groups), race, ethnicity, insured/uninsured status, household income
level (8 income categories), and state of residence.a Individuals categorized as residing in a residential care facility
or nursing home were randomly matched to a person in the MCBS or NHMDS, respectively, in the same state,
age group, gender, and race and ethnicity strata. Under this approach, some BRFSS, MCBS or NHMDS
individuals might be matched multiple times to similar people in the ACS, while some BRFSS or NHMDS
individuals might not be matched. The match probability for BRFSS and MCBS reflects the surveys’ sample
weights, with survey participants having higher sample weight more likely to be sampled.
Exhibit 4 Population database mapping algorithm
Population database mapping
Population algorithm
demographics Population health characteristics sources
CMS Nursing Home Minimum Data Set
Nursing
homes
Residential care Medicare Current Beneficiary Survey
facilities
Behavioral Risk Factor Surveillance
System
Community based
Source: IHS Markit © 2020 IHS Markit
Exhibit 5 summarizes the population characteristics available in each source file and the characteristics used for
the statistical match process. This detailed information for each person captures systematic geographic variation in
demographics, socioeconomic characteristics, and health risk factors (e.g., obesity, smoking, diabetes and
cardiovascular disease prevalence) that reflect regional differences in diet, physical activity, and other health-
related behavior.
a
The first round of BRFSS-ACS matching produced a match in the same strata for 94% of the population. To match the remaining 6%, the eight income levels were
collapsed into four (1% matched), then the race/ethnicity dimension was dropped (1% matched), and then the same criteria as the first round was applied except
State was removed as a strata (remaining 4% matched), and finally for the fifth round only demographics were included (remaining 0.1% matched).
Confidential. © 2020 IHS Markit. All rights reserved. 9 May 2020IHS Markit | HWMM Documentation
Exhibit 5 Characteristics available for each person in representative population sample
Characteristics available for each person in representative population sample
Population Characteristics Match Strata Source
(2017 & 2018)
ACS-NMMDS
MCBS (2017)
ACS-BRFSS
ACS-MCBS
ACS (2018)
NMMDS
BRFSS
(2017)
Demographics
Children age groups: 0-2, 3-5, 6-13, 14-17 ✓b ✓ ✓ ✓ ✓ ✓ ✓
Adult age groups: 18-34, 35-44, 45-64, 65-74, 75+
Sex: male, female ✓ ✓ ✓ ✓ ✓ ✓ ✓
Race/ethnicity: non-Hispanic white, non-Hispanic black, non-Hispanic other, ✓ ✓ ✓ ✓ ✓ ✓ ✓
Hispanic
Health-related lifestyle indicators a
Body weight: normal, overweight, obese ✓ ✓ ✓
Current smoker status ✓ ✓ ✓
Socioeconomic conditions and insurance
Family income (IHS Markit | HWMM Documentation metropolitan county, respectively, using the published Census Bureau population data. This produces a weighted sample that is representative of the demographics in each county. Further, county-level estimates of disease prevalence are calibrated at the individual level to match with external published information for each county. BRFSS data from state BRFSS surveys is the primary source for external county-level statistics used for calibrating prevalence of diseases and risk factors in the population files. The resulting constructed population file contains a representative sample of adults and children in each county by demographics, insurance type, prevalence of disease and health risk factors, with household income and residence type (community, residential care, or nursing home) reflective of the demographics in the county. Healthcare use patterns Projected future use of healthcare services, based on population characteristics and patterns of health-seeking behavior, produce workload measures used to project future demand for healthcare providers. HDMM uses prediction equations for healthcare use based on recent patterns of care use, but also can model scenarios where healthcare use patterns change in response to emerging care delivery models, policy changes, or other factors. Health seeking behavior is generated from econometrically estimated equations using data from ~170,000 participants in five years (2013-2017) of pooled files of the Medical Expenditure Panel Survey (MEPS). Pooling multiple years of data increases sample size for regression analysis for smaller health professions and lower frequency diagnosis categories. Over time, as a new year of data becomes available and is added to the analytic file the oldest year in the analysis file is dropped. We used the 2017 Nationwide Inpatient Sample (NIS), with ~8 million discharge records, to model the relationship between patient characteristics and length of hospitalization by primary diagnosis category. Many of the population characteristics such as demographics and socioeconomic circumstances are likely correlated with cultural and other factors (e.g., access constraints) that influence use of healthcare services and are omitted from the regressions due to data limitations. Consequently, the observed relationship between annual use of healthcare services and observed patient characteristics reflects correlation rather than causation. Negative Binomial regression was used to model annual office visits, annual outpatient visits, and annual home health/hospice visits. Prior to 2019, Poisson regressiona was used to model annual visits by provider occupation or specialty. From 2019, various regression models were evaluated in response to issues of over-dispersion in the Poisson model and the negative binomial regression model was selected as the alternative. This change had negligible impact on the demand projections but conceptually is more appropriate given the large percentage of patients with no visits to certain types of providers. These regressions were estimated separately for children versus adults. Separate regressions were estimated by physician specialty or non-physician occupations—e.g. dentists, physical therapists, psychologists—for office-based care. Likewise, separate regressions were estimated for occupations providing home healthcare. The dependent variable was annual visits (for office, outpatient, and home health). The explanatory variables were the patient characteristics available in both MEPS and the constructed population file (Exhibit 6). Logisticb regression was used to model annual probability of hospitalization and annual probability of emergency department visit for approximately two dozen categories of care defined by primary diagnosis code. The a Poisson regression is often used when the dependent variable (annual visits) is a count variable with a skewed distribution—i.e., many people have 0, 1, or 2, visits, but the number of people with higher volume of visits (3, 4, 5, etc.) declines at the higher volume levels. b Logistic regression is often used when the dependent variable is binary (yes/no). The sample size of MEPS is too small to accurately model patients with multiple hospitalizations and multiple emergency department visits—especially when modeling at the diagnosis category level. Confidential. © 2020 IHS Markit. All rights reserved. 11 May 2020
IHS Markit | HWMM Documentation

dependent variable for each regression is whether the patient had a hospitalization (or ED visit) during the year for
each of the condition categories (these categories were defined using the ICD-9 and ICD-10 codes). For
hospitalized patients, we used Poisson regression with NIS data to model hospital length of stay given the
condition category and patient information (age, sex, race/ethnicity, insurance type, presence of diabetes, and
urban-rural residency).

The model contains several hundred prediction equations for healthcare use, with examples of the regression
output for cardiology care presented in Exhibit 6 and for primary care presented in Exhibit 7. The numbers in
Exhibit 6 reflect either rate ratios (for office and outpatient visits, or inpatient days) or odds ratios (for ED visits
and hospitalizations). For all types of cardiology-related care there is a strong correlation with patient age
(controlling for other patient characteristics modeled). For example, relative to patients age 75 or older, patients
age 65-74 have only 80% as many office visits but have 18% more outpatient visits, although only the office visits
estimate is statistically different from 1.0 (where a ratio of 1.0 would indicate no statistical difference with the
comparison category). Patients age 65-74 have lower odds of a cardiology-related ED visit (i.e., primary diagnosis
was cardiology-related), and lower odds of a cardiology-related hospitalization. However, the length of
hospitalization averages 94% as long as the hospitalization for the age 75 or older patient.

Blacks tend to have fewer office visits than whites, but higher odds of ED visits or hospitalizations and longer
average length of hospital stay. Obesity is associated with increased use of cardiology-related services. Smoking
is associated with fewer office and outpatient visits to a cardiologist but higher rates of ED visits (likely reflecting
correlation rather than causality in the case of ambulatory care, as smoking is a risk factor for heart disease but
could be correlated with aversion to visit a doctor). Lower income is associated with less use of ambulatory care
and more use of ED visits and hospitalization. Having any medical insurance is associated with much greater use
of ambulatory care, and if the insurance is Medicaid then there is even greater use of cardiology services across all
care delivery settings. The presence of chronic medical conditions—and especially heart disease, hypertension,
and history of heart attack—are associated with much greater use of cardiology services across care delivery
settings. In general patients living in either small/medium metro or suburban large metro fringe areas tend to have
fewer ambulatory visits compared to those living in a large core metro area. Regression equations for other types
of care (whether by medical specialty or condition category) exhibit similar patterns that are consistent with
expectations and the health research literature.

Confidential. © 2020 IHS Markit. All rights reserved.         12                                               May 2020
IHS Markit | HWMM Documentation

 Exhibit 6 Sample regressions: adult use of cardiology services

Sample regressions: adult use of cardiology services
Parameter a                                                Office visitsb          Outpatient visitsb            Emergency visitsc               Hospitalizationsc                 Inpatient daysd
Age
18-34 years                                                          0.10**                         0.35**                        0.44**                         0.19**                         0.80**
35-44 years                                                          0.20**                         0.49**                        0.69**                         0.47**                         0.74**
45-64 years                                                          0.38**                           0.83                        0.67**                         0.57**                         0.84**
65-74 years                                                          0.80**                           1.18                         0.84*                           0.85                         0.94**
75+ years                                                              1.00                           1.00                          1.00                           1.00                           1.00
Male                                                                 1.09**                          1.18*                        0.77**                           1.04                         1.00**
Race- Ethnicity
Non-Hispanic White                                                     1.00                           1.00                          1.00                           1.00                           1.00
Non-Hispanic Black                                                   0.77**                           1.08                        1.20**                          1.19*                         1.11**
Non-Hispanic Other                                                     0.96                           0.78                          1.02                           0.96                         1.01**
Hispanic                                                              0.90*                         0.57**                          0.88                           0.90                         0.98**
Body Weight
Normal                                                                 1.00                           1.00                          1.00                            1.00
Overweight                                                             1.04                           1.00                          1.06                            1.08
Obese                                                                 1.10*                           1.04                        1.27**                            1.04
Current Smoker                                                       0.80**                          0.76*                        1.22**                            1.13
Household Income
IHS Markit | HWMM Documentation

Office visits by adults to a family medicine (FM) or general internal medicine (GIM) provider are presented for
comparison (Exhibit 7). The bars represent the percent difference in annual office visits contributed by each
characteristic controlling for other patient characteristics and relative to the reference population. Many of the
patient characteristics correlated with use of primary care services are similar to characteristics associated with
greater use of cardiologist services—e.g., the presence of chronic conditions like cardiovascular disease and
diabetes. Higher family income and residing in a metropolitan are associated with greater use of GIM services but
lower use of FM services.
Exhibit 7 Patient characteristics on rate of primary care office visits for adults

Confidential. © 2020 IHS Markit. All rights reserved.                       14                             May 2020
IHS Markit | HWMM Documentation

For care provided in the emergency department we link demand for emergency physicians to total demand for
emergency visits (so 10% growth in visits would translate to 10% growth in demand for emergency physicians
under the status quo scenario). Specialist physicians sometimes provide consults for emergency visits, and the mix
of patients and their diagnoses are expected to change over time. Using the 2015 and 2016 NHAMCS we
estimated a logistic regression where the dependent variable was whether during the visit a second physician was
seen. As summarized in Exhibit 8, the explanatory variables include specialty category (defined by visit primary
diagnosis), patient demographics (age, sex, and race), insurance status and whether insured through Medicaid, and
whether the patient lives in a metropolitan or non-metropolitan location. As illustrated by the odds ratios, the
likelihood that a specialist physician will be consulted during the visit differs by condition category, but in general
a second physician is most likely to be consulted if the patient’s primary diagnosis is related to nephrology,
neonatal medicine, vascular surgery, or cardiology. Patients with a primary diagnosis related to dermatology,
otolaryngology, or rheumatology are much less likely to see a second physician during their ED visit. Consults are
more likely for older patients, males, insured, not on Medicaid, and living in a metropolitan area.

For illustration, applying the logistic regression results to a female patient age 65-74, non-Hispanic white, and
living in a metropolitan area produces the following probabilities of having a consult tied to the primary diagnosis
for the emergency visit (Exhibit 9). The probabilities range from a high of 34% if the primary diagnosis is in the
category of nephrology, to a low of 8% is the primary diagnosis is in the category of otolaryngology or
rheumatology.

Confidential. © 2020 IHS Markit. All rights reserved.         15                                              May 2020
IHS Markit | HWMM Documentation
Exhibit 8 Logistic regression for emergency department consultation
Logistic regression for emergency department consultation
Parameter Odds Ratio 95% Confidence Interval
Diagnosis category (General Surgery comparison group) a
Cardiology 2.67 2.18 3.26
Dermatology 0.78 0.61 0.99
Endocrinology 1.44 1.10 1.88
Gastroenterology 1.14 0.94 1.37
Hematology 2.57 1.92 3.43
Infectious Disease 1.00 0.76 1.30
Neonatal Medicine 2.98 1.35 5.89
Nephrology 3.55 2.21 5.60
Neurological Surgery 1.50 0.94 2.31
Neurology 1.15 0.92 1.43
Obstetrics & Gynecology 2.21 1.76 2.77
Ophthalmology 1.14 0.76 1.66
Orthopedic Surgery 0.95 0.80 1.14
Otolaryngology 0.64 0.42 0.93
Other Specialties 1.21 1.00 1.47
Plastic Surgery 0.86 0.38 1.70
Psychiatry 2.36 1.96 2.86
Pulmonology 1.36 1.15 1.60
Rheumatology 0.64 0.45 0.89
Thoracic Surgery 1.85 1.55 2.22
Urology 1.07 0.90 1.29
Vascular Surgery 2.74 1.05 6.38
Female 0.90 0.84 0.97
Age (45-64 comparison group)
0-2 0.34 0.27 0.41
3-5 0.44 0.34 0.55
6-12 0.47 0.39 0.57
13-17 0.67 0.56 0.80
18-34 0.62 0.56 0.69
35-44 0.69 0.60 0.78
65-74 1.32 1.16 1.49
75+ 1.67 1.49 1.87
Race/ethnicity (non-Hispanic white comparison group)
Hispanic 1.46 1.33 1.61
Non-Hispanic black 1.03 0.94 1.13
Non-Hispanic other 1.29 1.07 1.55
Has medical insurance 1.35 1.18 1.54
Insurance is Medicaid 0.83 0.76 0.91
Lives in metropolitan area 3.09 2.72 3.53
2015 (vs 2016) 0.88 0.82 0.94
Source: Logistic regression analysis of the 2015 and 2016 NHAMCS. a Diagnosis categories defined by ICD-9 diagnosis and procedure codes to reflect types of care most likely provided by a
physician specialty.
Source: IHS Markit © 2020 IHS Markit
Confidential. © 2020 IHS Markit. All rights reserved. 16 May 2020IHS Markit | HWMM Documentation Exhibit 9 Illustration of probability of emergency department consultation Demand for medications is the workload driver to model demand for pharmacy-related health occupations. The NAMCS and NHAMCS indicate prescription medications ordered by a health provider, though this is used as a proxy for number of prescriptions filled (under the assumption that the ratio of prescribed-to-filled remains relatively constant over time). Patients who visit a cardiologist in an office setting average 6.11 prescriptions per visit, for example, while for primary care visits the average is 3.82 prescriptions per visit (Exhibit 10). To model projected growth in demand for pharmacy-related occupations, under the status quo scenario, provider demand is tied to projected growth in number of prescriptions. Confidential. © 2020 IHS Markit. All rights reserved. 17 May 2020
IHS Markit | HWMM Documentation

Exhibit 10 Average prescriptions per healthcare visit

 Average prescriptions per healthcare visit
 Physician Specialty                                                                                      Office            Outpatient     Emergency
 Nephrology                                                                                                     -                 5.43              3.58
 Cardiology                                                                                                  6.11                 4.20              2.76
 Vascular Surgery                                                                                               -                 3.02              2.98
 Endocrinology                                                                                                  -                 4.03              2.75
 Thoracic Surgery                                                                                               -                 3.18              2.01
 Pulmonology                                                                                                    -                 2.95              2.65
 Neurology                                                                                                   3.72                 2.90              2.59
 Gastroenterology                                                                                               -                 2.94              2.66
 Hematology & Oncology                                                                                          -                 3.58              2.67
 Psychiatry                                                                                                  2.30                 2.16              1.62
 Rheumatology                                                                                                   -                 2.66              1.76
 Urology                                                                                                     3.36                 2.42              3.01
 Orthopedic Surgery                                                                                          2.46                 2.49              2.07
 Allergy & Immunology                                                                                           -                 2.70              1.98
 Dermatology                                                                                                 2.38                 2.64              2.23
 Plastic Surgery                                                                                                -                 1.79              2.28
 Ophthalmology                                                                                               2.80                 1.78              1.68
 Otolaryngology                                                                                              2.75                 2.19              2.12
 Primary Care                                                                                                3.82                    -                 -
 General Surgery                                                                                             2.22                 1.91              1.76
 OBGYN                                                                                                       1.80                 1.83              1.96
 Neurological Surgery                                                                                           -                 1.67              1.81
 Neonatal-perinatal                                                                                             -                 1.15              1.04
 Other Med Spec                                                                                              3.78                 1.77              1.45
 Note: Average prescriptions per visit based on analysis of 2013-2015 combined NAMCS and 2011-2015 combined NHAMCS files.
 Source: IHS Markit                                                                                                                      © 2020 IHS Markit

To model demand for oral health services we analyzed the MEPS Dental Visits File for the period 2012-2016. The
combined file was used to model annual visits to dental hygienists, and annual visits to each type of dentist
including general or pediatric dentist, endodontist, orthodontist, periodontist and other type of dentist. The
regressions were estimated separately for adults and children. MEPS does not identify pediatric dentists as a
unique specialty, and so using MEPS we cannot indicate whether dental services provided to children were by a
pediatric dentist or a general dentist. Information from ADA’s survey of dental practices allowed us to model the
proportion of dental visits by children and adolescents that likely were to general dentists and pediatric
dentists.26,43

These regressions quantify the relationship between patient characteristics and annual oral health visits similar to
the regression output summarized in Exhibit 6. The regression results show that use of oral health services is
highly correlated with insurance status (where medical insurance is used as a proxy for dental insurance),
household income, living in a metropolitan area, patient age, and race/ethnicity.

MEPS is a representative sample of the non-institutionalized population, and although the healthcare use
prediction equations are applied to a representative sample of the entire U.S. population, parts of the model
require calibration to ensure that at the national level the predicted healthcare use equals actual use. Applying the
prediction equations to the population for 2016 through 2017 creates predicted values of healthcare use in those
years (e.g., total hospitalizations, inpatient days, and ED visits by specialty category, and total office visits by
physician specialty). For model calibration, we compared predicted national totals to estimates of national total
hospitalizations and inpatient days, by diagnosis category, derived from the 2017 NIS. Comparative national
estimates of ED visits and office visits came from the 2016 NHAMCS and 2016 NAMCS, respectively.

Confidential. © 2020 IHS Markit. All rights reserved.                                         18                                              May 2020
IHS Markit | HWMM Documentation

Multiplicative scalars were then created by dividing national estimates by predicted estimates. For example, if the
model under-predicted ED visits for a particular diagnosis category by 10% then a scalar of 1.1 was added to the
prediction equation for that diagnosis category.

Applying this approach to diagnosis/specialty categories, the model’s predicted healthcare use was consistent with
national totals for most settings (see Exhibit 11 for calibration scalars for physician office visits). Setting/category
combinations where the model predicted less accurately (and therefore required larger scalars) tended to cluster
around diagnosis categories in the ED characterized by lower frequency of visits likely due to a combination of
small sample size in both MEPS and NAMCS.
Exhibit 11 HDMM calibration: physician office visits

 HDMM calibration: physician office visits
                                                            NAMCS Visits (in thousands),   HDMM Initial Visits Pre-Scalar (in
 Specialty                                                                        2016 a                  thousands), 2018              Scalar
 Family Medicine                                                               202,494                             411,955             0.492
 Pediatrics                                                                    136,119                              81,775             1.665
 Internal Medicine                                                              81,701                              72,292             1.130
 Obstetrics & Gynecology                                                        73,198                              80,804             0.906
 Orthopedic Surgery                                                             30,114                             124,001             0.243
 Ophthalmology                                                                  46,289                             127,436             0.363
 Dermatology                                                                    49,947                              90,870             0.550
 Psychiatry                                                                     29,993                             110,045             0.273
 Cardiovascular Diseases                                                        27,783                              32,945             0.843
 Otolaryngology                                                                 28,965                              27,495             1.053
 Urology                                                                        26,153                              35,925             0.728
 General Surgery                                                                15,685                              16,282             0.963
 Neurology                                                                      14,407                              29,811             0.483
 All other specialties                                                         120,875                              96,173             1.257
 Note: a https://www.cdc.gov/nchs/data/ahcd/namcs_summary/2016_namcs_web_tables.pdf

 Source: IHS Markit                                                                                                             © 2020 IHS Markit

Health workforce staffing patterns
Demand for healthcare workers is derived from the demand for healthcare services. The status quo scenario in
HDMM extrapolates current staffing levels as reflected by national healthcare use-to-provider ratios. For example,
demand for registered nurses (RNs) under the status quo is modeled based on the current national ratio of
inpatient days-to-RNs to model RNs in hospital inpatient settings, the national ratio of ED visits-to-RNs to model
demand for RNs in emergency departments, the national ratio of office visits-to-RNs to model demand for RNs in
office settings, etc.

The national number of health workers comes from many different sources, as described in the chapter describing
supply modeling, including associations’ Master Files (e.g., AMA Master File for physicians, ADA Master File
for dentists), the Health Resources and Services Administration’s (HRSA’s) National Sample Survey of
Registered Nurses for RNs and advanced practice registered nurses (APRNs), association publications such as
NCCPA reports for number of licensed physician assistants (PAs), and ACS and Occupational Employment
Statistics (OES) survey data collected from employers by the Bureau of Labor Statistics for select health
occupations.

The distribution of health workers across care delivery settings comes from multiple sources—including
published data collected by specialty associations via surveys of their members (e.g., NCCPA data on physician
assistants); specialty surveys (e.g., HRSA’s National Sample Survey of Registered Nurses); and OES data from

Confidential. © 2020 IHS Markit. All rights reserved.                          19                                                    May 2020
IHS Markit | HWMM Documentation
employer surveys reported by detailed health occupation, industry sector, and state. Limitations of OES data
include (1) it counts job positions, which may produce overcounting in occupations that have a high proportion of
part time workers, and (2) the data are for employed individuals, which can undercount the workforce in
occupations with a high proportion of self-employed individuals such as dentists or physicians.
For many occupations, demand is tied to one workload measure—e.g., demand for dentists is tied to demand for
dental visits (excluding dental cleaning visits), and demand for dental hygienists is tied to demand for dental
cleanings. For nurses, physicians, APRNs, PAs, and health occupations that work in multiple care delivery
settings there are multiple workload measures specific to each occupation and employment setting. The use of
multiple workload measures reflects that demand in each setting will grow at different rates.
In addition to using current staffing ratios to model a status quo scenario, HDMM was designed to model possible
changes in staffing patterns to reflect emerging care delivery models as informed by the literature. These scenarios
are discussed in more detail later and are also areas of ongoing research. Population health risk factors affect the
demand for healthcare services, but HDMM staffing currently does not account for variation across geographic
areas or over time in average patient acuity level for those who seek care. This is also an area of ongoing research.
Scenarios
The capabilities of HDMM to model alternative demand scenarios continue to evolve, and scenarios previously
modeled continue to be refined as new information becomes available. Many of these scenarios have been
described and the demand implications summarized in previous publications. 25,44
• Status quo. This scenario models the implications of changing demographics as the population grows, ages,
and becomes more racially and ethnically diverse. Under this scenario healthcare use and delivery patterns are
modeled as remaining consistent with current patterns (i.e., observed during the 2013-2017 as reflected in the
MEPs and the 2017 NIS). Prevalence of disease and other health risk factors (e.g., smoking and obesity)
remain constant within each demographic group, but do change in the aggregate level as population
demographics change. For example, prevalence of diabetes and heart disease will rise as the population ages
but do not change independent of changing demographics. This scenario models the future demand for health
workers to provide a level of care consist with current levels.
• Increased medical insurance coverage. Earlier workforce studies modeled the implications of expanded
medical insurance coverage under the Affordable Care Act (ACA), but because recent patterns of healthcare
use and delivery largely have incorporated the effects of ACA this scenario is no longer modeled. However,
HDMM has been used to model hypothetical scenarios of insuring the uninsured to estimate the potential
impact of goals to improve access to care. This scenario assumes that a person who gains insurance will have
healthcare use patterns similar to his or her commercially insured counterpart with the same demographics and
risk factors. Although there may be an initial uptick in care sought, the scenario captures what happens when
the care sought by the newly insured settle into patterns of the currently insured. In HDMM this is essentially
done by switching the insurance status of a person from uninsured to insured and holding all other patient
characteristics constant.
• Reducing barriers to accessing care. This scenario builds on the increased medical insurance coverage
scenario to model the impact on health workforce demand if historically underserved populations had
improved access to care. Populations identified as underserved include minority populations and people living
in non-metropolitan areas—as well as people without medical insurance.45–48 When modeling this scenario for
oral health, lower household income is also identified as a barrier to receiving care (whereas for most other
healthcare services household income has only a small correlation with use of healthcare services controlling
Confidential. © 2020 IHS Markit. All rights reserved. 20 May 2020IHS Markit | HWMM Documentation
for insurance status). In some studies this scenario has been referred to as a “health care utilization equity”
scenario.25
• Increased use of managed care principles. A variety of integrated care delivery models are being
implemented for both publicly and privately insured populations in an effort to both control rising medical
expenditures and improve delivery of care. Risk-bearing entities such as accountable care organizations
(ACOs) and Health Maintenance Organizations (HMOs) incorporate financial incentives for patients and
providers to better manage utilization by creating incentives for providers to collaborate in providing and
coordinating patient care across settings. ACOs have been promoted under ACA, but because they are a
relatively new care delivery model there is still limited data on their impact on patient use of services, how
care is delivered, and the demand implications for the health professions. Looking historically at the effect of
HMOs and other risk-bearing delivery models on use of services provides insights on what might happen if
ACOs gain greater prominence. One aspect of managed care is promotion of primary care and preventive care
to reduce need for expensive, hospital-based care and need for specialist care. One of the explanatory
variables in HDMM is the MEPS variable of whether the person is in an HMO-type managed care plan. By
changing people’s status from non-HMO to HMO, while holding all other characteristics constant, we model
the demand implications of increasing the proportion of the population in managed care plans. In general,
scenario findings are an increase in demand for primary care services and providers with a decrease in demand
for many types of specialist services and their providers.
• Expanded use of retail clinics. Retail clinics provide a convenient, cost-effective option for patients with
minor acute conditions. The number of retail clinics has grown rapidly over the past decade and is projected to
reach about 5,600 clinics by 2022.49–51 Retail clinics appear to be servicing demand for some types of services
historically provided in other settings, and also appear to be creating a net increase in healthcare utilization for
services provided to populations historically underserved and who would not otherwise receive care.52,53 For
example, an estimated 39% of visits to retail clinics replace physician visits, 3% replace emergency
department visits, and 58% are new visits that would not otherwise have occurred.52 This scenario explores
the demand implications of shifting care from primary care physician offices to retail clinics for 10 conditions
typically treated at retail clinics: upper respiratory infection, sinusitis, bronchitis, otitis media (middle ear
infection) and otitis externa (external ear infection), pharyngitis, conjunctivitis, urinary tract infection,
immunization, blood pressure check or lab test, and other preventive visit.51,53
In this scenario, patient visits to specialist physician are unaffected, and patients with modeled chronic
conditions in HDMM (i.e., cardiovascular, diabetes, asthma, hypertension or history of stroke) will continue
to be seen by their regular primary care provider even for non-complex health issues that could be treated in a
retail clinic. The scenario models a shift in demand from primary care physician offices to retail clinics,
incorporating into the workforce demand implications that 83% of visits to a pediatrician’s office are handled
primarily by a physician (reflecting that between NPs and physicians, 83% of the pediatric workforce are
physicians) and 71% of adult primary care office visits will be handled primarily by a physician. Care in retail
clinics is provided mostly by nurse practitioners.
• Increased use of APRNs and PAs. Studies conducted for the Association of American Medical Colleges
(AAMC) have modeled the implications on demand for physicians of the rapid growth in supply of APRNs
and PAs. This scenario, described elsewhere, uses different assumptions of the degree to which demand for
physicians might decrease as a result of growing supply of APRNs and PAs.25 The scenario assumes that a
portion of the increased supply of APRNs and PAs will replace some physician demand, a portion will expand
overall patient access to care but not replace physician demand, and a portion will increase the
comprehensiveness of care provided to patients but not replace physician demand. A 2012 study, for example,
estimated that patients receiving care from primary care physicians working alone received only 55% of
Confidential. © 2020 IHS Markit. All rights reserved. 21 May 2020You can also read