The Value of Competitor Information: Evidence from a Field Experiment - Hyunjin Kim
←
→
Page content transcription
If your browser does not render page correctly, please read the page content below
The Value of Competitor Information:
 Evidence from a Field Experiment
 Hyunjin Kim

 Click here for the latest version

 June 2020

 Abstract

 Data on competitors have become increasingly accessible in recent years, raising the potential
 for firms to inform their decisions with a better understanding of the competitive environment.
 To what extent are firms aware of readily available information on key competitor decisions, and
 how does this information impact firms’ strategic choices? I explore these questions through a
 field experiment in collaboration with Yelp across 3,218 businesses in the personal care industry,
 where treatment firms receive easily accessible information on their competitors’ prices. At
 baseline, over 46% of firms are not aware of their competitors’ prices. However, once firms
 receive this information, they are 17% more likely to change their prices, and do so by aligning
 their prices with competitor offerings. If competitor information is both decision-relevant and
 easily accessible, why had firms not invested in this information on their own? Evidence from
 interviews and a follow-up experiment across control firms suggests that managers appear to
 have underestimated the value of paying attention to competitor information. These findings
 suggest that managerial inattention may be a key barrier that leads firms to fail to realize gains
 from even readily accessible data.

 Email: hyunjinvkim@gmail.com. I am indebted to my advisors, Rebecca Henderson, Michael Luca, Amanda
Pallais, and Dennis Yao for their support, advice, and encouragement. This project would not have been possible
without collaboration from Yelp (Darnell Holloway, Genna Gold, Ali Schwartz, Emily Washcovick, Matt Donzella,
Sebastien Couvidat, Wolfe Styke), administrative support from Jennifer Mucciarone and Angela Valvis, excellent
research assistance from Alice Dai, Sarah Xu, Robert Courtney, Jiahao Huang, Fabian Konig, Claire Liu, Dilhan
Perera, Byron Perpetua, and Yao Xen Tan, and the tireless work of all the data collectors. I also thank Juan
Alcacer, Susan Athey, Nick Bloom, Yo-Jud Cheng, Ashley Craig, Christine Exley, Shane Greenstein, Rem Koning,
Josh Krieger, Liz Linos, Hong Luo, David Martin, and Frank Nagle for helpful comments. I am grateful for the
support of the Ewing Marion Kauffman Foundation, the Foundation for Human Behavior, Harvard Business School,
and Yelp. The ability to publish is not tied to the results of this paper. This experiment was approved by the Harvard
University IRB office and pre-registered at the AEA RCT Registry (ID 0003013). All errors are my own.

1 Introduction

 Understanding the competitive environment is a central part of strategic decision-making,
especially on key choices such as price, quality, and location. In recent years, it has become increasingly
easier for firms to acquire data, not only on their customers or internal operations, but also their
competitors and their decisions (e.g. Brynjolfsson and McElheran 2016, Einav and Levin 2014, Tambe
2014). For example, Amazon provides details on comparable products offered by other sellers, Expedia
shows real-time pricing and amenity information for nearby hotels, and Yelp displays reviews of
neighboring local businesses. This increased accessibility of competitor data raises the potential for
firms to inform their decisions with a better understanding of the competitive environment (Seamans
and Zhu 2013, Wang and Shaver 2014, Bennett and Pierce 2016).
 However, while awareness of competitor decisions is often implicitly assumed, there is less research
on how knowledgeable firms are of their competitors in practice – and how this information impacts
their strategic choices. Well-known examples suggest that firms may lack knowledge about their
competitors, even in settings where the costs of acquiring information appear to be low. Hotels fail to
identify key competitors of similar price and size (Baum and Lant 2003, Li et al 2017). Large textile
manufacturers are unaware of common management practices like having an uncluttered factory floor,
despite their widespread adoption (Bloom et al 2013). While these examples suggest that firms may
lack awareness in certain cases, they raise further questions: to what extent are firms aware of readily
available information on key competitor decisions, and how does this information impact firms’
strategic choices? This lack of competitor knowledge may have large implications for firm performance:
firms may fail to respond to competition or miss out on opportunities for performance improvements.
 In this paper, I provide large-scale evidence that firms may be unaware of key competitor decisions
even when this information is easily accessible. Firms do not appear to lack awareness because
competitor information is not decision-relevant: once firms receive this information, they change their
decisions by better aligning them with competitor offerings. I find suggestive evidence that managerial
inattention may drive firms’ lack of awareness: managers believe that competitor information is
important, but fail to pay attention because they believe they are already aware of it. As competitor
data becomes increasingly accessible in the digital age, these findings highlight the role that attention
may play in shaping the impact of digitization, and provide practical implications for when firms
should invest in competitor intelligence and the barriers they may face in realizing gains from available
data.
 I empirically explore these questions using a field experiment across 3,218 businesses in the
personal care industry. I focus on firms’ pricing decisions, a central strategic lever in this industry
that drives customer decisions.1 I collaborate with Yelp to physically send canvassers to all 3,218 firms

1
 I analyze all consumer reviews on Yelp prior to the experiment for suggestive insights on the drivers of customer
decisions. I use word2vec, a neural network that identifies words sharing common contexts by computing cosine similarity
between a mean of the projection weight vectors of the words and for each word in the model. I find that pricing is one
of the most frequently mentioned categories. 46% of all reviews include words related to pricing, 35% of reviews reference
comparisons to competitors, 24% comment on cleanliness, and 17% of reviews comment on luxuriousness. Furthermore,
analyzing reviews using a bag-of-words model (2- and 3-grams), I find that the most frequent phrases mention price and
comparison to other salons, suggesting that customers are searching across salons along these dimensions.
 2
for a standard marketing visit. Firms randomly assigned to treatment receive additional information
during this visit on their relative price positioning compared to their 9 geographically closest
competitors. This design enables me to tease apart the treatment effect of competitor information
from the selection effect of firms that choose to invest in competitor intelligence, and ensure that
randomly assigned treatment firms see the competitor information.
 I run this experiment across personal care businesses that offer nail services, as this context enables
precise identification of competitor knowledge and its impact across thousands of firms in hundreds
of local markets with varying degrees of competition. A $9.8 billion market in the U.S., nail salons
represent one of the largest local business verticals (IBIS 2019). This market is differentiated along
pricing and quality, and exhibits much heterogeneity in size – from sole proprietorships to
multinational chains with 800 establishments and over a million in revenues. Information on
competitor prices is easily accessible in this market via phone calls or visits, enabling me to study
why firms might lack competitor knowledge even when information is easily attainable.2 Moreover,
nail salons have simple strategy spaces, where price positioning is a central decision that is both
measurable and comparable: every salon has a price for a regular manicure, which generally vary from
$5 to $60 and serves as the base price for other services.3 Measures of quality positioning can also be
readily observed from the polish brands used, the cleanliness of the interior, and the luxuriousness of
the décor. How these decisions are made resemble those of other retail businesses, as well as of small
and medium enterprises (SMEs) more generally, which make up 99.7% of U.S. establishments,
represent 46% of GDP, and are of policy importance in many countries.4
 To measure the impact of competitor information, I obtain measures of firms’ baseline knowledge
of their competitors prior to treatment, and construct a panel data set of monthly prices and proxies
of performance over 12 months. A team of approximately 50 data collectors make phone calls each
month to all 3,218 businesses to obtain prices of regular manicures. They also physically visit
businesses at baseline and endline to observe their polish brands, cleanliness, and luxuriousness as
measures of their quality. To measure proxies of performance, I collect an indicator of availability for
an appointment on the next day during a peak hour, as well as purchase intentions from the Yelp
platform, which include calls to the business, page views, and map directions views. I also work with
the city government of San Francisco to obtain data on business sales taxes.
 At baseline, a large percentage of firms appear to lack competitor knowledge, including those that
face higher levels of competition. When asked by canvassers who their primary competitors are and
what prices they are charging prior to the information intervention, over 46% of treatment firms are

2
 Obtaining competitor prices that are provided as treatment takes less than 9 minutes of phone calls (less than a minute
per competitor), and many managers state that they could easily obtain this information online or physically, suggesting
that the acquisition costs are fairly low.
3
 More elaborate nail services (e.g. nail art or pedicure) are priced in proportion to the regular manicure price, such that
two salons with approximately similar regular manicure prices will have approximately similar prices across their other
services. This is often not the case in even other simple markets: for example, prices for a cup of coffee across cafés may
not map to their price positioning, as cafés have differing sizes of cups, and some may have cheaper coffee but more
expensive pastries.
4
 SMEs are defined by the U.S. Small Business Administration as firms with fewer than 500 workers. Firms with fewer
than 100 workers account for 98% of employer firms, and firms with fewer than 20 workers make up 89%. SMEs represent
47% of employment and 46% of GDP. (https://sbecouncil.org/about-us/facts-and-data/).
 3
not able to state specific competitors or their prices.5 Consistent with this evidence, I also find a large
dispersion of prices across firms that offer similar levels of quality, as well as discrepancies between
firms’ stated versus observed price-quality positions. Since many managers state that they can easily
acquire information on competitor pricing, it may be that these measures are inflated, or that firms
are unaware of this information simply because it is not decision-relevant. For example, it may be
that other informative sources such as observing customers and residual market demand provide
sufficient statistics for competitor information, especially in more competitive markets. Alternatively,
it may be that firms that are unaware of competitor pricing rely on a large base of regular customers
that shield them from competition.
 However, once treatment firms receive this information, they change their pricing in ways that
suggest that this information is valuable. Treated firms are 17% more likely to change their prices
relative to control firms in the months following the canvasser visit. Over 19% of these firms show
surprise and comment that they intend to change their prices based upon it, and an additional 18%
actively engage with the information and ask follow-up questions – suggesting that these price changes
are driven by the competitor information.
 Rather than differentiating, firms increase alignment with their geographically nearest
competitor’s decisions, with those that were charging higher (lower) prices compared to their nearest
competitors decreasing (increasing) prices. Firms that were over- or under-pricing relative to their
quality also respond most to treatment, suggesting that these changes may be improvements. I find
suggestive evidence consistent with the interpretation that receiving competitor information may be
performance-enhancing: treatment firms observe 15% more calls, page views, and map directions views
on Yelp, and 3% lower availability for an appointment the next day – which may be driven by
passersby who can often see prices from the outside, or consumers searching on Yelp who can observe
prices on the search results page. These performance effects do not appear to stem from firms’
increased usage of the Yelp platform, and are driven mostly by firms that were over-pricing at
baseline.6
 Given this positive impact of easily accessible competitor information, the natural question is why
firms had not previously invested in this information on their own. Treatment effects are larger for
firms that face higher competition, as well as those without prior experience using demand-based
promotions that indicate sophistication with pricing, suggesting that a lack of competition or
capabilities to use the information may not fully explain firms’ lack of knowledge.
 Evidence from 25 interviews and a follow-up experiment across control firms suggests that
inattention may have been an important factor, consistent with research on managerial attention
(Ocasio 1997, Eggers and Kaplan 2009, Helfat and Peteraf 2015, Hanna, Mullainathan, and

5
 This percentage excludes firms where managers were not willing to answer questions in general, appeared to brush off
canvassers, or did not fully engage with questions that followed.
6
 I find little evidence of spillover effects, which I explore by surveying control firms on whether they heard about pricing
information provided by Yelp after endline data collection, as well as by analyzing whether control firms in ZIP codes
with a higher proportion of treated firms are more likely to change prices and observe lower purchase intentions. However,
these performance effects are likely to at least partly capture business stealing, unless market demand is growing
sufficiently over time. In terms of the main treatment effect on price change, any spillover effects would bias any estimate
of a treatment effect downwards, as control firms also become more likely to change prices.
 4
Schwartzstein 2014). Managers appear to underestimate the value of paying attention to this
information, until they are triggered to explicitly reevaluate their knowledge. Managers that are
randomly assigned to reassess their knowledge of competitors before being asked whether they are
interested in receiving competitor information (for free) are more likely to sign up to receive it,
compared to those who are asked first about their interest in competitor information.
 In addition to the strategy literature on competitive interactions, this paper relates to several
strands of literature. First, a variation of the concern about whether firms lack awareness of
competitors is how firms apply readily available data to improve decision-making. Research on data-
driven decision-making and information technology more broadly has shown that these investments
are associated with higher firm performance but with differential gains across firms (Brynjolfsson,
Hitt, and Kim 2011, Bloom et al 2012, Brynjolfsson and McElheran 2016, Hoffman, Kahn, and Li
2018, Bajari et al 2019). This paper unpacks how competitor information improves firm decisions,
and provides evidence that despite its value and accessibility, firms may fail to attend to and use data.
 Second, a large literature on firms’ management practices has documented how firms’ lack of
knowledge and adoption of best practices may explain the dispersion in performance observed across
firms (Bloom and Van Reenen 2007, Syverson 2011, Bloom et al 2013, Bruhn et al 2017). One puzzle
raised by this literature is why firms lack knowledge of even commonly used best practices. This paper
provides evidence on how widespread firms’ lack of competitor knowledge may be even for key
strategic decisions like pricing and in settings with low barriers to information and relatively high
competition. The findings also provide suggestive evidence that behavioral factors like inattention
may drive this lack of knowledge, consistent with an emerging literature on behavioral firms
(DellaVigna and Gentzkow 2019, Kremer, Rao, and Schilbach 2019).
 Lastly, a growing management literature on the cognitive underpinnings of strategy has proposed
the importance of managerial capabilities for attention (Ocasio 1997, Eggers and Kaplan 2009, Helfat
and Peteraf 2015). But problems in measurement and identification have made it hard to confirm how
attention might impact firm strategy. This paper provides empirical evidence on how inattention
might lead firms to overlook competitor information, and proposes that firms may become inattentive
due to outdated information that leads them to be complacent to new information. Building on ideas
proposed by Gavetti (2012), these findings suggest that even in competitive markets, managers may
need to worry about inattention to the immediate competitive environment, and that attention may
create opportunities for competitive advantage.

2 Setting

 I study the personal care industry, which enables precise identification of firms’ knowledge of
competitor decisions and its impact across thousands of firms in hundreds of local markets with
varying degrees of competition.
 Case studies have long provided valuable insights to uncover empirical facts. Studies of hotels
have yielded numerous insights on firm positioning, location choices, learning, and competitor
perception (Baum and Haveman 1997, Baum and Ingram 1998, Chung and Kalnins 2001, Baum and

 5
Lant 2003, Li et al 2017). Pizza stores offered evidence on how organizations acquire and transfer
knowledge (Darr, Argote, and Epple 1995). Taxicab companies enabled a detailed study of
coordination costs and organizational rigidity (Rawley 2010). Careful studies of fishing boats in India,
pineapple farms in Kenya, local gas stations, and ready-mix concrete have provided detailed insights
on issues as diverse as firm productivity, learning, and pricing (Conley and Udry 2010, Jensen 2006,
Lewis 2008, Syverson 2004). In each of these papers, grounding the question in a case study of a
particular industry helps identify precise measures of concepts and uncover new hypotheses or puzzles
from the richness of the context.
 However, finding a market to study whether and why firms might lack competitor knowledge and
what its impact may be on strategic choices like price positioning is difficult, due to the many
requirements it imposes. It requires a large number of firms across varying market conditions to
statistically identify the extent to which the value of competitor information might vary across levels
of market competition or firm attributes. Moreover, price positioning must be clear, measurable, and
comparable across firms, which is challenging to find and often reduces the sample to an even smaller
number of firms. For example, even in a relatively simple market like cafés, it is not straightforward
to precisely measure firms’ price positioning. Cafés vary in their menus with some items that are more
expensive than others, and even a seemingly comparable item like a cup of coffee does not provide
comparable measures across establishments due to its varying size and quality, both of which are
challenging to consistently measure.7 As a result, much prior research on positioning has been based
on qualitative case studies of single organizations or limited by small sample sizes: 50 consulting firms
in Semadeni (2006), 159 banks in Deephouse (1999), and 614 hotels in Baum and Haveman (1997).
 After assessing many possible industries,8 I chose to focus on personal care businesses that offer
nail services, due to the extent to which I can isolate price positioning and how it changes. The market
for nail salons is estimated to be approximately $9.8 billion in the U.S. (IBIS 2019). As a point of
comparison, the nail salon industry is slightly larger than the men’s clothing store market in the U.S.,
estimated at $8.5 billion, and slightly smaller than the egg production market, at $10.5 billion (IBIS
2019). While the nail salon market is fairly competitive and fragmented, large chains also exist. For
example, Regal Nails has more than 800 salons across U.S., Canada, and Puerto Rico, with over $1.15
million in annual revenues. Many nail salons represent entrepreneurial endeavors, often founded by
college-educated immigrants and women who pursue entrepreneurship as career alternatives (Nails
Magazine 2015). A prominent example of an entrepreneurial salon is Miniluxe, a Boston-based chain
of 25 salons, which recently received $23 million in venture capital investments.
 The nail salon industry has a number of attributes that make it a compelling setting to study the
impact of competitor information on firm pricing. First, nail salons represent the largest vertical
among local businesses and compete locally, enabling a sample of thousands of firms across hundreds
of local markets.9 The large number of firms and local markets enables me to evaluate competitor

7
 More broadly, Archak et al 2011 illustrate how difficult it may be to isolate key features of products even in relatively
simple markets like digital cameras.
8
 I analyzed industry verticals across drycleaners, florists, and restaurants based on market (and sample) size,
comparability and observability of price positioning, and competitor information accessibility.
9
 Potentially as a result of the level of competition, nail salons have recently come under regulatory scrutiny for labor
rights violations.
 6
knowledge and the impact of competitor information across different firm attributes and degrees of
market competition. Second, they have standardized, comparable, and observable measures of price
and quality positioning. Every salon has a price for a regular manicure, which approximately
represents its price positioning, as other services are priced proportionally to the regular manicure
price. 99% of regular manicure prices vary from $5 to $65 depending on quality.10 Quality can be
observed using the salon’s polish brands – which can vary from $9 to $70 per bottle at retail cost, as
well as the cleanliness of the interior and the luxuriousness of the décor. These price and quality
decisions and how they are made are generally similar to those of other retail businesses, as well as of
small and medium enterprises (SMEs) more broadly, which make up a large percent of the economy.11
Finally, information on competitor prices is easily accessible, enabling me to study why firms might
lack competitor knowledge even when information is easily attainable. Many managers comment that
they could easily obtain this information online or even physically, suggesting that the acquisition
costs are fairly low. Nearly all firms in the sample are aware of Yelp, and most firms have a competitor
within 0.5 miles that they pass by on their way to work. Furthermore, obtaining competitor prices
provided as treatment takes less than one minute of phone calls per competitor.
 Within this context, I partner with Yelp, an online platform that crowdsources listings and reviews
of local businesses, to deliver the treatment information in a more natural manner. As of June 2018,
Yelp listed over 4.6 million verified12 businesses including restaurants, home services, beauty salons,
and fitness centers, accumulating 163 million reviews and attracting 74 million unique desktop and
72 million mobile visitors on a monthly average basis (Yelp 2018). Yelp displays business listings with
location information, which are continually sourced from Yelp’s internal team, user reports, and
partner acquisitions, and checked by an internal data quality team. Yelp also provides reviews and
photos that detail business decisions, and tracks proxies of business performance, such as calls to the
business, views of map directions to the business, and business pageviews. Furthermore, it has a free
business dashboard for businesses to observe information about their reviews, where Yelp could in
theory provide information about their competitive context.
 I collaborate with Yelp by scaling up marketing efforts within the company that sent canvassers
to physically visit local businesses. At the time of the experiment, Yelp was making marketing visits
to a handful of businesses each year to inform them about how to update their information on Yelp’s
free business page. I scale up these efforts and layer an information intervention on top of the standard
marketing visit for businesses assigned to treatment. This setting provides an advantage over online
platform settings, by enabling information to be verifiably delivered.

10
 This range of manicure prices is observed across the entire set of 6,370 nail salons that I verified across the San Francisco
Bay Area, New York City, Los Angeles, and Chicago.
11
 SMEs are defined by the U.S. Small Business Administration as firms with fewer than 500 workers, and represent 99.7%
of all U.S. establishments. Firms with fewer than 100 workers account for 98% of employer firms, and firms with fewer
than 20 workers make up 89%. SMEs represent 47% of employment and 46% of GDP. (https://sbecouncil.org/about-
us/facts-and-data/).
12
 Verification means that the business claimed their free page on Yelp, verifying that the listing was a true business.
 7
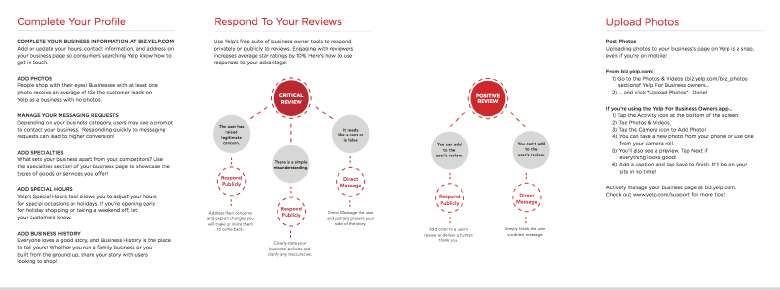
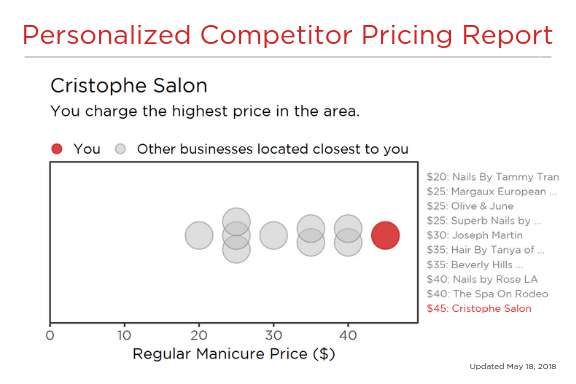
3 Experimental Design

 To isolate the impact of competitor information, I run a field experiment across businesses in the
personal care industry. All firms in the sample receive marketing visits from Yelp canvassers, during
which treatment firms receive additional information on the prices of 9 geographically closest
competitors. Canvassing visits result in a balanced experimental sample of 3,218 firms, which represent
approximately 60% of each market across New York, Los Angeles, San Francisco, and Chicago. I
observe low levels of attrition and non-compliance.

3.1 The competitor information intervention

 All firms receive a marketing visit from a Yelp canvasser, and firms assigned to treatment receive
additional information on competitor price positions during this visit. This information displays the
relative price positions of their 9 geographically closest competitors, which canvassers explain based
on a standardized script on which they are trained.
 Within the experimental sample, all firms across control and treatment groups receive a physical
visit from a Yelp canvasser. The canvasser provides a brochure with information on how to edit
business details, add photos, and respond to reviews on Yelp’s free business page (Appendix Figure
A.1) and offers assistance with claiming their page. For businesses who have already claimed their
Yelp page, the canvasser offers assistance with verifying the information or logging into the account.
Firms also receive a standard marketing postcard with free Yelp advertising credits on the front and
a blank canvas on the back (Appendix Figure A.1).
 Businesses assigned to treatment additionally receive a personalized competitor pricing report on
the back of the marketing postcard (Figure 1). The postcard displays the firm’s regular manicure
price compared to its nine geographically closest competitors.13 It also lists the name of each
competitor and the exact price it charges.14 In order to further facilitate comprehension, the postcard
displays the name of the business at the top with a summary description, which is algorithmically
generated to take one of four versions: (1) You charge the lowest/highest price in the area. [If
applicable: n businesses charge the same price.] (2) Most businesses nearby charge higher/lower prices
than you. n businesses charge less/more. (3) Most businesses nearby charge the same or higher/lower
prices as you. n businesses charge less/more. (4) Most/All businesses nearby charge the same price as
you.
 Every canvasser is trained using a standardized script. Team managers in the four cities and I
trained each canvasser individually, guiding each canvasser through at least three hours of practice
with the script and detailed data recording steps, followed by a few hours of canvassing visits together
to confirm correct execution. A phone application records the canvasser’s location and date stamp for

13
 The nine geographically closest competitors are determined using the full sample of verified businesses in the area,
based on longitude and latitude coordinates. This means that information on businesses not in the experimental sample
are included in these postcards.
14
 This image was extensively piloted prior to the experiment on nail salons in Boston (outside of the experimental sample)
to ensure that business owners and managers could easily understand the information.
 8
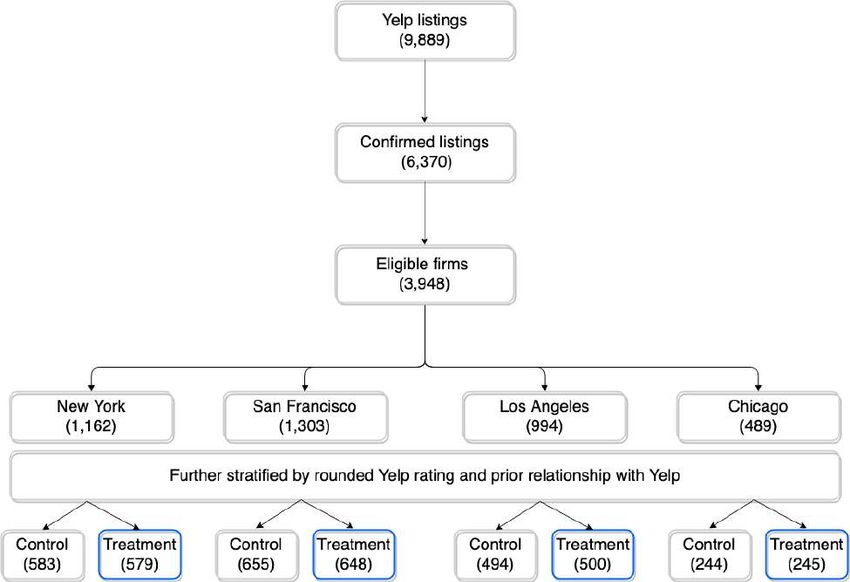
the business visit. Canvassers are instructed to follow up with a business up to three times if they are
not able to speak with a manager or owner. If they are still unable to do so by the third visit,
canvassers leave the brochure and postcard, and provide a contact number for any questions. They
record descriptions of each interaction they have with businesses, such as whether they are able to
speak with someone or asked to come back at another time.
 Canvassers are not informed of the experiment or experimental conditions. Approximately two to
five canvassers work in each metropolitan area at any given time. They are assigned to one form of
canvassing (either control or treatment) to begin, and transition to the other canvassing type after a
few weeks, with the explanation that Yelp is trying different ways to canvass. No canvasser performs
both types of canvassing during the same period or switches more than once between canvassing
types, in order to avoid the possibility that the canvasser may confuse the protocol.

3.2 Sample definition, randomization, and timing

 To determine the eligible set of businesses for the experiment, all nail salon listings on Yelp across
the San Francisco Bay Area, New York City, Los Angeles, and Chicago are verified via phone calls.
Firms in the eligible set are randomly assigned to control or treatment, stratified on the metropolitan
area, prior relationship with Yelp, and Yelp rating. Between June and November 2018, Yelp canvassers
strive toward visiting all businesses in this set, sequencing visits by neighborhood such that a full
neighborhood is finished out before moving to the next. Yelp canvassers reach 3,474 businesses, which
results in an experimental sample of 3,218 firms.15
 The San Francisco Bay Area, New York City, Los Angeles, and Chicago are chosen as the markets
for intervention, based on (i) the presence of Yelp offices to leverage the canvassing effort; (ii) the
number of nail salons in the area to allow for a sufficiently large sample; and (iii) coverage of Yelp to
obtain robust data on businesses. I identify ZIP codes within these areas16 and extract all nail salon
listings on Yelp in these ZIP codes, which results in a set of 9,889 nail salons.
 I call every business in this set and use Google Maps Streetview to confirm they are open, offering
nail services, correctly located, and not a duplicate business. Any business that is not listed in Yelp’s
sales database is dropped (302 salons, or 3% of the extracted list), which serves as an additional
screen to ensure the business is open and has the contact information required for data collection. I
also drop any salons that are not physically located in one of the four markets (including mobile
businesses), as well as businesses located inside airports. This process results in a sample of 6,370 nail
salons across these areas.
 Any salons with Yelp ratings of 1 to 2.5 stars (out of 5) are excluded, in order to maximize the
likelihood of compliance to treatments.17 This sample restriction is imposed because businesses with
ratings lower than three stars are more likely to have antagonistic stances against Yelp, which can
reduce the likelihood that the business complies to treatment by being receptive to a Yelp canvasser

15
 256 were identified as duplicates or permanently closed by the time of visit.
16
 For the San Francisco Bay area, I identified ZIP codes in cities with more than 50,000 people across the greater Bay
area.
17
 Treatment information on competitor pricing, as well as measures of competition, are not subject to this restriction. I
take the full set of verified firms to determine the nearest competitors.
 9
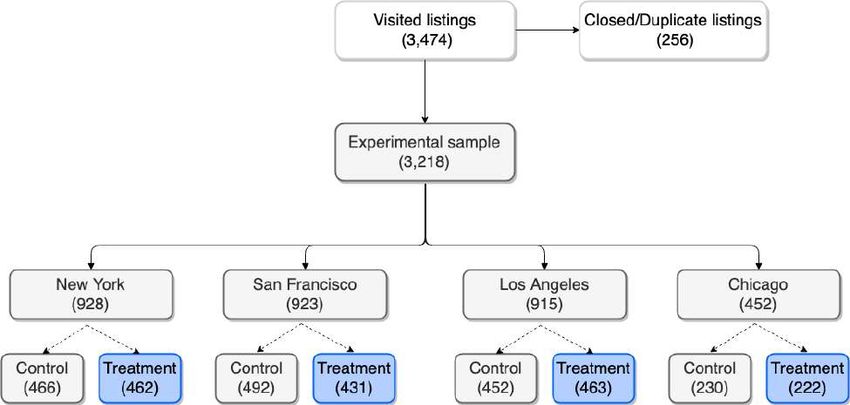
and any information that the canvasser delivers. To the extent that these lower-rated firms that are
excluded are also less likely to know competitor information and to have set their prices conditioning
on their competitors’, the experimental sample may provide a stronger test for the impact of
competitor information. This sample restriction results in an eligible set of 3,948 businesses, which
represents 62% of the full set of salons.
 The resulting eligible set of 3,948 businesses represents the goal that Yelp canvassers strive toward
reaching, which is subject to a few constraints.18 First, while all 3,948 businesses are verified to be
open and unlikely to be a duplicate at the time of randomization in May 2018, canvassers may arrive
at the business to discover that the business either no longer exists or is a duplicate of another listing.
Second, Yelp has a fixed canvassing budget and timeline, by the end of which canvassing operations
must terminate even if all 3,948 businesses have not yet been visited.
 Businesses in the eligible set are assigned to experimental groups through a stratified
randomization process using its metropolitan area, prior relationship with Yelp, and Yelp rating
rounded to the nearest multiple of 0.5.19 These variables are chosen based on a number of reasons.
Metropolitan areas may have different dynamics of competition due to variation in business density
as well as customer tastes, which could determine how the business responds to information on
competitors. Prior relationship with Yelp, which defines whether a business has claimed its free
business page on Yelp and/or previously advertised with Yelp, and prior Yelp rating are likely to be
correlated with key firm attributes and determine the business’s receptiveness to Yelp canvassers and
any information that they might provide. Within each stratum, firms are randomly assigned to one
of two experimental groups, control or treatment. 1,972 firms are assigned to treatment, and 1,976
firms are assigned to the control group (Figure 2).20
 To ensure that the resulting experimental sample is approximately balanced in the timing of visits
across experimental groups, canvassers are assigned to finish all visits across control and treatment
firms within a neighborhood before moving on to their next neighborhoods.
 Between June 18 and November 18 of 2018, canvassers reached 3,474 businesses. 256 are identified
as duplicates or closed by the time that they visit, resulting in an experimental sample of 3,218 firms
(Figure 3). All firms in Los Angeles and Chicago are reached, and most firms in New York and San
Francisco are reached, excluding the farther out areas (Bronx and outer areas of Queens for New York
and North Bay for San Francisco) (Appendix Figures A.2 and A.3).

3.3 Balance, attrition, and non-compliance

18
 Power calculations suggested that this sample size would be sufficient to detect standardized effect sizes of 0.09 for all
treatment and control firms with 80% power.
19
 Stratified randomization ensures that treatment and control groups are similar not just in expectation, but also in
practice in the sample along important observable dimensions. It can also improve precision to the extent that these
variables explain the variation in the treatment of interest (Cox and Reid 2000, Duflo, Glennerster, and Kremer 2007).
20
 Stratified randomization was done using Stata.
 10
Firms are well-balanced across experimental conditions. Control and treatment firms in the same
neighborhood are visited approximately at the same time, but treatment firms appear to slightly lag
behind control firms.21 Non-compliance and attrition rates are low.
 Table 1 shows summary statistics across all baseline characteristics of firms in the experimental
sample.22 The average baseline price is $13.88 and ranges from $5.00 to $60.00.23 At the time of visit,
data collectors observe an average of 4 employees and 4 customers, which range from 1 to 25 and 0
to 30, respectively. 75% of salons have availability between 4-5pm the next day.
 Table 2 shows that across baseline variables, control and treatment firms are well-balanced. In
two variables out of 16, control and treatment firms appear to be statistically different. The difference
in luxuriousness is small and is likely explained by missing observations due to business closures at
the time of data collector visits, but the timing of canvassing visits appears to be delayed among
treatment firms by approximately 1.4 weeks. Given the importance of this variable, I control for the
week of the canvassing visit in all specifications, and further explore this potential issue in robustness.
 Non-compliance rates are low. Fewer than 2% of firms (58) are marked as non-compliant, which
manifests in the form of firms rejecting any conversations with Yelp canvassers when they arrive at
the business (Appendix Table A.1). In these cases, neither control nor treatment firms receive any
information from the canvasser.
 I observe similarly low levels of attrition. Attrition stems from both firm closures, which is unlikely
to be influenced by treatment, as well as firms that cannot be reached after canvassing visits.
Approximately 5% of firms in the sample permanently close during the 12-month period. 1% of firms
(36) in the sample are unreachable for any data after canvassing visits. Neither type of attrition varies
significantly across experimental groups.

4 Measuring firms’ knowledge, positioning, and performance

 I construct a data set of firm knowledge, price positioning relative to quality, and performance
over a 12-month period between May 15, 2018, to September 15, 2019 (timeline shown in Appendix
Figure A.4). Firms’ prior knowledge of competitors is collected by Yelp canvassers who ask questions
to treatment firms prior to providing treatment. Measures of firms’ price positioning are collected via
phone calls and physical visits to all businesses by data collectors at baseline and endline. Data from
the Yelp platform, supplemented by city government tax records (to be received in summer 2020),
provide proxies of firm performance. In order to ensure accuracy, canvassers and data collectors remain

21
 There was no one clear reason for this lag. One possible reason is that there were times where a canvasser had to take
a break due to personal reasons or it took longer to fill a canvasser role, leading to odd numbers of canvassers, which may
have driven idiosyncratic differences. Another reason is that anecdotally, treatment canvassers sometimes had a harder
time speaking with the owner or manager, as they had to ask questions before providing information, and were asked to
come back at a different time. Due to the importance of this variable, I control for the week that each firm was visited in
all specifications.
22
 Data collectors were sometimes not able to visit the salon due to closure upon multiple tries, or due to security at
reception, leading to varying numbers of observations across variables.
23
 Across the full set of verified salons, regular manicure prices range from $5 to $150.
 11
blind to treatment assignment, and 5% of all hand-collected data is verified by an independent data
collector, with any conflicts sent to a third data collector.

4.1 Measuring stated positions and knowledge of competitors

 Firms’ own descriptions of their positioning and knowledge of competitors are collected by Yelp
canvassers during their visits. Treatment businesses are asked a set of questions before and after
treatment. Prior to information delivery, canvassers ask, (1) “What do you think sets you apart from
your competitors?” followed by (2) “Who do you consider as your primary competitors?” and (3)
“What do you think they charge for a regular manicure?”. Canvassers then deliver the competitor
information treatment and ask, “Would you like to continue receiving this information?” to determine
whether businesses find the information valuable. Canvassers record answers to these questions as
close to verbatim as possible.
 In order to ensure accuracy, canvassers remain blind to experimental assignment and hypotheses,
and managers are not aware that they were being assessed as part of an experiment. Furthermore,
canvassers’ data entry and performance are monitored on a daily basis.
 All answers are read and coded by two independent research assistants. Both research assistants
first independently read a few hundred responses to understand potential categories of answers, and
compare notes to arrive at a list of categories. They then individually assign each answer to one of
the categories. Any conflicts are sent to a third research assistant to resolve.

4.2 Measuring price positioning relative to quality

 Data on price positioning are collected by a team of ~50 data collectors who make calls and visits
to businesses.24 All data collectors are blind to experimental assignments, and are assigned to collect
data on control and treatment businesses by neighborhood in order to ensure balance between
experimental groups. To ensure data validity and accuracy, data collectors are given detailed scripts
and evaluation rubrics, have a subset of their data validated by another independent data collector,
and in the case of visits, take photos of menus, interiors, and exteriors to validate their coding. Their
performance in terms of accuracy and productivity is tracked on a weekly basis, as well as their
location and time of visit.
 Price positioning is measured by the price of a regular manicure, collected via calls made to all
businesses on a monthly basis between May 2018 and May 2019. Data collectors ask for the price of
a regular manicure without taxes or cash discounts. In a subset of the months, prices of other services
(pedicure, manicure and pedicure combination) are also collected.25

24
 Data collectors were undergraduates and Masters students recruited using job postings across every university in the
four cities that were posted every 3-6 months. They were selected after an interview asking questions about data validity
and collection methods. Over the course of the project, ~83 data collectors were hired.
25
 Data collectors also note whether the phone number is no longer in service, no one answers, nail services are no longer
offered, business is permanently closed, or business refuses to provide prices over the phone. Due to these reasons, data
collectors were not able to obtain a price every month for each salon, resulting in an unbalanced panel.
 12
These pricing data are validated in two steps. First, the full list of salons is divided among data
collectors, where 5% of the data are additionally allocated to another data collector as a quality check.
Second, once all data collectors submit their data, any observations with a business closure or
unreachable flag, conflict in prices or open status across two data collectors, or a mismatch between
the name and identifier are reassigned to data collectors. This second step is repeated up to three
times in each month.
 Quality is measured by coding the level of nail polish brands used, the cleanliness of the interior,
and the luxuriousness of the décor, observed via physical visits to each business at baseline (May –
August 2018) and endline (May – September 2019). While reviews and photos on Yelp may potentially
provide a subset of these data points for some businesses, they are collected at different points in time
and missing for a large percentage of businesses in the sample, so physically visiting businesses to
collect this data within a few months improves the collection of accurate and comparable measures.
 In order to ensure standardization and accuracy of scoring, data collectors use an evaluation rubric
to code quality metrics, and their coding is validated through a number of validation checks. For nail
polish brands, data collectors are given a list of nail polish brands classified into low, medium, and
high according to their retail price per bottle (low: below $10; medium: between $10-$20; high: above
$20). They are instructed to select the highest level of polish brand they observe, as most firms use
some proportion of the lowest-cost brands. They record any brands they observe that are not present
on this list, which are then coded ex-post using their retail prices. For cleanliness and luxuriousness,
data collectors are given a rubric of metrics to guide their coding, detailed in Table 3. Data collectors
are also required to take photos of the interior, polish brands, menu, and exterior to ensure accuracy,
and 5% of each data collector’s photos are checked every week. Approximately 5% of firms are assigned
to an additional independent data collector to validate quality measures.26 Data collectors’ accuracy
and productivity are tracked on a weekly basis, and the data entry application records their location
and time of visit.
 During these visits, data collectors also collect additional data on businesses’ opening hours,
promotions, and the number of employees and customers at the time of the visit.

4.3 Measuring performance

 Firm performance is measured using a variety of proxies: purchase intentions from the Yelp
platform, next-day availability between 4-5pm via phone calls, and sales in one city as measured by
San Francisco government’s sales tax data.
 My main proxies of performance are collected on the Yelp platform, which measures purchase
intentions for each business based on consumer search patterns. I construct monthly measures of
business performance, based on the number of unique views of the business page, the number of calls
made to the business, and the number of views of map directions to the business – which prior studies
have mapped to firm revenues (e.g. Luca 2016, Dai et al 2018). Changes in price or quality may lead
these measures to increase through a few possible mechanisms. First, the search results page indicates

26
 Any data collectors above a threshold accuracy level was replaced immediately, but discrepancies were extremely rare,
and only two data collectors were dismissed.
 13
approximate price levels for each firm, and also highlight some review text that often elaborates on
price or quality details. Second, many firms post their prices on windows and are viewable from the
outside, and customers frequently walk in from the street. If changes in decisions lead more passersby
to be interested in the firm, they may search for it on Yelp, increasing the firm’s page views, and
possibly call to confirm a detail without going in, which may increase its call volume.
 While these proxies are available for all firms on a monthly basis, they have two key limitations
in capturing effects on performance. First, they capture consumers’ purchase intentions (particularly
through the Yelp platform), and do not reflect actual sales. Second, while these measures may reflect
demand among customers who search, they are not as likely to capture demand among regular
customers.
 To overcome these limitations, I complement these measures with additional proxies of
performance. During monthly phone calls, data collectors ask if there is availability for an appointment
the next day between 4-5pm27, a peak hour for salons, and record a binary answer. This measure
captures both searching customers as well as regular customers.
 I also collect data from city government databases on business registration, licensing, and tax.
Firm and owner attributes are extracted from city government databases on business registration and
licensing data. I work with the government of San Francisco to analyze business sales data from tax
records, which will be available in summer 2020 due to the tax cycle.

5 The landscape of firms’ competitor knowledge and positioning

 Baseline measures suggest that many firms may lack competitor knowledge, including those that
face higher levels of competition. Over 46% of treatment firms are not able to state specific competitors
and their prices prior to receiving information on competitor prices. Consistent with this evidence,
firms’ observed pricing positions display dispersion within each level of quality and exhibit
discrepancies with firms’ stated price-quality positions.

5.1 Baseline competitor knowledge

 When asked by canvassers prior to treatment who they consider as primary competitors, 46% of
firms are not able to state their primary competitors (Figure 4(a)). These firms respond that they do
not know which businesses are their primary competitors, or that it has been a while since they looked
at other businesses to be able to state specific competitors. Canvassers classify any answers that
appear to be brush-offs as “did not answer” based on the firms’ disinterest in answering follow-up
questions or continuing the conversation, which constitutes 6% of responses.28

27
 In order to prevent any suspicion across salons, the specific time was changed on a monthly basis (e.g. 4pm in January,
4:45pm in February).
28
 This low brush-off rate may possibly be driven by the fact that Yelp was providing free assistance and information on
these visits, as well as the general perception by many retail businesses that Yelp is important for their sales and may
hold sway over their consumer ratings.
 14
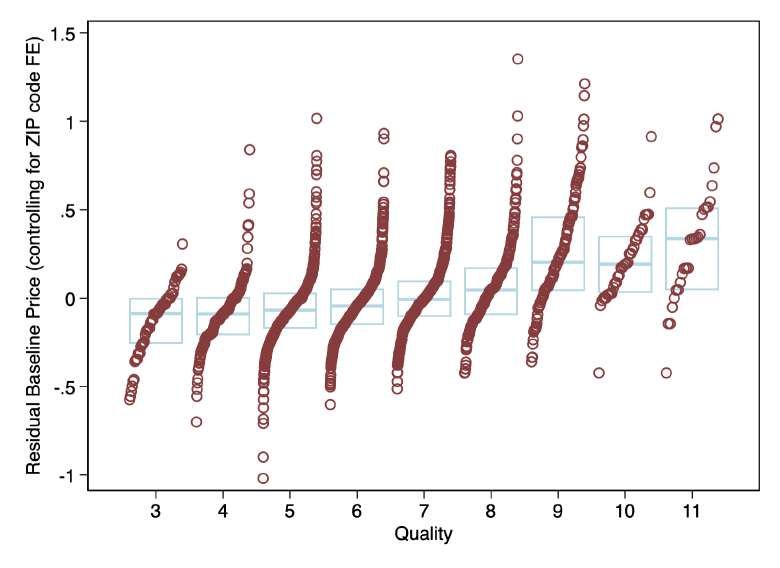
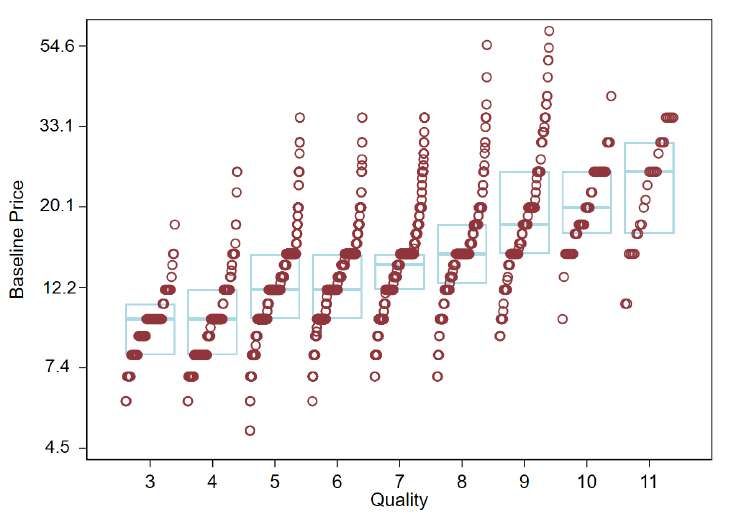
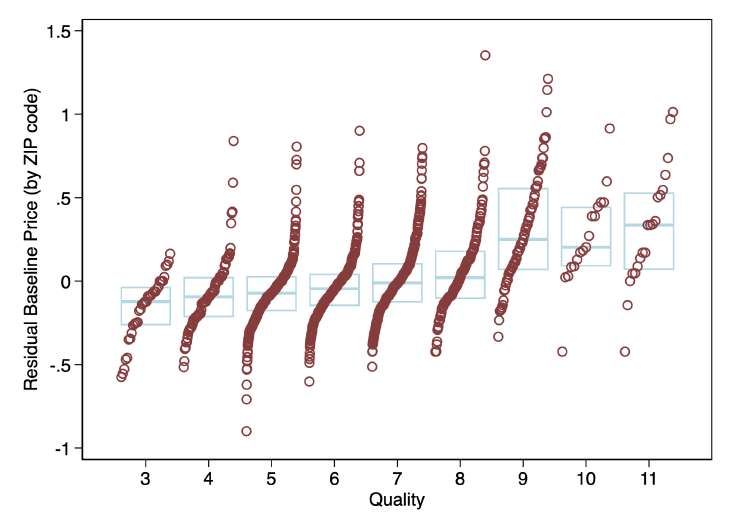
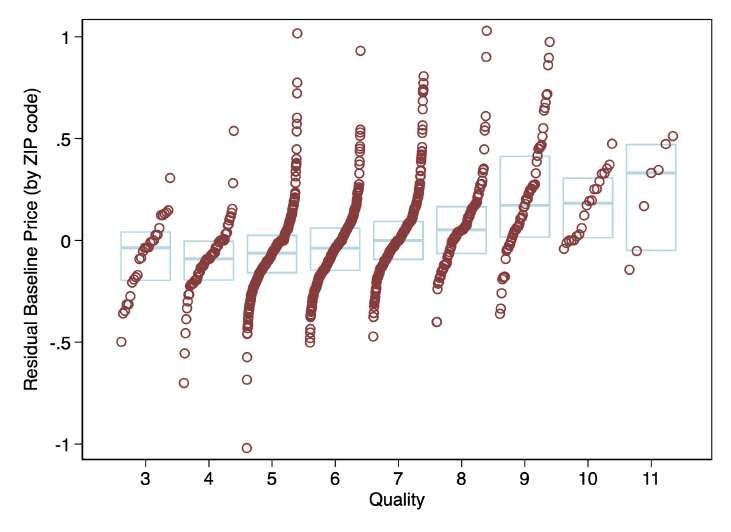
Among firms that are able to answer, the largest category of firms (21%) consider all salons nearby
to be competitors (see Appendix Figure B.1 for further details on this category of responses). This
lends credence to geographical distance being a key factor determining competitors, consistent with
findings across other industries (Baum and Lant 2003). The geographic distance considered varies
across salons: 55% state that nearby salons in walking or driving distance are competitors, 21%
consider all salons in the neighborhood or city as competitors, 15% refer to salons on the same block,
and 15% state salons within a few blocks from them. 16% of firms mention specific salons. 2% mention
a type of salon (e.g. Japanese nail art salons). 9% of salons state that they have no competitors.
Similarly, 58% of firms are not able to state the prices that their primary competitors charge (Figure
4(b)). 21% of firms state that they believe competitors charge similar prices, while 8% and 6% state
more or less, respectively. 1% state that they do not care what competitor prices are.
 Surprisingly, firms that are not aware of their primary competitors and their prices remain across
those that face higher market competition. The level of competition is measured by the firm’s distance
from its geographically nearest competitor, as well as the baseline price dispersion across its
geographically nearest 9 competitors, across the full set of verified salons in the cities beyond the
experimental sample.29 These set of measures are robust to adjusting for variation across cities such
as density. Across both of these indicators, fewer firms in more competitive markets with closer nearby
competitors and lower market price dispersion appear to lack knowledge of their competitors or their
prices, as expected (Appendix Figures B.2 and B.3).30 However, the difference in percentage between
firms facing above and below median competition is not large, and a substantial percentage of firms
across more competitive markets still display a lack of awareness. The lack of awareness also persists
across firms with below and above median size (number of employees), age, and price points (Appendix
Figures B.4 – B.6).
 While these responses suggest that many firms may not be aware of their competitors even when
facing higher levels of competition, they are based on stated responses, and may potentially overstate
the percentage of firms that are not aware of primary competitors’ positions. I explore additional
evidence of baseline price positions to provide a more complete picture of the baseline landscape
before analyzing experimental results on the impact of competitor information.31

5.2 Dispersion in baseline price positioning

 Consistent with the interpretation that firms may lack knowledge of their competitors, firms
display dispersion in their price positioning across the similar levels of quality. On average, firms with
higher quality charge higher prices (Figure 5(a)). Quality represents a sum of the firm’s polish brand

29
 The experimental sample excludes salons with 1-2.5 stars for Yelp ratings. However, both the treatment information
and measures of competition are determined using the full sample of verified businesses in the area to identify the
geographically closest competitors based on longitude and latitude coordinates.
30
 From this point onwards, I only show results for distance from the nearest competitor when referring to competition
levels, but all results are robust to using the baseline price dispersion measure (which can be found in the appendix).
31
 I further explore measures of competitor knowledge using incentivized responses to questions on competitor knowledge
at endline.
 15
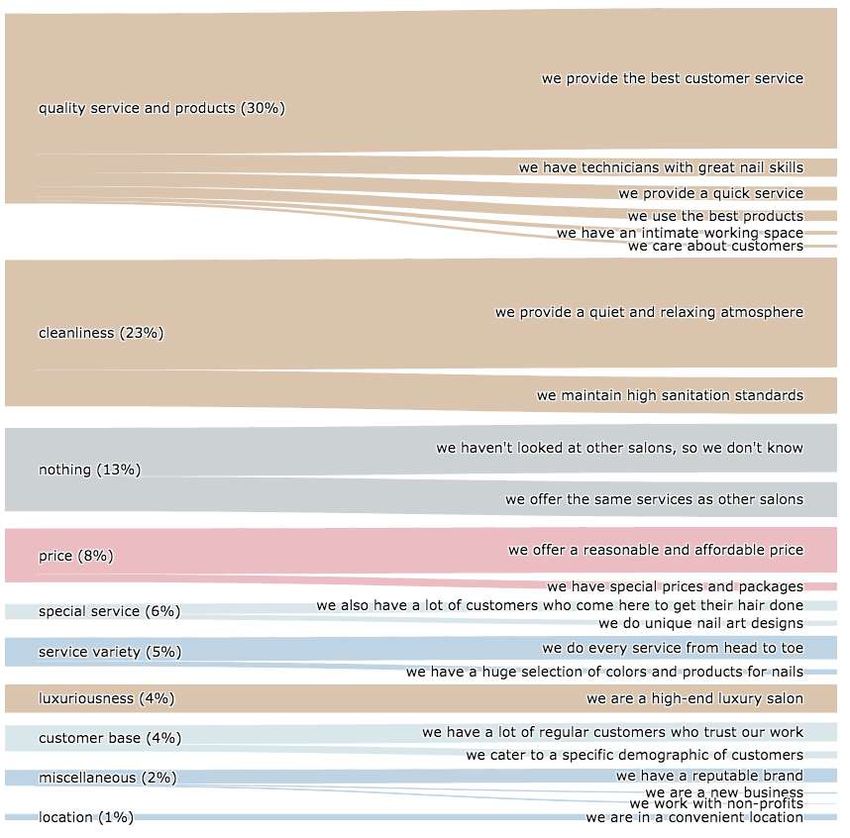
level, cleanliness, and luxuriousness, and ranges from 3 (lowest quality) to 11 (highest quality).32 This
positive correlation suggests that despite the inevitable noise present in the quality measures,33 they
capture some signal of offered quality, and is robust to using a standardized sum of polish brands,
cleanliness, and luxuriousness, as well as each individual measure alone (Appendix Figure C.1 and
C.2).
 However, firms display a large dispersion in their pricing. Figure 5(b) plots the same figure as
Figure 5(a), but shows every firm observation within each quality level sorted by price, along with
the interquartile range. The coefficient of variation in price across all observations is 37.8%. Within
each quality level, the coefficient of variation in price ranges from 22.2% to 47%. Strikingly, at $15 for
a regular manicure, firms offer the entire range of quality. This dispersion persists when controlling
for ZIP code fixed effects (Appendix Figure C.3). The largest dispersion in price positioning can be
observed in the middle of the quality distribution, relative to those offering the lowest or highest levels
of quality and price.34 Consistent with results on baseline competitor knowledge, this dispersion
remains across firms that face higher levels of competition (Appendix Figure C.4).
 While consistent with widespread evidence of price dispersion across many other contexts such
across general retail (Lach 2002), prescription drugs (Sorensen 2000), gasoline (Lewis 2008), as well
as online consumer goods markets (Brynjolfsson and Smith 2000, Baye, Morgan, and Scholten 2004,
Ellison et al 2018), this dispersion in prices may be explained at least in part by other firm attributes
such as the level of customer service, the use of discounting from posted prices, as well as the noise
present in quality measures.

5.3 Discrepancies between firms’ observed and stated positions

 Consistent with the interpretation that firms lack knowledge of their competitors and are dispersed
in their positioning relative to other firms, many firms’ observed positions do not match their stated
positions. Firms provide varying descriptions of their positioning, which can be categorized into five
broad types, loosely based on Porter’s (1980) “generic strategies”: low price, quality differentiation,
horizontal differentiation, focus, and “stuck in the middle” (or according to firms’ own descriptions,
“nothing”). Figure 6 shows the descriptions that treatment firms provide of their positioning prior to
treatment, prompted by the question, “What sets you apart from your competitors?”.35 The largest
category of answers maps to quality differentiation: offering quality service and products (30%) or
cleanliness (23%). The second largest category (13%) is “nothing”, which includes answers like “we
haven’t looked at other salons, so we don’t know,” or “we offer the same services as other salons.” The

32
 As described in Section 4.2, polish brands range from 1 to 3 based on retail price per bottle, and cleanliness and
luxuriousness are rated on a scale of 1 to 4.
33
 Noise may arise from variation in the date and time of the canvasser visit, as well as variation across canvassers –
despite the measures taken using rubrics and data validation to increase accuracy. Furthermore, there may be measures
of quality that are not captured in these, such as the level of customer service or friendliness.
34
 The same pattern can be observed when plotting by a standardized sum of each quality measure, or each individual
measure of quality alone.
35
 As described in Section 4, each answer was coded by two independent research assistants. Any conflicts were sent to a
third independent research assistant who resolved the conflict.
 16
You can also read