REPUBLIC OF ARMENIA FISCAL TRANSPARENCY EVALUATION - International Monetary Fund
←
→
Page content transcription
If your browser does not render page correctly, please read the page content below
IMF Country Report No. 19/134

           REPUBLIC OF ARMENIA
           FISCAL TRANSPARENCY EVALUATION
May 2019
           This Fiscal Transparency evaluation on the Republic of Armenia was prepared by a staff
           team of the International Monetary Fund. It is based on the information available at the
           time it was completed in January 2019.

                             Copies of this report are available to the public from

                             International Monetary Fund • Publication Services
                                   PO Box 92780 • Washington, D.C. 20090
                              Telephone: (202) 623-7430 • Fax: (202) 623-7201
                           E-mail: publications@imf.org Web: http://www.imf.org
                                        Price: $18.00 per printed copy

                                    International Monetary Fund
                                          Washington, D.C.

           © 2019 International Monetary Fund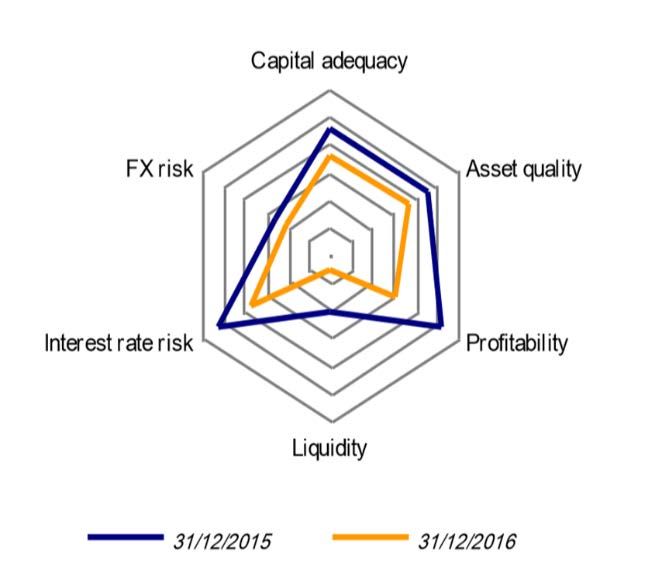

F I S C A L           A F F A I R S              D E P A R T M E N T

Republic of Armenia
Fiscal Transparency Evaluation

Johann Seiwald, Fazeer Sheik Rahim, Viera Karolova, John Zohrab, Vahram Janvelyan,
and Eivind Tandberg

                                   January 2019
CONTENTS

GLOSSARY _______________________________________________________________________________________ 6

PREFACE _________________________________________________________________________________________ 7

EXECUTIVE SUMMARY __________________________________________________________________________ 8

I. FISCAL REPORTING __________________________________________________________________________ 12
1.1. Coverage of Fiscal Reports __________________________________________________________________ 15
1.2. Frequency and Timeliness of Fiscal Reporting _______________________________________________ 21
1.3. Quality of Fiscal Reports _____________________________________________________________________ 23
1.4. Integrity of Fiscal Reports____________________________________________________________________ 25
Recommendations _______________________________________________________________________________ 27

II. FISCAL FORECASTING AND BUDGETING _________________________________________________ 31
2.1. Comprehensiveness of Budget Documentation _____________________________________________ 32
2.2. Orderliness __________________________________________________________________________________ 38
2.3 Policy Orientation ____________________________________________________________________________ 39
2.4 Credibility ____________________________________________________________________________________ 44
Recommendations _______________________________________________________________________________ 49

III. FISCAL RISKS _______________________________________________________________________________ 52
3.1. Risk Disclosure and Analysis _________________________________________________________________ 53
3.2. Fiscal Risk Management _____________________________________________________________________ 57
3.3. Fiscal Coordination __________________________________________________________________________ 68
Recommendations _______________________________________________________________________________ 72

BOXES
1.1. Good Practices for Statistical Revisions ______________________________________________________ 25
2.1. Ministry of Labor and Social Affairs Employment Services Program _________________________ 42
2.2. The Swedish Fiscal Policy Council – Effective Despite a Low Budget _________________________ 44
2.3. Forecast Reconciliation ______________________________________________________________________ 48
3.1. Determining a Robust Budget Reserve Framework __________________________________________ 58

FIGURES
1.1. Coverage of Public Sector Institutions in Fiscal Reports _____________________________________ 16
1.2. Public Sector Balance Sheet Coverage in Fiscal Reports, 2016 _______________________________ 19
1.3. Public Sector Gross Liabilities in Selected Countries _________________________________________ 19
1.4. Public Sector Net Worth in Selected Countries ______________________________________________ 20
1.5. Tax Expenditures in Selected Countries ______________________________________________________ 21
1.6. Periodicity and Timeliness of Budgetary Reports by SDDS Subscribers ______________________ 22
1.7. Timeliness of Annual Fiscal Reports in Selected Countries ___________________________________ 22

                                                  3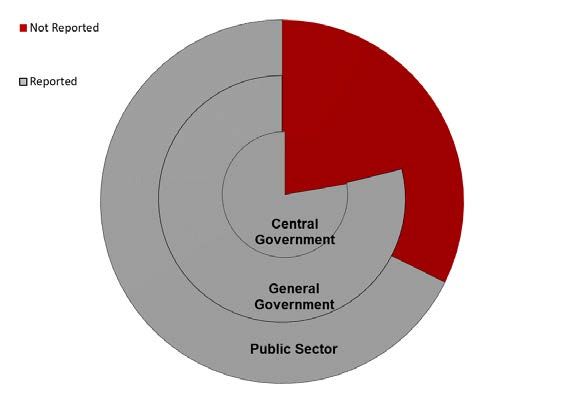
1.8. Stock-flow Adjustment, 2016 ________________________________________________________________ 24
1.9. Net Lending/Borrowing for the General Government as Reported in GFMS 2001
and SNA 2008 ___________________________________________________________________________________ 27
2.1. Composition of Revenue of EBAs ____________________________________________________________ 33
2.2. Own-Source Revenues in Selected Countries ________________________________________________ 33
2.3. Real GDP Forecasts __________________________________________________________________________ 34
2.4. Inflation Forecasts ___________________________________________________________________________ 34
2.5. Forecast Errors for Real GDP by Forecasters _________________________________________________ 34
2.6. Budget Ceiling vs. Ceiling in Same Year MTEF _______________________________________________ 35
2.7. Cross-Country Comparison: Average Medium-Term Fiscal Forecast Error in Selected
Countries, 2007–16 ______________________________________________________________________________ 36
2.8. Public Investment in Selected Countries _____________________________________________________ 38
2.9. The Evolution of Fiscal Rules_________________________________________________________________ 40
2.10. Deficits and the Deficit Rules _______________________________________________________________ 41
2.11. Debt and the Debt Rules ___________________________________________________________________ 41
2.12. Forecast Comparison for Real GDP _________________________________________________________ 45
2.13. Revisions to Budget (excluding EBAs) ______________________________________________________ 46
2.14. Spending Authorized Outside of the Budget Law __________________________________________ 46
2.15. Average Number of Supplementary Budgets in Selected Countries ________________________ 47
3.1. Cross-Country Comparison: Volatility of Nominal GDP, Exchange Rate and Government
Revenue in Selected Countries ___________________________________________________________________ 54
3.2. Factors Behind the Change in Public Sector Debt____________________________________________ 55
3.3. Macro-Sensitivity Analysis of Public Debt____________________________________________________ 55
3.4. Projected Health Care Costs in Selected Countries __________________________________________ 57
3.5. Projected Pension Costs in Selected Countries ______________________________________________ 57
3.6. Cumulative Use of Reserve Fund ____________________________________________________________ 58
3.7. Reserves - Large vs. Small Spending Items __________________________________________________ 58
3.8. Exchange Rate Volatility and Foreign Exchange Denominated Debt in Selected Countries __ 59
3.9. Government Guarantees in Selected Countries (2014) _______________________________________ 61
3.10. PPP Capital Stock in Selected Countries ____________________________________________________ 62
3.11. Cross Country Comparison: Non-equity Liabilities of the Financial Sector in Selected
Countries ________________________________________________________________________________________ 65
3.12. Banking Stability Map ______________________________________________________________________ 65
3.13. NPLs in Market Segments __________________________________________________________________ 65
3.14. Average Annual Loss (AAL) and Probable Maximum Loss (PML) from Natural Disasters in
Selected Countries _______________________________________________________________________________ 68
3.15. Size and Self-Reliance of Sub-National Governments in Selected Countries________________ 69
3.16. Profits of Public Corporations (2016) _______________________________________________________ 71
3.17. Government Support to Public Corporations _______________________________________________ 71
3.18. Liabilities of Armenian Public Corporations ________________________________________________ 71
3.19. Liabilities of Public Corporations in Selected Countries_____________________________________ 71

                                                  4
TABLES
0.1. Summary Assessment Against the Fiscal Transparency Code ________________________________ 11
0.2. Public Sector Financial Overview, 2016 ______________________________________________________ 12
1.1. List of Fiscal Reports _________________________________________________________________________ 14
1.2. Public Sector Institutions and Finances, 2016 ________________________________________________ 15
1.3. Spending by Economic Type, including and excluding SNCOs_______________________________ 23
1.4. Summary Evaluation: Fiscal Reporting _______________________________________________________ 30
2.1. Major Laws Related to Budgeting ___________________________________________________________ 32
2.2. Reports Related to Budgeting _______________________________________________________________ 32
2.3. Dates for Draft Budget Submission and Approval 2014 – 18 ________________________________ 39
2.4. Summary Evaluation: Fiscal Forecasting and Budgeting _____________________________________ 51
3.1. Reports Related to Fiscal Risks_______________________________________________________________ 53
3.2. Specific Fiscal Risks __________________________________________________________________________ 56
3.3. Financial Assets and Liabilities Central Government _________________________________________ 60
3.4. Current PPP Contracts _______________________________________________________________________ 62
3.5. Financial Indicators for the Financial Sector__________________________________________________ 64
3.6. Summary Evaluation: Fiscal Risks ____________________________________________________________ 74

APPENDICES
I. Government Fiscal Transparency Action Plan (2018–21) _______________________________________ 75
II. Technical Note on Table 0.2 ___________________________________________________________________ 83
III. Estimation of Specific Fiscal Risks _____________________________________________________________ 87

                                                   5
GLOSSARY

ABL         Annual Budget Law
ADS         Armenia Development Strategy
AMD         Armenian Dram
APSAS       Armenian Public Sector Accounting Standards
BSL         Budget System Law
CBA         Central Bank of Armenia
CJSC        Closed Joint Stock Company
CoA         Chamber of Audit
CoC         Chamber of Control
COFOG       Classification of Functions of Government
DEG         Deutsche Investitions-und Entwicklungsgesellschaft
DMOSB       Department for the Management of Obligations to the State Budget
DSA         Debt Sustainability Report
EBRD        European Bank of Reconstruction and Development
EIB         European Investment Bank
EITI        Extractive Industries Transparency Initiative
FAD         Fiscal Affairs Department
FRAD        Fiscal Risk Assessment Division
FRS         Fiscal Risk Statement
FTC         Fiscal Transparency Code
FTE         Fiscal Transparency Evaluation
GDP         Gross Domestic Product
GFSM 2001   Government Finance Statistics Manual 2001
GIZ         Gesellschaft für Internationale Zusammenarbeit
INTOSAI     International Organization of State Audit Institutions
IPSAS       International Public Sector Accrual Standard
ISA         International Standards of Audit
LPD         Law on Public Debt
MoF         Ministry of Finance
MoLSA       Ministry of Labor and Social Affairs
MNCO        Municipal Non-Commercial Organizations
MTEF        Medium-Term Expenditure Framework
NPL         Non-Performing loans
NSS         National Statistics Services
PFM         Public Financial Management
PPP         Public-Private Partnership
SNA         Standards of National Accounts
SNCO        State Non-Commercial Organizations
SPMD        State Property Management Department
TSA         Treasury State Account
UNISDR      United Nations Office for Disaster Risk Reduction

                                            6
PREFACE
A technical mission from the Fiscal Affairs Department (FAD) of the International Monetary Fund
(IMF) visited Yerevan, Armenia during the period March 28-April 10, 2018 to conduct a Fiscal
Transparency Evaluation (FTE). The mission was led by Mr. Johann Seiwald (FAD), and consisted
of Mr. Fazeer Sheik Rahim (FAD), Ms. Viera Karolova (STA), Mr. John Zohrab (Regional Advisor),
Mr. Vahram Janvelyan (local IMF Office), and Mr. Eivind Tandberg (short-term expert).

The mission met with Mr. Vardan Aramyan, Minister of Finance, Mr. Atom Janjughazyan, First
Deputy Minister; and Mr. Armen Hayrapetyan, Deputy Minister; and other senior officials from
the Ministry of Finance, including the Macroeconomic Policy Department; the Budget Block; the
Department for Financial Planning of Budget Expenditures; the Fiscal Risk Assessment Division
(FRAD); the Department for Monitoring Obligations to the State Budget (DMOSB); the Budget
Execution Reporting Department; the Public Debt Management Department; and the Public
Sector Accounting Methodology and Reporting Monitoring Department.

The mission also met with: Mr. G. Minasyan, Committee Chair, Financial-Credit and Budgetary
Affairs, Parliamentary office/committee; the Chamber of Control; the Ministry of Labor and Social
Affairs (MoLSA); the Department of Financial System Stability and Development, the Central Bank
of Armenia (CBA); the Ministry of Energy and Natural Resources; the State Property Management
Department; the National Statistics Service (NSS); the State Revenue Committee; the Department
of Investment Attraction and Coordination; and the Ministry of Economy.

The mission briefed representatives from the World Bank, the Gesellschaft für Internationale
Zusammenarbeit (GIZ), Asian Development Bank (ADB), and USAID on the findings and
recommendations of the mission.

The mission would like to express its appreciation for the open discussions and courtesy
extended by the authorities, in particular Mr. Eduard Hakobyan for his support throughout the
mission. The mission also thanks Ms. Yulia Ustyugova, IMF Resident Representative in Armenia;
and Resident Representative Office staff members, in particular Ms. Marina Aleksanyan, office
manager, for their substantive input into the work of the mission and much appreciated logistical
support. The mission would also like to express its appreciation to Mr. Khachatur Adumyan and
Ms. Lilit Simonyan for their excellent interpretation and translation services.

                                                7
EXECUTIVE SUMMARY
Armenia’s fiscal transparency practices have benefitted from public financial management
reforms over the last decade, and several planned reforms will bring further progress.
Fiscal forecasts and budgets have become more forward looking and policy oriented, with the
introduction of a medium-term expenditure framework (MTEF), improved fiscal objectives, and
a performance budgeting system. Fiscal risk disclosure, though fragmented, has gradually
improved, in particular, in macrofiscal risk assessment, and a PPP law is being drafted. The
accrual accounting reform will significantly improve the coverage and quality of the budget
execution reports and fiscal statistics that already provide timely and frequent information about
the financial position of the government.

Many elements of sound fiscal transparency practices are therefore in place. The report
presents the assessment of fiscal transparency practices against the IMF’s Fiscal Transparency
Code (FTC). Armenia meets the standard of good or advanced practice on 16 of the 36 principles,
and of basic practice on a further 14 principles (Table 0.1). Armenia’s fiscal transparency practices
have strengths and weaknesses in all areas of FTC: fiscal reporting, fiscal forecasting and
budgeting, and fiscal risk disclosure and management. Some of the main strengths are:

•   Publication of a monthly budget execution report within a month comprising multiple
    classifications, and financial statistics within 4 months for general government;

•   The presentation of a medium-term expenditure framework and annual budget, with
    comprehensive macro-economic forecasts, fiscal objectives, and performance information,
    submitted to parliament in a timely manner in accordance with provisions of the Budget
    System Law;

•   Analysis of the impact of alternative macroeconomic scenarios of public finances and a fiscal
    risk disclosure on specific fiscal risks in the different documents; and

•   Semiannual monitoring reports on the financial performance of public corporations provide
    aggregate and company-level data for most public corporations, and individual transfers
    between government and public corporations are disclosed in budget documents. SOEs are
    an important area of fiscal risks given that liabilities (15 percent of GDP) are high and
    profitability of the sector is weak.

At the same time, the evaluation highlights a number of areas where Armenia’s fiscal
transparency practices could be further improved:

•   No individual fiscal report provides a complete picture of the general government activity,
    and a number of loss-making public corporations (representing about 2 percent of GDP) may
    likely have to be reclassified into the general government sector but currently no
    market/non-market test is undertaken.

                                                 8
• Differences between fiscal balances reported in the statistical reports based on the GFSM
2014 and SNA 2008 are sizeable at 2.5 percent and deviations are not explained.
• The recent changes to the fiscal rules framework, which aimed at making them more flexible,
require efforts to strengthen credibility and ensure compliance. The Parliamentary Budget
Office does not have the function to conduct independent evaluation on compliance of
government fiscal forecasts and fiscal policy objectives. The large differences between same
year MTEFs and annual budgets (0.6 percent of GDP) are not well explained and properly
documented in the form of a reconciliation table.
• Current practices for extensive in-year changes to budget appropriations, can also undermine
the credibility of the budget. An average 8.6 percent of expenditure does not undergo
explicit legislative approval. This includes spending from extra-budgetary accounts that is not
budgeted for, the use of the Government Reserve Fund, and in-year revisions to budget
appropriations.
• Information on specific fiscal risks is fragmented, presented in various sections of the MTEF,
the annual budget documentation, and in several other documents. While comprehensive
risk analysis is published on financial liabilities (65 percent for general government), for
financial assets there is no published risk analysis though on-lending, inter-state loans, and
budgetary loans (26 percent) are subject to significant risks, in particular valuation risks.
• Risk assessment are only provided for two out of the four public-private partnerships (PPPs)
amounting to a capital stock of 10.2 percent of GDP a risk assessment, though important
information such as total rights and obligations are missing. A PPP law is under preparation
which should guide the management of the many projects planned.
Based on this evaluation, this report provides ten recommendations aimed at further
enhancing fiscal transparency in the areas prioritized. Specifically, these are:
1. Expand the institutional coverage of the budget execution to central government, and
statistical reports to general government by including non-market public corporations and
municipal non-commercial organizations;
2. Publish a balance sheet for central government, and expand its coverage to general
government;
3. Enhance consistency, comparability, and integrity of fiscal reporting by providing
reconciliation of key fiscal aggregates;
4. Ensure that introduction of the new accounting system improves comprehensiveness, quality,
and compatibility of fiscal reports;
5. Strengthen the MTEF and budget documentation by including a statement of compliance to
fiscal rules and reconciliation tables for revenue and expenditure in the MTEF and budget
message;
96. Strengthen independent evaluation by ensuring ex post compliance audit to fiscal rules by
the Chamber of Audit; and building technical capacity at the Parliamentary Budget Office, to
prepare for the medium-term role of the PBO to assess ex ante compliance in the draft
budget;
7. Reduce in-year revisions to the budget by including extra-budgetary accounts in the annual
budget; and introduce clear access criteria for the Government Reserve Fund;
8. Provide a consolidated fiscal risk summary (FRS) in the budget documentation, and assign
the responsibility for coordinating the FRS to a unit of the MoF;
9. Ensure that the legal framework for PPPs provides for a clear and comprehensive definition
of PPPs; and establish a legal limit on accumulated PPP obligations consistent with Armenia’s
fiscal rule; and
10. Extend reporting on public corporations to provide a more complete picture of their financial
performance, any conflicts of interest, and budgetary impacts.
The implementation of the recommendations will require some effort and the government
could benefit from capacity building from IMF and other TA providers. Annex I prioritized
and translates the recommendations into an action plan, sequenced over the period 2018–21.
The fiscal transparency evaluation also estimates Armenia’s public sector financial
position, in order to provide a more comprehensive view of public finances. It estimates
consolidated public sector expenditures of 45.7 percent of GDP, public sector asset holdings and
liabilities of around 108.8 and 109.1 percent of GDP, and a public sector net worth of 0.3 percent
of GDP in 2016 (Table 0.2). While the government sector deficit and net worth do not differ
substantially from the reported central government aggregates, overall public sector activities,
numbers are much higher.
The remainder of this report provides a detailed evaluation of Armenia’s fiscal
transparency practices against the standards of the FTC, and provides a set of
recommendations to address the main weaknesses. It is organized as follows:
• Chapter I evaluates the coverage, timeliness, quality, and integrity of fiscal reporting;
• Chapter II evaluates the comprehensiveness, orderliness, policy orientation, and credibility of
fiscal forecasting and budgeting;
• Chapter III evaluates arrangements for disclosure and management of fiscal risks.
Table 0.1 represents a summary of the Armenia’s performance against the FTC; Table 0.2 presents
a preliminary and partial estimate of the Armenia public sector financial overview for 2016.
10RATING
LEVEL OF
Not Met Basic Good Advanced
PRACTICE
RATING
LEVEL OF
High Medium Low
IMPORTANCE
Table 0.1. Armenia: Summary Assessment Against the Fiscal Transparency Code
II. Fiscal Forecasting & III. Fiscal Risk Analysis &
I. Fiscal Reporting
Budgeting Management
Coverage of Institutions Budget Unity Macroeconomic Risks
Coverage of Stocks Macroeconomic Forecasts Specific Fiscal Risks
Medium-term Budget
Coverage of Flows Long-term Fiscal Sustainability
Framework
Coverage of Tax Expenditures Investment Projects Budgetary Contingencies
Frequency of In-Year Reporting Fiscal Legislation Asset and Liability Management
Timeliness of Budget
Timeliness of Annual Accounts Guarantees
Documentation
Classification Fiscal Policy Objectives Public-Private Partnerships
Internal Consistency Performance Information Financial Sector
Historical Revisions Public Participation Natural Resources
Statistical Integrity Independent Evaluation Environmental Risks
External Audit Supplementary Budget Subnational Governments
Comparability of Fiscal Data Forecast Reconciliation Public Corporations
11Table 0.2. Armenia: Public Sector Financial Overview, 2016
(Percent of GDP)
Armenia: Public Sector Financial Overview, 2016
(Percent of GDP)
General Government Public corporations
Consoli- Public
Central o / w: Local Consolidation Consolidated Central dation Sector
Nonfinancial Financial
Government State Government Gen. Govt. Gen. Govt. bank
Budget
Transactions
Revenue 23.5 23.1 2.6 -1.2 24.9 3.8 0.0 0.6 -1.2 28.1
Expenditure 28.9 28.5 2.5 -1.2 30.3 5.0 0.0 0.7 -1.2 34.8
Expense 25.6 25.2 2.5 -1.2 27.0 4.0 0.0 0.6 -1.2 30.4
Investment in NFA 3.3 3.3 0.0 0.0 3.3 1.0 0.0 0.1 0.0 4.4
Net operating balance -2.2 -2.2 0.1 0.0 -2.1 -0.2 0.0 -0.1 0.0 -2.3
Net lending/borrowing -5.5 -5.5 0.1 0.0 -5.4 -1.2 0.0 -0.1 0.0 -6.8
Stocks
Assets 60.6 56.8 10.8 0.0 71.4 12.8 0.3 32.3 -14.5 102.3
Nonfinancial 34.2 31.7 10.8 0.0 45.0 9.8 0.0 2.0 0.0 56.8
Financial 26.4 25.2 0.0 0.0 26.4 3.1 0.3 30.3 -14.5 45.5
Liabilities 71.1 68.1 0.0 0.0 71.1 12.8 0.3 32.3 -14.5 101.9
Liabilities, other than
equity 71.1 68.1 0.0 0.0 71.1 8.5 0.2 32.2 -10.0 101.9
Equity 0.0 0.0 0.0 0.0 0.0 4.4 0.1 0.1 -4.5 0.0
Net worth -10.4 -11.3 10.8 0.0 0.3 0.0 0.0 0.0 0.0 0.3
Net financial worth -44.7 -42.9 0.0 0.0 -44.7 -9.8 0.0 -2.0 0.0 -56.5
Net fin.worth incl. -
pension liabilities -96.2 -94.5 -96.2 108.0
Source: GFSM 2014 report, Armenian authorities (Treasury, MoF’s Debt Department; State Property Management, Department
of Shares, Department of Obligations), financial statements of 207 public non-financial corporations, Central Bank including its
10 subsidiaries, Armenia's Development and Investment Corporation, Export Insurance Agency of Armenia, and IMF staff
estimates.
Notes: Central Government covers consolidated data for the budgetary central government including social security activities,
and extra-budgetary units. Central government data include estimated non-financial assets and liabilities from PPPs of 10.2
percent of GDP and estimated explicit military pension liability of 6.1 percent of GDP. Estimated implicit liabilities from the ‘pay
as you go’-pension scheme of 51.5 percent of GDP are not included in data on liabilities but are reflected under the memo item
“Net financial worth including pension liabilities.” Appendix II provides more details on data sources and methods used.
These estimates attempt to present a broad overview of Armenia’s public sector finances, by complementing data published in
the various fiscal reports with IMF staff estimates for the most material data gaps, in reference to the GFSM 2014 framework.
GFSM 2014 and the public sector accounting standards are not implemented by all public sector units yet. Given the limitations
in data sources and time available for their compilation, this exercise must be considered as an approximate picture of
Armenia’s public sector finance.
I. FISCAL REPORTING
1. Fiscal reports should provide a comprehensive, timely, reliable, comparable, and
accessible summary of the government’s financial performance, financial position, and
cash flows. This chapter assesses the quality of Armenia’s fiscal reporting practices against the
standards set by the IMF’s Fiscal Transparency Code for the following dimensions:
• Coverage of public sector institutions, stocks, and flows;
12• Frequency and timeliness of reporting;
• Quality, accessibility, and comparability of fiscal reports; and
• Reliability and integrity of reported fiscal data.
2. Armenia has taken substantial steps over the past decade to improve budget
execution reporting and fiscal statistics. Some important advancements include the:
• Adoption of the Government Finance Statistics Manual 2001 (GFSM 2001) for the economic
classification of the budget in 2008;
• Publication of monthly and quarterly reports on budget execution on a cash basis;
• Adoption of the System of National Accounts (SNA) 2008 and publication of annual national
accounts for the general government sector; and
• Launching a new national accounting system at the ministry level based on International
Public Sector Accrual Standards (IPSAS) to be completed in 2025.
3. Armenia’s main summary fiscal reports comprise the following:
• Monthly and quarterly budget execution reports produced by the Budget Execution
Department of the Treasury. The monthly reports present state budget cash-based outturns
for revenue, expenditure, and financing. The quarterly reports provide more detailed data by
economic categories of revenue, expenditure, and financing for the state budget and local
governments;
• State debt data and bulletins are prepared by the Debt Department of the MoF on a
monthly, quarterly, and annual basis. The reports provide details on the state debt by
residence, currency, maturity, and type of interest rate;
• Annual budget execution report produced by the Budget Execution Department of the
Treasury classification and presents consolidated outturns for cash revenues and
expenditures, and financing covering the state budget and local governments. Data on
SNCOs, which use an accrual accounting system, will only be consolidated in the budget
execution reports once the accounting reform is implemented.
• Fiscal statistics are produced by the MoF’s Debt Department according to the GFSM 2014,
and by the National Statistical Service (NSS) according to the SNA 2008 methodology. Both
reports cover most of the general government sector. While the non-cash annual SNA based
national accounts are published on a regular basis, the cash based GFSM 2014 data are only
provided to the IMF and are not published at the national basis.
4. While Armenia reports a large volume of fiscal data, reporting is fragmented and
not always publicly available. The most comprehensive reports, budget execution reports and
fiscal statistics, cover only flows. Some data on stocks are also available but spread across reports
of various central and local government agencies. Reports for state non-commercial
13organizations (SNCOs) and most public corporations are not published. Data on municipal non-
commercial organizations (MNCOs) are only available to local governments.
5. Currently, Armenia does not prepare financial statements for the government
sector based on international standards. The Soviet-era standard will continue to be used,
until the full implementation of the new accounting system based on accrual IPSAS. Current
accounting reports are not presented in the form of financial statements that link revenue and
expenditure flows with changes in financial assets and liabilities. The available consolidated
balance sheet only reflects a small fraction of the government net worth as only assets and
liabilities related to the operational activities of the line ministries are covered.
6. The main fiscal reports produced by Armenia are presented in Table 1.1:
Table 1.1. Armenia: List of Fiscal Reports
COVERAGE ACCOUNTING PUBLICATION
REPORT Author
Inst. Flows Stocks Basis Class. Freq. Lag
IN-YEAR REPORTS
Monthly Budget R, E,
MoF BCG … Cash Nat. Monthly 30d
Execution Reports Fin
R, E, Nat.
State Budget Indicators MoF BCG … Cash Monthly 30d
Fin
Non- Nat.
State Debt Data MoF BCG Fin Debt Monthly 30d
cash
Quarterly Budget R, E, Quarterl
MoF CG; LG … Cash 30d
Execution Reports Fin Nat. y
R, E, Nat. Quarterl
Consolidated Budget MoF CG; LG … Cash 30d
Fin y
Local Government R, E, Nat. Quarterl
MoF LG … Cash 30d
Budget Fin y
State Debt Indicators Non- Nat. Quarterl
MoF BCG … Debt 30d
cash y
YEAR-END REPORTS
Annual Budget R, E,
MoF CG; LG … Cash Nat. Annual 4m
Execution Report Fin
Debt, Non-
Annual Debt Report MoF BCG Nat. Annual 5m
Deposits cash
Annual Government BCG;
R, E, GFSM
Finance Statistics MoF NSCO … Cash … …
Fin 2014
(not published) s; LG
BCG;
Non- SNA
National Accounts NSS NSCO R, E … Annual 18m
cash 2008
s; LG
Note: BCG: Budgetary Central Government; CG: Central Government; LG: Local Government; GG: General Government; NFPS:
Nonfinancial Public Sector; PS: Public Sector; R: Revenue; E: Expenditure; Fin: Financing; NFA: Nonfinancial Assets; FA: Financial
Assets; L: Liabilities.
141.1. Coverage of Fiscal Reports
1.1.1. Coverage of Institutions (Basic)
7. Armenia’s public sector comprises at least 3,464 units of various legal forms. The
precise number is not known since a comprehensive list of public units doesn’t exist. As shown in
Table 1.2 the units are distributed in the following subsectors:
• Central government, which comprises 1,961 units in total, including 66 central government
budgetary units1, and 1,895 SNCOs 2 which are classified as extra-budgetary funds (EBFs).
Social security revenues and expenditure are integrated in the state budget.
• Local government, which comprises at least 1,201 units, including 502 municipalities and
several thousands 3 of EBFS - MNCOs, of which 699 units conduct some limited commercial
activities in addition to non-market activities;
• Public nonfinancial corporations, which comprise around 288 corporations controlled by
the central government, of which 241 are joint-stock companies. The number of corporations
controlled by local government is not known; and
• Public financial corporations, which comprise 14 units, including the National Central Bank
(NCB) and its 10 subsidiaries, and three state corporations controlled by the state (Armenia's
Development and Investment Corporation, Deposit Guarantee Fund of Armenia, and Export
Insurance Agency of Armenia).
Table 1.2. Armenia: Public Sector Institutions and Finances, 2016
(Percent of GDP, unless otherwise stated)
Number of Intra-PS Net
Revenue Expenditure Balance
entities expenditure expenditure
Public Sector 3,464 28.1 34.8 -6.8 0.0 34.8
General government 3,162 24.9 30.3 -5.4 -1.1 29.2
Central government (consolidated) 1,961 23.5 28.9 -5.5 -2.3 26.7
State Budget 66 23.1 28.5 -5.5 -5.2 23.4
State Non-Commercial Organizations 1,895 3.3 3.3 0.0 0.0 3.3
Local government (consolidated) 1,201 2.6 2.5 0.1 0.0 2.5
Marzes, towns, and villages 502 2.4 2.3 0.1 0.0 2.3
Municipal Non-Commercial Organizati 699 0.2 0.2 0.0 0.0 0.2
Nonfinancial public corporations 288 3.8 5.0 -1.2 -0.1 4.9
Central Bank 1 0.6 0.7 -0.1 0.0 0.7
Other financial public corporations 13 0.0 0.0 0.0 0.0 0.0
Source: GFSM 2014 report, Armenian authorities. Financial statements of public corporations (data for Central Bank include its
10 subsidiaries), and IMF staff estimates. Note: Numbers for “Revenue” and “Expenditure” don’t add up due to consolidation of
inter-sectoral transactions.
1 The number refers to the General Budget Mangers.
2SNCOs and MNCOs – are state and municipal non-commercial organizations are typically involved in non-profit
activities such as education, research, and culture.
3 Precise number of MNCOs is not available.
158. Armenia’s public sector expenditures amount to 34.8 percent of GDP in 2016.
Table 1.2 summarizes the distribution of public resources across the different subsectors of the
public sector in 2016 and shows that:
• General government net expenditure accounted for 29.2 percent of GDP, of which around
91 percent was spent by the central government and 1 percent through local governments.
Expenditures of non-commercial organizations of around 3.5 percent of GDP are almost
entirely financed through government transfers;
• Public corporation net expenditure accounted for additional 5.6 percent of GDP, the vast
majority of which was spent by nonfinancial corporations.
9. There is no single report that provides complete coverage of either general
government or public sector activity. The budget execution reports consolidate budgetary
central and local governments, however the activities of EBFs (SNCOs and MNCOs) are not
covered. While the annual GFSM 2014 statistical reports present a more comprehensive sector
coverage because they also include SNCOs, they do no capture MNCOs whose reports are not
published. The NSS compiles and publishes annual SNA 2008 based on national accounts for
general government, though the approach applied for sector definition is not fully compliant
with international statistical standards.
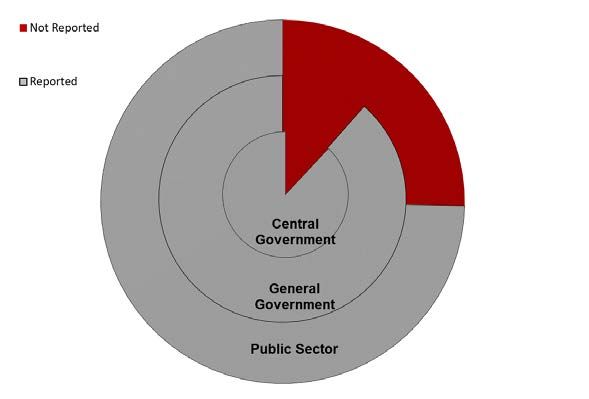
Figure 1.1. Coverage of Public Sector Institutions in Fiscal Reports
(Percent of expenditure at each level)
Current sectorization Including loss-making SOEs in the General
Government
Source: Armenian authorities and IMF staff estimates.
Note: “Not Reported” refers to expenditures of units not consolidated in summary fiscal (budget execution) reports.
10. Expanding the institutional coverage of Armenia’s fiscal reports to the entire public
sector would increase the deficit by 1.3 percent of GDP and would have a material impact
16on revenue and expenditure. Including SNCOs and MNCOs will add 3.5 percent of GDP to both
revenue and expenditure but will not change the deficit. Further expanding the coverage to the
public sector by including public corporations, will add 4.4 percent of GDP to revenue and
5.7 percent of GDP to expenditure on an accrual basis, resulting in an overall public sector deficit
of 6.8 percent of GDP.
11. A number of loss-making public corporations in Armenia would likely be classified
in the general government sector. Out of 199 public corporations monitored by the
government, 49 units have cumulated losses (negative retained earnings) of 2.8 percent of GDP.
These are mainly corporations in the energy and water sectors and to a lesser extent in transport,
defense, sport, and agriculture sectors. Their expenditures amounted to 3.7 percent of GDP
(including net investment in non-financial assets of 1.8 percent of GDP) and their deficit to
1.9 percent of GDP in 2016 on an accrual basis. Figure 1.1 illustrates the coverage of government
and public sector expenditure based on the current sectorization, and indicates the magnitude of
unreported government expenditure if the loss-making corporations were consolidated within
the government. 4
1.1.2. Coverage of Stocks (Basic)
12. Armenia publishes data on stocks of the state budget deposits and debt. The annual
State Debt Report provides comprehensive data on the state debt by residency, currency,
maturity, and type of interest rate. It also provides data on the state budget cash deposits as
reported in the Treasury State Account (TSA).
13. There is no single report subsector that provides an overview on all types of
government assets and liabilities for any public subsector. As explained above, data on most
state financial assets and liabilities of 25.2 and 51.8 percent of GDP respectively, are spread
across various government agencies and their departments, but no comprehensive statement
exists. Adding liabilities related to PPPs and pensions (as described below) will increase state
liabilities to 68.1 percent of GDP. Single SNCOs report balance sheet data, but individual data on
assets and debt of 3.8 and 2.9 percent of GDP respectively are not aggregated in any report.
According to the authorities, the scope of local governments financial assets and liabilities is
limited. They do not provide loans and have not incurred any debt due to strict borrowing rules.
4 According to GFSM 2014, public enterprises which do not operate on a market basis should be classified in the
general government sector despite of their “commercial” legal status. The presence of losses is one of the
important indicators suggesting that the enterprise does not operate on a commercial basis and further
examination should be done to confirm if the units should be reclassified into the government sector
(e.g., financial results for several preceding years, financial dependency on the government, autonomy of
decision).
1714. Significant gaps are observed in data availability for non-financial assets and
liabilities and their valuation:
• Only partial data on the state non-financial assets subject to privatization (2.8 percent of
GDP) are available from the State Property Management Department (SPMD);
• Another portion of the state non-financial assets (17.4 percent of GDP) is reported by
individual line ministries in their balance sheets,5 mostly assets used for operational activities;
• Data on the main government non-financial assets, such as infrastructure assets, natural
resources, historical buildings, land, etc., are not available. A noticeable portion of these
assets are deemed to be owned by local governments and operated by MNCOs (land, roads,
water walls, pipelines, bridges, and agriculture assets). Ministry of Territorial Administration
plans to introduce an inventory of non-financial assets for municipalities.
• Non-financial assets held by SNCOs (0.8 percent of GDP) and public corporations
(11.8 percent of GDP) are reported in the financial statements of individual units but an
aggregated report is not available.
• Non-financial assets and liabilities related to PPPs contracts (10.2 percent of GDP), explicit
liabilities of the military pension scheme (6.1 percent of GDP) and implicit liabilities of the
pay-as-you go social security pension scheme (51.5 percent of GDP) 6 are not reported by the
government.
15. Addressing these gaps would provide a more comprehensive view of the public
fiscal stance. As shown in Table 0.1 and Figure 1.2, consolidated public sector asset holdings and
liabilities, excluding implicit pension liabilities, are estimated to have been at least 102.3 percent
of GDP and 101.9 percent of GDP, respectively, in 2016. Public sector net worth and net financial
worth are estimated to have been 0.3 percent of GDP and -56.5 percent of GDP, respectively.
Considering the estimated implicit pension liabilities, 7 public sector net financial worth will
account for –108 percent of GDP. These figures, however, do not reflect the government owned
infrastructure assets, land, subsoil assets, and historical buildings as not even indicative data on
their value are available to the Armenian government. In addition, the valuation of non-financial
assets most probably does not reflect market prices. A proper valuation and adding the missing
non-financial assets would likely have a noticeable positive impact on the government and public
net worth.
5 The balance sheets are not publicly available.
6Pension liabilities calculated via extrapolation. More in-depth analysis to be undertaken to also reflect
demographic and policy changes.
7While according to GFSM 2014, implicit liabilities/ obligations for future social security benefits of a pay-as-you-
go pension scheme are not explicitly included in the government debt, but they should be, presented as a
memorandum item to the balance sheet,
18Figure 1.2. Public Sector Balance Sheet Coverage in Fiscal Reports, 2016
(percent of GDP)
General Government
GG implicit pension liab. Reported
Non-Fin Public Corp
Unreported
Financial Public Corp
Implicit pension
Central Bank liabilities
Public Sector
Liabilities Assets
Net Worth
Net Financial Worth
NFW incl. implicit pension liab.
-120 -60 0 60 120
Source: GFSM 2014 report, Armenian authorities. Financial statements of public corporations, and IMF staff estimates.
16. Armenia’s net worth sits in the mid-range of other countries and gross liabilities are
relatively low (Figure 1.3 and 1.4). This in part reflects the fact that Armenia does not have any
state-owned banks and does not have a government controlled defined contribution pension
scheme.
Figure 1.3. Public Sector Gross Liabilities in Selected Countries
(Percent of GDP)
500
General Government Public Enterprises
400
300
200
100
0
Tanzania
Guatemala
Georgia
Armenia
Ireland
Russia
Brazil
Albania
Turkey
Uganda
Finland
UK
Kenya
Mozambique
Philippines
Portugal
Romania
Tunisia
Peru
Source: IMF staff estimates, Fiscal Transparency Evaluations (Portugal 2012, Ireland 2012, UK 2013, Finland 2015,
Brazil 2016, Tunisia 2015, Romania 2014, Albania 2015, Peru 2015, Philippines 2014, Tanzania 2015, Russia 2014,
Turkey 2013, Kenya 2014, Uganda 2016, Georgia 2016, Mozambique 2015, and Guatemala 2016).
19Figure 1.4. Public Sector Net Worth in Selected Countries
(percent of GDP)
300
200
100
0
-100
-200
Armenia
Finland
Kenya
Ireland
Portugal
Georgia
Mozambique
Peru
Philippines
UK
Romania
Guatemala
Tunisia
Albania
Russia
Source: IMF staff estimates, Fiscal Transparency Evaluations
1.1.3. Coverage of Flows (Basic)
17. Fiscal budget execution reports and GFSM 2014 based statistical reports cover cash
revenues, expenditures, and financing, but do not include accrued transactions and other
economic flows. The most comprehensive picture of the general government flows is presented
in the annual statistical reports for consolidated general government sector. While the GFSM
2014 reports are on a cash basis, the national accounts include a few accrual elements such as
consumption of fixed capital.
18. Some government operations are not recorded in line with international standards
resulting in underestimating the government deficit. The current national rules do not reflect
the economic substance of some transactions as required by international statistical standards.
For example, capital injections to loss-making public corporations should be treated as an
expenditure and not as an acquisition of shares and equities. Dividends are treated as a revenue
in the budget execution reports, but it should only be the case if they are paid out of the profit
coming from the operational activities of the corporation and not from revaluation gains or
reserves.
19. Recognizing of non-cash transactions not covered in the reports may have a
noticeable impact on the general government deficit on an accrual basis. While delayed
payments in trade credits and other payables seems to be insignificant, other non-monetary
operations that would need to be included will affect government’s fiscal results. For example,
inclusion of the capital investments performed through PPPs where the government is bearing
most of the associated risks, need to be counted as a government investment in non-financial
assets. This will significantly increase the government deficit at the time the construction and
other related works are performed. Also, capturing of the net accrual pension entitlements of
public military employees will impact the deficit as well as financing.
201.1.4 Coverage of Tax Expenditures (Good)
20. Armenia publishes regular estimates of the revenue loss from tax in the annual
budget documentation. Since 2015, estimated tax expenditures are published in the
explanatory note of the annual budget documentation including estimates for the three main
taxes, VAT, corporate income tax and personal income tax (70 percent of total taxes). VAT
expenditures with around 40 lines of exemptions in the tax code are presented by sectors (e.g.
health, education, financial and insurance sectors) and by other broad categories of exemptions,
but the breakdown of PIT and CIT expenditures includes only privileges on agriculture, dividends,
and VAT thresholds. The State Revenue Committee plans to expand its reporting on individual
tax exemptions in 2019.
Figure 1.5. Tax Expenditures in Selected Countries
(Percent of GDP)
10
8
6
4
2
0
Korea
France
Denmark
Norway
Mexico
Dominican Rep.
Turkey
Canada
Brazil
United States
Poland
Uruguay
Spain
Chile
Switzerland
Greece
Guatemala (2009)
Netherlands
Argentina
Italy
Germany
Armenia (2018)
Portugal
Peru
Austria
UK (FY14/15)
Georgia
Australia
Source: IMF staff estimates, Fiscal Transparency Evaluations.
21. There is no control on, or budgetary objectives for, the size of tax expenditures -
such controls or objectives could help strengthen the revenue base. Legislation does not
include a requirement to report tax expenditures nor to assess the quantitative impact of new
legislation on tax exemptions. Tax expenditure accounts for almost 7 percent of GDP (Figure 1.5)
and one third of total collected taxes and are among the highest compared with other countries.
The government plans to reduce the size of tax expenditure. This could be done through a
budgetary objective or limit on its size, and reporting on its implementation.
1.2. Frequency and Timeliness of Fiscal Reporting
1.2.1. Frequency of In-Year Fiscal Reporting (Advanced)
22. In-year state budget and local government reports are published monthly, within a
month. These budget execution reports present revenues, expenditure, and financing data and
are published within 30 days of the end of month. Also, monthly data on the state budget debt
are published within a month. Quarterly budget execution reports are published within one
month at the end of each quarter. These reports provide more detailed revenue, expenditure,
and financing data by economic categories, and expenditure data according to the functional
21classification. Armenia is among the half of the countries that publish monthly reports within a
month (Figure 1.6).
Figure 1.6. Periodicity and Timeliness of Budgetary Reports by SDDS Subscribers
(Percent of Countries)
Periodicity Timeliness
Annually Over 12 months
15% Armenia 3%
Armenia
Semi-
annually
6-12 months
1%
7%
Quarterly 1 month or
17% less
50%
1-6
months
Monthly 40%
67%
Source: Special Data Dissemination Standards (SDDS) Database; General Data Dissemination Standards (GDDS) Database (2017)
1.2.2 Timeliness of Annual Financial Statements (Advanced)
23. Annual budget execution reports are published within 4 months of the following
year. They are subject to an audit opinion of the Chamber of Audit (Indicator 1.4.2). The annual
report provides data for the state and local government and some indicators on the performance
of SNCOs based on different classifications (Indicator 1.3.1). The report also presents further
details on grants and subsides, comparative tables by sectors, specific projects, detailed
information of the government debt and loans, and other details. As explained above, annual
financial statements are not yet fully developed. Armenia is among the group of countries that
publish their annual fiscal report within 6 months (Figure 1.7). The sectoral national accounts for
the general government compiled by the NSS are published with a delay of 18 months.
Figure 1.7. Timeliness of Annual Fiscal Reports in Selected Countries
(Number of countries)
19 Armenia
Six months
Ten months
Fifteen months 14 50
More than 15 Months
24
Source: PEFA Scores Data Set (2005–16).
221.3. Quality of Fiscal Reports
1.3.1. Classification (Advanced)
24. Fiscal reports provide information on revenue and expenditure by administrative,
economic, functional, and program classification in line with international standards. The
MoF’s quarterly budget execution reports, covering State Budget entities and extra-budgetary
accounts, includes administrative, functional, and economic classification of spending. The annual
execution report, which consolidates State Budget entities, extra-budgetary accounts and local
governments, extends reporting by programs, defined at the sublevel of functions. Functional
classification follows the United Nations’ Classification of Functions of Government (COFOG),
while economic classification is in accordance with GFSM 2014. Revenues are aggregated over
three types: tax revenues and state duties, official grants, and other income. The same revenue
and spending data are published in the NSS fiscal statistics and presented by economic and
functional categories.
25. Some current practices limit the usefulness of these reports:
• Actual expenditure from the Table 1.3. Armenia: Spending by Economic Type, including
and excluding SNCOs
Government Reserve Fund is classified
(AMD, billion in 2016)
into an eleventh category alongside State Central
the ten COFOG categories, instead of Budget Government
being classified by purpose. This Compensation of employees 142 270
Use of goods and services 162 136
constitutes a non-trivial proportion of
Interest 98 98
spending (2.5 percent of total Subsidies 121 61
spending in the past three years) that Grants 158 133
is not properly classified. Social benefits 405 407
Other expense 195 198
• With the exclusion of SNCOs, the Net/gross investment in 167 167
composition of spending by economic nonfinancial assets
Total 1,449 1,470
type for central government is Source: GFS data
distorted. Wages and salaries—the
SNCOs’ main expenditure items—are paid through subsidies, goods and services, and grants
from the state budget, and classified as such. As a result, central government compensation
of employees is largely underestimated in these reports (by 47 percent in 2016—see
Table 1.3).
1.3.2. Internal Consistency (Basic)
26. Armenia reliably publishes one of the three internal consistency checks of fiscal
data required under the Code. It publishes reconciled above-the-line fiscal deficits with below-
the-line financing. While data on holdings of state debt by creditors are reported in the monthly
debt bulletin and annual debt report, a reconciliation of the debt issued with the stock of debt by
23counterparties based on a security-by-security database or on sectoral national accounts, as
envisaged by the FTC, is not available. Importantly, there is no reconciliation available between
the net financing and the change in the stock of debt.
27. The absence of a balance sheet makes it difficult to present a comprehensive stock-
flow reconciliation. Data on other economic flows, such as revaluations (e.g. due to exchange
rates or market prices) and other changes in the volume of assets and liabilities (e.g. changes in
the sector coverage) are to be integrated with balance sheets. Figure 1.8. presents the
reconciliation of the change in the state debt and the individual elements contributing to the
increase in the debt - the deficit and net acquisition of financial assets. While the major part of
the debt increase in 2016 can be explained by the financing of the deficit and net acquisition of
financial assets, in particular loans, in 2014 and 2015 0.7 and 0.2 percent of GDP, respectively,
remain unexplained. The unexplained residuals could result from currency deterioration but may
also include other unidentified factors or possible errors.
Figure 1.8. Stock-flow Adjustment, 2016
(Percent of GDP)
10
Residual
8 Net acquisition of financial assets
Deficit
6
4
2
0
-2
2014 2015 2016
Source: GFS and debt data.
1.3.3. Historical Revisions (Not met)
28. Fiscal statistics are not systematically revised to reflect new information. Data based
on the GFSM 2001/2014 submitted for the IMF’s Government Finance Statistics Yearbook have
never been revised. A major one-off methodological revision was done by the NSS in 2015 to the
national accounts when moving from SNA 1993 to SNA 2008 and updated numbers were
published in the National Accounts of Armenia Statistical handbook. However, revisions to fiscal
statistics to reflect updated source data, and corrections of errors and omissions are not regularly
published and do not indicate whether the numbers are provisional, revised, updated, or final.
The implementation of some recommendations of this report would result in meaningful
revisions to GFS and SNA data, which should be disclosed. Box 1 gives examples for required
historical revisions.
24Box 1.1. Good Practices for Statistical Revisions
Revisions are defined broadly as any change in a value of a statistic released to the public by an official
national statistical agency (NSS or MoF). The IMF Working Paper “Revisions Policy for Official Statistics: A
Matter of Governance” proposes a set of good practices for the revision of macroeconomic data.
While frequent material revisions of statistical data may indicate potential risks in reliability of fiscal data,
the absence of revisions indicates a likelihood that data may not be fully compliant with the international
statistical methodology and that time series are not consistent.
To provide data aligned with the principles and methodological rules of international standards,
statistical revisions are inevitable. Revisions are a routine part of disseminating quality data and are made for
various reasons. Therefore, statistical authorities should have explicit and transparent revision policies.
Revisions of statistical data should be done due to the following reasons:
• Incorporation of improved and more comprehensive source data. (e.g. preliminary estimates to be
replaced by actual data from final or audited accounts, or by more complete or otherwise better
reporting by government units).
• Amending the treatment of operations based on new information which became available at a later
stage (e.g. to asses if capital injections or dividends should be treated above or below the line based on
a new data form financial statements of corporations).
• Adoption of new or revised statistical methodologies (e.g. when moving from GFSM 2001 to GFSM
2014; or incorporation of non-monetary transaction such as acquisition of military equipment via
borrowing in kind)
• Correction of errors and omissions in initially reported data.
This practice is followed by large majority of countries. Based on the Fiscal Transparency Evaluations
conducted in other countries, only 3 (including Armenia) out of 24 counties, do not revise statistical reports.
1.4. Integrity of Fiscal Reports
1.4.1. Statistical Integrity (Good)
29. Fiscal statistics are compiled by a specific government agency and disseminated in
accordance with international standards. Official fiscal statistics are compiled and
disseminated by the Statistical Committee on the SNA 2008 basis. The Statistical Committee is a
state body under the Government of the Republic of Armenia. The President of the Statistical
Committee is appointed by the government of the Republic of Armenia upon nomination by the
Prime Minister of the Republic of Armenia for a term of six years. The Law stipulates that statistics
compiled by the NSS should follow best statistical practice and meet the principle of objectivity,
reliability, accuracy, confidentially with respect to individual data, comparability with international
norms and standards, and accessibility of statistical information to public. The website of the NSS
provides user-friendly access to the statistical information. The MoF compiles statistical reports
based on GFSM 2014 which are not published or reconciled with the national accounts. Capacity
constraints, at both the NSS and MoF, may constrain full implementation of international
statistical standards.
25You can also read