IMF POLICY PAPER - International ...
←
→
Page content transcription
If your browser does not render page correctly, please read the page content below

IMF POLICY PAPER
             FY2020–FY2022 MEDIUM-TERM BUDGET
April 2019
             IMF staff regularly produces papers proposing new IMF policies, exploring options for
             reform, or reviewing existing IMF policies and operations. The following documents have
             been released and are included in this package:

             •   A Press Release summarizing the views of the Executive Board as expressed during its
                 April 5, 2019 consideration of the staff report.

             •   The Staff Report, prepared by IMF staff and completed on April 2, 2019 for the
                 Executive Board’s consideration on April 5, 2019.

             The IMF’s transparency policy allows for the deletion of market-sensitive information and
             premature disclosure of the authorities’ policy intentions in published staff reports and
             other documents.

                                       Electronic copies of IMF Policy Papers
                                          are available to the public from
                                   http://www.imf.org/external/pp/ppindex.aspx

                                      International Monetary Fund
                                            Washington, D.C.

             © 2019 International Monetary Fund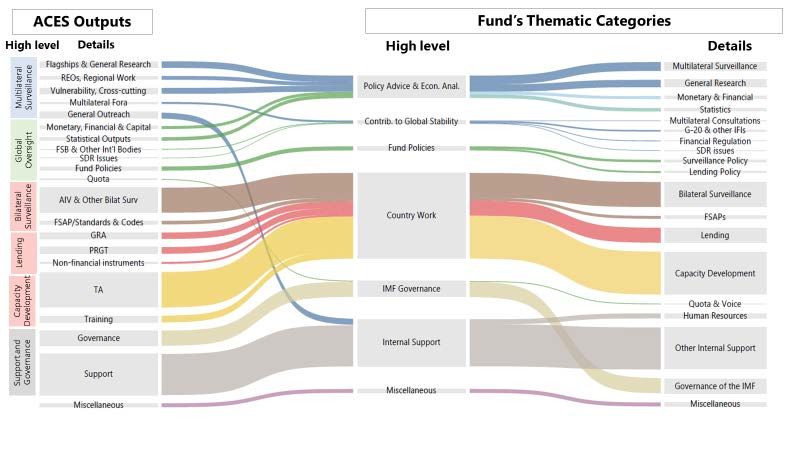
Press Release No. 19/122                                        International Monetary Fund
FOR IMMEDIATE RELEASE                                           Washington, D.C. 20431 USA
April 22, 2019

        IMF Executive Board Approves FY2020–FY2022 Medium-Term Budget

On April 5, 2019, the Executive Board of the International Monetary Fund (IMF) approved
the IMF’s administrative and capital budgets for financial year (FY) 2020, beginning May 1,
2019, and took note of indicative budgets for FY2021–22.

The net administrative budget for FY2020, which covers all administrative expenses less
receipts (primarily from external sources to help support capacity building activities and
excluding lending income), has been set at US$1,158 million.

The FY2020 budget represents an unchanged resource envelope in real terms for the eighth
year in a row, measured relative to the IMF’s budget deflator, with the exception of a small
(0.6 percent) increase in FY2017 to meet rising cyber and physical security costs. The budget
priorities for FY2020 include increased resources to country work, notably in low-income
countries and fragile states, the work on governance and the fight against corruption, and
macro-financial surveillance. To accommodate this with unchanged resources, reallocation
and savings measures amounting to 3 percent of the previous year’s budget are planned for
implementation. As is customary, the nominal dollar budget includes an adjustment to
accommodate price increases, 2.6 percent for FY2020.

The FY2020 capital budget, set at US$86 million, provides financing for capital projects for
building facilities and IT. This includes major projects to overhaul work practices and
introduce modern digital platforms and tools.

Additional information can be found in the staff paper:
https://www.imf.org/en/Publications/Policy-Papers/Issues/2019/04/22/FY2020FY2022-
Medium-Term-Budget-46821.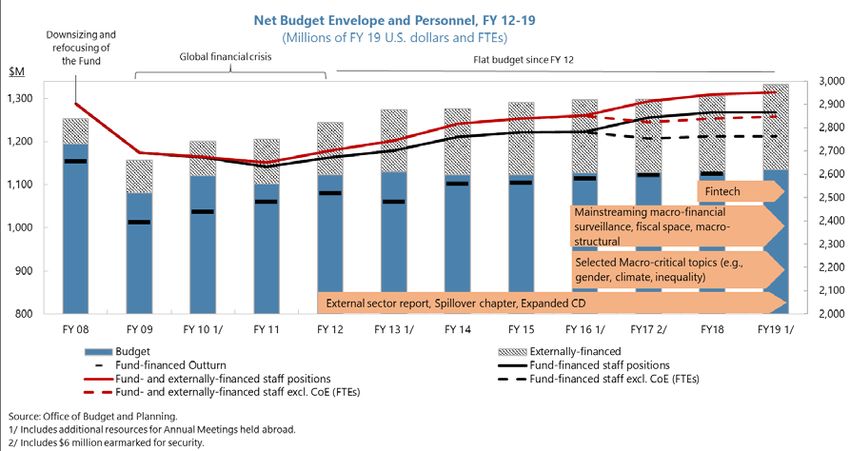
FY2020–FY2022 MEDIUM-TERM BUDGET

                EXECUTIVE SUMMARY
April 2, 2019

                The FY 20 budget proposal is formulated within the context of long-standing
                objectives of financial sustainability and meeting the memberships’ evolving
                needs. Against the backdrop of a weakened global outlook and financial volatility, the
                budget reflects a strategic agenda to help members rebuild policy space, strengthen
                resilience, and implement structural reforms. This will be supported by continued work
                to review policies and strategies to enhance Fund advice and support multilateralism.

                The net administrative budget for FY 20 remains unchanged in real terms. This
                represents the eighth year in a row of flat real budget envelopes (excluding a
                ½ percentage point security related increase in FY 17). The proposal reflects
                reallocations of some 3 percent of the net budget. As the expected FY 19 outturn fully
                utilizes the approved budget, carry-forward resources equivalent to 3 percent of the net
                budget would still be available (4 percent including the Offices of Executive Directors
                (OED) and the Independent Evaluation Office (IEO)). Of these, some 80 percent
                ($25 million) is proposed to be allocated upfront in the FY 20 budget process. While
                $6 million higher than last year, this reflects some unusually elevated temporary needs.

                As in previous years, the budgetary exercise entails a relatively modest
                reallocation of resources, with a small impact on the Fund’s overall output
                structure. Fund-financed structural resources are projected to shift slightly toward
                country work and away from internal support, and some reallocation between work on
                policy advice and economic analysis and Fund policies is also envisaged.

                The capital budget envelope for FY 20 includes requests to support modernization
                efforts. These investments hold the promise of transforming how the institution
                operates at all levels. They will affect the Fund’s backbone systems infrastructure as well
                as frontline work, such as capacity development (CD).

                The same level of real administrative resources is assumed over the medium term.
                Current projections do not prejudge the outcome of the Comprehensive Compensation
                and Benefits Review (CCBR), the modernization initiatives, or new workstreams that the
                Fund may be asked to take on, all of which could significantly impact resource needs
                and allocation over the medium term.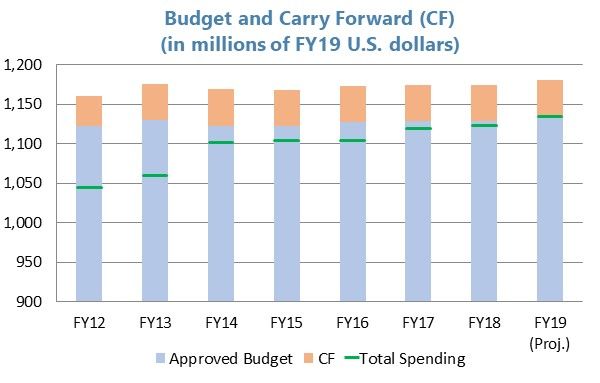
FY2020–FY2022 MEDIUM-TERM BUDGET

    Approved By           Prepared by an Office of Budget and Planning team led by Piyabha Kongsamut
    Daniel Citrin         under the supervision of Brian Christensen and Gisela Ulmschneider, with
                          contributions from Rebecca Brofft, Melanie Burke, Raquel Chuayffet,
                          Angeliki Economopoulos, Sepideh Khazai, Anne Kim, Sun Mi Lee,
                          Carolina Parodi, Andrea Richter Hume, Anika Shtuni, Justin Tyson, Muriel
                          Vimond, Barrie Williams, Talia Zhang, Biwen Zhou, and Jiu Hong Zhou.

     CONTENTS
OVERVIEW __________________________________________________________________________________________ 4

THE STRATEGIC CONTEXT _________________________________________________________________________ 6

THE BUDGET: HOW ARE PRIORITIES SUPPORTED? ______________________________________________ 11

FROM OUTPUTS TO INPUTS ______________________________________________________________________ 25

FY 20–22 CAPITAL BUDGET PROPOSAL __________________________________________________________ 30

RISKS TO THE BUDGET____________________________________________________________________________ 36

SUMMARY PROPOSAL FOR FY 20 ________________________________________________________________ 39

BOX
1. Modernization and the "Big 5" Programs _________________________________________________________ 10
2. Financial Surveillance _____________________________________________________________________________ 15
3. Spending on Fragile and Conflict States __________________________________________________________ 16
4. Strengthening the Framework for Capacity Development Prioritization ___________________________ 18
5. The Board Work Program and Resource Allocation _______________________________________________ 20

FIGURES
1. Actual and Projected Income and Expenses, FY 08–29 _____________________________________________ 7
2. Fund Arrangements, FY 00–19 _____________________________________________________________________ 9
3. FY 20 Budget Adjustments, by Department Type and FTCs _______________________________________ 26
4. Big 5: High-level Overview of Status ______________________________________________________________ 34
5. FY 20–22 Budget Risk Matrix ______________________________________________________________________ 36
6. Externally Financed Spending and Operational Targets ___________________________________________ 37

TABLES
1. Administrative and Capital Budget Envelopes, FY 19–22 ___________________________________________ 5
2. Gross Administrative Fund-Financed Resources: Estimated Allocation by Output, FY 19–20 ______ 13
3. Budget Adjustments by Department, FY 19–20 ___________________________________________________ 27
4. FTE Changes by Department Type, FY 19–20 ______________________________________________________ 28
5. Administrative Budget Envelope, FY 19–20 ________________________________________________________ 29
6. Medium-term Capital Budget, FY 19-22 ___________________________________________________________ 30
7. Proposed Appropriations, FY 20___________________________________________________________________ 39

2      INTERNATIONAL MONETARY FUND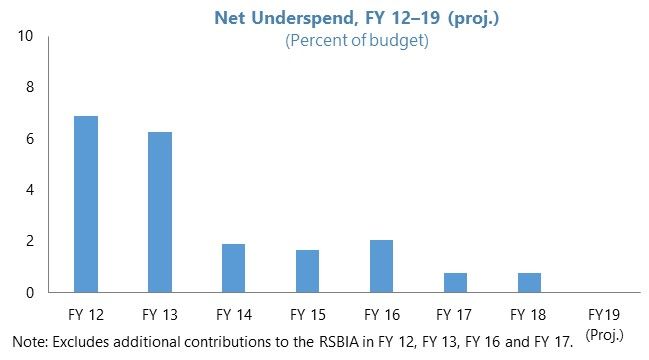
FY2020–FY2022 MEDIUM-TERM BUDGET
APPENDICES
I. Key Budget Concepts and Deflator _______________________________________________________________ 42
II. Projected FY 19 Outturn __________________________________________________________________________ 43
III. Budget Evolution _________________________________________________________________________________ 49
IV. Strategic Planning Process Timeline, 2019–20 ____________________________________________________ 50
V. Fund Thematic Categories and ACES Output Structure ___________________________________________ 51
VI. Implementation Status of Streamlining and Modernization Measures ___________________________ 53
VII. Long-term Capital Investment Plan _______________________________________________________________ 54
VIII. Big 5 Program Objectives, Timelines, Governance, and Estimated Cost _________________________ 56
IX. Statistical Tables _________________________________________________________________________________ 61

                                                                         INTERNATIONAL MONETARY FUND          3
FY2020–FY2022 MEDIUM-TERM BUDGET
OVERVIEW
Proposed FY 20 Budget and Medium-term Spending Envelopes
A multi-year The FY 20 budget proposal is formulated against the backdrop of a weakened global
strategic agenda outlook and financial volatility. The budget reflects a strategic agenda—
operationalized in the Managing Director’s Global Policy Agenda (GPA) and Board
Work Program (BWP)—to help members rebuild policy space, strengthen resilience,
and implement structural reforms. This will be supported by continued work to
review policies and strategies to enhance Fund advice.
Flat budget in real While the Fund’s income position remains healthy over the medium-term, the
terms in FY 20 budget stance remains disciplined and mindful of long-term constraints, and the
proposed net administrative budget envelope for FY 20 is unchanged in real terms
in relation to the Fund budget deflator.1 The proposal reflects reallocation towards
new needs and priorities of some 3 percent of the net budget.
The FY 20 budget would support important modernization projects. These projects
(the so-called “Big 5”) aim to improve processes and capabilities in areas
including human resources, capacity development, and data and knowledge
management. By leveraging technological innovations and streamlining
business processes, these projects should increase efficiency, improve the
quality of service delivery, and reduce risk. Because significant resources
(capital and administrative) will be needed up-front to pay for these projects,
robust cost-benefit analyses are being undertaken to ensure that the projects
deliver a satisfactory return on investment. Proactive change management will
also be critical given the significant changes that the projects will bring to how
work is done.
The increased upfront distribution of carry-forward resources means that the
buffers for handling unexpected resource needs will be reduced. This makes it
all the more important that departments manage their budgets carefully, to
reduce the risk of overruns. Staff’s ongoing efforts to strengthen internal
capacity to cost the Fund’s work should contribute to more robust estimates of
expected expenses, and better prioritization of available resources.
Flat resource The same level of real resources is assumed for the medium term, without
envelope over the prejudging the outcome of internal reviews and modernization efforts, nor of the
medium term impact of new work streams that may arise.
Table 1 sets out the main budget components: net and gross administrative budget
envelopes, and capital budget envelope, expressed in current and constant USD.
1 Excluding $6 million for the 2018 Annual Meetings in Indonesia.
4 INTERNATIONAL MONETARY FUNDFY2020–FY2022 MEDIUM-TERM BUDGET
Table 1. Administrative and Capital Budget Envelopes, FY 19–22
(Millions of U.S. dollars, unless otherwise noted)
Proposed Indicative
FY 19 Budget changes FY 20 FY 21 FY 22
Current USD Budget 1/ Est. Outturn Demands Savings Ext.-financed Budget Budget Budget 1/
Total operational income 1,683 2,190 3,410 3,202 3,566
Gross administrative budget 1,371 1,363 1,397 1,435 1,479
Receipts -236 -228 -239 -246 -252
Net Administrative Budget 1,135 1,135 1,158 1,190 1,227
Capital Budget (IT and Facilities) 71 75 86 96 82
Constant FY 19 USD
Gross administrative budget 1,371 1,363 31 33 -1 1,362 1,362 1,368
Receipts -236 -228 2 0 1 -233 -233 -233
Net Administrative Budget 1,135 1,135 33 33 - 1,129 1,129 1,135
of which Annual Meetings 6 5 6
Capital Budget (IT and Facilities) 71 75 84 91 76
Memo items:
Carry forward (upper limit) 46 … 47 … …
Allocated up-front 19 … 25 … …
Global external deflator (change) 2.3 … 2.6 2.7 2.6
Personnel component (70 percent) 2/ 2.2 … 2.7 2.7 2.7
Non-personnel (30 percent) 3/ 2.6 … 2.3 2.6 2.2
Source: Office of Budget and Planning.
1/ Includes travel to the Annual Meetings held abroad; Indonesia in FY 19, and Morocco in FY 22.
2/ For FY 20, reflects compensation adjustment as approved by the Executive Board (EBAP/19/18, Supplement 1). Outer years are technical placeholders.
3/ Reflects most recent updates for the April 2019 WEO projections of U.S. CPI.
Main Components of the Budget Proposal (Table 1)
FY 20 net $1,129 million in constant FY 19 dollars, defined in relation to the Fund’s global
administrative external deflator, representing a flat real resource envelope for the eighth year in a
budget row (excluding a $6 million security related increase in FY 17). 2, 3
$1,158 million in nominal terms, reflecting a preliminary assumption for the
increase in the Global External Deflator (GED) of 2.6 percent. 4 The personnel
component of the deflator reflects the Board’s decision on the FY 20
compensation adjustment.
FY 20 gross $1,397 million in nominal terms, reflecting $239 million in receipts, most of
administrative which consist of reimbursements for externally financed CD activities.
budget
Savings and $33 million in constant FY 19 dollars of net additional structural demands, offset
demands by reallocations and savings of the same amount.
Transitional As the expected FY 19 outturn is projected to be roughly at the level of the
needs approved structural budget (see Appendix II), some $30 million in carry-forward
resources from the previous year would still be available to staff. Of this,
2 Subject to approval by the Executive Board, the budget envelope also assumes an unchanged net administrative budget in
real terms for the Independent Evaluation Office (IEO), while the net administrative budget for the Offices of Executive
Directors (OED) is proposed to be unchanged in real terms, except for a reduction of $0.8 million that is transferred to the
staff budget as an additional reserve available for institutional priorities.
3
Using the U.S. CPI instead of the GED would have resulted in a slightly lower path for the nominal budget or about
¼ percent per year for the same period.
4 Personnel represents 70 percent of the GED. See Appendix I for background on key budget concepts and the deflator.
INTERNATIONAL MONETARY FUND 5FY2020–FY2022 MEDIUM-TERM BUDGET
$25 million is to be allocated up front to departments in the FY 20 budget
process. This is some $6 million more than last year, largely due to temporary
modernization costs.
FY 20 capital $86 million in nominal terms, comprising $41 million for building facilities and
budget $45 million for information technology. The latter includes $30 million for the
Big 5 programs for which summaries of business cases and cost benefit analyses
will be presented to the Board as they are finalized. Indicative estimates are
provided for the outer years.
Structure of the Paper
The strategic context sets the stage for the medium-term budget proposal. It is
followed by a section describing planned spending by outputs across the Fund’s
Thematic Categories (FTC). This is part of an ongoing effort to better align the
budget process with strategic planning as laid out in the GPA and the BWP, and
to improve the costing of products to aid the evaluation of tradeoffs. From there
follows a brief section on planned spending by inputs and implications for
departmental budgets. The capital budget is discussed next, followed by risks to
the budget. Appendices cover Budget Concepts and Methodology, the
Projected FY 19 Outturn, Evolution of the Budget, Strategic Planning Process
Timeline, Mapping between ACES and FTCs, Implementation Status of
Streamlining and Modernization Measures, Long-term Capital Investment Plan,
Big 5 Program Objectives, Timelines, and Governance, and Statistical Tables.
THE STRATEGIC CONTEXT
1. Over the medium to long term, the size of the Fund’s budget and its allocation reflect
long-standing twin objectives:
• Financial sustainability, underpinned by appropriately conservative assumptions for net
income projections and prudent management of budgetary resources. With net operational
income projected to remain positive over the longer term (Figure 1), and higher in the near term
than projected at the time the FY 19 budget was formulated, precautionary balances can be adequately
built up to manage financial risks. This assumption holds under appropriately conservative longer-
term assumptions in the context of the New Income Model. 5 Additionally, reflecting prudent
management, budgetary resources have been held flat in real terms over the past eight years,
notwithstanding rising demands and the launching of new products and activities (Appendix III on
the Evolution of the Budget).
• Meeting the evolving needs and priorities of members in an agile, integrated, and member-
focused way. The IMF’s conjunctural priorities are elaborated in the GPA and shift in response to
the global economic conditions as well as underlying structural trends affecting members (e.g.,
5 Key assumptions in the longer-term (FY 29) include a lending volume of SDR 20 billion (versus an average stock of
SDR 51.4 billion in FY 19); an SDR interest rate of 3 percent, with an unchanged margin of 100 basis points for the rate of
charge; 50 basis points excess return over the SDR rate in the Fixed Income Subaccount; a constant USD payout from the
Endowment; and no surcharge income.
6 INTERNATIONAL MONETARY FUNDFY2020–FY2022 MEDIUM-TERM BUDGET
challenges arising from rapid technological and financial innovations, with impacts such as Fintech
and concerns about the future of work). Multi-year reviews of the Fund’s main activities, such as the
Comprehensive Surveillance Review (CSR) and IEO evaluations, help ensure that the toolkit evolves
in line with the needs of its membership. Budgetary resources need to be flexible enough to
respond to changing priorities, including through the ability to reallocate across departments, and
the provision of transitional funds to accommodate temporary demands.
Figure 1. Actual and Projected Income and Expenses, FY 08–29
(Millions of U.S. dollars)
5,000 5,000
4,500 4,500
Operational income
4,000 including surcharges 1/ 4,000
3,500 3,500
3,000 3,000
2,500 2,500
2,000 2,000
1,500 1,500
1,000 1,000
500 500
Expenses 2/
0 0
FY 08 FY 09 FY 10 FY 11 FY 12 FY 13 FY 14 FY 15 FY 16 FY 17 FY 18 FY 19 FY 20 FY 21 FY 22 FY 23 FY 24 FY 25 FY 29
SDRi 3% 3/
Source: Finance department.
1/ Actual and projected operational income includes surcharges, investment income from the Fixed-Income Subaccount and payouts from the
Endowment Subaccount, and excludes IAS 19 gains and losses. The endowment payout is indicative and assumes a constant payout of 2 Percent of the
NAV (in US$) starting in FY2021, adjusted for inflation in the following years.
2/ Assumes that the net administrative budget is held constant in real terms.
3/ The illustrative scenario in FY 2029 assumes credit outstanding to be SDR 20 billion, precautionary balances at SDR 15 billion, SDR interest rate of
3 percent, the premium on investment return equal to 50 basis points, and a payout from the endowment at 2 percent of the U.S. dollar NAV.
2. Capacity development (CD) activities have allowed the Fund to increase its level of support to
the membership and its effectiveness overall, but limits to this expansion may have been reached.
Supported by greater external financing, the balance of the Fund’s outputs has shifted significantly toward
CD. Since FY 12, the share of CD spending has grown by 7 percentage points to reach 31 percent of
total gross administrative expenditures (including indirect costs). 6 While demand continues to exceed
supply, several interlinked factors argue for broadly containing the level of CD at current levels:
• Synergies with other outputs and comparative advantage: Ensuring that CD is integrated with
the Fund’s other outputs means that the topics and scale of CD should be guided by the synergies
created with lending programs and surveillance. 7 The Fund should also deliver CD only in areas of
its core mandate and where it has a comparative advantage relative to other CD providers. While in
some topical areas the IMF is the only CD provider, in other areas it is not.
• The need to ensure high quality: CD’s high value to the membership is derived from the quality
and consistency of its advice. This means that quality control can be a limiting factor on the size of
CD. There is a limited pool of experienced permanent staff to oversee and deliver CD, and this
6 For more background information on CD, see Annex I in FY2018 - Output Cost Estimates and Budget Outturn.
7
As discussed in the 2018 Review of the Fund’s Capacity Development Strategy.
INTERNATIONAL MONETARY FUND 7FY2020–FY2022 MEDIUM-TERM BUDGET
constraint can only be partially relieved by hiring external experts, given the limits on their
availability and the critical need for back-stopping by HQ-based staff.
• Financing constraints: A greater reliance on external funding increases risks to the Fund’s budget
given the inherent volatility of external funding, and changing donor priorities may also affect the
Fund’s ability to meet country needs on certain topics (see Section on Budget Risks). In addition,
increases in externally financed CD activities, while a possibility, have a knock-on effect to the Fund-
financed budget via indirect costs that cannot be recovered from external partners (e.g., facilities,
human resource services, etc.). The Fund-financed budget therefore represents a constraint even on
the externally financed activities.
• Need for modernization: Processes and systems to support CD budget, planning and results
monitoring, as well as related reporting, have not kept pace with the large and complex portfolio
resulting from CD growth. The Fund is investing in modernizing CD systems which will lead to more
effective and efficient delivery, and potentially support further scaling up of donor financing in the
future.
3. In the near term, the budget is set within the priorities laid out in the GPA and fleshed
out more fully in the BWP. 8 Global growth has weakened, and risks are increasingly tilted to the
downside amid growing policy uncertainty, mounting vulnerabilities, and greater volatility. Responding
to these challenges, priority areas for the current budget cycle include:
• Country operations: The GPA calls for the Fund to help members face global economic challenges
by providing advice on macroeconomic policies tailored to their circumstances. 9 This includes
program support and intensive surveillance of countries and regions, as well as CD provision. The
current number of formal Fund financial arrangements is relatively low, particularly for the PRGT
and PSI facilities (Figure 2), though recent cases have proven more complex. In addition, staff
expect an uptick in program work in FY 20. These expectations have been built into the budget
proposal with additional resources. Based on area departments’ view on the prospective
engagement status for their countries and other risk analysis, the budget provides for a reallocation
of resources to where engagement is most likely to pick up—reflecting the type of arrangements
for which a similar amount of staff resources is expected, some of which may be non-financial
arrangements such as PCI, PSI, or PPM. Beyond this, short-term unforeseen pressures are typically
met through intra- and inter-departmental reallocations and use of the contingency. Priorities
include strengthening support to low-income countries (LICs) and fragile states, implementing the
enhanced governance framework, as well as strengthening macro-financial surveillance.
8 See Appendix IV for a timeline of the main elements involved in the annual strategic planning cycle.
9 The Managing Director's Global Policy Agenda: Rising Risks: A Call for Policy Cooperation, October 2018.
8 INTERNATIONAL MONETARY FUNDFY2020–FY2022 MEDIUM-TERM BUDGET
Figure 2. Fund Arrangements, FY 00–19 1/
(Number of countries)
40
35
30
25
20
15
10
5
0
FY 00FY 01FY 02FY 03FY 04FY 05FY 06FY 07FY 08FY 09FY 10FY 11FY 12FY 13FY 14FY 15FY 16FY 17FY 18FY 19
GRA GRA static 10-yr avg. (FY 10-FY 19)
PRGT+PSI PRGT+PSI static 10-yr avg (FY 10-FY 19)
Source: MONA Database and staff calculations.
1/ Blend GRA/PRGT arrangements are included as PRGT. Based on number of arrangements at end of period. For FY 19,
includes current arrangements as of December 18, 2018.
• Analytical work to support policy advice. The GPA outlines several areas for further analysis,
such as supporting efforts toward a strengthened, rules-based multilateral trade system (new
multilateralism) through work on trade; contributing to the international tax debate; and work on
the digital economy and on public debt. Resources are proposed for BWP items such as Fintech
and digitalization, social spending, as well as work still under development such as the integrated
policy framework.
• Major Fund policy reviews of surveillance (Comprehensive Surveillance Review (CSR), FSAP review,
data provision), lending (conditionality, LIC facilities), and debt issues (debt limits).
4. To improve the quality of the Fund’s outputs, with increased emphasis on results, several
major modernization efforts are underway. These include implementation of the Fund’s human
resource (HR) strategy, which seeks to ensure an agile, diverse, and inclusive workplace, supported by a
new modern human resources IT system, in addition to completion of the Comprehensive
Compensation and Benefits Review (CCBR). Other initiatives are focused on better leveraging
knowledge management, improving data management, enhancing the management and administration
of capacity development, and transforming work processes through an integrated digital workplace.
These so-called “Big 5” major initiatives will require substantial investments over a number of years,
with commensurate savings and efficiency gains bearing fruit over the medium-term (Box 1). In addition,
follow-up work to the recommendations of the 2018 Modernization and Streamlining Advisory Group is
underway in areas outside the scope of the Big 5, including but not limited to support services.
Together, these efforts aim to simplify processes and practices to achieve greater efficiency, freeing up
resources to directly support the membership. The objective is to ultimately improve the quality of the
Fund’s outputs, with increased emphasis on results. In the near-term, some temporary resources
(including staff resources) and capital investments will be needed to support these efforts.
INTERNATIONAL MONETARY FUND 9FY2020–FY2022 MEDIUM-TERM BUDGET
Box 1. Modernization and the “Big 5” Programs
The Fund is modernizing internal processes and capabilities in an effort to increase its effectiveness and
adapt to the members’ needs. This includes five transformational programs (the “Big 5”) that are in various
stages of implementation: transformation of the HR system and operating model (1HR), reformed Capacity
Development Management and Administration Processes (CDMAP), development of an Integrated Digital
Workplace (IDW), a next generation economic data platform (iDATA), and knowledge management (KM).
Benefits common to all the programs include replacement and consolidation of obsolete technology
platforms, mitigation of operational and reputational risks, and updated features and functionality provided
by modern and mobile technology. The programs provide the opportunity to redesign and streamline work
processes and practices to take advantage of automation and other productivity enhancements.
Big 5 implementation will require considerable administrative and capital resources. The FY 20 administrative
budget includes close to $4 million in transitional resources for project management activities; departments
are additionally devoting considerable staff time to program governance, requirements gathering, vendor
selection, process reengineering, testing and training. The medium-term capital budget includes funding for
technology and consulting components that are specific to each program, but also include a number of pre-
requisite, or foundational, IT elements that must be present for successful implementation. In FY 20, the
initial capital budget allocation for the Big 5 has been set at $30 million, but additional resources may be
required (see Section on Capital Budget).
Business Streamlined and standardized processes
The modernization effort, underpinned by the Big 5, is
outcomes Alignment with best practices
expected over the medium term to result in Manage operational and reputational risk
efficiencies and more cost-effective delivery. Each Flexiblity to adapt to policy/practice
program team is preparing a comprehensive business changes
case and cost-benefit analysis, which will document Improved access to data and information
performance indicators and quantify expected cost Productivity and efficiency gains
reductions and efficiency gains. Savings resulting from
Big 5 1HR CDMAP IDW KM iDATA
the programs can be used to finance other priorities in
Pre- Identity and access management
support of the membership.
requisite Cloud development and integration
• 1HR will modernize, simplify, and transform the projects Corporate data warehouse
way the Fund delivers its HR services, through
streamlined business practices, best in class cloud software, and enhanced controls, providing flexibility
to accommodate future policy, practice or regulatory changes (e.g., HR Strategy and CCBR).
• CDMAP will transform CD operations, supporting more efficient and transparent implementation of the
CD governance framework. It will address process and systems weaknesses, support better decision-
making, and help strengthen the integration with surveillance and lending in line with the CD strategy.
• iDW will provide a modern user interface where staff have improved access to knowledge, applications,
and other platforms to do their work. The goal is to address the pain points experienced from existing
fragmented content, information silos, and obsolete technology.
• KM provides a framework for efficiently capturing, storing and sharing knowledge, thereby enabling
staff to more easily draw lessons and insights from the Fund’s rich cross-country experience and
subject-matter expertise. This includes a new document management system and enterprise search
capabilities.
• iDATA will deliver a modern economic data lifecycle management platform that can be further
extended to meet the growing business needs for creating and maintaining databases for multilateral
surveillance and economic research.
10 INTERNATIONAL MONETARY FUNDFY2020–FY2022 MEDIUM-TERM BUDGET
THE BUDGET: HOW ARE PRIORITIES SUPPORTED?
This section discusses the proposed use of budget resources across the Fund’s main output areas
according to the Fund’s Thematic Categories as presented in the BWP (Table 2). 10
Overall Shift in Outputs
Longer-term Two main observations can be made on how the Fund’s output structure has
output trends changed between FY 12 and FY 19:
• First, today’s output structure reflects the waning of the global financial
crisis. Country work (divided into its subcomponents in the green bars
below) has shifted from lending toward bilateral surveillance, and the
share of policy work has also declined as fewer crisis-related Fund policies
needed to be addressed. Other outputs (policy advice and economic
analysis, and contributions to global stability) remain broadly unchanged
(blue bars).
Change in Share of Spending, by FTC, FY 19 vs FY 12 1/
(Percent of Fund-financed Spending)
Country work
Policy advice and economic analysis
Contributions to global stability
Fund policies
IMF Governance
Internal support
-4% -2% 0% 2% 4%
Bilateral Surveillance Lending Capacity Development Country Work
Source: Office of Budget and Planning.
1/ Change in share of total spending between FY19 projected outturn and FY 12 outturn.
• Second, the share of spending on internal support has grown (gray bar),
reflecting ongoing corporate modernization efforts, such as the creation
of a Knowledge Management Unit and the Office of Risk Management,
10 Appendix V discusses the correspondence between the Fund’s Thematic Categories (FTC) and the output areas used
in the Fund’s Analytic Costing and Estimation System (ACES). As noted in the BWP, staff are working on improving
the interoperability between the categories used in the budget and the BWP to further strengthen strategic planning
and prioritization. This is work in progress and based on a mapping between ACES and the preliminary FTC.
INTERNATIONAL MONETARY FUND 11FY2020–FY2022 MEDIUM-TERM BUDGET
upgrading of data management tools, as well as pressures on physical
and IT security and other services (e.g., creative solutions, language). 11
Net shifts in the FY The FY 20 budget provides increased resources for country work ($13 million)
20 budget and for internal support ($6.7 million), mostly through transitional funding. 12
Within the flat structural budget, resources will be reallocated from internal
support to country work and to IMF governance ($2.9 million net reallocation),
and similarly from policy advice and economic analysis to work on Fund
policies (roughly $1.3 million net reallocation).
The text figure below shows the changes in structural and transitional
resources, by FTC, and Table 2 reflects the impact of these changes on the
overall budget.
Proposed Changes in Resources, by FTC, FY 20
(Millions of FY 19 U.S. dollars)
Country work
Policy advice and economic analysis
Contributions to global stability
Fund policies
Governance
Internal support
(15.0) (10.0) (5.0) - 5.0 10.0 15.0 20.0 25.0
Structural Demands Structural Savings Transitional Demands Net Structural Demands
Source: Office of Budget and Planning.
Transitional Carry forward resources are currently projected at about $30 million
resources (excluding OED and IEO), providing continued room to meet transitional
needs. For FY 20, an upfront allocation of $25 million in transitional funds is
planned. This is some $6 million higher than last year, largely due to
temporary modernization costs. A higher upfront allocation of transitional
resources means lower centrally held resources to meet unexpected
demands, over and above the central contingency of $8 million. In the event
of significant unanticipated needs, departments would need to activate
contingency measures and reprioritize as warranted (see Section on Budget
Risks). 13
More than half of the transitional resources are for country work, to support
more intense engagement with the membership, implementation of the
11 Internal support, or “internal organization” as presented in the BWP, comprises spending on direct and indirect
support activities such as HR, information technology, corporate services, and general outreach.
12 The output numbers in this section are estimates of resource allocation and are not control totals. Appropriations
will continue to be approved at an aggregate level based on input accounts.
13 Departments identified contingency measures of some 2 percent of approved budget as part of the budget
formulation exercise.
12 INTERNATIONAL MONETARY FUNDFY2020–FY2022 MEDIUM-TERM BUDGET
enhanced governance framework, and to provide bridge financing as EUR
continues its structural downsizing. Another third of transitional funds will
support modernization projects, including the Big 5 and for the CCBR.
Reallocations and The budget stance entails reallocation within and across departments of
savings $33 million in gross terms, or close to 3 percent of total spending. While
most of the reallocations reflect changes and shifting of resources across
work streams, about 30 percent comes from operational efficiencies,
streamlining and modernization, as well as savings from travel. 14 Further
details are provided in the following sections.
Table 2. Gross Administrative Fund-Financed Resources: Estimated
Allocation by Output, FY 19–20
(Millions of FY 19 U.S. dollars)
FY 19 FY 20
Est. Structural Structural
Structural Transitional Total Outturn Demands Savings Structural Transitional Total
(a) (b) (c) = (a)+(b) (d) (e) (f) = (a)+(d)-(e) (g) (h) = (f)+(g)
Gross expenditures 1,175 19.4 1,194 1,171 31.4 33.0 1,167 25.4 1,193
Country engagement 467 7.7 475 479 11.3 9.0 469 10.7 480
Policy advice and economic analysis 166 2.0 168 170 3.3 4.7 164 2.9 167
Contributions to global stability 23 0.3 23 23 0.3 0.4 23 0.5 23
Fund policies 26 0.7 27 30 7.2 5.9 28 0.9 29
IMF governance 118 0.1 118 114 1.1 0.5 119 0.8 120
Internal organization/support 335 8.5 343 342 8.1 12.6 330 9.5 340
Miscellaneous 1/ 28 28 13 22 22
Contingency 2/ 12 … 12 ... 12 … 12
Receipts (40) (40) (36) 1.6 0.0 (38) (38)
Net expenditures 1,135 1,155 1,135 33.0 33.0 1,129 1,155
Carry forward (upper limit) 46 47
Allocated up-front in budget process 19 25
Total available resources 1,181 1,176
Source: Office of Budget and Planning, Analytic Costing and Estimation System (ACES).
Note: Numbers may not add to totals due to rounding.
1/ The "Miscellaneous" classification covers expenditures that currently cannot be allocated within the ACES model. For FY 19 it includes $6 million for the 2018 annual
meetings, no adjustment for the annual meetings was made in FY 20.
2/ Includes the contingency for staff, OED, and IEO. Not included is the proposed transfer of $0.8 million from OED to staff, curently recorded under IMF Governance.
14 Initial savings from implementing Streamlining and Modernization measures are estimated at $2.2 million, mostly
from more focused analytical work, including in multilateral surveillance. See Appendix VI for an update on the status
of implementation of this initiative.
INTERNATIONAL MONETARY FUND 13FY2020–FY2022 MEDIUM-TERM BUDGET
Country Engagement/Country Work
Overview 15 Engagement with member countries is at the heart of the Fund’s work,
accounting for half of total spending. This takes place through bilateral
surveillance, FSAPs, lending, and CD. A country’s degree of engagement with
$671m projected
the Fund helps set the resource base for area departments. Year-to-year
50% of total
$5m increase in
changes reflect the evolving intensity of engagement.
total available
resources
• Bilateral surveillance covers ongoing monitoring of individual members’
economies, which culminates in the Article IV consultation. In recent
years, a recurring issue of interest has been the extent to which resources
are being devoted to work on new or emerging policy issues, especially
in the context of pilot topics. The work processes associated with such
topics have now ended their pilot phases. Fiscal space and macro-
structural issues are generally expected to be covered in surveillance,
although not necessarily in every Article IV. Coverage of other topics,
such as gender, climate, and inequality, would be based on macro-
criticality. No new resources were requested for work on gender, climate
or inequality issues in FY 20. 16
• Spending on Financial Sector Assessment Program (FSAP) fluctuates due
to the cycle of mandatory FSAPs for systemically important financial
jurisdictions. This does not include spending on broader overall financial
surveillance, which is part of bilateral surveillance (Box 2).
• Engagement with members with arrangements (financial or non-financial
arrangements, e.g., PSI, PPM) is more intensive, requiring higher staffing.
Departments forecast an increase in program cases for FY 20 relative to
FY 19.
• All members are eligible to receive CD, though the vast majority is
focused on low and middle-income members. All IMF CD focuses on high
impact activities that are core to the Fund’s mandate. The Fund has a
policy of limiting the use of Fund-financed CD to advanced economies to
avoid crowding out CD to countries that could not otherwise afford it.
Following the recommendations of the Working Group on Cost-Recovery
for Externally Financed Activities, Management has approved two
modifications to the existing policy, with effect for FY2020. First, the
introduction of a minimum threshold for charging for TA in eligible
countries. Second, it was determined that the top two deciles of countries
15In the infographics in each thematic category, the text in the top half of the center shows the expenditure projection for
FY 19 and its share of total spending including donor-financed CD. The bottom half shows the increase in total
available resources (structural and transitional) in FY 20 compared with FY 19, corresponding to the difference between
columns (h) and (c) in Table 2.
16
The steady-state resource cost for work on four topics (gender, inequality, fiscal space, macro-structural) amounts
to $3–4½ million per year, of which country work would be $2½-3¼ million (about 1–1½ percent of bilateral
surveillance). See Box 1 in FY2019-FY2012 Medium-Term Budget.
14 INTERNATIONAL MONETARY FUNDFY2020–FY2022 MEDIUM-TERM BUDGET
ranked by GNI per capita (using World Bank data) was a better measure
of capacity to pay than the WEO classification of Advanced Economies, as
under the current policy. The policy does not apply to crisis situations
where no other source of funding is available.
Box 2. Financial Surveillance
Financial surveillance (FS) encompasses both multilateral and bilateral surveillance activities. Spending
on multilateral surveillance is focused on the GFSR and analysis of vulnerabilities and risks. SPR and LEG also
participate in FS activities, for example on Fintech. In bilateral surveillance, spending includes FSAPs in around
13 jurisdictions each year as well as support provided by MCM, LEG, RES, and SPR to area departments, both
at Headquarters and through Article IV missions.
Spending on FS is estimated at around $40 million. While not tracked separately, this estimate is based on
direct spending on (i) the GFSR, and on analysis of vulnerabilities and imbalances in MCM of around $10 million;
and (ii) within bilateral surveillance of $30 million, which contrasts to around $200 million in direct spending
on overall bilateral surveillance.1
One of the priorities for FY 20 is to redirect resources to bilateral FS. This is in keeping with the IEO Review of
Financial Surveillance, which called for devoting significant additional resources to FS, and principally bilateral
FS. In FY 20, $1.7 million (5½ percent increase) is allocated in gross terms to MCM to enhance bilateral FS. This
covers support to area departments, deepening the integration of FSAPs and Article IVs (as recommended by
IEO), easing FSAP staffing constraints, and governance. This is achieved in part through savings of $0.9 million
from implementation of modernization measures (GFSR streamlining).
As a complement, the Financial Sector Stability Review (FSSR) was launched in FY 18 as a donor-funded,
TA instrument. The FSSR helps low and lower-middle income countries diagnose financial sector
vulnerabilities and prioritize financial sector reforms. It provides a TA roadmap that in turn may be used to
support members’ efforts to strengthen and reinforce their financial stability frameworks. The FSSR work plan
allows for around five FSSR diagnostics each year, totaling about $1.5 million in FY 19. In FY 20, spending on
FSSR diagnostics and follow up TA is projected to increase to $1.8 million, a 22 percent increase. Going forward,
a larger proportion of the targeted $30 million in donor financing will be allocated to follow up TA as diagnostic
missions are completed.
In addition, MCM is in the process of establishing a Monetary Modeling Unit. This unit is aimed at
buttressing the Fund’s position as a global center of excellence on financial and macrofinancial topics and
maintaining the value added of the Fund’s financial surveillance for our membership. The unit will advance the
integrated policy framework, model development, and support members in the implementation of monetary
and foreign exchange operations. It is expected to consist of 6.5 FTE positions, of which one will be contractual.
This will be funded mostly through reallocation within and more cost-effective travel by MCM, together with
one additional FTE to be financed initially with transitional funds.
Beyond FY 20, the IEO’s call for additional resources for FS will be taken up in the context of the ongoing
CSR and FSAP reviews that are scheduled to be completed in 2020. Consideration of a further increase in
resources along with ways to make FS more efficient will be deferred until those reviews are completed.
___________
1
This includes bilateral surveillance undertaken by MCM (including FSAPs), dedicated macro-financial units in RES and SPR, and
cost estimates of area department work at the time of the macro-financial pilot. This is likely an underestimate, as it excludes
macro-financial surveillance in area departments outside of the pilots, and LEG’s work on bilateral surveillance beyond FSAPs.
INTERNATIONAL MONETARY FUND 15FY2020–FY2022 MEDIUM-TERM BUDGET
Net structural An increase of $2.3 million (½ percent in real terms) in FY 20.
Demands Structural resources are provided to support program work, mainly for AFR,
including for work on fragile states (Box 3), and for SPR to support review. Under
bilateral surveillance, structural resources are provided to functional departments
to support implementation of the enhanced governance framework (FAD, MCM,
LEG), international taxation (FAD), and macro financial surveillance (MCM).
Savings Mainly from the structural downsizing in EUR (bridged by transitional
resources), as well as streamlining of analytical work, and reductions in travel.
Transitional $10.7 million to fund increased program work in AFR and WHD, enhanced
needs bilateral surveillance in APD, EUR, and MCD, work on governance (FAD) and
better integration of FSAPs and Article IVs (MCM). In CD, transitional resources
are envisaged for SDG implementation (FAD), and training and RBM oversight
and development (FAD and ICD). Overall, this compares to $7.7 million provided
in FY 19.
Proposed Shifts in Country Engagement, FY 20
(Millions of FY 19 U.S. dollars)
Bilateral surveillance
FSAPs
Lending
Capacity development
(10.0) (5.0) - 5.0 10.0 15.0
Structural Demands Structural Savings
Transitional Demands Net Structural Demands
Source: Office of Budget and Planning.
Box 3. Spending on Fragile and Conflict States
Spending on fragile states has averaged around $96 million per year in real terms since FY 15 (10 percent of
total direct spending). Over 40 percent is CD, including
external financing. The set of over 40 countries designated
as fragile is diverse, encompassing small islands and high
security risk locations, and includes surveillance and
program countries. Accordingly, spending varies widely,
from below $200,000 in countries with little engagement
due to security risks, to several million dollars per year in
countries where engagement is intense.
In FY 20, increased resources for fragile states could come
from an internal reallocation of existing departmental
resources and from net new resources provided to
departments. Budget discussions suggest that country work on fragile states will increase by $1.2 million, mostly
for AFR countries. This includes support from FAD, which plans to shift six fiscal economists to LICs and fragile
states from other countries. Based on the outturn so far, spending on fragile states outside of CD is expected to
increase by 8 percent in FY 19, on a base of around $59 million. If spent as planned, FY 20 would see an
additional rise of 2 percent in real terms. CD to fragile states is a priority (see Box 4) and should also increase.
16 INTERNATIONAL MONETARY FUNDFY2020–FY2022 MEDIUM-TERM BUDGET
Leveling off in After a decade of expansion in CD activities, a leveling off in external financing
external funding levels is envisaged, with the overall resource envelope for CD remaining
broadly unchanged from FY 19 onwards. As discussed in the Strategic Context
section, (¶2,) various considerations factor into this stabilization. It is proposed
to limit external financing for CD to $200 million in FY 20.
Given a flat resource envelope, prioritization of CD activities will become
increasingly important, and reallocations between areas and topics will be
needed to fund new initiatives. Decisions on priorities are made following
discussion in the Committee on Capacity Building (CCB), culminating in
agreement by relevant heads of department and management. The CCB has
recently reviewed the framework for monitoring and prioritization of CD
(Box 4).
Gross Administrative Resources for CD: Estimated Allocation, FY 19–20
(Millions of U.S. dollars)
FY 19 FY 20
Budget Est. Outturn Budget
Direct Spending on CD 1/ 338.2 335.5 345.2
Fund-Financed CD 2/ 141.9 143.4 145.2
Externally-Financed CD 3/ 196.3 192.1 200.0
Memorandum Items:
CD (plus indirect costs) as a share of total Fund output 30.4 30.9 31.0
Trust Fund Management Fee (receipts) 4/ 13.7 13.4 14.0
Fund-Financed CD in FY 19 dollars 141.9 143.4 141.5
Estimated Indirect Cost of Externally Financed CD 17.7 17.3 18.0
Source: Office of Budget and Planning and CCB.
1/ Differs from ACES data in Appendix Tables 8a and 8b where some CD expenditures are classified as
Miscellaneous and the totals include support and governance costs.
2/ Nominal structural budget (i.e., excluding transitional resources).
3/ Operational targets established by the CCB. Outturn is based on receipts.
4/ Covers administration of the sub-account and not indirect costs linked mainly to IT and facilities.
INTERNATIONAL MONETARY FUND 17FY2020–FY2022 MEDIUM-TERM BUDGET
Box 4. Strengthening the Framework for Capacity Development Prioritization
Capacity Development (CD) work has grown rapidly in the past decade and now accounts for about a third
of all Fund spending. This increase has largely been driven by external financing, which grew by 16 percent per year
on average in the same period. The share of CD in total spending is now programmed to stabilize.
The framework for CD monitoring and prioritization is continuing to evolve. As noted in the 2018 CD
Strategy Review, this framework has been significantly strengthened in recent years, with further reforms now
underway aimed at facilitating more timely and
analytically useful information on CD-related Spending on CD, FY 13-21
35
activities and spending. These reforms and a
Budgeted
400 Outturns 30
30.9
planned strengthening of systems and processes
25
under the CDMAP project will facilitate better 300 25.9
Millions of USD
Percent
20
monitoring and reporting. This will support
200 15
better resource allocation and strategic review of
10
the alignment of CD activities with country 100
5
demand and Fund strategic priorities.
0 0
The prioritization process follows a three- FY 13 FY 14 FY 15 FY 16 FY 17
Externally-financed (lhs)
FY 18 FY 19 FY 20 FY 21
step process: Fund-financed (lhs)
CD (plus indirect costs)/total spending (rhs)
• The budget process establishes resources
for CD. This includes an envelope for externally financed activities and resources made available by CD
departments within their Fund-financed budgets.
• The CCB sets the areas targeted for growth for the coming three-year period and the departmental
spending limits on externally financed CD activities.
• The Resource Allocation Plan (RAP) sets out detailed delivery of CD activities between CD and Area
Departments, in line with the agreed priorities. Details of the FY 20–22 RAP, conducted in Spring, will be
included in the summer budget outturn report to the Board.
The prioritization framework recognizes that all Fund CD should target high-impact activities. Core CD
areas, such as revenue mobilization, public financial management, and financial supervision and regulation,
statistics and macroeconomic training will continue to account for the bulk total CD. The updated tracking
system will support analysis of trends in these areas. This year’s CCB agreed a narrower set of “growth areas”
where an increase in the share of CD over the medium-term is being targeted, recognizing that measurable
growth may take time as new tools are developed. An initial list of growth areas includes:
• Topics: Anti-corruption; debt sustainability and debt statistics; expenditure policy and public investment
management; tax policy, fintech, and cyber risks.
• Country-type: Fragile states, highly vulnerable countries, and Caucasus-Central Asia-Mongolia.
As the CD envelope stabilizes, much of this growth will need to be accommodated within existing areas for
Fund CD, e.g. increases in fintech as part of work on financial regulation.
Planned CD Spending FY 19
By Region By Topic
Western Hemisphere Domestic revenue
12% Other mobilization
Middle East and Central Asia Multiple or no region
26.0% 18.5%
11% specified
17%
Public financial
Europe management…
Financial supervision &
9%
regulation
11.2%
Macroeconomic
Statistics
Asia and the Sub-Saharan training…
12.7%
Pacific Africa
20% 31%
______________
1/ Prepared by ICD.
18 INTERNATIONAL MONETARY FUNDFY2020–FY2022 MEDIUM-TERM BUDGET
Policy Advice and Economic Analysis
Overview The flagship publications (WEO, GFSR, and Fiscal Monitor), External Sector
Report (ESR), and the Regional Economic Outlooks represent a stable core
of spending within “multilateral surveillance”, accounting for around
$170m projected $35 million. The remainder, forming the bulk of spending on policy advice
13% of total
$0.5m decrease in and economic analysis, is spent on work streams that are constantly
total available
resources evolving, with the findings usually presented to the Board and reflected in
the BWP (e.g., Bali Fintech Agenda, corporate taxation, External Balance
Assessments methodology, SDNs). This means that reallocations within this
category are usually relatively large. Box 5 discusses the relationship
between the strategic planning cycle, the BWP, and resource allocation.
Proposed Shifts in Policy Advice and Economic Analysis, FY 20
(Millions of FY 19 U.S. dollars)
Multilateral surveillance
General research
Monetary and financial
Statistics
(3.0) (2.0) (1.0) - 1.0 2.0 3.0 4.0
Structural Demands Structural Savings
Transitional Demands Net Structural Demands
Source: Office of Budget and Planning.
Net Structural A decrease of $1.4 million in FY 20, or 0.1 percent in real terms.
Demands Structural funding is envisaged for systemic risk analysis, capital controls and
Fintech (MCM), public sector balance sheet (FAD), work to extend the EBA-
lite to non-ESR countries (SPR), as well as for regional work (EUR).
Savings Significant resources are freed up from modernization and streamlining
measures (e.g., fewer GFSR analytical chapters and more focused REOs), and
completion of policy work, such as the review of the EBA-lite methodology
(combined savings of $1.5 million). Further savings come from completed
projects on systemic financial crises, exchange rate intervention, and capital
flows.
Transitional needs Transitional funds of $2.9 million. This includes work on cyber risk and the
integrated policy framework (MCM, $0.8 million), and accommodating price
increases for commercial data subscriptions ($0.4 million). Overall, this
compares to $2 million provided in FY 19.
INTERNATIONAL MONETARY FUND 19You can also read