Research Institute Global Wealth Report 2018 - Thought leadership from Credit Suisse Research and the world's foremost experts
←
→
Page content transcription
If your browser does not render page correctly, please read the page content below
October 2018

Research
Institute
Global Wealth Report 2018

Thought leadership from Credit Suisse Research and the world’s foremost experts
Introduction

               The Credit Suisse Global Wealth Report is the         Turning our interest to the lower level of the
               most extensive and current source of informa-         wealth distribution, we see that 3.2 billion
               tion on global household wealth. Now in its           adults or about 64% of the adult population
               ninth edition, the report not only provides           lives with a wealth below USD 10,000, which
               insights into the wealth development of regions       corresponds to only 1.9% of the global wealth.
               and segments, but for the first time it also          Those with low wealth are disproportionately
               focuses on the most recent evidence on female         found among the younger age groups, those
               wealth holdings, in particular on gender differ-      who live in regions where prospects for wealth
               ences with males.                                     creation are very limited (most notably Africa)
                                                                     and where opportunities are sometimes
               During the 12 months since our last report to         constrained.
               mid-2018, aggregate global wealth rose by USD
               14 trillion to USD 317 trillion, which represents a   The wealth of women has been receiving
               growth rate of approximately 4.6%. This growth        increasing attention and we estimate that
               rate was lower than last year, but higher than the    women account for about 40% of global
               average growth rate in the post-2008 era. This        wealth overall. During the 20th century, their
               was sufficient to outpace population growth, so       share of wealth rose considerably and, since
               that wealth per adult grew by approximately           the year 2000, the level of women’s wealth
               3.2%, a record high. Looking at the number of         has risen along with all household wealth,
               millionaires, we see that there are 42.2 million      especially in Asia alongside the rise of China’s
               millionaires worldwide, which is up 2.3 million       wealth. The tendency shows that more
               over the previous 12 months. Our research             self-made women are succeeding in business
               indicates that the United States added 878,000        and are entering the highest wealth ranks.
               new millionaires – representing around 40% of         Despite this trend, even in those countries
               the global increase – to its already sizable stock,   where progress is the strongest, some catego-
               whereas the number of newcomers in France,            ries of women – such as single mothers and
               Germany, the United Kingdom and Italy was             divorcees – remain disadvantaged. While more
               around 200,000 each. In China, the number of          is required to be done to ensure that women
               millionaires rose by a modest 186,000 and in          have an equal opportunity to build up, inherit
               Japan 94,000. The main explanation for these          and share in wealth, there are signs that
               increases in millionaire numbers within countries     progress has been happening in many parts of
               lies in the real wealth growth, rather than in        the world.
               exchange-rate movements. Millionaire numbers
               fell in very few countries (such as Turkey and        Given some of this year’s intriguing findings, we
               Brazil), and by relatively small amounts, the main    hope you find the 2018 edition of the Global
               driver being currency depreciation.                   Wealth Report a valuable source of insight and
                                                                     wish you interesting reading.
               The key finding of this year’s new wealth valuation
               is for many observers not surprising – China is
               now clearly established second place in the world
               wealth hierarchy. The country overtook Japan with     Urs Rohner
               respect to the number of ultra-high net worth         Chairman of the Board of Directors
               (UHNW) individuals in 2009, total wealth in 2011      Credit Suisse Group AG
               and the number of millionaires in 2014. Neverthe-
               less, the data shows that mean wealth per adult in
               China (USD 47,810 in mid-2018) remains far
               below the level in Japan (USD 227,240).

2
02
Introduction

04
Global wealth 2018: The year in review

13
Global trends in household wealth

20
The global wealth pyramid

25
Women and wealth

33
Wealth outlook

39
Wealth of nations
   40 United States – The boom goes on
   41 China – Growth champion
   42 India – Growth story
   43 Russia – Changing fortunes
   44 Germany – Powerhouse of Europe
   45 United Kingdom – Brexit gets close
   46 Switzerland – View from the top
   47 Singapore – Renewed growth
   48 Japan – Hanging on
   49 South Korea – Growth star
   50 Indonesia – Little recent growth
   51 South Africa – Wealth uptick
   52 Brazil – Sliding
   53 Chile – LatAm wealth champion
   54 Canada – Slower growth
   55 Australia – Still resilient

57
About the authors

58
General disclaimer / Important information

For more information, contact:
Richard Kersley, Head Global Thematic Research,
Credit Suisse Investment Banking,
richard.kersley@credit-suisse.com, or

Michael O’Sullivan, Chief Investment Officer,
International Wealth Management, Credit Suisse,
michael.o’sullivan@credit-suisse.com

                         Global Wealth Report 2018   3
Global wealth 2018:
The year in review

Anthony Shorrocks, James Davies and Rodrigo Lluberas

Now in its ninth edition, the Credit Suisse Global Wealth Report is the
most comprehensive and up-to-date source of information on global
household wealth. Wealth continued to grow at a moderate pace in
2018, partly reflecting continued rises in equity markets but due more
to increases in non-financial assets. The United States continued its
unbroken spell of wealth gains since the global financial crisis, adding
another USD 6 trillion to the stock of global wealth. China and Europe
also made significant contributions to the new record level of global
wealth, which is equivalent to USD 63,100 per adult.

                   Wealth landmarks in mid-2018                       Another prominent feature of the world
                   The world was wealthier in the past than we        wealth outlook this year is the seemingly
                   believed a year ago. New official statistical      relentless rise in household wealth in the
                   data and other reliable sources have led us to     United States. Total wealth and wealth per
                   revise our estimate of total global wealth in      adult in the United States have grown every
                   mid-2017 upward by nearly USD 23 trillion,         year since 2008, even when total global
                   or 8%. China is the main beneficiary of this       wealth suffered a reversal in 2014 and 2015.
                   newly recorded wealth, although Spanish            The United States has accounted for 40% of
                   wealth has also been subjected to a major          all increments to world wealth since 2008,
                   upgrade. The revision mostly relates to            and 58% of the rise since 2013. While not
                   non-financial assets owned by the middle           wishing to cast doubt on the "Trump Effect"
                   class. This reduces our estimate of the share      on financial markets, it seems inevitable that
                   of financial assets in total global wealth by 1%   the uninterrupted spell of increasing wealth
                   and the shares of the top 1% and top 10% of        in the United States will come to an end at
                   wealth holders by about three percentage           some time. Fortunately, there are signs that
                   points.                                            wealth inequality is no longer rising, which
                                                                      should mitigate the impact of any setback on
                   The main outcome of the new wealth valua-          the middle classes.
                   tions is confirmation of what many observers
                   already suspected – that China is now clearly      An overview of the past year
                   established in second place in the world           During the 12 months to mid-2018, aggregate
                   wealth hierarchy. Our revised figures suggest      global wealth rose by USD 14.0 trillion to USD
                   that China overtook Japan with respect to the      317 trillion, representing a growth rate of 4.6%
                   number of ultra-high net worth (UHNW)              (see Table 1). This growth rate was lower than for
                   individuals in 2009, total wealth in 2011, and     calendar year 2017, but higher than the average
                   the number of millionaires in 2014. However,       growth rate in the post-2008 era, and a consider-
                   mean wealth per adult in China (USD 47,810         able improvement on the decline during 2014–15.
                   in mid-2018) remains far below the level in        It was also sufficient to outpace population
                   Japan (USD 227,240), and median wealth             growth, so that wealth per adult grew by 3.2%,
                   lags even further behind Japan (USD 16,330         raising global mean wealth to USD 63,100 per
                   versus USD 103,860).                               adult, a record high.

4
Table 1: Change in household wealth 2017–18, by region

                      Total           Change in            Wealth      Change in       Change in financial        Change in non-          Change in debts
                     wealth          total wealth         per adult    wealth per           assets                financial assets
                                                                         adult
                      2018       2017–18 2017–18            2018       2017–18         2017–18      2017–18 2017–18 2017–18             2017–18       2017–18

                    USD bn        USD bn         %          USD             %          USD bn             %      USD bn        %        USD bn          %

Africa                2,553         108          4.4        4,138           1.5            37             2.8      68         4.8           -4          -1.3

Asia-Pacific         56,715         929          1.7       48,119           0.0           675             2.1     833         2.6          578          6.6

China                51,874        2,266         4.6       47,810           4.0           422             2.0     2,786       8.5          942         22.7

Europe               85,402        4,432         5.5       144,903          5.4          1,167            2.7     4,047       7.9          782          5.9

India                 5,972         151          2.6        7,024           0.7           -16             -2.5    251         4.3           84         13.3

Latin America         8,055         -415        -4.9       18,605          -6.5           -215            -6.1    -127        -2.0          72          5.1

North America        106,513       6,486         6.5       391,690          5.5          4,960            6.0     2,203       6.5          677          4.2

World                317,084       13,958        4.6       63,100           3.2          7,030            3.8    10,061       6.2         3,133         7.1

Source: James Davies, Rodrigo Lluberas and Anthony Shorrocks, Credit Suisse Global Wealth Databook 2018

                                                                      North America added USD 6.5 trillion to its stock
                                                                      of household wealth in the last year, almost all in

"China is now clearly
                                                                      the United States, which accounted for USD 6.3
                                                                      trillion. Europe contributed an additional USD 4.4
established in second                                                 trillion, China USD 2.3 trillion, and Asia-Pacific
                                                                      (excluding China and India) almost USD 1 trillion.
place in the world                                                    But Africa, India and Latin America together saw

wealth hierarchy"                                                     a net loss, partly due to the economic troubles in
                                                                      Argentina and Brazil. In percentage terms, the
                                                                      6.5% loss in Latin America exceeded the percent-
                                                                      age gains in North America, Europe or China.
                                                                      Adverse currency movements were partly to blame.
                                                                      Using smoothed exchange rates, wealth growth
Financial assets suffered most during the                             was positive in Latin America and slightly higher in
financial crisis and recovered better in the                          Africa and India. But the overall assessment
early post-crisis years. They continue to make                        changes very little when smoothed exchange rates
a substantial contribution to growth of house-                        are used.
hold wealth, accounting for 41% of the
increase in gross wealth worldwide, and more                          Winners and losers among countries
than two-thirds of the rise in North America.                         Comparing wealth gains and losses across
However, non-financial assets have grown                              countries, the United States and China led
faster in recent years. Over the past 12                              the pack by some margin, although Germany,
months, they have provided the main impetus                           France and the United Kingdom all recorded
to overall growth in all regions except North                         an increase of nearly USD 1 trillion, and Italy
America, accounting for more than 75% of the                          and Japan about USD 500 billion each. The
rise in China and Europe, and all of the rise in                      main losses occurred in Brazil (down USD
India. Household debt rose even faster at an                          380 billion), Turkey (down USD 190 billion)
overall rate of 7.1%. According to our esti-                          and Argentina (down USD 130 billion).
mates, debt increased in all regions except                           Venezuela probably did worse, but we are
Africa and achieved double-digit growth in                            unable to offer a reliable estimate given the
China and India.                                                      exchange rate collapse.

                                                                                                                          Global Wealth Report 2018             5
Figure 1: Change in household wealth per adult 2017–18, Viewed in terms of wealth per adult, the
biggest gains and losses (USD) United States again heads the list of increases
(Figure 1). But a number of smaller countries
United States
also appear in the top ten: Ireland (up USD
Libya
France 15,690), Singapore (up USD 14,290),
United Kingdom Belgium (up USD 13,020) and Hong Kong
Ireland (up USD 11,510). On the downside, wealth
Singapore per adult dropped by more than USD 10,000
Germany
in Israel, New Zealand and Sweden, and by a
Belgium
Netherlands greater amount in Switzerland (down USD
Austria 21,340).
Hong Kong
Italy Asset prices and exchange rates
Much of the year-on-year variation in wealth levels
Israel
New Zealand
can be traced to changes in asset prices and
Sweden exchange rates. Exchange-rate movements usually
Switzerland underlie the biggest gains and losses. During the
past 12 months, exchange rates have been
-30,000 -20,000 -10,000 0 10,000 20,000 30,000 relatively stable compared to recent history. Among
the countries listed in Figure 2 (the G7 countries
Source: James Davies, Rodrigo Lluberas and Anthony Shorrocks, Credit Suisse Global Wealth
Databook 2018 plus China and India), exchange-rate changes
versus the US dollar did not exceed 3%, apart from
a 6% depreciation in Russia and India. This was
broadly true of the rest of the world, except for the
large depreciations recorded for Pakistan and Brazil
(both 14%), Turkey (23%) and Argentina (42%).
Figure 2: Change in market capitalization, house prices and
USD exchange rate (%), 2017–18
Canada
"Much of the year-on-
China
France
Germany year variation in wealth
India levels can be traced to
Italy
changes in asset prices
and exchange rates"
Japan
Russia
United Kingdom
United States
-10 -5 0 5 10 15 While equity markets continued to achieve new
peaks, the rises were down on average from last
House prices Market capitalization USD exchange rate year. Figure 2 shows that market capitalization
Source: James Davies, Rodrigo Lluberas and Anthony Shorrocks, Credit Suisse Global Wealth growth was within the 4%–11% range among G7
Databook 2018
nations, although Russia managed 14% growth
and China fell by 6%. Elsewhere, markets rose by
more than 20% in Tunisia and Colombia, and by a
greater amount in Norway (33%), Egypt (48%),
Vietnam (60%) and Ukraine (130%). Falls of more
than 10% were recorded in the Philippines,
Poland, Serbia and Pakistan, and in excess of
20% in Turkey and Argentina.
House-price movements are a proxy for the
non-financial component of household assets. Here
again, the year-on-year change was modest at
between –4% and +4% for the countries in Figure
2 except for slightly higher values in Germany (7%)
and India (9%). In the rest of the world, house
prices did not fall by more than 10%, or rise by
more than 12%, except in Argentina (up 29%).
6
Figure 3: World Wealth Map 2018

Wealth levels (USD)
  Below USD 5,000
  USD 5,000 to 25,000
  USD 25,000 to 100,000
  Over USD 100,000
  No data

Source: James Davies, Rodrigo Lluberas and Anthony Shorrocks, Credit Suisse Global Wealth Databook 2018

Wealth per adult across countries                                    to fourth position, and Japan (USD 103,860)
The global figure of USD 63,100 for wealth per                       up ten places to seventh position. In contrast,
adult masks considerable variation across                            high wealth inequality pushes Norway down
countries and regions, as is evident in Figure 3.                    seven places, and Denmark down 11 places,
Nations with wealth per adult above USD                              while median wealth of just USD 61,670
100,000 are located in North America, Western                        relegates the United States to 18th place,
Europe, and among the rich Asia-Pacific and                          alongside Austria and Korea.
Middle Eastern countries. Switzerland (USD
530,240), Australia (USD 411,060) and the                            The "intermediate wealth" group in Figure 3
United States (USD 403,970) again head                               covers countries with mean wealth in the
the league table according to wealth per                             range of USD 25,000–100,000. The core
adult, followed by Belgium (313,050),                                member these days is China. But the group
Norway (291,100), and New Zealand (USD                               also includes many recent entrants to the
289,800). Canada (288,260), Denmark                                  European Union (EU), together with important
(286,710), Singapore (283,260) and France                            emerging-market economies in Latin America
(280,580) occupy the remaining places in                             and the Middle East. One step below, the
the top ten.                                                         "frontier wealth" range from USD 5,000–
                                                                     25,000 per adult covers the largest land
The ranking by median wealth per adult                               surface and most of the heavily populated
favors countries with lower levels of wealth                         countries including India, Russia, Brazil,
inequality and produces a slightly different                         Indonesia, the Philippines, and Turkey. The
table. This year, Australia (USD 191,450)                            band also contains most of Latin America,
edged ahead of Switzerland (USD 183,340)                             many countries bordering the Mediterranean,
into first place according to our estimates.                         and many transition nations outside the EU.
The median wealth placements of Belgium                              The remaining members of this category
(USD 163,430), Canada (USD 106,340),                                 include South Africa and other leading
New Zealand (98,610), the United Kingdom                             sub-Saharan nations, along with several
(97,170) and Singapore (USD 91,660) are                              fast-developing Asian countries like Malaysia,
similar to their mean wealth ranking, but                            Thailand and Vietnam. This leaves the final
lower inequality moves France (USD                                   group of countries with wealth below USD
106,830) up five places to fifth position, the                       5,000, which are heavily concentrated in
Netherlands (USD 114,930) up eight places                            central Africa and central and south Asia.

                                                                                                            Global Wealth Report 2018   7
Regional distribution of wealth                                       Assigning individuals to their corresponding global
    The World Wealth Map (Figure 3) illustrates                           wealth positions enables the regional pattern of
    the geographical imbalance in the distribution                        wealth to be portrayed. The contrast between China
    of household wealth. North America and                                and India is the most striking feature of Figure 4.
    Europe together account for 60% of total                              Most Chinese adults are found in the upper middle
    household wealth, but contain only 17% of the                         section of global wealth distribution, where they now
    world adult population. The total wealth of the                       account for almost half of worldwide membership of
    two regions was similar at one time, with                             deciles 7–9. China's record of strong growth this
    Europe's greater population compensating for                          century, combined with rising asset values and
    higher average wealth in North America.                               currency appreciation, has shifted its median position
    However, North America pulled ahead after                             in Figure 4 toward the right. China now accounts for
    2013, and now accounts for 34% of global                              18% of the top decile of global wealth holders,
    wealth compared to 27% for Europe. Else-                              slightly less than the number of residents in the
    where, the share of wealth is below the                               United States (20%), but well above the number in
    population share. The discrepancy is modest in                        Japan (11%), and a long way ahead of France,
    China and in the Asia-Pacific region (excluding                       Germany, Italy, and the United Kingdom (each 5%),
    China and India), where the population share is                       which it overtook in 2010. In contrast, residents of
    about 30% higher than the wealth share. But                           India remain heavily concentrated in the bottom half
    the population share is more than three times                         of the distribution, accounting for more than a
    the wealth share in Latin America, nine times                         quarter of the members. However, the country's
    the wealth share in India, and 15 times the                           high wealth inequality and immense population mean
    wealth share in Africa.                                               that India also has a significant number of members
                                                                          in the top wealth echelons.
    Distribution of wealth across individuals
    To determine how global wealth is distributed
    across individuals, rather than regions or coun-

                                                                          "Assigning individuals to
    tries, we combine our estimates of the level of
    household wealth across countries with informa-
    tion on the pattern of wealth distribution within
    countries. A person needs net assets of just
                                                                          their corresponding global
    USD 4,210 to be among the wealthiest half of                          wealth positions enables
    world citizens in mid-2018. However, USD
    93,170 is required to be a member of the top                          the regional pattern of
    10% of global wealth holders, and USD
    871,320 to belong to the top 1%.
                                                                          wealth to be portrayed"

    Figure 4: Regional composition of global wealth distribution in 2018

    100%

     90%                                                        Latin America                                          North
                                                                                                                       America
     80%
                     Africa
     70%
                                                                                                              Europe
     60%

     50%
                                      India                                   China
     40%

     30%

     20%                          Asia-Pacific
     10%

      0%
           10         20         30           40       50         60         70         80          90         95        99        100
                                                                                                                              Percentile

    Source: James Davies, Rodrigo Lluberas and Anthony Shorrocks, Credit Suisse Global Wealth Databook 2018

8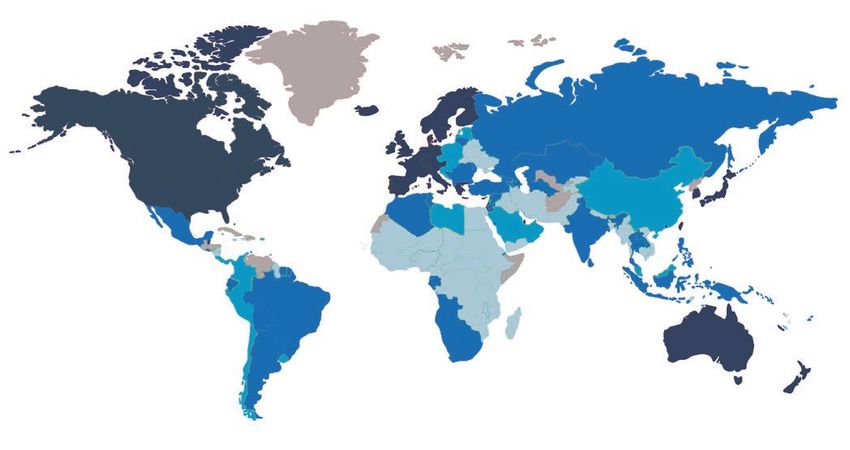
Residents of Latin America are fairly evenly spread                   percentile. Europe alone accounts for 32%
across the global wealth spectrum in Figure 4. The                    of members of the top wealth decile, and the
Asia-Pacific region (excluding China and India)                       proportion this century has been as high as
mimics the global pattern even more closely, but its                  42% when the EUR-USD exchange rate was
apparent uniformity masks substantial polarization                    more favorable.
within the region. Residents of high-income Asian
countries, such as Hong Kong, Japan and                               Wealth inequality
Singapore, are heavily concentrated at the top end:                   While the bottom half of adults collectively owns
almost half of all adults in high-income Asian                        less than 1% of total wealth, the richest decile
countries are in the top global wealth decile. In                     (top 10% of adults) owns 85% of global wealth,
contrast, citizens of lower-income countries in Asia,                 and the top percentile alone accounts for almost
such as Bangladesh, Indonesia, Pakistan, and                          half of all household wealth (47%). The shares
Vietnam, tend to be found further down the wealth                     of the top 1% and top 10% in world wealth fell
pyramid. In fact, when high-income countries are                      significantly between 2000 and 2008: the share
excluded from the Asia-Pacific group, the wealth                      of the top percentile, for instance, declined from
pattern within the remaining countries resembles                      47% to 43%. However, the trend reversed after
that of India, with both regional groupings contribut-                the financial crisis. The share of the top 10%
ing about a quarter of the members of the bottom                      was little affected. But in 2016 the share of the
half of the wealth pyramid.                                           top 1% rose back above the level we estimate
                                                                      for 2000. The trend in the share of the top 1%
Africa is even more concentrated at the                               partly reflects the trend in the share of financial
bottom end of the wealth spectrum: more than                          assets in the household portfolio, which fell
half of all African adults belong to the lowest                       during 2000–08 and then began to rise after the
two global wealth deciles. At the same time,                          global financial crisis, raising the wealth of many
wealth inequality is so high in Africa that some                      of the richest countries, and of many of the
individuals are found among the top global                            richest people.
wealth decile, and even among the top
percentile. Interestingly, North America and                          The share of financial assets peaked in 2015 and
Europe also contribute many members to the                            has been declining since then. In previous reports,
bottom wealth decile, a reflection of the ease                        we predicted that wealth inequality would follow suit
with which individuals – especially younger                           – possibly with a slight lag – and there is evidence
adults – acquire debt in advanced economies.                          that this is now the case. The share of the top
Overall, however, North America and Europe                            decile and the top 5% remains at the same level as
are heavily skewed toward the top tail,                               in 2016, while the share of the top 1% has edged
together accounting for 56% of adults in the                          down from 47.5% to 47.2% according to our best
top 10%, and 73% of adults in the top                                 estimate (see Figure 5).

Figure 5: Share of top 1% of wealth holders since 2007, selected countries, % of wealth

70

65

60

55

50

45

40

35

30

25

20

15

10
       Japan      France      Italy    United Canada          China    Germany United         Brazil      India   Russia      World
                                      Kingdom                                  States
     2007      2016     2018

Source: James Davies, Rodrigo Lluberas and Anthony Shorrocks, Credit Suisse Global Wealth Databook 2018

                                                                                                                           Global Wealth Report 2018   9
The trends are replicated in the individual                           Millionaire numbers fell in very few countries, and
     countries portrayed in Figure 5. The share of                         by relatively small amounts, the principal driver
     the top 1% rose in every country bar Canada                           being currency depreciation. Table 2 lists the eight
     between 2007 and 2016. But, in the past two                           countries with the largest losses, headed by Turkey
     years, there have been no further rises. The                          (down 16,000), Sweden (down 20,000), Australia
     level has flattened out in Japan, Italy, Canada,                      (down 32,000) and Brazil (down 36,000).
     China and the United States, and declined in
     France, the United Kingdom, Germany, Brazil,                          Monitoring world wealth
     India and Russia. The pattern is almost                               Wealth is a key component of the economic
     identical with respect to the share of the top                        system, valued as a source of finance for future
     decile (Figure 6), except for Italy, which                            consumption, particularly in retirement, and for
     shows a slight rise after 2016. While it is too                       reducing vulnerability to shocks such as unemploy-
     early to say that wealth inequality is now on a                       ment, ill health, or natural disasters. Wealth also
     downward trend, the prevailing evidence                               enhances opportunities for informal sector and
     suggests it may well have leveled out, albeit                         entrepreneurial activities, when used either directly
     at a very high level.                                                 or as collateral for loans. These functions are less
                                                                           important in countries that have generous state
     Millionaire trends                                                    pensions, adequate social safety nets, good public
     The number of millionaires in a country and its trend                 healthcare, high-quality public education, and
     over time is often seen as a sign of a country’s                      well-developed business finance. Conversely,
     economic health and its ability to generate opportu-                  the need to acquire personal assets is particularly
     nities for wealth creation. Our estimates for                         compelling and urgent in countries that have
     mid-2018 show 42.2 million millionaires worldwide,                    rudimentary social insurance schemes and reduced
     up 2.3 million over the previous 12 months. Table 2                   options for business finance, as is the case in much
     indicates that the United States added 878,000                        of the developing world.
     new millionaires – around 40% of the global
     increase – to its already sizable stock. This was                     The Credit Suisse Global Wealth Report offers
     considerably more than the number of newcom-                          a comprehensive portrait of world wealth,
     ers in France, Germany, the United Kingdom and                        covering all regions and countries, and all parts
     Italy (around 200,000 each), but a fraction below                     of the wealth spectrum from rich to poor.
     their combined total. Millionaire numbers rose by                     Valued at current exchange rates, total global
     a modest 186,000 in China and by 94,000 in                            wealth increased by USD 14.0 trillion, or
     Japan. Real wealth growth, rather than exchange                       4.6%, in the year to mid-2018. Using
     -rate movements, is the main explanation this                         smoothed exchange rates, the rise was a little
     year for these increases in millionaire numbers                       larger, at USD 16.6 trillion. The United States
     within countries.                                                     again led the way with a gain of USD 6.3

     Figure 6: Share of top 10% of wealth holders since 2007, selected countries, % of wealth
     90

     85

     80

     75

     70

     65

     60

     55

     50

     45

     40
            Japan      France      Italy    United Canada          China    Germany United         Brazil      India   Russia   World
                                           Kingdom                                  States
          2007    2016      2018

     Source: James Davies, Rodrigo Lluberas and Anthony Shorrocks, Credit Suisse Global Wealth Databook 2018

10
Table 2: Change in the number of millionaires by country, 2017–18
Adults (thousand) with wealth Adults (thousand) with wealth
Main gains Main losses
above USD 1 m above USD 1 m
Country 2017 2018 Change Country 2017 2018 Change
United States 16,472 17,350 878 Brazil 190 154 -36
France 1,888 2,147 259 Australia 1,320 1,288 -32
Germany 1,929 2,183 253 Sweden 368 348 -20
United Kingdom 2,189 2,433 244 Turkey 96 79 -16
Italy 1,161 1,362 200 Argentina 29 21 -9
China 3,294 3,480 186 New Zealand 162 155 -7
Japan 2,715 2,809 94 Israel 117 111 -6
Spain 792 852 60 Mexico 115 109 -6
Netherlands 438 477 40
Canada 1,257 1,289 32
World 39,845 42,155 2,310 World 39,845 42,155 2,310
Source: James Davies, Rodrigo Lluberas and Anthony Shorrocks, Credit Suisse Global Wealth Databook 2018
trillion, mostly due to financial assets. Else- year for China. We also strive continuously to improve
where, however, the gains derived primarily the methods used to estimate the level and distribu-
from non-financial assets. tion of wealth. The Credit Suisse Global Wealth
Databook 2018 provides details of the data sources
The top ten countries in the wealth-per-adult and outlines the research methodology underpinning
league include many smaller, dynamic economies our results. It also contains much additional data.
– Belgium, Denmark, New Zealand, Norway,
Singapore, and Switzerland – as well as Australia, Notes on concepts and methods
Canada, France, and the United States. Notable
cases of emerging wealth are found in Chile, the Net worth, or "wealth," is defined as the value of
Czech Republic, Estonia, Malaysia, Poland and the financial assets plus real assets (principally housing)
United Arab Emirates, while "frontier" wealth is owned by households, minus their debts. This
evident in Bolivia, Indonesia, Peru, Romania, Sri corresponds to the balance sheet that a household
Lanka and Thailand. might draw up, listing the items which are owned,
and their net value if sold. Private pension fund
Wealth varies greatly across individuals in every part assets are included, but not entitlements to state
of the world. Our estimates suggest that the lower pensions. Human capital is excluded altogether,
half of the global population collectively owns less along with assets and debts owned by the state
than 1% of global wealth, while the richest 10% of (which cannot easily be assigned to individuals).
adults own 85% of all wealth and the top 1%
account for almost half of all global assets. Since Valuations are usually expressed in terms of US
the global financial crisis, wealth inequality has dollars using end-period exchange rates, but
trended upward, propelled in part by the rising "smoothed exchange rates" (specifically 5-year
share of financial assets, and a strengthening US moving end-period averages) are used instead
dollar. These underlying factors appear to be where indicated.
waning, so that it seems more likely that wealth
inequality will fall in the future rather than rise. For convenience, we disregard the relatively small
amount of wealth owned by children on their own
The next two chapters consider longer-term trends in account, and frame our results in terms of the global
wealth holdings, and examine in detail the pattern of adult population, which totaled 5.0 billion in 2018.
holdings across individuals. A separate chapter is
devoted to the wealth of women, examining gender The "Asia-Pacific" region excludes China and
differences in the level and composition of wealth India, which are treated separately due to the size
holdings. Our estimates for the past are regularly of their populations. Data for 2017 and 2018 refer
updated when new data from reliable sources to mid-year (end-June) estimates; the figures for
becomes available, such as the revised figures this earlier years indicate year-end values.
Global Wealth Report 2018 1112
Global trends in
household wealth

Anthony Shorrocks, James Davies and Rodrigo Lluberas

This chapter reviews trends in global household wealth since 2000. The
early years of the century were characterized by robust and inclusive
wealth creation, but wealth growth fell considerably after the financial
crisis and inequality rose among the top wealth holders. This phase now
appears to have ended. In the past couple of years, wealth growth has
resumed at a modest pace, and median wealth has also grown in most
regions. The wealth share of the top 1% of adults has edged down from
its peak value in 2015, and is now back to the level recorded at the start
of the century.

The golden age of wealth creation                      spurred asset price inflation. Top wealth holders
The early years of this century saw the most           benefited most from the rise in financial wealth,
broad-based spell of wealth creation in recent         leading to rising wealth inequality in all parts of the
history. The period was remarkable for the             world. In every region bar China, median wealth
breadth of its geographic coverage, with emerg-        stopped rising, and in many places declined.
ing market economies – especially China and
India – not just sharing in the growth, but driving
much of the action. It was also broad in its

                                                       "The early years of this
coverage of assets, with both financial assets
and non-financial assets growing at a fast pace.
More importantly, it was socially inclusive: all
levels of society shared in the rewards. While
                                                       century saw the most
global mean wealth per adult grew at 8% per            broad-based spell of
year between 2000 and 2007, the bottom half
of wealth holders did even better, so that median      wealth creation in recent
wealth per adult grew almost twice as fast, at
14% per year.
                                                       history"
This golden age came to a halt with the global
financial crisis. Wealth growth resumed soon
afterward, but at a lower and more erratic pace.       The evidence reviewed in this chapter suggests
Widespread depreciation against the US dollar was      that the growth pattern has recently shifted back
partly responsible: measured in local currencies,      toward the pre-crisis pattern. The growth rate
wealth growth after 2008 has been closer to the        has risen a little and is more balanced between
earlier rate and relatively stable. The pattern of     real and financial wealth. Wealth inequality has
wealth creation also changed significantly. The        not yet fallen significantly, but has stabilized
source of wealth growth shifted strongly toward the    according to most indicators. Median wealth is
United States, opening a wide gap with Japan and       also stable or rising in all regions apart from
all of Africa, for example. Furthermore, financial     Africa. Thus the future prospects for inclusive
assets initially recovered faster than non-financial   wealth growth look more promising than they
assets, assisted by the low interest rates that have   have for the past couple of years.

                                                                                                     Global Wealth Report 2018   13
Figure 1: Annual percentage change in total global wealth, Trends in global wealth
2000–18 Measured in current US dollars, total global
19.5%
wealth rose from USD 117 trillion in 2000 to
20% 317 trillion in mid-2018, a rise of USD 200
15%
14.1% 13.8% trillion, equivalent to roughly 2.5 times global
9.9%
12.1% GDP. Most of this increase took place in the
10% 7.7% 6.0%
early years of the century: global wealth in-
6.5% 6.3%
4.0% 5.4% 5.4% creased by USD 111 trillion between 2000 and
5% 3.5%
2.3% 2007, only to fall by USD 21 trillion the following
year. Figure 1 shows the annual growth rate
0%
measured in current US dollars. Double-digit
-0.5% -0.9%
-5% -1.8% growth (exactly 10%) was achieved until 2007,
but the average rate over the next eight years
-10% was just 2.4%. Growth picked up after 2015,
-9.4%
and has since averaged 5.8% per year, an
-15%
improvement on the previous years, although
01 02 03 04 05 06 07 08 09 10 11 12 13 14 15 16 17 18
still well short of the rate in the pre-crisis era.
Source: James Davies, Rodrigo Lluberas and Anthony Shorrocks, Credit Suisse Global Wealth
Databook 2018
Figure 1 shows that global wealth fell signifi-
cantly in 2008 and that there were also setbacks
in 2001 and during 2014–15. With the excep-
Figure 2: Total global wealth 2000–18, smoothed exchange tion of 2008, these negative growth episodes
rates can be attributed to short-term exchange rate
USD trn
movements, which accounted for much of the
350
year-to-year variation in growth rates. When
current exchange rates are replaced by
300 smoothed exchange rates (thereby eliminating
short-run currency fluctuations), global wealth
250
has risen every year this century apart from
200 2008 (see Figure 2).
150
North America, Europe, and Asia-Pacific
100 (excluding China and India) accounted for the
bulk of global wealth in the year 2000, and
50 continue to do so today, although their share has
0 fallen from 92% to 78%. Figure 2 shows that
00 01 02 03 04 05 06 07 08 09 10 11 12 13 14 15 16 17 18 much of this fall is due to China, which has seen
its share of global wealth rise from 3.1% to
North America Europe Asia-Pacific China Latin America India Africa
16.4%. This major rebalancing toward China and
Source: James Davies, Rodrigo Lluberas and Anthony Shorrocks, Credit Suisse Global Wealth other emerging economies becomes more
Databook 2018 evident when attention shifts to the change in
wealth this century. Figure 3 reveals that
lower-income countries accounted for 10% of
global wealth in 2000, but have contributed 33%
Figure 3: Share of wealth in 2000 and share of wealth growth of wealth growth in the intervening period, raising
2000–18, selected regional groupings their aggregate share to 25%. This compares to
the 24% share of wealth growth from Europe
Lower- 10.00%
income 25.0%
and the 31% share of global wealth growth from
countries 33.0% North America, despite a much higher level of
initial wealth and very large year-on-year gains.
Asia-Pacific 23.00%
(high 16.0%
The contrast with high-income Asia-Pacific
income) 12.0% nations is even more pronounced: their share of
global wealth growth (12%) is barely one third of
Europe 29.00%
(high 26.0%
that achieved by lower income countries, and
income) 24.0% less than half their starting share of aggregate
wealth in 2000 (23%).
North 38.00%
34.0%
America
31.0%
0% 10% 20% 30% 40%
Share of wealth 2000 Share of wealth 2018 Share of wealth growth 2000-18
Source: James Davies, Rodrigo Lluberas and Anthony Shorrocks, Credit Suisse Global Wealth
Databook 2018
14Trends in wealth components Figure 4: Global trends in assets and debts per adult,
The three components of wealth – financial 2000–18 (USD)
assets, non-financial assets and debts – have
70,000
moved in tandem for much of this century.
Figure 4 displays each of these components,
60,000
expressed in terms of average values per adult.
Net worth per adult in US dollars doubled over
50,000
the 2000–18 period, but most of this increase
(71%) occurred before the global financial crisis.
40,000
It took until 2011 to restore the crisis losses, and
gains in USD terms have been modest since that
30,000
time, not helped by the reversals during 2014
and 2015. A somewhat different picture emerg-
20,000
es when smoothed exchange rates are applied.
The graph is smoother and shows continuous
10,000
growth since 2009, with new peak levels
recorded every year from 2010 onward. This
0
reinforces the view that short-term currency 00 01 02 03 04 05 06 07 08 09 10 11 12 13 14 15 16 17 18
movements with respect to the US dollar
obscure the true trend in wealth over time, which Net worth Net worth at fixed exchange rate
shows a pattern of stable growth, with just a Financial wealth Non-financial wealth
single setback in 2007–08. Debt
Source: James Davies, Rodrigo Lluberas and Anthony Shorrocks, Credit Suisse Global Wealth
Databook 2018
"Financial assets, non- Figure 5: Annual contribution (%) to growth of wealth per
financial assets and debts adult by component, 2000–18
have moved in tandem for 20
much of this century" 15
10
5
Regarding the individual components of wealth,
the most noticeable feature is the rise in financial
assets since 2007, fueled largely by the strong 0
performance of equity markets in recent years.
Financial wealth per adult is now 20% above the -5
level in 2007 and 36% above the low in 2008.
In contrast, non-financial wealth declined -10
between 2007 and 2015, but growth resumed
in 2015 at a robust pace, so that non-financial -15
wealth per adult is now 11% higher than 2007 01 02 03 04 05 06 07 08 09 10 11 12 13 14 15 16 17 18
and 14% above the level in 2015.
Financial wealth Non-financial wealth Debt Net worth
Taking a longer perspective, financial assets Source: James Davies, Rodrigo Lluberas and Anthony Shorrocks, Credit Suisse Global Wealth
accounted for 56% of gross wealth when the Databook 2018
century began. Non-financial assets grew at a
faster pace during the early years, and matched
the level of financial assets in 2008. But the gap
opened up again after the financial crisis, with
financial assets rising to 54% of gross wealth in
2015 before falling back slightly to 53% in
mid-2018. In terms of absolute gains, gross
wealth per adult has increased by USD 36,230
since 2000, of which half (USD 17,970) is due to
gains in financial wealth. Figure 5 provides more
details, by plotting the year-on-year change in
wealth per adult, and identifying the contributions
Global Wealth Report 2018 15of each component of wealth. The graph captures Trends in wealth inequality
the slowdown in growth after the financial crisis, Figure 6 displays global wealth inequality trends
and the dominant contribution of financial assets this century, as captured by the shares of the top
to the modest growth achieved between 2008 1%, 5% and 10% of adults. The three series
and 2015. show the same broad pattern until the financial
crisis: a modest fall during 2000–06 followed by
The time series for debt has moved broadly in a sharper drop over the next two years. But the
line with non-financial assets, as might be trends diverge after 2008.
expected given the correlation between mort-
gage debt and house prices. This century, debt The top 1% of global wealth holders started the
per adult grew at a fast rate (9%) until the millennium with 47.1% of all household wealth.
financial crisis, but has been flat since then, and This share changed little between 2000 and
only recently overtook the previous peak value 2005, but then fell to 42.6% by 2008. Our latest
achieved in 2007. Nowadays global household estimates suggest that the share of the top
debt equates to 15.0% of net wealth, compared percentile continued downward until 2011, but
to 17.5% in 2009. then rose sharply from 42.1% in 2011 to a peak
of 47.5% in 2016, before edging back to 47.2%
The contribution of debt to net wealth is some- in mid-2018. Thus, despite the intervening
what ambiguous. On the one hand, it leads gyrations, the current share of the top 1% is the
directly to lower levels of measured wealth. But same as that at the start of the century.
rising debt fuels demand for assets and supports
asset price inflation, both of which tend to raise The shares of the top 5% and top 10% wealth
the level of wealth. In that respect, the rapid holders also fell until 2008, and by a similar amount
growth prior to 2007 and its subsequent decline to that of the top 1%, indicating that the share of
may help explain the time path of changes in percentiles 90–99 remained fairly constant. In the
other components of wealth – especially non- subsequent period, the share of the top 10% has
financial wealth – although cause and effect are been almost flat. So the changes that have
difficult to untangle. occurred since 2008 have been within the top
decile – a redistribution in favor of the top percentile
and away from the remaining members of this top
group. Taking the period as a whole, the share of
the top 10% has fallen from 88.5% in 2000 to
84.8% in mid-2018, a drop of 3.7 percentage
points. The trend in the share of the top 5% is
Figure 6: Share of top wealth holders in global wealth and – unsurprisingly – intermediate between that of the
share of financial assets, 2000–18 top percentile and top decile. It declined by 4.5
percentage points during 2000–08 and has since
90
moved up by 2.2 percentage points. Thus the
top10% current share of the top 5% of wealth holders
85
(73.4%) is higher than in 2008 (71.2%), but lower
80
than the share at the turn of the century (75.7%).
75 top 5%
Wealth inequality tends to change at a slow
70 pace, so it is difficult to identify the drivers of
65 the trend. However, wealthier individuals hold
a disproportionate share of their assets in
60 financial form, especially company securities,
55
financial assets so that the share of the top 1%, in particular,
is expected to be sensitive to equity prices
50
top 1% and, more generally, to the relative importance
of financial assets. Figure 6 confirms this
45
suggested link. The graph shows that the
40 share of the top 1% has similarities with that
00 01 02 03 04 05 06 07 08 09 10 11 12 13 14 15 16 17 18 for the share of financial assets, declining prior
Source: James Davies, Rodrigo Lluberas and Anthony Shorrocks, Credit Suisse Global Wealth
to the financial crisis and then reversing after
Databook 2018 2008. The share of financial assets peaked in
2015 and then trended downward over the
past three years.
The share of the top 1% peaked a year later,
suggesting that it takes a year or so for move-
ments in financial assets to be reflected in our
estimates of the top wealth shares. Overall, the
16share of financial assets dropped by three that North America and Europe are now back
percentage points over the entire period, while to their previous peak and India is 20% ahead.
the share of the top 1% is fractionally above the Latin America and Asia-Pacific (excluding China
starting value. This may reflect the other factors and India), however, remain 10% below the
likely to be at play, such as cross-country 2007 level. For Africa, we estimate that median
differences in the growth rate of population or wealth is now just USD 332, less than half the
wealth. The relationship with financial assets value in 2007 (USD 856) and – alone among
may also be more nuanced, depending more on regions – below the level in 2000. China is –
equities, for example, which have shown strong again – the exception. Median wealth has
growth recently relative to broader categories of increased every year, rising by a factor of over
financial assets. Either way, the trend in equity seven from USD 2,170 in 2000 to USD 16,330
prices and financial assets is likely to remain an currently. Remarkably, median wealth in China
important indicator of the direction in which exceeded the median value in Europe briefly in
wealth inequality is heading. 2016 and remains close to the European level
(USD 18,150) today. This is partly a reminder
that Europe is quite heterogeneous and includes
a number of countries with relatively low wealth.
"The millionaire and Trends in the number of millionaires
The millionaire and ultra-high net worth (UHNW)
UHNW portions of the portions of the wealth pyramid have changed
more than any other segment this century. The
wealth pyramid have number of millionaires has trebled, while the
changed more than any number of UHNW individuals (with net worth
exceeding USD 50 million) has risen fourfold,
other segment this making them the fastest-growing group of wealth
holders. This is due in part to the fact that the
century" millionaire and UHNW boundaries are static and
absolute, while the whole distribution of wealth is
shifting as the world becomes a wealthier place,
progressively lowering the bar for membership
over time. Rising inequality can also boost the
speed at which new millionaires are created.
Trends in median wealth
Median wealth values reflect the circumstances
of the average adult, so trends in median wealth
within countries or regions are a good indication
of how the average person has fared over time.
Although the countries with the highest median
wealth are located in Europe and the Asia-Pacific
region, North America leads the regional ranking
by a huge margin. Median wealth in North
America is currently more than three times the Figure 7: Median wealth per adult 2000–18, selected regions
level in Europe and China, 50 times the level in
India, and almost 200 times the level in Africa. USD, log scale
100,000
Global median wealth per adult (in current US
dollars) rose continuously during the early years
of the century, more than doubling in value from
USD 1,490 in 2000 to USD 3,940 in 2008 10,000
(Figure 7). It then remained around that level until
the present day. The current value of USD 4,210
is a little above the 2008 level and nearly three
1,000
times the value at the start of the century.
Prior to the financial crisis, the regional trends
were similar and all moving strongly upward, 100
with median wealth rising by at least 80% in 00 01 02 03 04 05 06 07 08 09 10 11 12 13 14 15 16 17 18
every region apart from North America. The
North America Europe China
upward trend then halted or reversed in all India Africa World
regions except China. The decline in median
wealth was less pronounced than the upswing, Source: James Davies, Rodrigo Lluberas and Anthony Shorrocks, Credit Suisse Global Wealth
and the median recovered in some regions, so Databook 2018
Global Wealth Report 2018 17The regional origins of new millionaires and Summary
UHNW individuals Global wealth rose rapidly during the early part
One of the most interesting aspects of the of the century, led by China, India, and other
growth in millionaire numbers is the country emerging economies. It fell at the time of the
of origin of the "new millionaires"– i.e. those financial crisis, and while growth resumed after
added to the worldwide stock. Our database 2008, it did so at a significantly lower rate than
confirms that the composition of the millionaire before. The structure of wealth growth also
segment is changing fast. At the beginning of changed, shifting from real assets to financial
the century, the 13.8 million millionaires in the assets. As a consequence, the fraction of
world were heavily concentrated (97%) in household wealth held in financial form – which
high-income countries. Since then, 28.3 million had trended downward earlier – rose after 2008.
"new millionaires" have appeared, of whom 4.3 The share of the top 1% of wealth holders
million – 15% of the total additions – originated followed a similar trajectory, and the patterns are
from emerging economies (identified by the likely related given the importance of financial
lower income group in Figure 8). This is more assets in the portfolios of the wealthy.
than the new entrants to the millionaire class in
high-income countries outside North America According to our estimates, wealth growth has
and Europe. picked up again since 2015, with non-financial
assets accounting for much of the recent growth.
This transformation is even more pronounced in The trend toward greater wealth inequality has also
the UHNW segment. Emerging economies stabilized, enabling median wealth to rise again.
accounted for 6% of the segment in 2000, but However, the level of median wealth remains at or
since that time have seen 22% of the growth in below that of a decade ago in all regions except
UHNW individuals (24,830 adults), more than China and India.
Europe. China alone added an estimated 16,430
adults – 15% of the new UHNW individuals in
the world, and more than all other Asia-Pacific
countries combined. As a result, emerging
nations are now home to 18% of the world's
UHNW population. Among richer economies,
North America has added more than twice as
many UHNW individuals as Europe, which is not
surprising given that, in 2000, North America
was home to 55% of all UHNW individuals,
versus 24% for Europe.
Figure 8: Cumulative change in the number of millionaires since 2000,
by region/income groups
millions
11
10
9
8
7
6
5
4
3
2
1
0
-1
00 01 02 03 04 05 06 07 08 09 10 11 12 13 14 15 16 17 18
North America Europe Other high-income countries Lower-income countries
Source: James Davies, Rodrigo Lluberas and Anthony Shorrocks, Credit Suisse Global Wealth Databook 2018
18Global Wealth Report 2018 19
The global wealth
pyramid

Anthony Shorrocks and James Davies

This chapter examines the entire wealth pyramid, from the less affluent
groups at the bottom up to the wealthiest individuals at the top. The
3.2 billion adults with wealth below USD 10,000 account for 64% of all
adults, but just 1.9% of global wealth. In contrast, 42 million millionaires
comprise less than 1% of the adult population, but own 45% of house-
hold wealth. China is now firmly established in second place with
respect to the number of dollar millionaires (behind the United States
and above Japan) and in second place also (above Germany) with
respect to the number of ultra-high net worth individuals.

Figure 1: The global wealth pyramid 2018                                                         Wealth differences within and between
                                                                                                 countries
                                                                                                 Wealth differences between individuals occur for
                                         42 m (0.8%)
                                                                                                 many reasons. Variation in average wealth across
                         > USD 1 million             USD 142.0 trn (44.8%)                       countries accounts for much of the observed
                                                                                                 inequality in global wealth, but there is also
                      USD 100,000           436 m        USD 124.7 trn (39.3%)
                      to 1 million          (8.7%)                                               considerable disparity within countries. Those with
                                                                                                 low wealth are disproportionately found among the
               USD 10,000
                                                                                                 younger age groups who have had little chance to
                                           1,335 m                USD 44.2 trn (13.9%)
               to 100,000                  (26.6%)                                               accumulate assets. Others may have suffered
                                                                                                 business losses or personal misfortune, or live in
                                                                                                 regions, most notably Africa, where prospects for
     < USD 10,000                                                        USD 6.2 trn (1.9%)      wealth creation are very limited. Opportunities are
                                           3,211 m                                               also sometimes constrained for women or
                                           (63.9%)
Wealth range                                                                      Total wealth   minorities. At the other end of the spectrum, there
                                                                                  (%of world)
                                                                                                 are many individuals with large fortunes, acquired
                                                                                                 through a combination of talent, hard work and
                            Number of adults (percent of world adults)                           good luck.
Source: James Davies, Rodrigo Lluberas and Anthony Shorrocks, Credit Suisse Global Wealth
Databook 2018                                                                                    The wealth pyramid in Figure 1 captures these
                                                                                                 differences. The large base of low wealth holders
                                                                                                 supports higher tiers occupied by progressively
                                                                                                 fewer adults. We estimate that 3.2 billion individuals
                                                                                                 – 64% of all adults in the world – have wealth
                                                                                                 below USD 10,000 in 2018. A further 1.3 billion
                                                                                                 adults (27% of the global total) fall in the USD
                                                                                                 10,000–100,000 range. While average wealth is
                                                                                                 modest in the base and middle tiers of the pyramid,
                                                                                                 their combined wealth exceeds USD 50 trillion,
                                                                                                 underlining the economic importance of this often
                                                                                                 overlooked segment.

20
Figure 2: Regional membership of global wealth strata
> USD 1 million Africa
India
USD 100,000 - USD 1 million
Asia-Pacific
USD 10,000 - USD 100,000 Latin America
China
< USD 10,000
Europe
all levels North America
0 10 20 30 40 50 60 70 80 90 100
Percentage of wealth group in region
Source: James Davies, Rodrigo Lluberas and Anthony Shorrocks, Credit Suisse Global Wealth Databook 2018
The base of the pyramid accounting for 48% of members, while
The layers of the wealth pyramid are quite Asia-Pacific and – to a greater extent – India
distinctive. The base tier has the most even and Africa are under-represented. The contrast
distribution across regions and countries between the number residing in China (641
(Figure 2), but also the widest spread of million, 59% of Chinese adults) and India
personal circumstances. In developed coun- (73 million, 8.6% of Indian adults) is particu-
tries, about 30% of adults fall within this larly striking.
category, and for the majority of these
individuals, membership is either transient The high wealth bands
– due to business losses or unemployment, The top tiers of the wealth pyramid – covering
for example – or a life-cycle phase associated individuals with net worth above USD 100,000
with youth or old age. In contrast, more than – comprised 6.1% of all adults in the year
90% of the adult population in India and 2000. The proportion rose to 9.3% by the time
Africa falls within this range. In some low- of the financial crisis, and then fluctuated in a
income countries in Africa, the percentage of fairly narrow band. The current level is 9.5%.
the population in this wealth group is close to Regional composition differs markedly from the
100%. For many residents of low-income strata below. Europe, North America and the
countries, life membership of the base tier is Asia-Pacific region (omitting China and India)
the norm rather than the exception. contribute the largest number of members and
together account for 79% of the group. Europe
Mid-range wealth alone hosts 156 million members (33% of the
USD 10,000–100,000 is the mid-range band total), roughly double the number in China (81
from a global wealth perspective, covering 1.3 million). However only five million members
billion adults and encompassing a high propor- (1.1% of the global total) reside in India, and
tion of the middle class in many countries. The only three million (0.6%) in Africa.
average wealth of this group is sizable at USD
33,100, around half the overall global mean. The pattern of membership changes once again for
In combination with its size, this provides the the US-dollar millionaires at the top of the pyramid.
group with considerable economic clout The number of millionaires in any given country is
equating to USD 44 trillion in net assets. determined by three factors: the size of the adult
China completely dominates this segment, population, average wealth, and wealth inequality.
Global Wealth Report 2018 21Figure 3: Number of dollar millionaires (% of world total) The United States scores highly on all three criteria,
Taiwan, 1 and has by far the greatest number of millionaires:
Switzerland, 2 Netherlands, 1 17.3 million or 41% of the world total (Figure 3).
Korea, 2 Belgium, 1 For many years, Japan held second place in the
Spain, 2 millionaire rankings by a comfortable margin – with
Australia, 3
12.5% of the global total in 2011, for example,
Canada, 3
twice as many as the third placed country. Howev-
Italy, 3
er, the number of Japanese millionaires fell after
France, 5
United States, 41
2011 alongside a rise in other countries, most
notably China. Our revised estimates for China now
Germany, 5 indicate that the number of millionaires overtook the
number in Japan in 2014 and now stands at 3.4
United Kingdom, 6 million (8.2% of the world total) compared to 2.8
million (6.6%) for Japan.
Japan, 7
China, 8 Rest of World, 10 The United Kingdom is in fourth place with 6% of
millionaires worldwide, with Germany and France
close behind (5% each). Italy, Canada and Australia
Source: James Davies, Rodrigo Lluberas and Anthony Shorrocks, Credit Suisse Global Wealth
Databook 2018 each account for 3% of the global total, followed
by Spain, Korea, and Switzerland (2%). Taiwan, the
Netherlands and Belgium are the remaining
Figure 4: Number of dollar millionaires (thousand) 2000–18, countries hosting more than 422,000 millionaires,
selected countries the minimum requirement for a one percent share
of the global total.
4,500
4,000 The longer perspective portrayed in Figure 4
3,500 illustrates the remarkable growth in the number of
3,000
millionaires in China since the turn of the century.
Millionaire numbers in the United Kingdom,
2,500 Germany and France have risen four-fold and
2,000 almost in tandem. The number in Japan has
1,500
hardly risen at all. But from a humble 41,000 in
2000, Chinese millionaires have grown by a factor
1,000 of more than 80 to reach the current level of 3.5
500 million. By 2014, China had overtaken all other
0
countries bar the United States, and the million-
00 02 04 06 08 10 12 14 16 18 aire growth rate continues to outpace its competi-
tors. In the year 2000, India had a similar number
China Japan United Kingdom of millionaires (39,000) to China, but it now hosts
Germany France India
just 343,000, one tenth of the Chinese total
Source: James Davies, Rodrigo Lluberas and Anthony Shorrocks, Credit Suisse Global Wealth according to our estimates.
Databook 2018
High net worth individuals
The most common sources of information on
Figure 5: The top of the pyramid wealth distribution – official household surveys –
tend to become less reliable at higher wealth
levels. To estimate the pattern of wealth holdings
> USD 50 million 149.890 above USD 1 million, we therefore supplement
USD 10 to 50 million 1,631,460
the survey data with information gleaned from the
Forbes annual tally of global billionaires. We make
USD 5 to 10 million 3,285,950 use of the Forbes data for each year since 2000,
applying well-established statistical techniques to
estimate the intermediate numbers in the top tail.
This produces plausible values for the global
USD 1 to 5 million 37,087,950 pattern of asset holdings in the high net worth
(HNW) category from USD 1 million to USD 50
million, and in the ultra-high net worth (UHNW)
Number
Wealth range
of adults
range from USD 50 million upward.
While the base of the wealth pyramid is
characterized by a wide variety of people from
Source: James Davies, Rodrigo Lluberas and Anthony Shorrocks, Credit Suisse Global Wealth all countries and all stages of the life-cycle,
Databook 2018 HNW and UHNW individuals are heavily
22You can also read