THE BANK CRISIS FINANCIAL RATIOS - DIVA
←
→
Page content transcription
If your browser does not render page correctly, please read the page content below
Högskolan i Halmstad
Sektionen för Ekonomi och Teknik
Europaekonomprogrammet

 THE BANK CRISIS‟ FINANCIAL RATIOS
         -A comparative research of the UK and Sweden during 2006-2010

Bachelor thesis in consolidated accounting, 15 hp
2011-05-24

Autor:
Stephanie Göransson         1987-11-18
Cristoffer Winter Söderberg 1986-05-01

Tutor:
Hans Mörner
Acknowledgments

We would like to acknowledge and extend our gratitude to the persons who have made this
Bachelor thesis possible.

We would also like to thank our tutor, Hans Mörner, for guidance and feedback during this
study together with Abertay University Dundee for guidance and late opening hours at the
library during this period.

Dundee 17th of May 2011

Cristoffer Winter Söderberg                          Stephanie Göransson
Abstract
The credit crunch that started the 9th of August 2007 is generally viewed as the most
significant crisis to affect the financial markets and the global economy since the 1930s.
The UK financial sector was heavily hit by the crisis which resulted in a dry up in lending and
left a black hole in the British banks‟ finances. During the last quarter of 2010 the GDP shank
unexpectedly with 0.5 percent from the third quarter which created concerns about going back
into the recession. Contrarily, for Swedish economy 2010 was an impressing year with an
unexpected GDP growth of 7, 3 percent in the last quarter.

The purpose of this study is to analyse how the finance crisis has affected the leading banks‟
performance within the two countries and see whether the differences in values can explain
the difference in GDP growth during the last quarter of 2010. The analyse is performed
through a financial ratio analysis of the different banks.

The final results of the research indicates to that the Swedish banks have been more
profitable, have had a more secure and higher quality of lending and more capacity to lower
cost related to income than the British banks. The more distinctive negative influence is
mostly based on the larger amount of credit losses the British banks had to experience which
contributed to their significant decrease in earnings per share which created scepticism on the
credit market followed by a severe slowdown in consumption and in GDP growth. Since the
credit losses never got to same levels in Sweden as in the UK the scepticism of the Swedish
banking system did not affect the reduction in credit use and house prises to the same extent
and GDP growth could recover back to normal levels sooner than in the UK.
Index
1. Introduction .......................................................................................................................... 1
1.1 Background ......................................................................................................................... 1
   1.1.1. Reason for the finance crisis worldwide 2007-2010 .................................................... 1
   1.1.2. The effects of the Finance crisis in UK ........................................................................ 3
   1.1.3. The effects of the Finance crisis in Sweden.................................................................. 5
1.2. Research problem ............................................................................................................... 6
1.3. Research question............................................................................................................... 7
1.4. Purpose ............................................................................................................................... 7
1.5. Delimitations ....................................................................................................................... 7
1.6. Outline ................................................................................................................................ 8
1.7 Previous Research ............................................................................................................... 8

2. Methodology ....................................................................................................................... 10
2.1. Description of choosing a method ................................................................................... 10
2.2. Overall methodological choices ....................................................................................... 10
2.3. Data collection .................................................................................................................. 11
2.4. Methodological criticism .................................................................................................. 12
   2.4.1. Difficulties with ratios ................................................................................................ 12
   2.4.2. Reliability ................................................................................................................... 12
   2.4.3. Validity ....................................................................................................................... 12
2.5. Sample of banks................................................................................................................ 13
2.6. Sample of financial ratios ................................................................................................ 15

3. Theoretical framework ...................................................................................................... 17
3.1. The banking sector ........................................................................................................... 17
3.2. Credit risk analysis ........................................................................................................... 17
3.3. Financial ratios ................................................................................................................ 18
3.4. Prediction of bank failure ................................................................................................ 19
3.5. Financial ratios used within banks.................................................................................. 19
3.6. Regulation of financial institutions ................................................................................. 23
   3.6.1. Credit rating agencies ................................................................................................ 23
   3.6.2. International regulation: The Basel I Accord 1988 ................................................... 23
   3.6.3. International regulation: The Basel II Accord 2004 .................................................. 24
   3.6.4. Issues for regulatory reform raised by the credit crunch........................................... 25
   3.6.5. International regulation: The Basel III Accord ......................................................... 26

4. Empirical data and Analysis ................................................................................................ 28
4.1. Presentation of the banks ................................................................................................. 28
4.2. Financial ratios ................................................................................................................ 32
   4.2.1. Credit loss ratio .......................................................................................................... 32
   4.2.2. Cost/Income ratio ....................................................................................................... 35
   4.2.3. Net interest margin ..................................................................................................... 39
   4.2.4. Earnings per share ..................................................................................................... 42
   4.2.5. Return on equity ......................................................................................................... 45
   4.2.6. Capital Adequacy ....................................................................................................... 47
5. Final discussion ................................................................................................................... 51
   5.1. Variance in financial ratios between the banks in the UK and Sweden. ................. 51
   5.2. Further reflections ....................................................................................................... 54

6. Conclusion ........................................................................................................................... 56
   6.1. Suggestions for future research ................................................................................... 57

References ............................................................................................................................... 58

Supplements ............................................................................................................................ 64

GRAPH LIST

Graph 1: Swedish banks credit loss ratio……………………………………………………………………………..33
Graph 2: English banks credit loss ratio…………………………………………………………………………......33
Graph 3: Swedish banks C/I ratio before credit losses………………………………………………………..36
Graph 4: British banks C/I ratio before credit losses……………………………………………………………36
Graph 5: Swedish banks C/I ratio after credit losses……………………………………………………………37
Graph 6: British banks C/I ratio after credit losses………………………………………………………………37
Graph 7: Swedish banks net interest margin………………………………………………………………………39
Graph 8: British banks net interest margin…………………………………………………………………………40
Graph 9: Swedish banks earnings per share……………………………………………………………………….42
Graph 10: British banks earnings per share………………………………………………………………………..43
Graph 11: Swedish banks return on equity…………………………………………………………………………45
Graph 12: British banks return on equity……………………………………………………………………………46
Graph 13: Swedish banks capital adequacy………………………………………………………………………..48
Graph 14: British banks capital adequacy………………………………………………………………………….49

FIGURE LIST

Figure 1: GDP Growth UK…………………………………………………………………………………………………….4
Figure 2: Deposits from Swedish public to banks, dec-09…………………………………………………..14
Figure 3: Credit rating agencies………………………………………………………………………………………….23

TABLE LIST

Table 1: The four biggest British Banking Groups………………………………………………………………..13
Table 2: The four biggest Swedish Banking Groups…………………………………………………………….14
Table 3: Credit loss ratio……………………………………………………………………………………………………..32
Table 4: C/1 before credit losses………………………………………………………………………………………...35
Table 5: C/I after credit losses…………………………………………………………………………………………….35
Table 6: Net interest margin………………………………………………………………………………………………39
Table 7: Earnings per share………………………………………………………………………………………………..42
Table 8: Return on equity…………………………………………………………………………………………………..45
Table 9: Capital adequacy………………………………………………………………………………………………….47
1. Introduction

This chapter provides a background description of the research to introduce the reader to the
topic. Additionally, the chapter incorporates a problem discussion which acts as a foundation
for the problem question together with a purpose. The chapter ends with a description of the
delimitations of the research.

1.1 Background
1.1.1. Reason for the finance crisis worldwide 2007-2010
The credit crunch that started the 9th of August 2007 is generally viewed as the most
significant crisis to affect the financial markets and the global economy since the 1930s. The
name „Credit Crunch‟ refers to the sudden and very significant tightening of lending
conditions in the financial system which happened independently of official interest rates. It
was a pronounced fall in lending both between banks on the interbank market and between
banks and their clients. An increased risk aversion combined with declines in the price of
risky assets (equities and treasury bonds) appeared.

The Credit Crunch is generally considered to have been trigged by losses on subprime
mortgages in the USA but due to the crisis width and depth it cannot be explained by that
sector alone. The crisis led to mortgage financing giants Fannie Mae and Freddie Mac,
combined loans of total $5.5 trillion, being place under the control of the US government and
in 2008 Bear Stearns had to be rescued through a merger with Bank of America. Shares in
most of the top banks around the world plunged dramatically in value. The 29th of September
2008 the investment bank Lehman Brothers was placed into bankruptcy and the crisis took a
particularly nasty turn and it set off a significant fall in global stock markets around the
world1.

The Federal Reserve was one of the big players of the creation of the credit bubble. By
reacting after the fall in stock market, following the dot com bust in 2000 and the 9/11
terrorist attack, with a loosening of American monetary policy the Federal Reserve lowered
the federal funds rate from 6.5 percent in May 2000 to 1 percent in June 2003, the lowest rate
in 45 years. This resulted in a rapid expansion of lending, mortgage lending and rapid rise in
house prices. Trouble started when the interest started to rise when the home ownership
reached a saturation point. In year 2005 home prices started to fall (40 percent in US) and
Subprime borrowers couldn‟t withstand the higher rates and started default on their loans.
2004 the interest rate was 5.75 percent and remained so until august 2007. In August 2007 the
repayment problems of the subprime mortgages in the US triggered a tidal wave of concern
about lending around the world2.

Legislative changes and deregulation
The banks‟ increase in mortgage exposure is one important factor to the finance crisis. Basel I
Accord of 1988 required banks to hold less capital for loans made for mortgages, which were
regarded as relatively safe, than for consumer loans that was regarded as relatively risky.

1
 Keith Pilbeam. Finance & financial markets. London, 2010, pg. 413-480.
2
 Andrew Oxlade, “What‟s next for Britain?”,This is money, 27 April 2011, retrieved 2011-02-02 from
http://www.thisismoney.co.uk/credit-crisis.

                                                  ~1~
This increased the banks incentives to increase their mortgage lending. The repeal of the
Glass Steagall Act (prohibiting commercial banks from engaging in investment banking
activities) got commercial banks like Citigroup involved in the issuance of CDOs and
mortgage backed securities and other conduits3 which will be explained later in this chapter.
Financial innovation and the credit rating agencies
The deterioration in the quality of bank lending was one important factor for the credit crisis
to arise, especially the rapid lending to the subprime sector i.e. mortgages made to people
with a poor credit rating and high risk of default. Between year 1999 and 2006 the subprime
loans raised from 13 percent ($160 billion) to 20 percent ($600 billion) of total mortgage
originations. By March 2007 the total exposure amounted to $1.3 trillion. Since the subprime
mortgages were viewed as very risky the interest charges were significantly higher than the
charges for prime mortgages and alt-A mortgages (loans with a risk profile between subprime
and prime loans)4. The barmy notion was that if the borrowers ran into trouble with their
repayments, rising house prices would allow them to remortgage their property5. It resulted in
attracting a larger proportion of borrowers who would default on payments since the mortgage
brokers encouraged people to take on bigger loans at higher risk than they could afford6.
Obviously, the relationship between compensation for lending out large amounts of capital in
the financial sector and profitability was a significant triggering factor to the credit crunch.
Since the system of annual bonuses was primary linked to revenues and short-term
performance it created incentives for traders and financial institutions to take on too much risk
to maximize short-term performance at the expense of longer term viability and returns7.
After increasing their risk issued by subprime mortgages, the banks believed that they could
reduce a large part of their risk exposure and save on regulatory capital through securitizing
the mortgage loans by issuing mortgage – backed securities or by bundling the various loans
(high, medium and low risk loans) and pack them into a „Collateralized debt obligation‟
(CDO), consisting of different tranches with different risk. To be able to sell on the securities
the rating had to be issued by credit rating agencies. The investor was promised to receive a
cash flow in a prescribed sequence based on how much cash flow the CDO collected from the
pool of bonds or other asset it owned8. Crucially, the credit rating agencies under-rated the
risk involved of the securities and securities that should have merited BBB and lower ratings
was issued with AAA and AA ratings. The reason was that the credit rating agencies assumed
continued house prices rises and unrealistically low default rates when making the ratings9.
When the borrowers couldn‟t pay back their mortgages the CDOs became worthless and
during February and March 2007, more than 25 subprime lenders filed for bankruptcy. It was
obvious that the finance crisis in the US couldn‟t solve the subprime crisis on its own and the
problem continued outside the US10.
3
Pilbeam, 2010, pg. 429-432.
4
Pilbeam, 2010, pg. 432.
5
David Budworth, “The credit crunch explained”, The Sunday Times, 4 January 2010, retrieved 2011-02-06
from http://www.timesonline.co.uk/tol/money/reader_guides/article4530072.ece.
6
Pilbeam, 2010, pg. 432-433.
7
Pilbeam, 2010, pg. 453.
8
Pilbeam, 2010, pg. 413.
9
Pilbeam, 2010, pg. 434.
10
Larry Peterson, “The Subprime/Securitization Market Panic -A Guide for the Perplexed”, Dollars & Sense,
2011, retrieved 2011-02-06 from http://www.dollarsandsense.org/archives/2007/1207peterson.html.
~2~1.1.2. The effects of the Finance crisis in UK
While the crisis started in the US, it quickly spread throughout the world. Many UK banks
had invested large sums in subprime backed investments and had write off billions of pounds
in losses. The problem was that many of the UK‟s banks had been using the investment
markets to fund their mortgage business as a securitization, so when the investors became
nervous about buying any investment linked to mortgages, no matter how high their quality, it
got impossible to sell these investments. This resulted in a dry up in lending and ended up
leaving a black hole in the British banks‟ finances11.
During September 2007, the British bank, Northern Rock, found itself unable to fund its
mortgage book and was facing a „bank run‟ i.e. which is when the bank‟s customers were
queuing to withdraw their deposits since its reserves might not have been sufficient to meet
the withdrawals. The UK government failed to make any guarantee to protect debtors beyond
the statutory commitment to protect the first £20,000. The bank of England was forced to step
in as a lender and guarantee all Northern Rock deposits. In 2008 the Northern Rock was
unable to finance itself and the bank was nationalized which contributed to that its shares
became worthless. The same year the government took over Brad Ford & Bingley‟s £50
billion mortgage and loan book and sold it off to Santander, but the full extent in British
banking happened when the government was force to bail out the largest banks in the UK12.
The demise of Northern rock was later eclipsed by the problems at the Halifax of Scotland
(HBOS) which was rescued through a merger with Lloyds TSB bank. The losses in HBOS led
Lloyds into the crisis and had to be rescued by the UK taxpayer who now had a 45 percent
stake in the bank. The Royal bank of Scotland which during several years has become the
largest bank in the UK made in December 2007 the decision to take over Dutch Bank ABN
Amro. Due to less scrutiny than needed during the takeover, losses of approximately € 22
billion coupled with the problems on its own loan book, RBS had to be rescued by the UK
government holding a majority stake of 70 percent in the bank. The UK financial sector was
heavily hit by the crisis in general with a fall off in mergers and acquisitions, underwriting
activity, IPOs, commercial paper and corporate bond issue lending to tens of thousands of job
losses13.
The UK‟s response to the financial crisis was initially much tougher than that of the US. The
US was only in recession for four consecutive quarters (12 months) which is less than Britain,
which remained in recession for a further two consecutive quarters (18 months in total),
making the UK economy was the last major economy to come out of recession
(behind Japan, China, France and Germany)14. In 2007, Bank of England‟s figures showed
that household debt in the UK was standing at nearly almost as much as their entire annual
gross domestic product. Borrowings had almost doubled since 2000 with rising house prices
and the biggest consumer-spending boom in the UK‟s history15.
11
Budworth.
12
Pilbeam, 2010, pg. 446-447.
13
Pilbeam, 2010, pg. 427-429.
14
Stock Market for beginners, “The recession of 2008/2009- was it different in the UK than in the US?”, Stock
markets for beginners, 20 April 2010, retrieved 2011-02-15 from
http://www.stockmarketforbeginners.co.uk/the-recession-of-20082009-was-it-different-in-the-uk-than-in-the-us
15
Cris Sholto Heaton, “Will the UK's debts drag the economy into recession?”, Money Week, 4 December 2007,
retrieved 2011-02-15 from http://www.moneyweek.com/news-and-charts/economics/will-the-uks-debts-drag-
the-economy-into-recession
~3~The economic heartache began when gross domestic product fell by 1.5 percent during the
final quarter of 200816. On 8th of October 2008 the UK announced an unprecedented £500
billion bank rescue scheme to restore market confidence and to stabilize the British banking
system. Despite the huge scale, the October 2008 bailout was not sufficient to stabilize the
British banking system or the UK financial markets and in January 2009 the government
announced a second bank rescue package of £50 billion of funds, which were available for
large corporations, and an Asset Protection Scheme to be able to increase the ability of British
banks to lend money17. In March 2009 The Bank of England made its final attempt to boost
the UK's economy by cutting the interest rate. In October 2008 the rate was as high as 5
percent and by March 2009 the rate was down to measly 0,5 percent which still in May 2011
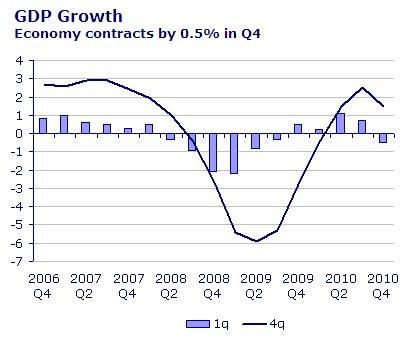
was unchanged18. In the final quarter of 2009 the UK economy announced a weaker than
expected GDP growth of 0.1 percent and they barely made it out of the recession, compared
to the US who had a GDP growth of 3.5 percent. The UK residents definitely felt the effect of
the recession in 2009 when the economy shrank 5 percent19 and the number of people
declared insolvent reached 134,142 including 74,670 bankruptcies, 47,641 Individual
Voluntary Arrangements and 11,831 Debt Relief Orders20.
Figure 1: GDP Growth UK21 (http://www.thisismoney.co.uk/credit-crisis)
During the last quarter of 2010 the GDP shank unexpectedly with 0.5 percent from the third
quarter due to the bad weather conditions and the collapse in the construction industry.
According to Bloomberg analysis, GDP was supposed to increase 2.7 percent compared to the
corresponding quarter 2009. The unexpected GDP fall resulted in an even deeper decrease in
16
Stock market for beginners.
17
Pilbeam, 2010, pg. 446-447.
18
BBC news, ”Economy Tracker”, BBC News, 5 May 2011, retrieved 2011-05-11 from
http://www.bbc.co.uk/news/business-11013715.
19
Oxlade, 27 April 2011.
20
Stock Markets for beginners.
21
Oxlade Andrew, “Economy Watch: What next for Britain‟s collective wealth?”, This is money, 28 July 2011,
retrieved 2011-02-02 from http://www.thisismoney.co.uk/money/news/article-1616085/Economy-watch-What-
Britain.html.
~4~the pound by the end of 201022. The UK had the worst budget deficit in the EU in 2010 with a
decrease of more than 10 percent of GDP. Before the shocking GDP figures, the primary
concern was inflation but due to a sudden inverted economic growth the growing concern was
„Stagflation‟ which happens when the inflation rate is high and economic growth is low.
Finally the British GDP marginally rose in early 2011 with a growth of 0.5 percent and
thereby avoided a technical return to the recession23.
1.1.3. The effects of the Finance crisis in Sweden
Sweden is a small open economy heavily dependent on what is happening internationally. A
global financial crisis combined with a recession, is having painful effects on the Swedish
economy24.
Finance Crisis 1990-1994
During the years of 1990-1994 the Swedish economy was hit by a deep recession as a result
of the high economy in the western world. Due to the devaluation of the SEK 1982, Swedish
investors could start invest internationally and got an advantage against other countries. This
led to an increase in consumption which contributed to rising prises and a rising inflation. The
lending demand increased rapidly and house prices rose. In 1990 the inflation went the other
direction due to capital became scarce, it became more expensive to lend money, the lending
demand decreased and house prices fell. This unpredictable dramatic change in Swedish
economy led to a disastrous increase in credit losses for the banks due to a miscalculation of
credit estimation. The situation was changed and Sweden was hit by a credit crisis worst than
ever expected25.
Finance Crisis 2008
Before the summer of 2008, the Swedish banks managed to avoid being affected by the
finance crisis even though it had become a global problem. Many Swedish banks had invested
in finance instruments at Lehman Brothers and due to their collapse in September 2008, the
Swedish banking system was strongly affected and the borrowing cost for the banks rose.
Swedbank was the bank with most difficulties to get new loans due to future concerns about
their bank branches in the Baltic countries. The concerns involved the risk of a possible
devaluation in the Baltic counties which would had aggravated the economic situation even
more involving credit losses of billions of SEK for Swedbank and SEB 26. Carnegie
Investment bank AB was the first Swedish bank who went down during the finance crisis. In
the beginning the bank received financial help from the national bank of Sweden, Riksbanken,
but when the bank lost its banking license the loans was taken over by the National Debt
Office, Riksgälden, which resulted in a nationalization of Carnegie Investment bank AB27.
22
E24, “Oväntat brittiskt BNP-fall” E24, 2011, retrieved 2011-02-15 from
http://www.e24.se/makro/varlden/ovantat-brittiskt-bnp-fall_2575075.e24
23
Oxlade.
24
Sveriges Riksbank, ”Öberg: Sverige och Finanskrisen”, 2009, retrieved 2011-02-20
http://www.riksbank.se/templates/Page.aspx?id=30277
25
Aktefinansanalys.se, ”Den svenska finanskrisen på 1990-talet”, Finanstidningen, 25 March 2008, retrieved
2011-02-20 from http://www.finanstidningen.biz/index.php/finansartiklar/nationalekonomi/71-den-svenska-
finanskrisen
26
Lucas Dan, “Swedbank ovanligt hårt drabbad av krisen”, Dagens Nyheter, 26 October 2008, retrieved 2011-02-
20 from http://www.dn.se/DNet/jsp/polopoly.jsp?a=8444764
27
Sveriges Riskbank, ”Riskgälden tar över lån till Carnegie”, 2008, retrieved 2011-02-20 from
http://www.riksbank.se/pagefolders/37568/nr56.pdf
~5~The year 2009 was the most affected year by the global recession, which resulted in a
negatively GDP growth of -5 percent in Swedish economy due to decreased consumption
internationally28. Riksbanken normally have a policy to prioritise low inflation but made the
mistake of waiting too long to decrease the interest rate and the consumer price index had
already increased with 1 percent. In the summer 2009, Riksbanken lowered the repo rate
down to 0.25 percent with the purpose to fix the inflation rate, prevent devaluation and to
contribute to an increased consumption29.
2010 was an impressive year for Swedish economy. According to Statistiska Central Byrån30,
the total GDP growth during 2010 was 5.5 percent, with a GDP growth of 7.3 percent during
the last quarter of 2010. Leif Petersen, macro reporter and analyst at the Swedish newspaper
Svenska Dagbladet, forecasted the economic growth to continue to increase with
approximately 3-4 percent during 201131. Increased utilization of resources and raising
commodity prices made the “Riksbanken” to raise the repo rate to 1.25 percent by the end of
2010 and is expected to reach 2 percent by the end of 201132. The reason for the increasing
repo rate is to prevent a possible increasing inflation rate due to the surprisingly positive
development in Europe, especially in Swedish economy33. The house prices in Sweden
showed unlike in many other countries, no major corrections during the financial crisis. Even
though they had a slightly decrease the prices have continued to rise and many analysts
believe that the Swedish housing is overvalued34.
1.2. Research problem
It is now 2011 and the world is recovering from the last years‟ financial crisis. Even though
some countries have been more affected then others, the financial improvement is now visual
all around the world. The UK has been one of the economies that have struggled a lot to get
their self out of the recession with an economy worse than expected in the last quarter of
2010, while Sweden unexpectedly had the highest GDP growth since the quarterly records
began in 197035.
The extreme differences in GDP growth figures during the last quarter of 2010, created an
interest of investigating how such a small economy like Sweden could get out of the recession
so successfully while a powerful economy as UK ended up being the last major economy to
escape the recession. By comparing the economic situation between the banks of the two
28
Ekonomifakta, ”2010: ett år som överraskade”, Ekonomifakta, 2010, retrieved 2011-02-21 from
http://www.ekonomifakta.se/sv/Artiklar/2010/December/2010-ett-ar-som-overraskade/
29
Sveriges Riksbank, ”Wickman-Parak: Finanskrisen ur ett centralbanksperspektiv”, 2008, retrieved 2011-02-20
from http://www.riksbank.se/templates/Page.aspx?id=29561
30
Statistiska Centralbyrån ”BNP 2010 kvartal 2010:4”, Sveriges officiella statistik, 2011, retrieved 2011-07-21
from http://www.scb.se/statistik/_publikationer/NR0103_2010K04_TI_NR01TI1101.pdf
31
Leif Pedersen, “Rekordhög BNP-tillväxt”, Svenska Dagbladet, March 1 2011, retrieved 2011-02-21 from
http://www.svd.se/naringsliv/rekordhog-bnp-tillvaxt_5976249.svd
32
Affärsvärlden, ” Sveriges ekonomi varvar upp” Affärsvärlden, 2010, retrieved 2011-02-22 from
http://www.affarsvarlden.se/hem/nyheter/article803075.ece
33
Affärsvärlden, ” DI:s skuggdirektion tror på höjd ränta”, Affärsvärlden, 2010, retrieved 2011-02-22 from
http://www.affarsvarlden.se/hem/nyheter/article2559500.ece
34
Sveriges Riksbank, ”Sambandet mellan hushållens sparande och husprisfall” , Ekonomiska kommentarer,
2011, retrieved 2011- 05-21 from
http://www.riksbank.se/upload/Dokument_riksbank/Kat_publicerat/Ekonomiska%20kommentarer/2011/ek_kom
_no4_11sv.pdf
35
Pedersen.
~6~countries‟ during the recession, would make it possible to get a deeper understanding of what
could have been causing this. The presence of a financial crisis is affecting the banks‟
performance and by analysing the financial information from the major banks in both the UK
and Sweden during this time, might give the research the answer to how the recession affected
these countries differently. To carry out this research a Financial Ratio Analysis will be used
as a tool to analyse and evaluate the differences between the banks during 2006 to 2010. A
Financial Ratio analysis is also used to evaluate the stability within the bank which is of major
interest for this research. Difficulties during the application of the financial ratios are likely to
appear during the analysis section since bank‟s operations differs from non-financial
operations. Consequently, special financial ratios used for financial institutions had to be
added to the investigation to give it a more accurate picture.
1.3. Research question
Based on the research‟s problem discussion, the research question is developed as followed:
How do the British banks’ financial ratios differ from the Swedish banks’ during the
period of 2006-2010?
Can these numeric values be used to compare the two countries’ situation during the
end of the financial Crisis and if so, what conclusions can we make?
1.4. Purpose
Based on the research question the purpose of this research is to investigate how the finance
crisis has affected the leading banks‟ performance within the two countries. This is made by a
financial ratio analysis to see whether the differences in values can explain the difference in
GDP growth during the last quarter of 2010.
1.5. Delimitations
This research has chosen to limit the investigation to the four largest commercial banks in
Sweden and The UK. Since the interest is to examine whether any similarities or differences
existed between these countries‟ financial ratios during 2006 to 2010, choosing these banks
would be able to give the researcher a broad picture of the two countries‟ situation and
discover any potentially performance trends.
This research is investigating the banks‟ performance during the financial crisis and to be able
to discover the performance trends with high accuracy, the years 2006 to 2010 has been
chosen. We decided to include the years that were affected during the crisis, with 2006 as a
supplement in order to see how prepared the banks were before the crisis. The information
will be based on the annual reports from these five years and the financial ratios will serve as
the basis of the analysis. The ratios have been limited to the ones used by financial services.
The ratios consist of risk-, effective- and performance related ratios with the purpose to see
the financial crisis‟s impact on the banks performance.
~7~1.6. Outline
Chapter 1: Introduction
In the first chapter the background and the problem discussion is introduced followed by a
research question and purpose.
Chapter 2: Methodology
In chapter two a description of the course of action is presented including the choice of banks
and financial ratios. It ends with a discussion of the method‟s credibility.
Chapter 3: Literature review/ Theoretical framework
The third chapter is introduced by an explanation of credit risk and a model of preventing
banking failure. It is followed by an explanation of the selected ratios and the regulatory
framework that governs the banks‟ operations.
Chapter 4: Empirical data and analysis
In this chapter the empirical data in terms of ratios is presented in charts followed by an
empirical and analytical reflection.
Chapter 5: Final discussion
The fifth chapter contains a final discussion of the two sub queries with the purpose to come
to a conclusion.
Chapter 6: Conclusion
In the last chapter the research question are answered together with suggestions of further
research within the same area.
1.7. Previous Research
A research made by Dobrimil Serwa, Larger crises cost more: Impact of banking sector
instability on output growth, (2010)36 contains an investigation of whether banking crises
cause economic slowdown and to what extent the size of a crisis affects the GDP growth. The
research came to the conclusion that after controlling the impact of the recession on the size
of crisis, the banking crises cause output growth to slow down. The reduced growth in credit
use cause a reduction in accumulated four year GDP growth by around 2 percentages. A
significant relationship was also found between credit and money dynamics and output
growth suggested that credit and monetary transmission channels are responsible for
transferring banking crisis to real economy. The method used to obtain the result was an
event-study approach and multi-equation models which applied measurements of different
banking crises received from banking sector aggregates containing dataset of over 100
banking crises. The results based on the method and data suggested that crises are costly for
economies at least in short term and it is the size of the crisis that matters for economic
growth. Lower credit and money growth during crises cause GDP growth to decline.
The research by Dobromil Serwa will be used as a tool during the final discussion to connect
it with the different GDP growth changes in both countries in the final quarter of 2010.
36
Dobril Serwa (2010), “Larger crises cost more: Impact of banking sector instability on output growth”.
Journal of International money and Finance, retrieved 2011-05-13 from www.elsevier.com
~8~This study is also influenced by two bachelor theses both focused on comparing the Swedish
banks‟ financial situation during the finance crisis 2008 and the crisis 1990-1994. The
research rapports by Emma Karlsson and Karin Neuman (2008)37 and Jeanette Nilsson and
Cynthia Osorio Navarro (2009)38 are both based on whether the Swedish banking system have
learned its lesson from the previous crisis to prevent itself from turning into the same situation
14 years later. The final conclusion of the research rapports is that the recent finance crisis has
not affected the Swedish economy as greatly as the first one did. Swedish banks have shown a
higher level of profitability and stability during the later finance crisis and based on the
CEO‟s comments the banks‟ have changed their routines, guidelines for the operation together
with new knowledge that have changed their attitude to risk management. If it is due to the
experience of the previous crisis still remain as a matter of interpretation. The rapports are
written in 2008 and in the beginning of 2009 which means they do not contain an evaluation
of the last 2 years of the crisis, including 2009 which was the major year for the crisis in
Sweden. Consequently the rapports are not complete, but still a useful material for this study
by acting as a foundation for this research‟s final discussion.
The research by Domingos Rodriguez Pandelo Junior, Contribution to the analysis and
measurement of bank insolvency, (2009) 39 is an article sought to present a theoretical model
to assess and try to understand the Phenomenon of bank insolvency since it is of fundamental
importance to the economy. The basic justifications is that without stability in the banking
system monetary stability cannot be achieved and banking crises will contribute to greatly
costs for the society. The research generated a theoretical model to be capable of identifying
the main aspects of bank insolvency in order to gain further understanding of the issue and the
implantation of more effective preventive measures. The conclusions made from the research
are that banking crises, with the consequent insolvency of financial institutions, can be
assessed in three dimensions: macroeconomic, microeconomic, and institutional. However,
banking crises are most associated with macroeconomic shocks and less effective regulatory
or legal systems. Depending on the minimum capital requirements established by regulating
agencies, banks may operate with a higher weighted average cost of capital (WACC). A
higher WACC can cause them to take bigger risks to compensate the higher cost of capital. In
this case, regulators should be aware that fixing minimum capital requirements for financial
institutions can have the opposite effect to the one desired.
“Prediction of banking failure” by Paul A. Meyer and Howard W. Pifer (1970)40 is a model
which forecasts bankruptcy in the banking sector. This model has been used as a tool to find
the most accurate financial ratios for this research. The model will be further explained in the
theoretical chapter.
37
Karlsson, Emma & Neuman, Karin (2009), ” Bankkrisens nyckeltal - en jämförande studie mellan de
krisdrabbade åren 1992 och 2008”. Retrieved 2011-02-24 from http://hdl.handle.net/2077/19156
38
Nilsson Jeanette & Osorio Navarro Cynthia, “Bankrörelsen: En studie mellan bankkrisen 1992 och 2008”.
Retrieved 2011-02-24 from http://urn.kb.se/resolve?urn=urn:nbn:se:sh:diva-2694
39
Domingos Rodrigues Pandelo Junior (2010). “Contribution to the analysis and measurement of bank
insolvency”, June 27, retrieved 2011-03-01
40
Paul A. Meyer and Howard W. Pifer (1970) “Prediction of Bank Failures”. The Journal of Finance.
~9~2. Methodology
In the methodology chapter a review of the research’s methodological choices is provided
followed by an explanation of the method used for data collection. The selected samples of the
banks and financial ratios are then introduced to give the reader an idea of the width of the
research.
2.1. Description of choosing a method
A methodology is „an approach to the process of the research, encompassing a body of
methods‟ and a method is „a technique for collecting and/or analysing data‟41.
According to D.I. Jacobsen, methodology is a working technique of collecting empirical data
to give a description about the reality. The problem is that there are disagreement of what the
reality really is and how to collect this information to get the best possible approximation to
reality. Therefore it is important that the chosen method is of great relevance to the research
problem42.
2.2. Overall methodological choices
The research is investigating and comparing the four main banks in The UK resp. Sweden
during the years of 2006-2010. The reason of choosing this research topic is to get a deeper
understanding of why the two countries came out of the recession differently. The overall goal
with this research is to investigate, with help from a financial ratios analysis, whether there
are any differences between the ratios of the four main banks in The UK and Sweden during
these eventful years. The numeric values will be compared and evaluated to be able to make a
conclusion if these values can be used to compare the two countries‟ situation during the end
of the financial crisis.
The purpose of using the financial ratio analysis is to develop a deep understanding of what
happens with the banks finances in times of crises. This is put into practice by analysing the
relevant ratios followed by an investigation of possibilities to discern any patterns or
abnormalities among the main banks in the two countries. Using the annual reports as a tool to
evaluate, analyse and compare companies is the most common using area for this type of
information. The methodology choice has been evaluated through the four characteristics of
the research; the purpose, the process, the outcome and the logic.
The purpose
The research is classified as a descriptive research since the purpose is to describe phenomena
as they exist and identify and obtain information on characteristics of the problem. A
descriptive research cannot describe what caused a situation even though the data is factual,
accurate and systematic. The phenomena of this research are the different ratios which will be
identified and will contribute to obtain information on the characteristics of the problem. The
choice of method is based on the assumption that the financial ratios are relevant to the
41
Jill Collis and Roger Hussey, Research methods. 2009, pg. 73.
42
Ingvar D Jacobsen, Vad, hur och varför? Norway, 2000, pg. 20-258.
~ 10 ~research problem. A descriptive research method is applicable when already well researched
ratios act as the foundation for a financial ratio analysis of the banks‟ performance during the
years of 2006-201043.
The process
A qualitative research often has the aim of description and researchers may follow up with
examinations of why the observations exist and what the implications of the findings are. A
qualitative research is concentrating on data in terms of words, sentences and stories which
includes public records, annual reports etc. The research will be designed as a descriptive
research based on annual reports for a small number of banks in Sweden and the UK. This
research will therefore be classified as a document study with a qualitative inquiry approach
to give the research a deep description of the problem.
This research is excluding the idea of a quantitative inquiry approach since this type of
method is more suitable when generalization based on a larger number of samples is
prioritized. In the case of this research, a qualitative inquiry approach makes it possible to
investigate more deeply in the phenomena and get a higher internal validity44.
The outcome
The outcome of this research is to give a general understanding of the research problem rather
than solve it and therefore a basic research is suitable. A basic research is designed to make a
contribution to general knowledge and theoretical understanding rather than solve a specific
problem.
The logic
To classify this research according to the logic, an inductive approach is chosen. This
basically means developing theory from observation of empirical reality. Due to being
uncertain of the outcome an inductive approach is suitable since openness is necessary for this
research45.
2.3. Data collection
Collecting data for a research can be done in two ways; through primary data or secondary
data. When collecting primary data, the researcher is collecting the data for the first time,
specifically tailored to match the problem. Secondary data is on the other hand not collected
directly from the source and is instead based on information collected from others in terms of
annual reports, textbooks and newspapers46.
Since the data for this research are mainly retrieved from the banks‟ annual reports followed
by textbooks, internet pages and newspapers, this study is based on secondary data. As the
research is based on a very recent topic many of the data had to be collected from electronic
sources. The secondary data has most likely been collected for another purpose than what this
research wants to investigate and therefore the data provided has been critical examined. The
method was chosen principally to get a comprehensive picture of the problem using already
excising data.
43
Collin and Hussey, 2009, pg. 73.
44
Jacobsen, 2000, pg. 57
45
Collin and Hussey, 2009, pg. 74.
46
Jacobsen, 2000, pg. 153
~ 11 ~2.4. Methodological criticism
For a study to be perceived credible, it should have a high reliability and validity.
A drawback using a qualitative method is the demand of recourses. For this reason a
qualitative research is focusing more on further variables and fewer units. Due to the limited
amount of participants it will also limit the chance to generalize which impeaches the external
validity. A qualitative research method is also limiting the ability to scrutinise the data
provided from a critical perspective and to give a critical reflection47.
2.4.1. Difficulties with ratios
Like all other management tools, ratios can be misused and misleading if used
mechanistically. Therefore a proper valuation of each variable has to be done before
calculation of a ratio. Figures might be made up in published financial statement to hide a
falling trend in certain important ratios or a group of assets or liabilities may or may not
include certain figures. Unless this is not taken into consideration and adjusted properly
before the calculation wrong interpretation may vitiate the analysis48.
2.4.2. Reliability
A research with high reliability has repeatedly proven the same result independently of the
investigator49.
To prove this study‟s reliability the study will be based on the companies‟ annual reports.
This will give a fair picture of their actual financial situation due to strict rules about how to
establish these reports are implemented in both the UK and Sweden. If these rules are not
followed correctly the company will be punish significantly to ensure is not a risk worth
taking. The reliability is also further enhanced due to the requirement of accounting. From
this reason an equivalent result of this data would probably be obtained independently of the
investigator.
2.4.3. Validity
High validity is achieved through measuring the relevant components in the context. To be
able to investigate the problem, the relevant information needs to measure what it is suppose
to measure50.
To increase the validity of the research it is important to choose the most relevant ratios for
the research. The precaution, for the comparison to be relevant, is that the ratios must use only
data that are representative in context and composition. The approach to achieve as high
validity as possible is to use ratios that have proven to be significant financial instruments in
previous studies of banks. The relevant financial ratios in this research are those who are
focused on evaluating a bank‟s financial situation and exhibit difference in value when the
banks financial situation is influenced by the crisis.
47
Jacobsson, 2000, pg. 20-21
48
Bhattacharya Hrishikes, Banking strategy Credit appraisal and Lending decisions. New Delhi, 1997, pg. 505-
682.
49
Jacobsson, 2000, pg. 255
50
Jacobsson, 2000, pg. 257-258
~ 12 ~To be able to give an as accurate picture as possible, without being influenced of the banks
calculations and potential promotional intentions, the study will be based on own calculated
ratios. This will result in a more accurate comparability between the eight chosen banks.
2.5. Sample of banks
Since the purpose of the research is to examine differences in ratios between the banks in The
UK and Sweden during the financial crisis, the research has been narrowed down to the four
largest commercial banks in each country.
As indicated by the English magazine, Global Finance, the largest banks in the UK are listed
as; The Royal Bank of Scotland (RBS), Barclays, HSBC and Lloyd‟s Banking Group. The
RBS and Barclays were also ranked as the world‟s biggest banks measured by total assets
200951. Since the research is of qualitative approach, the sample of banks is small and to be
able to collect data as accurate as possible these banks were chosen.
The four biggest British Banking Groups
Banks Market Capitalization Total Assets
(As of 3 May 2011) (As of 31 December 2010)
Billion SEK Billion SEK
HSBC Holdings 1 765,952* 15 85053**
Royal Bank of Scotland group 457,254* 15 25255**
Lloyds Banking Group 399,456* 10 40657**
Barclays 347,658* 15 62059**
Table 1: The four biggest British Banking Groups
*GBP/SEK rate 3rd of May 9,96
**GBP/SEK rate 31st of December 10,49
51
Dan Keeler,” World‟s biggest banks 2009”. Global Finance, 2008, retrieved 2011-04-06 from
http://www.gfmag.com/tools/best-banks/2523-worlds-biggest-banks.html#axzz1LJCCn4qy
52
Bloomberg, ”HSBC Holdings PLC”, 3 May 2011, retrieved 2011-05-03 from
http://www.bloomberg.com/apps/quote?ticker=HSBA:LN
53
HSBC Holdings, annual report (2010)
54
Bloomberg, ” Royal Bank of Scotland Group PLC”, 3 May 2011, retrieved 2011-05-03 from
http://www.bloomberg.com/apps/quote?ticker=RBS:LN
55
RBS banking group, annual report (2010)
56
Bloomberg, ” Lloyd‟s Banking Group PLC”, 3 May 2011, retrieved 2011-05-03 from
http://www.bloomberg.com/apps/quote?ticker=LLOY:LN
57
Lloyds banking group, annual report (2010)
58
Bloomberg, “Barclays PLC”, 3 May 2011, retrieved 2011-05-03 from
http://www.bloomberg.com/apps/quote?ticker=BARC:LN
59
Barclays, annual report (2010)
~ 13 ~You can also read