Private Equity and Financial Stability: Evidence from Failed Bank Resolution in the Crisis - FDIC
←
→
Page content transcription
If your browser does not render page correctly, please read the page content below
WORKING PAPER SERIES

         Private Equity and Financial Stability:
   Evidence from Failed Bank Resolution in the Crisis
                                              Emily Johnston-Ross
                                      Federal Deposit Insurance Corporation

                                                      Song Ma
                                                   Yale University

                                                 Manju Puri
                           Duke University, Federal Deposit Insurance Corporation,
                                 and National Bureau of Economic Research

                                                      April 2021

                                              FDIC CFR WP 2021-04

                                                      fdic.gov/cfr

The Center for Financial Research (CFR) Working Paper Series allows CFR staff and their coauthors to circulate
preliminary research findings to stimulate discussion and critical comment. Views and opinions expressed in CFR Working
Papers reflect those of the authors and do not necessarily reflect those of the FDIC or the United States. Comments and
suggestions are welcome and should be directed to the authors. References should cite this research as a “FDIC CFR
Working Paper” and should note that findings and conclusions in working papers may be preliminary and subject to
revision.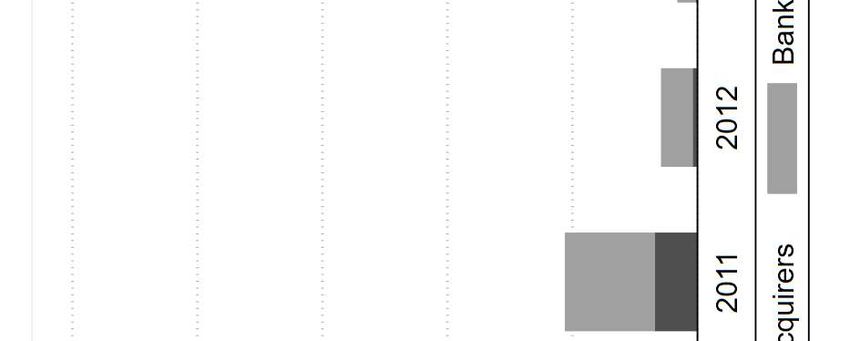
Private Equity and Financial Stability:
            Evidence from Failed Bank Resolution in the Crisis

           Emily Johnston-Ross                       Song Ma                          Manju Puri
                     FDIC                         Yale University              Duke University, FDIC,
                                                                                    and NBER

                                                     Abstract
We investigate the role of private equity (PE) in the resolution of failed banks after the 2008
financial crisis. Using proprietary failed bank acquisition data from the FDIC combined with data
on PE investors, we find that PE investors made substantial investments in underperforming and
riskier failed banks. Further, these acquisitions tended to be in geographies where the other local
banks were also distressed. Our results suggest that PE investors helped channel capital to
underperforming failed banks when the “natural” potential bank acquirers were themselves
constrained, filling the gap created by a weak, undercapitalized banking sector. Next, we use a
quasi-random empirical design based on proprietary bidding data to examine ex post performance
and real effects. We find that PE-acquired banks performed better ex post, with positive real effects
for the local economy. Our results suggest that private equity investors had a positive role in
stabilizing the financial system in the crisis through their involvement in failed bank resolution.
JEL Classification: E65, G18, G21
Keywords: Private equity, Financial stability, Failed banks, Financial crisis

This version: April 2021. First Version: September 2019. Emily Johnston-Ross can be reached by phone: (202) 898-
6841, email: emjohnston@fdic.gov. Song Ma can be reached by phone: (203) 436-4687, email: song.ma@yale.edu.
Manju Puri can be reached by phone: (919) 660-7657, email: mpuri@duke.edu. For helpful comments, we thank
Haelim Anderson, Christa H.S. Bouwman, Michael Ewens, Edith Hotchkiss, Filippo Mezzanotti, David Robinson,
Paul Soto, James Weston, and Ayako Yasuda. We also thank seminar and conference participants at AFA Annual
Meeting, Corporate Finance Conference at Washington University in St. Louis, Econometric Society World Congress,
MFA Annual Meeting, Southern California PE Conference, Texas A&M University Young Scholar Symposium,
Bank of Italy, Boston College (Carroll), CAFRAL (Reserve Bank of India), Duke University, European Stability
Mechanism, FDIC Center for Financial Research, Florida (Warrington), Georgia Tech (Scheller), Luxembourg School
of Finance, Michigan State, New York Fed, Northwestern (Kellogg), UBC (Sauder), UMass-Amherst (Isenberg), Utah
(Eccles), Villanova, Virginia (Darden). Xugan Chen, Gen Li, and Yi Wang provided excellent research assistance.
We are grateful to subject matter experts at the FDIC, including Joshua Christie, Lynn Shibut, Jane Slattery, and many
others, for sharing their knowledge of institutional details. Any errors are entirely our own. The Center for Financial
Research (CFR) Working Paper Series allows CFR staff and their coauthors to circulate preliminary research findings
to stimulate discussion and critical comment. Views and opinions expressed in CFR Working Papers reflect those of
the authors and do not necessarily reflect those of the FDIC or the United States. Comments and suggestions are
welcome and should be directed to the authors. References should cite this research as a “FDIC CFR Working Paper”
and should note that findings and conclusions in working papers may be preliminary and subject to revision.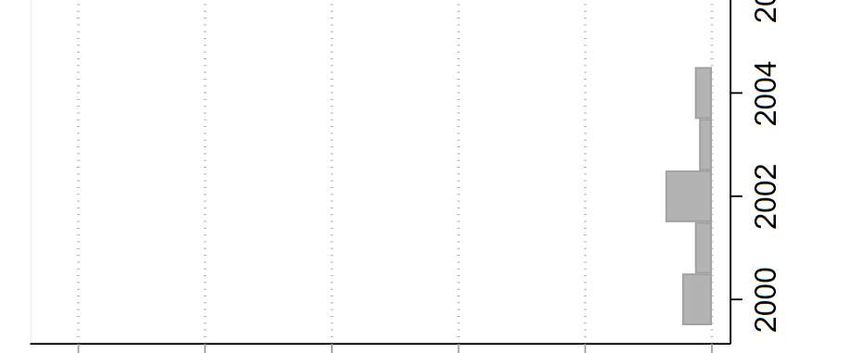
1. Introduction

Private equity (PE) has become an important component in the financial system. An extensive
literature explores the effects of private equity buyouts on firm-level outcomes, such as
employment, productivity, product quality, and innovation, with some papers arguing that such
buyouts positively affect the operations of target companies. 1 At the same time, the private equity
industry generates much controversy. Critics of the private equity industry often argue that private
equity transactions involve heavy financial engineering schemes that introduce a substantial debt
burden on the target companies and default risks to the banking sector (Andrade and Kaplan, 1998;
Kaplan and Strömberg, 2009). This concern could be exacerbated during an economic downturn
due to the cyclicality of private equity investment (Bernstein, Lerner, and Mezzanotti, 2019).

     How does private equity interact with and affect the stability of the financial system, especially
during periods of crisis? Despite its importance, there has been little research on the matter. In this
paper, we investigate this question by examining private equity investors’ engagement in the failed
bank resolution process in the aftermath of the 2008 crisis. This is a novel setting to study private
equity and financial stability. To begin with, bank failures and their resolutions are a salient feature
of financial crises, and have a significant real effect on the economy (Bernanke, 1983; Granja,
Matvos, and Seru, 2017). Indeed, banks are central to the functioning of financial markets and
have important externalities (Gorton and Winton, 2003). As a result, our setting allows us to
examine private equity investors’ role in one of the most crucial steps in stabilizing the financial
system in a crisis. Moreover, the setting is unique compared to most of the PE literature, and thus
demands a separate investigation. Compared to industrial firms in which private equity investors
often intervene, banks are subject to more stringent regulation, 2 and require unique expertise and
human capital. This non-bank involvement in banks also generates a lot of controversy.

     The role of PE in failed bank resolution is a priori unclear. There are concerns that PE
investors could exert negative influences on financial stability. PE investors may take advantage
of the fragile banking sector and target high-quality assets under fire sales. Banks have safety nets

     1
       See, for example, Kaplan (1989), Lichtenberg and Siegel (1990), John, Lang, and Netter (1992), Boucly, Srear,
and Thesmar (2011), Lerner, Sorensen, and Stromberg (2011), Davis et al. (2014), Bernstein et al. (2016), and
Bernstein and Sheen (2016).
     2
       For example, a list of federal banking regulations can be found here: https://www.stlouisfed.org/federal-
banking-regulations/.

                                                           1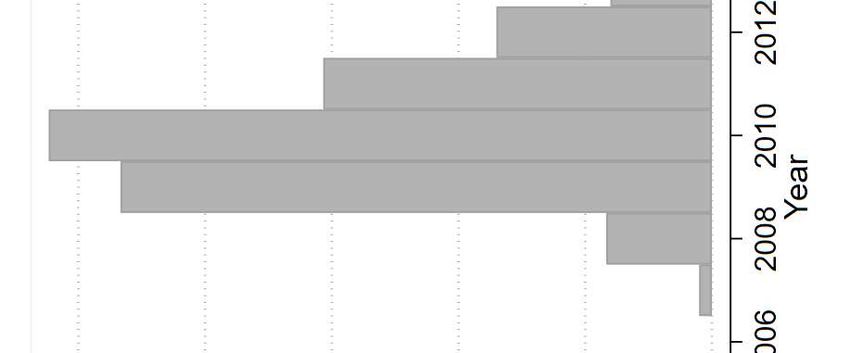
and backstops that may also be exploited by PE investors. Further, PE acquisitions may be value
destroying if PE investors are not well prepared to operate a bank.

    On the other hand, PE investors could have a unique advantage in stabilizing the financial
system through acquiring failed banks. First, PE investors have a higher risk appetite, and this may
allow them to target riskier and lower quality failed banks that are less appealing to traditional
bank acquirers. Under this line of reasoning, PE investors complement the bank acquirers through
the “selection” of failed banks. Second, during those financial downturns, PE investors may have
relatively more stable funding (Bernstein, Lerner, and Mezzanotti, 2019), bringing in new capital
in times of capital scarcity. Third, PE investors have the expertise to turn around distressed firms
in adverse economic situations (Hotchkiss, Smith, and Strömberg, 2011; Jiang, Li, Wang, 2012;
Cohn, Hotchkiss, Towery, 2020).

    This paper exploits detailed, proprietary failed bank acquisition data at the FDIC. We observe
information on failed banks, bidding, and acquisition activities. We identify PE investors who
participated in failed bank resolutions, both as bidders of the failed bank’s assets in failed bank
auctions and as acquirers of the failed bank’s assets when awarded the winning bid. We further
augment the data with bank operation data extracted from the Consolidated Reports of Condition
and Income “Call Reports,” the FDIC Summary of Deposits (SOD) and the FDIC Reports of
Structure Change. We also supplement our data using PE-level information from Preqin.

    Who do PE investors acquire? PE acquisitions are significant, totaling about a quarter of all
failed bank assets acquired in the period 2009–2014. We find that PE investors bid for, and
eventually acquire, failed banks that are of poorer quality and higher risk compared to those that
were acquired by banks. PE-acquired banks, on average, are larger and more undercapitalized,
evidenced in their lower tier 1 risk-based capital ratio (measuring a bank’s core equity capital).
They tend to have a lower ratio of core deposits (which measures a stable source of funds for the
bank). PE-acquired failed banks also have lower profitability prior to failure, captured by the net
interest margin. PE-acquired banks also hold larger proportions of riskier loans. For example,
during the crisis, construction and development (C&D) loans had higher levels of
underperformance leading to an increase in credit risk ratings. PE-acquired banks, on average, hold
27 percent more C&D loans, relative to the 17.9 percent C&D loans to total loans in bank-acquired
institutions.

                                                   2
PE investors also focus on banks that are less likely to immediately synergize with healthier
existing banks. Granja, Matvos, and Seru (2017) show that bank acquirers are more interested in
purchasing failed banks that are geographically close to themselves to realize informational
benefits and economies of scale. Hence the natural acquirers of failed banks are healthy local banks.
We show that failed banks whose neighboring banks are in worse health are more likely to be
acquired by PE investors—when neighboring banks have lower tier 1 capital, higher proportions
of C&D loans and higher proportions of other real estate owned (OREO), which can reflect larger
amounts of distressed real estate properties held by the bank due to foreclosure.

    This evidence together points to a sorting pattern of failed banks with their plausible acquirers:
PE acquirers complement banks in this market by bidding and ultimately acquiring lower-quality
and higher-risk failed banks. In doing so, PE investors help channel capital that can fill the gap
created by a weak, undercapitalized banking sector and help meet the huge needs for new capital.
The PE presence allows more failed banks to avoid being liquidated and the local financial system
to be preserved. Comparing our data with a simple counterfactual world without PE investors
acquiring any banks, 25 (5.5 percent) more of the banks that failed during this time would have
been liquidated, and another 37 (8.1 percent) would have gone to a higher-cost bidder. In total, we
estimate that PE acquisitions allowed the FDIC to reduce resolution costs by $3.63 billion.

    We next ask: how do PE-acquired banks perform post acquisition? Filling the gap in the failed
bank resolution process left by undercapitalized bank buyers, as documented above, is valuable.
However, if PE interventions introduce excessive risks and long-term underperformance into the
financial system, the overall impact of PE would have to be viewed with caution. The empirical
challenge to isolate the effect of PE on post-acquisition performance of banks is the very
acquisition selection pattern that we present above. Banks and PE investors target a different
segment of the failed bank market, making any post-acquisition pattern a combination of treatment
and selection.

    To better identify the effect of PE acquirers, an ideal experiment would compare the post-
acquisition performance of two otherwise similar banks of which one is quasi-randomly allocated
to a PE investor and one to a bank. Our empirical strategy leverages the proprietary FDIC failed
bank bidding data to generate a quasi-random sample. We proxy the ideal experiment by focusing
on a set of banks that were bid on by both PE investors and by banks (i.e., selectable to both PE

                                                    3
investors and banks) and whose bidding values were close (below five percent of the total bank
assets). Essentially, the exercise compares banks that were (marginally) won by bank acquirers
and those (marginally) won by PE investors. This comparison allows us to significantly mitigate
the confounding selection problem and more cleanly isolate the direct effect of PE intervention.
Reassuringly, in this quasi-random sample, PE-acquired banks and bank-acquired banks look
statistically identical along dozens of characteristics, and the winning probability of PE investors
and banks in those auctions are nearly identical (52 percent vs. 48 percent).

     Armed with this empirical strategy, we explore several different performance metrics. First,
we track branch closures of acquired failed banks. PE-acquired failed bank branches are less likely
to close than bank-acquired failed bank branches. This result is robust to our preferred specification
in which we compare two bank branches that belong to two banks that failed in the same year and
the same state. For these branches, the only difference is whether it was quasi-randomly won by
another bank or a PE investor. It is important to note that the lower branch closing rate of PE-
acquired banks is not due to the fact that bank mergers often lead to consolidation of local branches,
which would make the higher closing rate in bank acquisitions mechanical. In fact, we also find a
higher probability of exiting a county altogether in bank-acquired banks, which cannot be
explained merely by consolidating local branches. Next, we find that PE-acquired banks
experience a significantly higher increase, roughly 35 percent higher growth across different
specifications, in branch-level deposits compared to other failed banks. Given deposits are the base
for profits, lending capacity, and market power, we interpret this as a positive indicator for PE-
acquired banks.

     The ability to maintain the scale of operation and a robust deposit base is an important
indicator of bank health and performance. More importantly, providing stable access to credit by
operating a local branch has important consequences for local businesses and the recovery from
the financial crisis (Nguyen, 2019). The positive performance patterns of PE-acquired failed banks
lead us to hypothesize that those acquisitions facilitate the regional economic recovery from the
crisis, and this is the basis of our next test.

     We adapt the same quasi-random framework to a county-level analysis. In this analysis, we
compare two counties—each county has a failed bank branch, but one is acquired by a PE investor
and one is acquired by a bank. These counties are statistically identical prior to the acquisitions.

                                                    4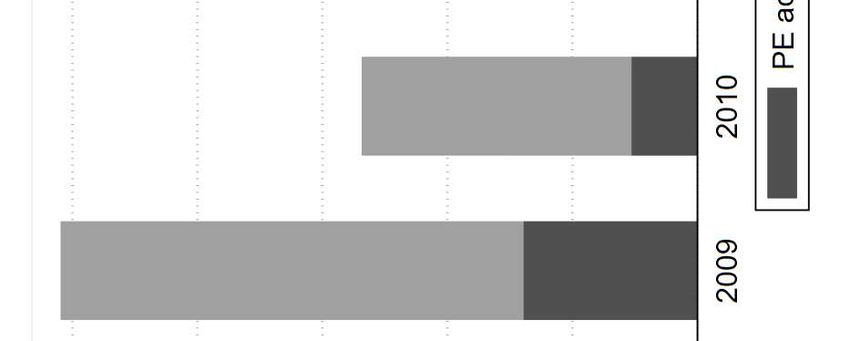
During the post-acquisition period, however, those counties with PE acquisitions experience
stronger recovery from the crisis—faster employment growth and increased total and per capita
income. One potential channel for this is the sustained lending activities supported by the acquired
bank branches. Compared to bank-intervened counties, PE-intervened counties witness higher
growth in small business lending, both in terms of the number and amount; those loans are also
made at a lower interest rate.

    The documented positive performance may be partially attributable to the expertise of the
management team that PE investors bring into failed banks. Using hand-collected data on CEOs
appointed at banks after PE acquisitions, we show that PE investors hire ex-bankers who, on
average, have nearly 30 years of experience in the banking industry, and more than half of them
were CEOs of other banks before being appointed at the failed banks. More than 60 percent of the
CEOs had experience in the local area of the failed bank, more than a third specialized in
turnaround management and troubled and distressed assets, and about a third had previously
founded a bank that eventually merged with a larger buyer.

    Taken together, our results suggest that private equity plays an important role in failed bank
resolution in a time of crisis. PE investors provide much needed capital in acquisitions, which
helps fill the gap of a weak banking sector at a time when the natural potential acquirers—local
banks—are themselves in distress. PE acquirers also help turn around the acquired failed banks,
preserving their branch structure, helping deposit growth, and managing the loan portfolio losses,
with positive effects for the real economy. While there are natural policy concerns in allowing PE
firms to form bank holding companies and in bringing in non-banks into banking in general, our
results suggest that, despite these concerns, private financial investors can play a positive role in
resolving distressed banks in a crisis.

    This paper connects to several strands of literature. It is related to an extensive literature that
studies the role of private equity in the economy (e.g., Kaplan, 1989; Lichtenberg and Siegel, 1990;
John Lang and Netter, 1992; Boucly, Sraer, and Thesmar, 2011; Lerner et al., 2011; Cohn,
Hotchkiss and Towery, 2013; Davis et al., 2014; Bernstein et al., 2016; Bernstein and Sheen, 2016;
DeYoung et al., 2018), and particularly in some regulated industries in recent work (e.g., Eaton,
Howell, and Yannelis, 2019; Kirti and Sarin, 2020; Gandhi, Song, and Upadrashta, 2021; Gupta
et al., 2021). These studies mostly focus on firms and almost exclusively on normal times, while

                                                    5
our focus is on the distressed state of the world. The paper on PE that is closest to ours is Bernstein,
Lerner, and Mezzanotti (2019), which studies PE investment in industrial firms in the crisis and
shows that PE investors did not exacerbate the negative shock to firms. However, the behavior of
PE investors in a highly regulated and sensitive industry such as banking is likely different from
PE’s behavior elsewhere. Our key contribution is to tackle the role of PE on financial stability by
directly examining the interaction between PE and the central actors—banks, particularly failed
banks that can result in significant costs to the financial system.

    This paper also relates to an emerging body of work examining the behavior of financial
institutions during the financial crisis (e.g., Ivashina and Scharfstein, 2010; Ben-David, Franzoni,
and Moussawi, 2012; Berger and Bouwman, 2013) and the resolutions of failed banks and their
impacts (James and Wier, 1987; James, 1991; Vij, 2020). The closest bank failure paper to our
work is Granja, Matvos, and Seru (2017), which provides a key economic insight that poor
capitalization of local banks, who are the natural buyers of failed banks, results in substantial costs
to the FDIC’s resolution efforts for failed banks. Our paper contributes to this new area of research
by introducing PE investors as financial buyers into the picture, a source that surprisingly buys 24
percent of the failed bank assets acquired in the resolution process during this period. We show
that PE investors operate as a complementary source of funding in the resolution of bank failures
at a time when the local bank buyers are themselves undercapitalized. Further, PE acquisitions do
well and also benefit the real economy. From a policy perspective, our findings are supportive of
the policy innovation of the OCC and the FDIC that allowed financial buyers to participate in the
resolution of failed banks.

2. Institutional Background

    In this section, we introduce background knowledge of how the FDIC resolves bank failures
and, more importantly, how PE investors can become a qualified player in this process. Roughly
five hundred banks failed during the financial crisis, putting a large strain on the financial system.
This fact can be seen clearly in Figure 1, which plots the number of bank failures (Panel A) and
the total assets at failure (Panel B) from 2000 onward.

    When a bank fails, the FDIC is appointed receiver by the failing institution’s chartering
authority. To address bank failures, the FDIC used the Purchase and Assumption (P&A) resolution

                                                     6
method in roughly 95 percent of the cases during 2009–2014, and these are the transactions studied
in this paper. 3 In a P&A transaction, the FDIC uses a process that resembles a first-price sealed
bid auction to sell some or all the assets and liabilities of the depository institution. Granja, Matvos,
and Seru (2017) provide a detailed description of how the process of failed bank resolution works;
we review relevant points here and refer interested readers to their paper and to the FDIC’s
Resolutions Handbook 4 for further details.
[Insert Figure 1 Here.]
To sell a failed bank, the FDIC first generates a broad list of potential bidders that have
expressed interest in bidding for failed institutions and that satisfy a list of requirements, such as
satisfactory capital and supervisory ratings. Upon signing a confidentiality agreement, interested
parties may be granted access to a virtual data room for the review of available information, which
can include loan reviews, schedules representing the value of items on the failed bank’s balance
sheet, and operational information. Interested parties can place sealed bids for the failed bank based
upon standard transaction terms, resembling a first-price sealed bid auction. Using its proprietary
least cost test, 5 the FDIC selects the bid whose terms entail the least-estimated cost for the Deposit
Insurance Fund (DIF) if those costs are below the reservation value set by the FDIC, which is
unknown to bidders. The bank is then closed, and the FDIC transfers assets and deposits to the
acquirer. 6
In the past, private investors have generally been excluded from bidding on failed institutions
because they themselves were not chartered banks. However, in 2008 the Office of the Comptroller
of the Currency (OCC) began making it easier for PE investors to participate in failed bank
auctions by creating a “shelf charter” program. A shelf charter allows investors to bid on failed
banks despite not being affiliated with an existing bank. The OCC also made available an
3
The remaining failures were resolved by the FDIC through depositor payouts and asset liquidation.
4
Federal Deposit Insurance Corporation (FDIC). 2019. Resolutions Handbook, Revised January 15, 2019.
https://www.fdic.gov/bank/historical/reshandbook/resolutions-handbook.pdf.
5
The least cost test evaluates the liquidation cost of the failed institution against the cost of alternative resolution
options. A few details are worth noting here: The Federal Deposit Insurance Corporation Improvement Act (FDICIA)
of 1991 requires that the FDIC select the bid that results in the least costly resolution to the Deposit Insurance Fund
(DIF). As a statutory requirement, this process for bid selection does not vary from bank to bank. Additionally, the
FDIC’s valuation of liquidation, the valuation of submitted bids, and the details of the least cost test itself are all
unknown to bidders.
6
Since failed banks are often smaller in size, concerns like “too big to fail” or antitrust issues generally do not
come under consideration by the FDIC when managing the bidding process and picking the winner.
7“inflatable charter,” which allows PE investors to buy a small, non-failing bank with the intention
of growing it quickly through subsequent failed bank acquisitions. There were twenty distinct
charters, obtained by nineteen PE consortia (more on “consortia” below), used to acquire failed
banks by PE in the crisis.
[Insert Figure 2 Here.]
In the charter approval process, PE acquisition plans are subject to a high degree of regulatory
scrutiny. Potential PE investors must submit details such as the proposed bank management team
qualifications, the sources and amount of capital available to the bank, and the business plan
describing intended operations of the acquired bank. The information gathering, application, and
approval process typically occurs well in advance of any specific acquisition opportunities that
may arise. In addition, because PE firms engage in non-banking activities, they must also apply to
the Federal Reserve Board for preliminary approval to form a bank holding company (BHC).
Most PE investors apply for a bank charter and form a BHC as a consortium together with a
number of other PE firms, often in the form of an LLC with PE firms as shareholders. This can
allow greater access to capital and help to leverage relevant expertise and connections. From a
BHC regulatory perspective there are advantages as well—firms with less than a 25 percent share
of voting securities or up to one third of total equity (provided that this includes less than 15 percent
of voting securities) are not subject to BHC regulation by the Federal Reserve Board. Applying as
a consortium can help limit the equity investments of individual PE firms below these regulatory
thresholds. For example, a number of PE firms might form an LLC with equity shares of the
individual PE firm participants below the threshold. The LLC is then used for the proposed BHC
and serves as the actual acquiring entity. Thus, while the holding company formed by the PE firms
is exposed to BHC regulation, the individual PE firms themselves are typically not.
PE acquirers did not have restrictions on what they could bid on, aside from the usual criteria
applied to other bank bidders, such as available capital and financial health. However, PE acquirers
did have additional requirements imposed by the FDIC for operating the bank. Notably, PE
acquirers were required to maintain a tier 1 common equity to total assets ratio of at least 10 percent
for at least three years after the time of acquisition. They also had to maintain continuity of
ownership for at least three years after the time of acquisition, absent FDIC approval. Further, they
were not permitted to engage in any credit transactions with affiliates, meaning that they could not
8use the bank as a platform to lend to their affiliated companies or investments. 7 Additional PE
requirements included: pledges of cross-support if investors own 80 percent or more of two or
more banks; no ownership by entities in bank secrecy jurisdictions; no opaque ownership
structures; no investors having 10 percent or more equity in the same bank before failure; and
required disclosure about investors and ownership to the FDIC. 8
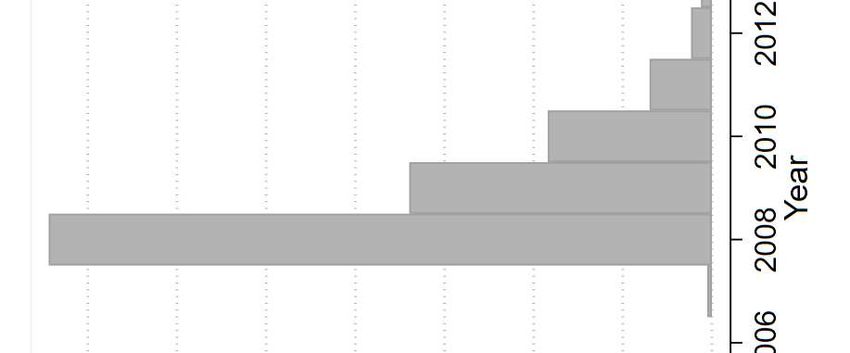
[Insert Figure 3]
As shown in Figure 3, PE investors acquired about 8.5 percent of the banks in 2009 (11 out
of 129). That number is larger in money terms, with PE investors acquiring 25.2 percent of the
total failed bank assets that were acquired in the resolution process in that year. 9 PE investors
remained active in acquiring failed banks through 2014, and through all those years, they acquired
13 percent of all failed banks acquired, or 24 percent in terms of assets acquired in resolution.
After 2014, PE investors stopped acquiring failed banks. This might be due to two reasons. First,
bank failures returned to pre-crisis levels (below 10 every year in number), leaving limited room
for PE investors to pursue these investments. Second, PE funds formed during the crisis to pursue
the strategy of failed bank acquisitions reached the latter part of their typical 10- to 14-year life
cycle, and thus started to focus more on operations and exit. Our main analytical sample covers
the period of 2009–2014. 10
3. Data and Sample Overview
3.1 Banking Data
3.1.1 Failed Bank Data
Between 2009 and 2014, there were a total of 482 bank failures resolved by the FDIC. Private
equity acquirers purchased 62 of these failed banks, while existing banks purchased 393 failed
7
This explicitly prohibits lending to affiliates in which the PE firm has invested equity, ruling out the kind of
cross-selling behavior documented in Fang, Ivashina, and Lerner (2013).
8
For more details, see the Final Statement of Policy on Qualifications for Failed Bank Acquisitions, Federal
Register, Vol. 74, No. 169, September 2, 2009.
9
We removed liquidated banks in this analysis. Also, because the FDIC often retains a sizable portion of failed
bank assets not purchased by the acquirer, the total assets acquired do not necessarily match to the total assets of the
failed banks (as in Figure 1).
10
It is worth noting that it is uncommon for troubled banks close to failure to restructure (e.g., be acquired by a
healthy bank) outside of the FDIC resolution process. We do not find that PE investors participate in acquisitions of
troubled banks outside of the FDIC resolution process.
9banks. 11 There were 25 failed banks with no least cost bid that were liquidated by the FDIC;
another two provided correspondent banking services to client banks only and were temporarily
run by the FDIC as bridge banks after failure. We exclude these 27 banks from our analysis
following Granja et al. (2017). Details on bank failures and their resolutions come from the FDIC.
These include public information conveying the timing of failure and acquisition, the location and
size of the institution at failure, the amount of assets passed to the acquirer, and the terms of the
failed bank transaction (transaction type, loss share coverage, and so on). We also have proprietary
FDIC information on the identity of the acquirer and on all the bidders and details of their bids.
Additionally, we utilize proprietary FDIC cost estimates used in evaluating failed bank bids.
This includes the FDIC’s estimated liquidation cost for the failed bank and the valuation of the
winning and cover bids from the internal least cost analysis. We use these estimations to identify
close bids of the same failed bank, which are useful for creating a quasi-random empirical design
to isolate the effect of PE intervention. These data are also useful for making back-of-the envelope
calculations of the difference in cost savings had PE investors been excluded from the auction
process.
Finally, we use confidential FDIC data containing details on loan performance in loss share
portfolios. Loss share participants are required to submit regular reports to the FDIC on the
performance of loans covered by shared loss agreements and details on any losses incurred.
Because acquired banks are typically absorbed into healthy existing banks, it is difficult to track
the performance of failed bank assets once they have been acquired. However, the loss share
performance data allow us to observe the performance of those assets over time, even after
acquisition. This provides us with a unique and important window into the management of failed
bank assets by PE and bank acquirers.
3.1.2 Bank Characteristics
We obtain data on the operational financial characteristics of failed banks and their acquirers
from the FDIC’s quarterly Consolidated Reports of Condition and Income (Call Reports) and from
Thrift Financial Reports for institutions regulated by the Office of Thrift Supervision (OTS) prior
11
One bank was split between two acquirers but was technically a single failed bank.
10to 2012. These reports contain details of the income and balance sheet characteristics for all the
banks in our sample.
The Summary of Deposits (SOD) database provided by the FDIC allows us to obtain bank
branch location data for each commercial and savings bank and the level of deposits. The SOD
database contains information on the geographical coordinates, address, and deposits of each
branch of every commercial and savings bank operating in the United States. We also complement
this data using the FDIC’s Reports of Structure Changes. These reports provide information on
branch office openings and closings. Together, we use these sources to analyze the closing of failed
bank branches, and to track changes in deposits at the county level within the footprint of the failed
bank.
This geographic information on bank branches also allows us to capture the characteristics of
the neighboring banks of each failed institution. Granja, Matvos, and Seru (2017) show that
neighboring banks’ financial health is an important determinant of the failed bank resolution
process. Consistent with their paper, we define local banks as banks whose branch network
overlaps in at least one zip code with the branch network of the focal failed bank.
3.2 Private Equity Data
Our classification of PE acquisitions comes from the charter used to bid on failed banks—
namely, acquisitions that were made by non-bank bidders that obtained a shelf or inflatable charter
for the purpose of failed bank bidding. While most of the funds raised by those non-bank acquirers
are from PE firms, they sometimes include non-PE sources such as asset management companies,
institutional investors, and family offices. However, private equity firms are the key participant in
this process. For example, based upon information in SEC registration statements and FDIC
depository insurance applications, we estimate that PE sources account for more than 70 percent
of the ownership for each consortium on average, based upon major consortia participants
identified with five percent holdings or more. Additionally, the vast majority of acquisitions
conducted by those private investor consortia were led by private equity firms. 12 In the Online
Appendix, we show alternative definitions of PE-acquired banks based on the level of PE
12
A few exceptions include two small failed banks in our sample that were single acquisitions primarily acquired
through family offices and a community development bank largely acquired by institutional investors. We group these
failures with PE acquisitions rather than those acquired by banks because non-bank investors made the acquisitions
through the same shelf charter process used by PE. All analysis results are similar if we do not include those cases.
11ownership (e.g., PE shares being larger than or equal to 75 percent), and our results are not affected
by the definitions.
We collect additional information about those individual PE funds from several different
sources. First, we hand match those PE funds with information from Preqin. Preqin collects the
quarterly aggregated investments, distributions, and net asset values (NAVs) of PE funds as
recorded by U.S. pension funds and obtained via routine Freedom of Information Act requests.
For funds covered by the Preqin data, we collect information on the size of the fund, the vintage
year, and the background of the PE firm. We also supplement this by searching additional
information from PitchBook, Crunchbase, and a general internet search.
3.3 Real Economic Effects
To obtain local employment and startup creation information, we use data from the U.S.
Census age and by
county. The QWI is derived from the Longitudinal Employer-Household Dynamics (LEHD)
program at the Census Bureau. It provides total employment in the private sector in each county
and employment tabulated for different Income data at the county level comes
from the Internal Revenue Service (IRS) Statistics of Income and is measured in calendar years
(i.e., January to December of each year).
For local access to small business credit, we use the small business lending data obtained from
the Small Business Administration (SBA). We use contract-level information on 7(a) loans, one
of the largest SBA programs, delivered through various methods (Certified Lenders Program,
Preferred Lenders Program, SBA Express, etc.). We focus on both the quantity and pricing of SBA
loans made in each region-year.
3.4 Summary Statistics
Table 1 provides summary statistics from the PE side. In the upper panel, we provide statistics
at the consortium level, which is the relevant unit for failed bank purchases. As described above,
typically multiple PE funds join forces to form a consortium and obtain a bank charter at the
consortium level. On average, each bank acquisition consortium consists of around 3.4 PE
investors, counting only those having shares of five percent or more. They, on average, bid on 5.2
12failed banks, 13 and “win” 3.26 of them. Their bidding strategies are quite focused, and most of
these consortia purchase banks within one state. Interestingly, 58 percent of the PE consortia
include at least one PE firm that has actively participated in the distressed investment space as
identified in Hotchkiss, Smith, and Strömberg (2011) and Jiang, Li, Wang (2012), suggesting that
these PE firms have some experience in distressed investments and turnarounds.
[Insert Table 1 Here.]
In the bottom panel, we provide summary statistics at the individual PE level, conditioning on
data availability from Preqin. On average, each PE firm joins 1.13 consortia. In other words, only
around 10 PE firms joined more than one consortium. In some cases, multiple funds in the same
PE firm joined the same consortium. Those PE investors are traditional independent PE investors
and are not affiliated with other banks. Importantly, most of the investing funds are of recent
vintages. The median fund vintage is 2007, and more than 25 percent of the PE funds are formed
in or after 2009. This suggests that those funds were likely raised for the purpose of participating
in failed bank resolutions, and that they had relatively adequate funding for such actions. Most of
these funds are not first-time funds, so they have accumulated networks and human capital from
prior activity in the PE markets.
[Insert Table 2 Here.]
Table 2 reports summary statistics of failed banks as of the last quarter prior to failure. Most
failed banks in the crisis were small community banks. The median bank size was just above $200
million, but with a very long right tail in the size distribution. Unsurprisingly for banks that failed,
the tier 1 risk-based capital ratios just prior to failure were very low—far below the average for
other neighboring banks that did not fail. Liquid assets were just under 17 percent of total assets
on average, and core deposits comprised almost 84 percent of total deposits. These banks tended
to be heavily involved in CRE lending, making up almost 39 percent of the total loans on their
balance sheets. They also held a large amount of C&D loans, comprising almost 19 percent of their
total loans on average. The ratio of C&I loans to total loans was smaller at 10 percent, and the ratio
of consumer loans to total loans was just over 2 percent. Residential lending averaged 25.9 percent
of total loans. In addition, both the noncurrent loans to total loans and the OREO assets to total
13
These are PE bids above the liquidation value. The average is only slightly higher at 5.7 when also including
PE bids below the liquidation value.
13assets at the failed banks were much higher than at other neighboring banks, indicating portfolios
in distress. Two-thirds of the banks were resolved using loss sharing agreements with the FDIC.
4. Private Equity in Failed Bank Resolution
We first investigate which segment of the failed bank market was targeted by PE investors,
and which was targeted by banks. The result of this analysis would indicate whether PE investors
are complementary failed bank buyers to incumbent banks.
4.1 PE-Acquired and Bank-Acquired Failed Banks
We start by performing the analysis using a logit regression framework:
( = 1) = ( + + + + ). (1)
The analysis uses the cross-sectional sample of all failed banks that were eventually acquired by a
bank or a PE investor. The dependent variable is a dummy that takes a value of one if the failed
bank was eventually acquired by PE, and zero otherwise (acquired by a bank). We control for the
size of the bank using the logarithm of the total assets at failure. Year-quarter fixed effects are
included to account for the time-varying economic, market, and regulatory environments that
could affect the failed bank resolution process.
[Insert Table 3 Here.]
Table 3 Panel A presents the results, reporting marginal effects calculated at the sample mean.
Column (1) concerns the tier 1 risk-based capital ratio. Tier 1 capital includes the most loss-
absorbing forms of capital, and therefore is an important representation of bank financial strength.
The marginal effect of -0.013 suggests that, for a one standard deviation decrease in the tier 1 risk-
based capital ratio, there is a 3.5 percentage point increase in the probability that the bank is
purchased by PE. This is a 25.8 percent increase from the base rate of 13.6 percent. Bank size
positively and significantly correlates with the probability that the bank is acquired by PE,
indicating that PE investors may have had an advantage over existing banks in raising larger
amounts of capital for these purchases.
In column (2) we switch to another measure of the stability of banks’ sources of funding,
namely the core deposits to total deposits ratio. Core deposits are made in a bank’s natural
14demographic market and offer advantages to banks, such as predictable costs, low sensitivity to
short-term interest rate changes, and lower run risks. The core deposits to total deposits ratio is
negatively associated with PE acquisition. For a one standard deviation decrease in core deposits
to total deposits, the coefficient of -0.220 translates to a 23.4 percent increase from the base rate
of PE acquisition.
Column (3) shows that low-profitability failed banks are more likely to be acquired by PE
investors. We use the net interest margin, which measures how much a bank earns in interest
compared to how much it pays out as a ratio of interest-earning assets, as an indicator of bank
profitability. This helps to mitigate the potential measurement noise for failing banks in other
possible profitability measures like ROA or ROE. For example, interest-earning assets should be
less wildly variable than total assets used in ROA calculations in the face of large, discrete charge-
offs in nonperforming assets; it is also not uncommon for average equity to reach negative values
in banks that are failing, in which case ROE is not reported. In addition, the net interest income
should be less variable than the total net income used for calculating ROA and ROE, due to the
provisioning behavior for loan and lease losses (which are treated as an expense to net income on
the bank’s income statement) at failing banks.
Columns (4) and (5) examine the loan composition of banks. Banks with riskier asset
portfolios—captured by a higher proportion of C&D loans and OREO assets to total assets—were
more likely to be acquired by PE investors. C&D loans can be more sensitive to economic or
market conditions than other loan types for several reasons. For example, projects may experience
budget overruns or a lack of timely progress, market conditions can change drastically in the
intervening time between loan approval and project completion, and lenders may have greater
difficulties extracting collateral value from an incomplete construction project in default. In the
crisis, C&D loans turned out to be particularly problematic. As the FDIC describes in its history
of the crisis (FDIC, 2017), “Most banks that failed or became problem banks did so because of
large concentrations, relative to their capital, of poorly underwritten and administered commercial
real estate loans and (especially) ADC [acquisition, development & construction] loans” (p.179).
Similarly, a higher proportion of OREO assets is often a sign of a loan portfolio in distress.
Overall, Panel A suggests that PE investors capture a set of banks that tend to be riskier in
terms of asset composition, more undercapitalized, less profitable, and may require larger capital
15injections due to their size. Moreover, these banks have lower profitability as indicated by their
net interest margin. Those are all likely undesirable features in the eyes of incumbent banks. In
this sense, PE investors target banks that other banks may be less willing or less able to take over.
4.2 Local Banking Market Conditions
Next, we further strengthen the argument that PE investors acquire a segment of banks that
are unlikely to be taken over and operated by other incumbent banks. In recent work studying
failed bank resolution in the crisis, Granja, Matvos, and Seru (2017) show that healthier banks are
more willing to bid on and pay higher amounts for failed banks that could potentially create
synergies with themselves. A primary source of synergistic benefit is in the form of geographic
clustering: a large literature shows that the transmission of soft information depreciates with
geographic distance (Petersen and Rajan, 2002; Stein, 2002). Moreover, geographically closer
banks may be better able to harvest the economies of scale to achieve operational efficiencies. The
implication of this work is that failed banks without a set of healthier banks in nearby geographic
regions face greater challenges in the resolution process. This is particularly true when, as shown
in Table 3, Panel A, certain failed banks had worse-than-average performance and held riskier
asset portfolios that other banks may not have desired.
Is PE participation particularly important for those banks without a potential bank acquirer?
We explore this question in a similar setting as in Eq. (1), except that the key explanatory variables
are the conditions of the local banks. We create a set of measures to capture different dimensions
of local bank conditions, in which “local” are those banks whose branch network overlaps in at
least one zip code with the branch network of the focal failed bank.
Table 3, Panel B presents the results. In column (1), we focus on the neighboring banks’ tier
1 risk-based capital ratio, which is calculated as the mean of this ratio for all the banks local to the
failed banks. We find a negative and significant coefficient, which means that when a failed bank’s
neighboring banks, which are often considered the most likely acquirers, are in worse financial
health, the failed bank is more likely to be acquired by private equity. The economic magnitude is
in fact quite large. A one standard deviation decrease in the average neighboring bank tier 1 risk-
based capital ratio is associated with a 2.92 percentage point increase in PE acquisition probability,
which is a 21 percent increase from the base rate. This is consistent using other bank health
measures like noncurrent loans (column (2)) and OREO (column (3)).
16In column (4), we consider another factor that could affect the capability of acquisition by
local banks—the size of these banks. Even if a neighboring bank remains healthy, it is unlikely for
it to obtain enough capital to purchase anything that is at its size or larger than its size. In other
words, banks that are considerably larger than the failed bank may be more likely to make the
purchase. We show this using a variable No. of Local Banks (>3xSize), which is the number of
local banks that are at least three times the size of the failed bank in terms of total assets. The larger
this number is, the more likely that the bank will be sold to another bank and less likely to a PE
acquirer.
In column (5), we examine the number of failed banks in the region. If a failed bank is in a
region where a lot of other banks failed at the same time, they are more likely to be acquired by
PE. This could be due to other local banks being on average less healthy and less capable of making
the purchase and also because it is hard for any acquirer to purchase a large number of banks if too
many fail in the same region. We show that the total number of failed banks in a state is associated
with a higher probability that the bank is acquired by PE. In other words, PE investors inject new
capital in regions where banks on average are in deeper distress. In the Online Appendix, we show
that both the failed banks’ own characteristics and their neighboring banks’ characteristics matter
when they enter the analysis simultaneously.
Overall, this evidence provides additional support that PE investors are complementary to
existing players in the banking sector in acquiring failed banks. PE investors target a segment of
the failed banks in which many traditional banks are unlikely to be interested or capable of
acquiring. Specifically, they acquire underperforming banks that are riskier, particularly when the
failed bank is in a region where neighboring banks experience deeper distress and thus are unlikely
to be able bid.
4.3 Further Evidence on Failed Bank Acquirer Sorting and Matching
Results so far are based on the final bidding outcomes. But is there evidence that PE investors
are actively pursuing this strategy, or are PE investors just passively bidding on all banks and only
winning the low-quality ones?
Table 4 presents evidence that is consistent with the PE investors actively pursuing such a
strategy. We gather this evidence by examining not only the winning PE acquisitions, but also the
bidding histories of each PE. To do so, we leverage proprietary data on all bidding histories in
17FDIC failed bank auctions. We create a variable, PE Bid, which indicates whether there was any
PE bidding on the specific failed bank, whether it achieved the winning bid or not. The indicator
captures PE bids that are above the liquidation value and non-public details on those that fall below,
so it reflects all bidding activity by PE acquirers. This PE Bid variable is then analyzed as the
dependent variable by using the same framework as in Eq. (1).
[Insert Table 4 Here.]
All the variables that are associated with the final acquisition outcomes, as shown in Table 3,
also have similar effects in explaining the bidding activities of PE investors. Clearly, both the
decision to bid and the outcome of winning are equilibrium outcomes accounting for the value and
costs of the failed banks to different potential buyers and to the FDIC. Nevertheless, the evidence
quite clearly suggests that PE investors actively, not passively, participate in the process.
In Figure 4, we push the argument further by visualizing the sorting and matching between
acquirer types and bank characteristics. The graph compares the characteristics of failed banks and
their neighboring banks across banks that are targeted by different acquirers—those bid on and
acquired by PE investors, those bid on by PE investors but may eventually be won by a PE entity
or an incumbent bank, and those that are only bid on and eventually acquired by other incumbent
banks. For each of the characteristics, we separately show the mean across the three groups.
[Insert Figure 4 Here.]
Figure 4 shows a clear pattern of sorting. Panel A shows sorting on failed bank characteristics.
PE investors bid on and successfully acquire the weakest banks (left bars) whether measured by
tier 1 capital ratio, core deposits, net interest margin, or real estate owned. PE investors also target
some slightly stronger failed banks over which they compete with other banks, and they may win
or lose in such cases (middle bars). Banks, on the other hand, on average focus on the healthier
banks in the failed bank set (right bars)—and PE investors are not even bidding in this segment.
Panel B shows sorting on neighboring bank characteristics. Again, both PE bids and PE
acquisitions are more likely when the neighboring banks are weak (whether measured by tier 1
capital ratios, nonperforming loans, real estate owned, or the number of failed banks in the state).
This again confirms that PE investors complement bank acquirers in the market. This result also
suggests that even though neighboring banks are likely the best potential buyers for failed banks
operation-wise, they may be hesitant to bid and/or purchase when the bank is particularly risky or
18in deeper distress. PE investors have an edge in such cases due to their higher risk appetite and
more abundant funding.
4.4 The Value of PE Participation: A World Without PE Bidding?
Evidence so far suggests that the value of PE investors in the financial crisis first comes from
their participation and their unique focus in the failed bank market which is complementary to
incumbent banks. In a world without PE investors selecting those lower-quality and riskier failed
banks, they would either be acquired through lower-valued bids or be liquidated by the FDIC.
How economically important is this PE participation? We perform a simple back-of-the-
envelope calculation using proprietary FDIC cost estimates used for evaluating auction bids from
all failed bank deals. The FDIC estimates its cost for each submitted bid in determining the least
cost resolution strategy. Starting with the total gross assets at the failed bank and taking details of
each submitted bid into account, it subtracts the expected losses on assets and expected expenses
from the receivership, as well as any claims on the receivership. The bidder’s proposed premium
on deposits or discount on assets are included as well. We use these proprietary estimates in our
calculation to build on the counter-factual world in which no PE acquisitions occurred.
For all PE-acquired cases, we suppose one of the following two cases happen: (1) if there is
at least one non-PE bidder, the best non-PE bidder wins, where the “best” means the lowest FDIC-
estimated cost of resolution; (2) if there is no other non-PE bidder, the bank is liquidated by the
FDIC, which as receiver must pay off insured depositors and dispose of the assets. The additional
cost incurred to the FDIC without PE-acquirer participation thus can be roughly estimated by
calculating the gap for PE acquirers and the counter-factual world outcomes. For case (1), there
are 29 failed banks for which we calculate the difference in estimated FDIC resolution costs for
the winning bid compared to the runner-up. In addition, we observe 8 further cases in which the
runner-up bid in a PE acquisition was also from a PE bidder. For these, we measure the gap in cost
between the winning bid and the next best non-PE bid. The aggregate savings are estimated to be
around $2.34 billion. For case (2), we observe 25 failed banks that had no other non-PE bids with
a cost below the liquidation cost and would have had to be liquidated by the FDIC. The total
savings to the FDIC of those PE acquisitions over liquidation costs is estimated to be $1.29 billion.
How big is the economic magnitude of the $3.63 billion ($2.34 billion + $1.29 million)
estimated? The FDIC estimated that the total cost to the Deposit Insurance Fund (DIF) of bank
19failures during the crisis was about $73 billion. 14 This means that PE participation helped the FDIC
reduce the cost of failed bank resolution in the crisis by nearly five percent.
One caveat here is that in this simple back-of-the-envelope calculation, we implicitly assume
that bank bidding behaviors remain the same in a world without PE. Given that the failed bank
bidding process is a sealed-bid auction without even disclosing the potential bidders, removing PE
investors from the bidder set should, arguably, have at best a mild impact. Additionally, this
assumption likely leads us to underestimate the benefit of PE participation—without PE
competition, banks will likely bid with even lower prices, expanding the wedge with PE bidding
prices.
5. Bank Performance Post PE Acquisition
The natural next question is: are PE investors able to successfully turn around the failed banks?
In this section, we examine the post-acquisition performance of failed banks that are acquired by
PE and by other banks. We also study the real effects by examining the economic recovery of
regions in which the failed banks are acquired by PE investors. The performance of PE acquisitions
compared to bank acquisitions is a priori unclear. On the one hand, PE investors do not have bank-
specific operational experience or sources of synergies, which may lead to poorer performance.
On the other hand, PE investors’ experience in distressed investment and turnaround operations
(Hotchkiss, Smith, and Strömberg, 2011), together with the steadier financing source (Bernstein,
Lerner, and Mezzanotti, 2019), may be well-suited for the turnaround of failed banks in crisis.
5.1 Quasi-Random Empirical Design
To study failed banks’ performance changes post acquisition by different buyers, a basic
regression would simply compare the performance proxies in PE-acquired and bank-acquired
banks post the acquisition event. This specification would be informative but masks the
combination of i) the sorting of acquirer-target, as documented in the previous section, and ii) the
treatment effect of PE acquisitions on the acquired banks.
14
Federal Deposit Insurance Corporation (FDIC). 2017. Crisis and Response: An FDIC History, 2008–2013.
Washington, DC: FDIC. p.xiii-xiv.
20An ideal experiment to isolate the effect of PE investors on post-acquisition performance
would focus on a set of banks that are of interest to both PE investors and banks and for which the
allocation to a PE investor or a bank is nearly random. We approximate this ideal experiment by
exploiting a small set of banks where acquirer allocation can be viewed as quasi-random. We start
from the sample of banks that were bid on by both PE investors and banks. We narrow down this
sample to two sets of banks—those won by PE and at least one bank bid, and those won by a bank
and at least one PE bid. We further require that in the auction the margin of victory of the winning
PE/bank bidder over the closest losing bank/PE bid is small, within five percent to be precise. 15
Our empirical strategy compares failed banks that were just won by the PE investors and those that
were just won by the banks in this quasi-random sample.
In our main specification, we use a local linear regression approach (Gelman and Imbens, 2019):
,, , = + + + × + . (2)
is the performance of a branch , located in region , of bank , that failed in year
. is an indicator variable that equals one if the PE bidder won the auction and acquired the
failed bank. × are region-by-time fixed effects controlling for the local time trends and are
captured at the state-failed year level. Finer regional geographic delineation, say county-year,
renders a very limited number of observations per group (on average 2.3 in each county-year unit),
challenging the ability to correctly estimate the model. The analysis will later be adapted to other
analytical units (like bank-level or region-level) by implementing the same logic, and aggregation
details will be provided in subsections as we introduce the analysis.
[Insert Table 5 Here.]
The key identification assumption is that, for the specific subset of competitive auctions that
we consider, whether a PE bidder wins or loses the bidding is “as good as” random. At first glance,
out of the 48 acquisition deals that fall into our quasi-random sample, 25 were eventually acquired
by a PE investor and 23 were eventually acquired by a bank—which suggests a fairly random
pattern. Table 5 presents a balance test. We first examine whether bank-level characteristics differ
between the bank-acquired and the PE-acquired samples. Among those characteristics shown to
15
This approach is standard in the literature (Lee and Lemieux, 2010; Fisman et al., 2014; Colonnelli, Prem, and Teso,
2020).
21You can also read