WP/20/241 - International Monetary Fund
←
→
Page content transcription
If your browser does not render page correctly, please read the page content below
WP/20/241

                    Fintech in Europe: Promises and Threats

                   by Chikako Baba, Cristina Batog, Enrique Flores, Borja Gracia,
                                 Izabela Karpowicz, Piotr Kopyrski, James Roaf,
                               Anna Shabunina, Rachel van Elkan, Xin Cindy Xu

IMF Working Papers describe research in progress by the author(s) and are published
to elicit comments and to encourage debate. The views expressed in IMF Working Papers
are those of the author(s) and do not necessarily represent the views of the IMF, its
Executive Board, or IMF management.
© 2020 International Monetary Fund 2 WP/20/241
IMF Working Paper
European Department
Fintech in Europe: Promises and Threats
Prepared by Chikako Baba, Cristina Batog, Enrique Flores, Borja Gracia, Izabela
Karpowicz, Piotr Kopyrski, James Roaf, Anna Shabunina, Rachel van Elkan, Xin
Cindy Xu
Authorized for distribution by Jörg Decressin
November 2020
IMF Working Papers describe research in progress by the author(s) and are published to
elicit comments and to encourage debate. The views expressed in IMF Working Papers are
those of the author(s) and do not necessarily represent the views of the IMF, its Executive Board,
or IMF management.
Abstract
Europe’s high pre-existing level of financial development can partly account for the
relatively smaller reach of fintech payment and lending activities compared to some other
regions. But fintech activity is growing rapidly. Digital payment schemes are expanding
within countries, although cross-border and pan-euro area instruments are not yet
widespread, notwithstanding important enabling EU level regulation and the establishment of
instant payments by the ECB. Automated lending models are developing but remain limited
mainly to unsecured consumer lending. While start-ups are pursuing platform-based
approaches under minimal regulation, there is a clear trend for fintech companies to acquire
balance sheets and, relatedly, banking licenses as they expand. Meanwhile, competition is
pushing many traditional banks to adopt fintech instruments, either in-house or by
acquisition, thereby causing them to increasingly resemble balanced sheet-based fintech
companies. These developments could improve the efficiency and reach of financial
intermediation while also adding to profitability pressures for some banks. Although the
COVID-19 pandemic could call into question the viability of platform-based lending fintechs
funding models given that investors could face much higher delinquencies, it may also offer
growth opportunities to those fintechs that are positioned to take advantage of the ongoing
structural shift in demand toward virtual finance.
JEL Classification Numbers: G20, G21, G23, G28, E42, O30
Keywords: Fintech, lending, payment system, European Union, Payments Directive, PSD2
Author’s E-Mail Address: JRoaf@imf.org3
Contents Page
A. Traditional Card Scheme…………………………………………………………………12
B. Fintech Payment Innovations……………………………………………………………..15
C. Payment Regulations……………………………………………………………………...16
A. Business Models in Fintech Lending……………………………………………………..19
B. Lending Regulation……………………………………………………………………….24
BOXES
1. From Cash to Cards: The Case of the Netherlands…………………………………………8
2. Instant Payments in Europe……………………………………………………………….14
3. Fintech Payments in Poland: The Experience of BLIK…………………………………...16
4. Mintos-A P2P Lending Platform………………………………………………………….23
FIGURES
1. Global Outlook on Financial Development………………………………………………...4
2. Fintech-Enabling Environment……………………………………………………………..6
3. Financial Ecosystem Enabling Fintech……………………………………………………10
TABLES
1. Top 10 Fintech Companies in the World Based on Total Funding……………………….11
2. Fintech Lending Models…………………………………………………………………..22
3. National Laws and Regulations for Crowdfunding or Peer-to-Peer Lending……………..33
4. Selected Features of Dedicated Fintech Credit Policy Framework……………………….33
ANNEXES
I. Interchange Fee Regulation: EU vs US……………………………………………………31
II. Security Requirements Under PSD II…………………………………………………….32
III. National Regulation for Crowdfunding and Selected Features of Dedicated Fintech Credit
Policy Frameworks…………………………………………………………………………..33
References……………………………………………………………………………………344
OVERVIEW
1. What aspects of fintech does this paper cover? While there are numerous
definitions of fintech, the IMF/World Bank Bali Fintech Agenda defines it as advances in
technology that have the potential to transform the provision of financial services spurring
new business models, applications, processes and products. 1 Thus fintech covers a broad
range of activities, including new areas such as crypto-currencies and the use of artificial
intelligence (AI) for fraud detection, as well as innovation in more traditional financial
services. This paper looks at fintech payment and lending activities, their regulation and their
potential impact on existing banks within the European context. Digital currencies and other
types of fintech activities, such as insurance and asset management, are not considered.
2. The emergence of fintech in Europe comes against a backdrop of already high
levels of financial development compared to other regions (Figure 1). The financial
development index, which ranks countries along several dimensions including depth, access
and efficiency of financial institutions and markets, shows that Europe is a global leader in
the development of both financial institutions and financial markets. 2 The average country in
Europe has a similar level of financial development as the best performers in Latin America
and the Middle East, while the least developed country in Europe is at par with the average
country in Africa. Similarly, the level of financial inclusion, measured by the availability of
automated teller machines and bank deposit accounts, is notably higher in Europe than
elsewhere.
Figure 1. Global Outlook on Financial Development
Europe leads other regions in financial development… …. with large gaps.
Financial Development Index by Region, 2018 Financial Development Index, 2018
(Index from 0 (lowest) to 1 (highest)) (Index from 0 (lowest) to 1 (highest))
1 1.0
Europe
Western Hemisphere
0.8 Asia and Pacific 0.8
Middle East and Central Asia
Africa
0.6 0.6 Europe Average
0.4 0.4
0.2 0.2
0 0.0
LTU
GBR
ESP
CYP
BGR
EST
FRA
NLD
IRL
HRV
HUN
ROU
SRB
BLR
LVA
UKR
AFR
POL
ITA
DNK
CZE
BIH
FIN
NOR
ISR
MLT
ISL
SVN
CHE
GRC
SVK
RUS
SWE
LUX
AUT
MDA
WHD
PRT
ALB
APD
DEU
MCD
TUR
BEL
Total Institutions Markets
Source: IMF Financial Development Index Database. Source: IMF Financial Development Index Database.
1
In this paper we also refer to “fintechs” as shorthand for companies that implement these solutions. For a
broader discussion of the definition of fintech see Schueffel (2016).
2
The index, developed by Sahay and others (2015), measures the development of financial institutions and
financial markets in terms of their depth (size and liquidity), access (ability of individuals and companies to
access financial services), and efficiency (ability of institutions to provide financial services at low cost and
with sustainable revenues and the level of activity of capital markets).5
The financial system is dominated by banks. Access to financial services is not a major concern.
Financial Inclusion Reasons for not Having a Financial Account, 2017
(Regional average) (Percent of population over 15 years old)
3000 100
Deposit accounts with commercial banks per 1,000 30
90
2500 adults (lhs)
80
Automated Teller Machines (ATMs) per 100,000 25
2000 70
adults (rhs)
60
20
1500 50
40
1000 15
30
500 20
10
10
0 0
5
2006
2010
2014
2018
2006
2010
2014
2018
2006
2010
2014
2018
2006
2010
2014
2018
2006
2010
2014
2018
0
Europe Middle East Asia-Pacific Western Africa
and Central Hemisphere Financial services are too Financial institutions are Lack of necessary
Asia expensive too far away documentation
Sources: IMF Financial Access Survey Database. Sources: Global Findex 2017, World Bank; and IMF Staff calculations.
Mobile money accounts are not widely used… ….and their transactions value is low.
Deposit and Mobile Money Accounts, 2018 Mobile Money Transactions, 2018
(Per 1,000 people, simple averages) (Percent of GDP, simple averages)
2500 30
Deposit accounts with commercial banks
Registered mobile money accounts 25
2000
20
1500
15
1000
10
500 5
0 0
Europe Western Asia and Middle East Africa Europe Western Middle East Asia and Africa
Hemisphere Pacific and Central Hemisphere and Central Pacific
Asia Asia
Sources: IMF Financial Access Survey; and IMF Staff calculations. Sources: IMF Financial Access Survey; and IMF Staff calculations.
3. Overall, fintech activities are less developed in Europe than in other regions
(Figure 2). 3 Europe is among the least developed regions in terms of mobile money
penetration and significantly lags Asia-Pacific and North America in fintech lending. None of
the Big-tech companies, which currently dominate the global fintech landscape, originated in
Europe, and Bigtech lending lags far behind the global front-runners– even though Europe
leads in internet coverage. 4 Until the COVID-19 pandemic, new venture capital fintech
investments in Europe have been growing rapidly, but the gap with the frontier region of
North America remains very large.
3
As with all studies on fintech, availability of comprehensive and cross-country and region comparable data is a
severe constraint. No comprehensive source for fintech data is available reflecting numerous technical and legal
impediments to compilation. Data is fragmented and must be gathered from multiple providers. In Europe,
localization laws prevent granular dissemination, while official statistical data compilers do not collect or report
comprehensive information on fintech activities.
4
See Financial Stability Board (2019). China’s most successful fintechs are under the umbrella of BigTech
companies (JD, Alibaba, Tencent), in contrast to North America and Europe.6
Figure 2. Fintech-Enabling Environment
Fintech lending in Europe is less developed... …and Bigtech lending lags far behind global frontrunners.
Fintech Lending and Income per Capita, 2019 Bigtech Lending and Income per Capita, 2019
(USD, log scale) (USD, log scale)
100,000 100,000
UK USA Singapore UK France USA
Japan
China S. Korea
Income per capita (USD)
Income per capita (USD)
10,000 Malaysia China
10,000 Russia Mexico
S. Africa Thailand
Philippines
Morocco Indonesia
1,000 Côte d'Ivoire Vietnam
Egypt Myanmar India Brazil Ghana
Cambodia
Europe 1,000 Kenya
Nigeria
100 Western Hemisphere Zambia Uganda
Asia and Pacific Rwanda Tanzania
Pakistan
Middle East and Central Asia Argentina
Africa
10 100
0 1 10 100 1,000 10,000 100,000 0 10 100 1,000 1 10,000 100,000 1,000,000
Fintech lending (USD million) Bigtech lending (USD million)
Sources: G. Cornelli, J. Frost, L. Gambacorta, R. Rau, R. Wardrop and T. Ziegler Sources: G. Cornelli, J. Frost, L. Gambacorta, R. Rau, R. Wardrop and T. Ziegler
(2020), "Fintech and big tech credit: a new database"; and IMF WEO database. (2020), "Fintech and big tech credit: a new database"; and IMF WEO database.
Despite that, Europe leads the rest of the world in internet
….and is among the leaders in the global innovation index.
coverage…
Internet Users Top 20 Global Leaders in Innovation, 2020
(Percent of population) (Score: 0 (lowest) - 100 (highest))
90 70
80 Europe 60
50
70
40
60 Western Hemisphere
30
50 20
40 10
Asia-Pacific 0
30
South Korea
Austria
Finland
Hong Kong, China
Israel
Germany
China
Netherlands
United Kingdom
Ireland
France
Norway
Singapore
Canada
United States
Japan
Denmark
Luxembourg
Sweden
Switzerland
Middle East and
20
Central Asia
10 Africa
0
2000
2001
2002
2003
2004
2005
2006
2007
2008
2009
2010
2011
2012
2013
2014
2015
2016
2017
Source: The Global Innovation Index 2020: Who Will Finance Innovation?, Cornell
Sources: World Bank WDI database; and IMF Staff calculations. University, INSEAD, and WIPO (2020).
Digital payments in Europe are much higher than other
while new Fintech investment is also catching up.
regions.
Made or Recieved Digital Payments in 2017 Total Investment Activity in Fintech
(Percent of population aged 15+) (USD billions, includes VC, PE and M&A transactions)
80
Europe Western Hemisphere
70
60
Western Hemisphere
50
Europe
40
Asia-Pacific
30
Middle East and
20
Central Asia
Asia-Pacific
10
Africa 0
2013 2014 2015 2016 2017 2018 2019
0 20 40 60 80 100 Source: Pulse of Fintech H1'20, Global Analysis of Investment in Fintech, KPMG
Sources: Global Findex 2017, World Bank; and IMF Staff calculations. International.
4. The extensive network of formal financial service providers in Europe helps
account for the lower penetration of certain fintech services. In parts of the world where a
large share of the population is excluded from the formal financial sector, fintech services
such as mobile money accounts have proliferated, possibly reflecting lower infrastructure and7
transaction costs. But according to the IMF’s Financial Access Survey (FAS), less than
15 percent of surveyed participants in Europe cite either service costs or distance to financial
institutions as the main reasons for not having financial accounts, whereas in other regions, at
least 25 percent of respondents refer to one or both of these factors. Furthermore, the bank-
dominated financial system in Europe (with the exception of the UK) is not suited to
providing high-risk financing, unlike the capital market-dominated systems in the US, as
fintech companies rely mainly on venture capital and private equity funds for their funding.
Other factors bearing on the lower penetration of fintech in Europe include the heterogeneity
of regulation across jurisdictions and, in certain countries, a cultural or institutional
preference for cash. The latter factor is particularly strong in some advanced countries like
Germany, reflecting historical concerns about protecting personal data. However, it may also
be the case that privacy and anonymity are more-highly valued in Europe than elsewhere
(Morey, Forbath and Schoop, 2015), as reflected in the EU’s General Data Protection
Regulation (GDPR) 5. On the other hand, PSD II may foster fintech presence over time by
granting third-parties access to bank data (see discussion on regulatory issues below).
5. Europe accounts for about Number of Cashless Payment Transactions in Europe per
one third of global non-cash Capita, 2019
payment transactions. Advanced
economies in Europe account for the
Card payments
largest share of non-cash payment Direct debits
transactions, although adoption of Credit transfers
debit and credit cards is growing at a 302
E-money
faster pace in developing countries. Cheques
Within Europe, Northern countries
lead volume of non-cash transactions
per capita. The case of the
Netherlands illustrates how a Sources: ECB Statistical Data Warehouse.
centralized infrastructure,
coordinated stakeholders’ actions, and an extensive public information campaign over the
past decade can cause a rapid transition away from cash toward electronic (card) payments
(Box 1). Card payments remain dominant in cashless transactions, providing an opportunity
for fintech firms to partner with card companies on data security and anti-fraud efforts.
However, opportunities may be even greater for fintech firms to compete directly with card
payment companies in the areas of credit transfers and direct debit, both of which are
catching up to card payments. In fact, some developing countries—notably in Latin
America—are leapfrogging into in-app wallets and real-time payments, bypassing the more
traditional route of greater use of card transactions (World Payment Report 2018).
5
The GDPR is an EU regulation that protects personal data privacy by giving individuals control over
processing of data in financial transactions. The regulation applies to any enterprise processing data in the
European Economic Area regardless of its location. Other regions do not have such levels of data privacy
protection, enabling bigtechs to use consumer data for a range of purposes.8
Box 1. From Cash to Cards: The Case of the Netherlands 1/
Alongside several other northern European countries, the Netherlands is one of the most
“cashless” societies in the Euro Area. Cash usage by consumers at the point-of-sale (PoS) declined
from 85 percent of payments in 2002 to 45 percent in 2016 (Esselink and Hernandez, 2017). Debit
cards are now the most frequently used instrument of payment, having grown 9 per cent per year on
average since 2010. What have been the main drivers behind these developments?
Number of PoS Payment Transactions Value of POS Payments
(Unit billions) (Euro billions)
5.0 120
4.5 100
4.0 80
Debit card
3.5 60
Cash
3.0 40
2.5 20
2.0 0
2010 2011 2012 2013 2014 2015 2016 2017 2010 2011 2012 2013 2014 2015 2016 2017
Source: DNB and Dutch Payment Association, 2019.
In 1988, the Netherlands introduced a single national debit card scheme—the “PIN”—to
promote replacement of checks, the main alternative to cash at the time. The single PIN scheme
covered all card holders from all banks, to all retailers that accepted cards. This increased convenience
and reduced learning costs. To encourage card holders to use debit cards, issuing banks did not levy
transaction fees. The merchant transaction fees were relatively low (at 6–7 eurocents per transaction),
below the banks’ cost (McKinsey, 2006), and much less than the European average of around
2.5 percent of transaction value (European Commission, 2006).
Another important factor driving debit card usage Variable Social Cost: Cash and Debit Card Payments by
was increased cost transparency and awareness Transaction Amount
30
among banks, retailers and consumer 28
Debit in 2002
Debit in 2009
organizations. The Dutch retail payment system was 26 Cash in 2002
Social cost (Euro cent)
24 Cash in 2009
efficient, with relatively advanced automation for 22
processing retail payments. Nonetheless, the social 20
cost—the capital and labor used—of the commonly 18
16
used PoS payments was estimated at 0.65 percent of 14
GDP (Brits and Winder, 2005). Cash was found to be 12
10
more cost effective for purchases below 11.63 euros. 0 5 10 15 20
By 2009 the break-even point had dropped to Source: Jonker, (2013).
Transaction amount (Euro)
3.06 euros due to scale effects and technological
developments. Those studies made everyone realize that major cost savings could be achieved if
consumers were to use their debit card rather than cash more often. The Payment Covenant of 2005
(offering merchants a 1 eurocent discount on card payments) and the information campaign agreed
upon by banks and retail organizations provided a further push in favour of greater acceptance of debit
cards.
____________________________
1/
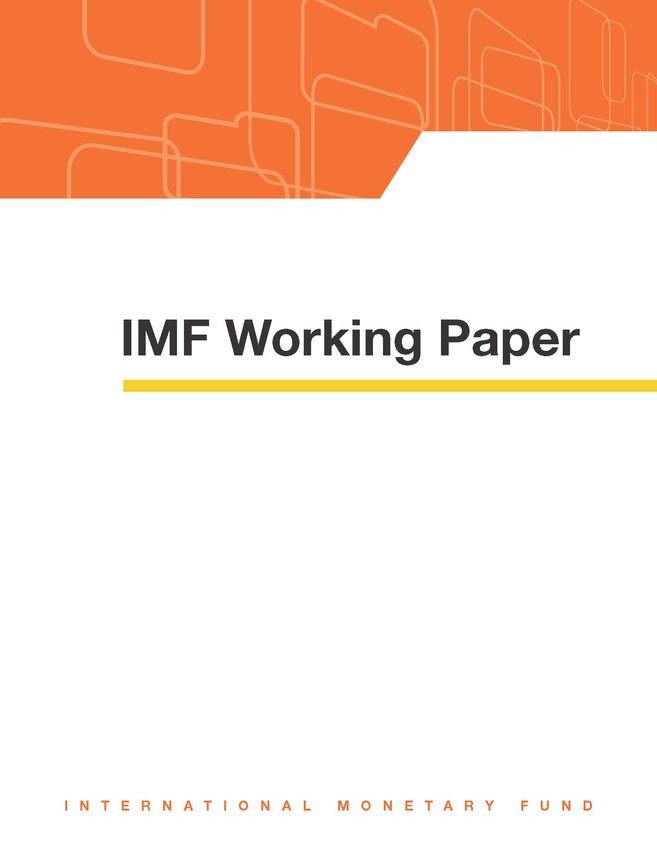
This box was prepared by Nicole Jonker and Wieger Kastelein from De Nederlandsche Bank.9 5. Europe lags other areas of the world in fintech lending (Figure 3). Europe’s share of global fintech lending is small at only 3 percent in 2017. However, a few countries dominate global fintech lending, with the UK accounting for about two-thirds of total volume in Europe, and China and the US supplying virtually all fintech lending in their respective regions. Excluding the activities of these dominant countries from their respective regions, fintech lending in Europe is larger than in Asia-Pacific and the Western Hemisphere. However, fintech’s share in the global lending landscape is still very small, accounting for less than 1 percent of total bank credit. 6. Fintech lending in Europe is growing fast, from a low base. Total transaction volume of online alternative finance platforms reached 10.4 billion euros in 2017, 20 times higher than in 2012. 6 In 2017, fintech lending in the UK grew by 25 percent and in the rest of Europe it grew at an even faster 43 percent. New equity investment in fintech by institutional investors is also growing fast, and the gap with frontier regions (China and the US) is shrinking. Additionally, the number and complexity of business models in fintech lending is increasing. 7. Cross-country variation in fintech lending is significant. A few major advanced economies dominate the market, with the UK taking the lion’s share, accounting for two- thirds of total volume in 2017, followed by France and Germany. However, in per capita terms, the UK still retains top ranking, followed—by a wide margin—by Estonia and Monaco in second and third place, respectively. 8. Europe’s infrastructure and innovative environment are conducive to further growth of fintech services. Europe leads the rest of the world in internet coverage, including electricity and internet coverage. It also has business environment that is supportive of innovation and technology development, with several European countries (e.g. Switzerland, Netherlands and the Nordic countries) leading the 2020 Global Innovation Index. Making good use of these favorable conditions could boost fintech prospects in Europe. 9. In some fintech segments, Europe is already catching up to the frontier. Although mobile money transfers are less popular in Europe, total digital payments (including both mobile and internet transfers) are high thanks to the widespread internet usage. 7 New equity investment in fintech from institutional investors (venture capital, private equity, and mergers and acquisitions) is growing fast, and the gap with Asia and the Americas is shrinking. 6 ”The 4th European Alternative Finance Industry Report,” Cambridge Center for Alternative Finance. This study gathers data from 269 alternative finance platforms across 45 countries in Europe. 7 Digital payments include the use of mobile money, debit or credit cards, or mobile phones to make a payment from an account, or the internet to pay bills or purchase online. They also include payments of bills, remittances, agricultural products, government transfers, wages, or public sector pension directly from or into a financial institution account or through a mobile money account (Findex, The World Bank).
10
Figure 3. Financial Ecosystem Enabling Fintech
Fintech lending volumes in Europe lag other regions… …due to large gaps among the biggest players.
Global Fintech Lending Market Volumes Global Fintech Lending Market Volumes
(Euro billions) (Euro billions)
4.0
Western Hemisphere,
320.9
350 Europe,
3.5 3.4 excluding the US 3.2
excluding the UK
300 Asia-Pacific
3.0
221.7
250
2.5
Asia-Pacific,
2.1
200 excluding China
2.0 1.8
150 Western Hemisphere 1.4
1.5
94.6
1.0 1.0
100 Europe 1.0
0.6 0.6
39.5
31.8
30.0
50 0.5 0.3 0.3
20.3
0.2
10.4
0.1 0.0 0.1
9.7
7.7
5.4
4.1
3.2
2.8
1.1
0 0.0
2013
2014
2015
2016
2017
2013
2014
2015
2016
2017
2013
2014
2015
2016
2017
2013
2014
2015
2016
2017
2013
2014
2015
2016
2017
2013
2014
2015
2016
2017
Source: Cambridge Center for Alternative Finance. Source: Cambridge Center for Alternative Finance.
The volume of Fintech lending remains small… …. compared with bank credit.
Global Bank Credit and Fintech Lending Bank Credit to Private Sector, 2019
(Percent of GDP) (Percent of GDP)
132 0.6
Bank Credit to Private Sector 250
130
Fintech Lending (RHS) 0.5 200
128
126 0.4 150
124
0.3 100
122
120 0.2 50
118
0.1 0
116 North East Asia World Europe European Middle Latin South Africa
America and and Union East and America Asia
114 0
Pacific Central North and
2013 2014 2015 2016 2017 Asia Africa Caribbean
Sources: World Bank WDI database; and Cambridge Center for Alternative "Middle East and North Africa" and "Africa" data as of 2018.
Finance. Source: World Bank WDI database.
Cross-country heterogeneity is large in absolute size …and in terms of per capita volume.
Alternative Finance Volume by Country, 2017 Market Volume Per Capita by Country, 2017
(Euro Millions) (Euro)
1000 120
900 United Kingdom: 7.06 billion
100
800
700 80
600
500 60
400
40
300
200 20
100
0 0
Italy
Austria
Belgium
Finland
Germany
Czech Republic
Estonia
Ireland
Netherlands
Spain
Norway
Latvia
France
Lithuania
Slovenia
Poland
Denmark
Liechtenstein
Sweden
Georgia
Switzerland
UK
Austria
Belgium
Bulgaria
Finland
Romania
Germany
Czech Republic
Netherlands
Spain
Ireland
Estonia
France
Norway
Portugal
Latvia
Lithuania
Slovenia
Slovakia
Poland
Russia
Sweden
Georgia
Switzerland
Denamark
UK
Italy
Source: The 4th European Alternative Finance Industry Report,Cambridge Center for Source: The 4th European Alternative Finance Industry Report,Cambridge Center
Alternative Finance, 2019. for Alternative Finance, 2019.
10. Bigtechs are also expanding in Europe. Bigtechs, the leading IT companies in the
world, have many competitive advantages in fintech services, including deep financial
pockets, a vast customer base with valuable associated data, advanced technological
capability and recognized branding. Most of the world’s leading fintech companies are often
associated with bigtech groups (Table 1). Alibaba, Baidu and Tencent have become dominant
operators in China’s digital payments industry, while Amazon is providing payment services
and loans to merchants on its platform. Although none of these bigtechs originated in Europe,11
they have already entered the European markets. Amazon (since 2010, Luxemburg),
Facebook (since 2016, Ireland), Google (since 2018, Lithuania), and Alipay (since 2018,
Luxembourg) are operating under both payment and electronic money licenses.
Table 1. Top 10 Fintech Companies in the World Based on Total Funding
Fintech company Country of Associated Bigtech
Incorporation Group
Ant Financial China Alibaba
JD Digits China JD
Du Xiaoman Financial China Baidu
One97 India Alibaba
QNB Group Qatar n.a.
Lu.com China n.a.
SoFi United States n.a.
Kabbage United States n.a.
Robinhood United States n.a.
Greensill Capital United Kingdom n.a.
Source: CrunchBase, as of September 11, 2020.
Note: Ranking based on amount of funding raised.
11. The COVID-19 pandemic and ensuing behavioral changes pose challenges and
opportunities for the fintech sector. The pandemic has rapidly accelerated the structural
shift toward fully digital solutions, thereby boosting demand for virtual financial services.
Social distancing means more goods are being purchased on-line paid for with digital
payment instruments. Demand for digital lending services has been boosted by pandemic-
induced liquidity pressures among firms and households and the widespread use of
government guaranteed lending programs. Fintechs operating in the payment area may be
well placed to take advantage of these changes as consumer habits rotate away from cash and
brick-and-mortar PoS. At the same time, platform-based fintech companies that rely on
secondary markets to fund their lending and which do not have direct access to central bank
liquidity lines may face pressures, especially if risk aversion and delinquencies were to
increase. On the other hand, however, increased risk aversion by traditional banks could open
more space for fintechs to boost small- and micro-enterprise lending. On balance, fintech
business models are better suited to meet the new requirements of social distancing and
remote work, giving an important advantage to those financial intermediaries with good ICT
infrastructure and a higher share of IT-skilled employees.12
PAYMENTS
12. Fintech companies can impact the payment services market through innovations
that reduce costs, enhance the customer experience and increase competition. Fintech
companies are developing tools to reduce costs and increase convenience of payments. To
detect and prevent fraudulent transactions, customers’ payment data is analyzed using
artificial intelligence, biometrics are used to improve authentication and enhance
convenience, and the security of payment communications is enhanced through tokenization.
Fintechs are also using payment data to identify cross-selling opportunities. The ease of
scalability of some of these solutions also generates incentives to integrate domestic and
cross-border payments services. The entrance of new players creates more competition,
challenging banks’ dominance in payments—including their traditional card schemes—
which are also moving towards adopting fintech solutions.
A. Traditional Card Schemes
13. Traditional card payment transactions require multiple participants and steps.
They involve the separate exchange of information—the payment authorization and
approval—and payment, across several actors.
• The participants: key actors
in card transactions are the
consumer, the merchant, the
“acquirer bank” (the
merchant’s bank), the “issuer
bank” (the consumer’s bank,
which issues the card) and
the payment card network. It
is important to notice that this
is a two-sided market with
network externalities. The
consumers want cards that
are accepted by the merchants they patronize, while merchants want to accept cards
that are widely hold by their customers. 8
• The data exchange: a typical transaction starts with the consumer providing the
payment authorization data (PAD) to the merchant. This could be a PoS transaction or
a remote one via the internet or telephone. The merchant submits the PAD to the
merchant’s bank, which passes it to the card network, which in turn routes it to the
customer’s bank. The customer’s bank gives the authorization which works its way
8
For a discussion of two-sided markets see Rochet and Tirole (2003).13
back to the merchant. The approval process takes only a few seconds. This is key for
transactions that are time sensitive, as is usually the case for PoS transactions.
• The settlement: The final step is to settle the transaction. This usually takes one or
two days. Because of the approval process, a network can facilitate the transaction
without requiring instant settlement.
14. Participants are remunerated through fees. Fees are charged to the merchant (the
“merchant discount fee”) by the merchant’s bank, while typically transaction fees charged
directly to the consumer are either zero or negative (via rewards programs). The merchant’s
bank in turn passes on fees to the customer’s bank (the interchange fee) and to the card
network (the network fee). Interchange fees typically vary by type of card (credit transactions
are charged more than debit), by business size or industry (e.g., gas stations have lower fees),
and by the type of transaction (e.g., PoS transactions face lower fees). Regulations also play a
role (see Annex I)
15. The prevailing payment infrastructure influences whether and how fintech
companies enter the different segments of the payment process. It can affect their
decision to collaborate with the incumbents or disrupt the market.
• Access infrastructure. On-line sales are growing with increasing internet access and
wider acceptance of on-line shopping experience. Fintech companies are particularly
well-placed to provide a gateway through the card network or directly through credit
transfers or direct debit. However, PoS transactions remain large and the development
of a widespread PoS physical infrastructure (outside the existing card networks) is
still a challenge.
• Clearing infrastructure. The infrastructure for large-value payment is well integrated,
with two pan-European real-time gross settlement (RTGS) systems. TARGET2 is
owned and operated by the Eurosystem, while EURO1 is privately owned and operated
by the Euro Banking Association. Retail payment systems are more fragmented, with
several domestic automated clearing houses (ACH). This market fragmentation is being
addressed by the setting of Single Euro Payment Area (SEPA) standards. Moreover,
STEP2 is a pan-European ACH that provides SEPA credit transfers and direct debit.
These transfers however are same day, rather than instantaneous and available at any
time. Efforts to standardize instant payments lead to the SEPA Credit Transfer (SCT)
and pan-European instant payment settlement services (see Box 2). Instant payments
are needed to be able to compete with the card network instant authorization.14
Box 2. Instant Payment Clearing in Europe
Initiatives aimed at harmonizing electronic euro transactions include new criteria for speed of
transactions under the Single Euro Payments Area (SEPA). The European Payment Council (EPC)
launched the SEPA Credit Transfer (SCT) in 2008, requiring that payments (if made before the daily
cut-off time) be credited within one working day. In November 2017, to address the demand for instant
payments and ameliorate the risk that national solutions would reintroduce fragmentation in the retail
payments market, the EPC launched SCT Inst, a SEPA credit transfer that requires the clearing and
settlement to take place within 10 seconds, at any time, and sets a maximum amount of 15,000 euros
for the transaction. Moreover, the regulation provides participants with the flexibility to agree to
shorter execution times and higher maximum amounts.1
The EU infrastructure for instant payments relies on two pan-European schemes along with
several national automatic clearing houses (ACH). Payment service providers (PSPs) offer instant
fund transfers based on SCT Inst standards through two pan-European schemes, Target Instant
Settlement Service (TIPS) and RT1. TIPS was launched in 2018 and is an extension of TARGET2—
the real-time gross settlement system operated by the Eurosystem—which settles in central bank
money. It seeks to operate on a full-cost recovery basis, with no entry or maintenance fees and a fixed
charge per instant payment transaction—currently 0.002 euro. RT1 was launched in 2017 by EBA
Clearing (owned by 53 major banks operating in Europe). There are also several domestic ACHs that
offer instant payments. Bankgirot, owned by Swedish banks, launched instant payments in 2012 and is
the infrastructure behind Swish—the most popular mobile payment system in Sweden with about
7½ million private users. Finance Denmark, a Danish financial industry association, established
Straksclearing in 2014.
Instant payments are gaining ground in EU. Over half of European PSPs participate in SCT Inst,
covering 22 countries. SCT Inst volumes grew to about 4.4 percent of total credit transfers by the third
quarter of 2019. A year into its launch, TIPS counts 30 participants which include the central banks of
Germany and Latvia, and some major European Banks. It also has about 1,000 reachable parties which
access TIPS through the account of a participant.
_________________________
1
For a detailed discussion of the Swish see the link.
16. Card fees in Europe are generally subject to legal caps. In Europe, regulation on
interchange fees for card-based payment transactions entered into force in June 2015. It caps
the fees for consumer cards and imposes transparency obligations on banks and retailers. In
the US, the regulation caps interchange fees but only for debit cards. Since reward programs
are financed from interchange fees, the difference in regulation is a reason why US-issued
credit cards usually offer rewards, while cards issued in Europe generally do not. To the
extent that the regulation manages to reduce excess profits from acquirers, fintech companies
might have less incentives to compete with them, and rather focus on the front-end of the
market.15 B. Fintech Payment Innovations 17. Fintech companies provide a wide array of solutions, inside or outside the card network. Large fintech companies like Adyen or Klarna offer a full suite of payment solutions for PoS and online payments. They offer a gateway for online payments, which handles authentication and security, and processes payments through several means such as cards, e-wallets, and SEPA direct debit. While payment services offering P2P transfers are common, payments to retailers that circumvent card schemes are more limited, and usually involve small retailers in domestic markets. Fintech companies like iDEAL or BLIK rely on domestic ACHs to avoid card schemes (see Box 3). 18. Other companies focus on specific issues, such as fraud detection or cross-border integration. For instance, German Fraugsters provides payment companies and merchants with an AI platform to detect and prevent fraud. U.K.’s Rapyd provides a platform for e- commerce companies and financial institutions to embed local payment methods into their applications, so that they can easily access foreign markets. 19. Banks are also adopting or developing fintech solutions. European banks have embraced solutions which improve data security and authentication. Instead of card numbers they use one-time dynamic security codes, and fingerprint or face recognition technology. Apple Pay is one such popular solution. They have also developed their own solutions, including to strengthen authentication. For example, NatWest/RBS have issued biometric fingerprint credit cards, while Barclays offers finger vein reader technology to its corporate customers.
16

                     Box 3. Fintech Payments in Poland: The Experience of BLIK
Instant payment clearing was available in Poland prior to the development of pan-European
schemes. A Polish ACH, Express Elixir, was launched in 2012 and it has since allowed for direct
clearing of transactions between banks from payers’ accounts. The system guarantees nonstop
clearings within seconds, bears no credit risk and doesn’t incur non-bank intermediary costs thanks to
designated accounts at the national central bank. Transaction fees for instant transfers are determined
at the discretion of the participating banking institutions.

BLIK uses the domestic ACH to offer instant payments and mobile transfers. BLIK’s platform
uses mobile apps for authentication and operates through the digital interface of participating
institutions. Launched in 2015 as a joint           BLIK: Daily Transactions and Average Value
venture of the six largest Polish banks, the        (LHS: Polish zloty per transaction; LHS: Daily number of transactions, thousands)
                                                 300                                                                            1,200
platform has since expanded to cover all
major banks and payment institutions in the      250                                                   Number of                1,000
                                                                                                       transactions
country. During the second quarter of 2020,      200      Value per                                                             800
BLIK executed over 1 million transactions                 transaction
                                                 150                                                                            600
per day and was available to 13.1 million
registered users.                                100                                                                            400

                                                                50                                                              200
BLIK offers a wide domestic payment
                                                   0                                                       0
network. Users can pay at about 110,000                H1    H2     H1   H2     H1   H2 H1  H2 H1  H2  H1
online stores, make instant P2P money                   2015          2016       2017    2018   2019  2020
transfers (thanks to Express Elixir ACH), use         Source: Polish Payment Standard.

540,000 PoS terminals at brick-and-mortar stores, withdraw cash from about 90 percent of ATMs in
Poland, and initiate direct debit payments. Over three quarters of BLIK transactions take place online,
followed by transactions using ATMs, offline PoSs, and P2P transfers. Adoption of the platform led to
an exponential increase in the number of average daily transactions, while simultaneously decreasing
the average transaction value.

BLIK supports strong authentication and security. The banks’ app generates a one-time dynamic
security code valid for two minutes, which is validated by the payment system (using the mobile app,
PoS terminal or ATM) and authenticated with a PIN code in the bank’s app. The vendor receives a
confirmation of the transfer within a few seconds.

Card networks recognize the potential of instant payment schemes. By late 2019, BLIK’s parent
company agreed to provide a seventh of its shares to MasterCard. In exchange, MasterCard will enable
contactless payments to BLIK users globally through integration with MasterCard Digital Enablement
Service.

C. Payment Regulations

20.     Regulations have multiple objectives, including fostering competition. The EU
directives described below have multiple objectives, spanning from increasing transparency
and strengthening consumer protection, to stimulating innovation and improving the level
playing field for existing and new players in the payment service industry through the
17 emergence of common technical standards and interoperability. 9 The objective of fostering competition, within and across borders, is key to support the operation of the single market and lower prices for consumers. 21. The 2007 Payment Service Directive (PSD I) established a legal framework within which all EU payment service providers must operate. Previously, payment service regulation was based on national rules applying to domestic banks’ debit schemes. These teamed up over time with international schemes to coordinate cross-border payments. However, fragmentation persisted, resulting in inefficiencies and differing interchange fees for the same type of service. The objective of PSD I was to enable the creation of the Single Euro Payments Area (SEPA), a unique cross-border market for electronic payments—credit transfers, debit and credit – much like the single market for goods, capital, people and services. PSD I would provide a level playing field to businesses, by standardizing rights and obligations of service providers, and strengthening consumer protection by introducing more transparency and guaranteeing faster execution of payments. 22. PSD I introduced several definitions and rules clarifying institutional roles and regulating business conduct for payment services. The directive introduced a definition of “payment institutions” that can obtain authorization to provide payment services in any country of the EU subject to capital and risk management criteria. The directive also established business conduct rules that specify transparency requirements (including on fees), mandated the maximum execution time for payments, and specified complaint procedures. Moreover, the directive regulated (i) modalities for authorization and execution of transactions; (ii) liabilities in case of unauthorized use of payment instruments or incorrect execution of transactions; and (iii) rules for refunds, payment order revocation, and value dating of payments. Under the directive, member states were allowed to establish less stringent rules if they could guarantee the same level of consumer protection and promote trust in electronic payment services. 10 While PSD I was successful in integrating retail payments in the EU, regulatory gaps and cross-border fragmentation persisted. Thus, as technology evolved with new forms of payment emerging in the market, the existing framework was challenged. 11 Specific concerns focused on legal uncertainty, cyber security, and consumer protection. 9 As with any financial institution, fintechs are subject to compliance, operational and reputational risk. The case of Wirecard highlights the need for strong internal risk management practices and vigilant supervisory oversight. 10 The PSD I was further complemented in 2009 (EC Regulation 924/2009) and in 2012 (EU Regulation 260/2012). 11 Regulation of electronic money was updated in 2009 in order to foster competition, while also bringing the prudential regime for e-money institutions in line with the requirements for payment institutions.
18

23.      The 2015 Payment Service
Directive (PSD II) opened the
market to a new set of players by
enabling bank customers to use
third-party providers to manage
their payments. PSD II extended the
scope of payment services by
including third party providers, the
application of rules to transaction in
all currencies, and one-leg-out
transactions (transactions with parties
outside the European Economic
Area). PSD II transfers personal data
ownership from banks to their
customers, by enabling them to grant third-party providers (Account Information Service
Providers—AISPs) permission to access their account data stored by banks—which become
Account Servicing Payment Service Providers (ASPSP). The directive also regulates
initiation of payments, internal dispute resolution procedures and customer authentication.
Third parties would thus be able to make payments to merchants directly from consumers’
accounts, circumventing card schemes. Third parties would also be permitted to consolidate
multiple accounts or financial services in one place. Moreover, PSD II contains enhanced
security requirements (see Annex II).

24.      Implementation of PSD II, including transposition into national law across the
EU, has spanned several years, but some gaps in legislation are still present. The
Directive mandated the European Banking Association (EBA) to develop technical standards
and guidelines in relation to payments security, authorization, passporting, and supervision.
However, the PSD II regulation was intended not to be prescriptive, but to facilitate
innovation and adaptation to member states’ circumstances. While PSD2 requires financial
institutions to share customer data with regulated third parties—if the customer provides
consent—it doesn’t mandate a specific technology. There are initiatives to create a common
application programing interface (API) standard, including NextGenPSD2 and Open banking
standards. 12 Banks have therefore adopted a mixed approach to implementation and seeking
to achieve minimum compliance with PSD II, while being lukewarm to customer-led
solutions and innovation that provide access to third parties. 13 The lack of a common
framework across the UK and the EU markets has tended to stall innovation, going against

12
  NextGenPSD2 are the API standards developed by the Berlin Group—a group of banks, bank association and
payment service providers. Open Banking standards are the ones developed by U.K.’s Open Banking
Implementation Entity (OBIE).

13
  Third party companies have pursued alternative like “screen scraping” in which a customer shares their
account credentials with them and uses these credentials to log into the relevant accounts and collect the data or
initiate a payment—circumventing the need to have an operational API.
19

the intended spirit of the law. Legislative issues also arise from overlapping requirements in
PSD II, GDPR, Interchange Fee Regulation (IFR), and the AML 5th Directive. For instance,
whereas GDPR requires banks to protect customer data, under PSD II banks are required to
provide customer accounts and transaction data to third party providers.

                                             Lending

A. Business Models in Fintech Lending

25.     A few important characteristics distinguish lending services provided by fintechs
from those of traditional banks. Fintech firms use integrated digital platforms and interact
with customers fully or largely online and without human involvement in individual
transactions. While commercial banks are increasing their online services, most credit
applications still require some interaction in person. Another distinctive feature is the use of
innovative methods to process large amounts of customer information and evaluate
creditworthiness (e.g. artificial intelligence/machine learning algorithms based on big data and
unconventional information, including digital footprints). Moreover, fintech lenders generally
do not take deposits, and thus cannot create money through lending. Consequently, their
investors do not have any recourse to public guarantees. In most countries this allows fintech
companies to bypass the strict prudential regulations, supervision and reporting requirements
that apply to traditional banks. At the same time, they do not have access to a convenient and
cost-effective funding source. As a result, fintech business models share a number of
similarities: a high degree of automation; a low share of fixed assets; low capital
requirements; low regulatory and compliance costs; focus on convenience and simplicity in
customer experience; digitally active and younger customer base; large shares of seed or
venture capital in funding; and a large share of IT specialists among employees.

26.    The main lending business models used by fintech companies are (Table 2 and
Box 4):

•      Peer-to-peer lending is the most common business model in Europe. The online
       platform provides a standardized loan application process and facilitates direct
       matching of borrowers and investors (lenders). The company usually verifies the
       borrowers’ information and assigns a credit rating, which can then be used to set a
       loan interest rate. The fintech company usually earns money via origination fees
       applied on borrowers and servicing fees on investors. In a pure peer-to-peer lending
       model the fintech platform does not take any risk on its balance sheet and there is no
       maturity or liquidity transformation. Once a borrower and investor are matched, the
       loan contract is signed directly between them. Investors can be individuals or
       institutions. Some peer-to-peer platforms have secondary markets for transferring
       creditors’ rights. Lending platforms typically encourage investors to spread risks
       across (portions of) multiple loans, and often offer automatic exposure to a portfolio
       of loans based on the risk category and terms that investors select.
20
• Crowdfunding. In many aspects crowdfunding platforms are similar to peer-to-peer
lending: they provide a digital marketplace for matching investors and entrepreneurs.
Unlike the debt-based peer-to-peer lending, crowdfunding facilitates several different
types of investment products. As opposed to crowdfunding models for charitable
appeals, three of these are for-profit:
i. rewards crowdfunding: entrepreneurs presell a product or service (at a
discount to the projected ultimate sale price) to launch a business concept
without incurring debt or sacrificing equity;
ii. equity crowdfunding: the backer receives shares of a company, usually in
its early stages, and the financial gain comes in the form of a dividend;
iii. real estate crowdfunding: investors can acquire ownership of a
property/asset via the purchase of shares in a single property or a number
of properties.
From the investors’ perspective, equity-based crowdfunding is typically the riskiest model.
• Balance sheet model. Under the balance sheet model, the fintech company originates
the loan and assumes the credit risk associated with it. In terms of credit
intermediation, this business model is the closest to bank lending: the fintech platform
obtains debt or equity funding and records the loans on its balance sheet. Depending
on the way the company structures the funding from individual investors or
institutions, there could be significant maturity and liquidity mismatches. The key
difference between this model and traditional bank lending remains the absence of
deposit funding.
• Mixed business models. Numerous platforms combine various business models, and
very few run an exclusively balance-sheet model. Reliance on balance sheet funding
has been on the rise, with one third of platforms using their own balance sheet
together with retail and/or institutional investors. For instance, in the UK, 40 percent
of lending done by peer-to-peer platforms involves some sort of balance sheet
funding (Cambridge Center for Alternative Finance, 2017). Some platforms adopt a
balance sheet model initially (funding a proportion of every loan), to grow and build
trust, but plan to abandon it once they are established.
• Invoice trading. Invoice trading platforms are similar to peer-to-peer lending with
individual invoices used as collateral for loans. The platform will typically verify
invoices to make sure they are real and not fraudulent. Once verified, the invoice is
sold on the platform, where multiple investors can buy slices of the invoice to
diversify the risk. The business selling the invoice (usually an SME) can set the
auction minimum pricing or parameters for the advance rate (percentage of cash over
the invoice value) and discount rate (basically the interest rate). Later when the
invoice is paid the platform makes the remaining balance, minus fees, available to the
business.21
27. Peer-to-Peer (P2P) lending is the leading business model, followed by invoice
trading and crowdfunding. In 2016, P2P consumer and business lending together accounted for
about two-thirds of total volume in Europe, followed by crowdfunding (17 percent) and invoice
trading (13 percent). Prolonged low interest rates prompt investors to search for higher yields
investment products, spurring P2P lending. Other forms, including the balance sheet model, are
quite small in Europe. All models reported growth in recent years, albeit at different rates.
Value of Alternative Finance Transactions in Europe Value of Alternative Finance Transactions in UK
(Euro millions, excludes UK) (GBP millions)
P2P consumer lending P2P business lending
P2P business lending
P2P consumer lending
Invoice trading
Equity-based crowdfunding Invoice trading
Reward-based crowdfunding
Equity-based crowdfunding
Real estate crowdfunding
P2P property lending Debt-based crowdfunding
Balance sheet business lending
Reward-based crowdfunding
Donation-based crowdfunding
2016
Debt-based securities Community shares
Balance sheet consumer lending
Donation crowdfunding
Mini-Bonds 2014
Profit sharing Pension-led funding
0 100 200 300 400 500 600 700 0 200 400 600 800 1000 1200
Source: Statista. Source: Statista.You can also read