The Growing Corn Economies of Mexico and the United States - USDA ERS
←
→
Page content transcription
If your browser does not render page correctly, please read the page content below
A Report from the Economic Research Service
 United States
 Department                                                                               www.ers.usda.gov
 of Agriculture
                      The Growing Corn Economies of
 OCS-19F-02
                      Mexico and the United States
 July 2019
                      Steven Zahniser, Nicolás Fernando López López, Mesbah
                      Motamed, Zully Yazmin Silva Vargas, and Tom Capehart

                      Abstract
                      Mexico is the largest foreign market for U.S. corn in terms of export volume and value. The
                      North American Free Trade Agreement (NAFTA), implemented in 1994, facilitated closer
                      integration of the U.S. and Mexican corn markets, as evidenced by rising exports to Mexico
                      and the co-movement of U.S. and Mexican prices. Since the start of 2008, U.S. corn exports
Approved by USDA’s    to Mexico have been free of tariff and quota restrictions due to one of NAFTA’s provisions.
 World Agricultural
  Outlook Board       The recently signed United States-Mexico-Canada Agreement (USMCA) would continue
                      tariff- and quota-free trade in corn. In the United States and Mexico, corn production has
                      risen, due partly to higher yields. USDA’s long-term agricultural projections suggest that in
                      the coming decade, consumption of Mexican and U.S. grown corn will continue to increase
                      due to expanding livestock production in both countries, even though U.S. production of corn-
                      based ethanol is projected to decline. In terms of policy, Mexico has new support programs
                      for small- and medium-scale producers, while the 2018 U.S. Farm Act largely maintains the
                      income support and risk management programs that appeared in previous legislation.

                      Keywords: Corn, United States, Mexico, trade, domestic supports, NAFTA, USMCA.

                      Acknowledgments
                      Thanks to Adolfo Álvarez (Food and Agricultural Organization of the United Nations);
                      Antonio Naude-Yunez (El Colegio de México); Luis Ribeira (Texas A&M University);
                      Linwood Hoffman [USDA, Economic Research Service (ERS)]; Dan Cook, Tim Harrison,
                      Andrew Hochalter, Phil Jarrell, Justin Jenkins, Benjamin Juárez, Yoonhee Macke,
                      Pace Lubinsky, and Robert Tetrault (USDA, Foreign Agricultural Service); and Sharon
                      Sydow (USDA, Office of the Chief Economist) for their valuable peer reviews. Thanks,
                      also, to Noé Serrano Rivera, Elisa Isabel Félix Berrueto, and Raúl Ochoa of Mexico’s
                      Secretariat of Agriculture and Rural Development (SADER—Secretaría de Agricultura
                      y Desarrollo Rural), Agency for Marketing Services and Development of Agricultural
                      Markets (ASERCA—Agencia de Servicios a la Comercialización y Desarrollo de Mercados
                      Agropecuarios) and Cheryl Christensen, Joe Cooper, and Suzanne Thornsbury (USDA, ERS)
                      for their additional feedback. Thanks are due to Héctor Alonso Capilla Sánchez and Mónica
                      Rubio Landa (SADER, ASERCA), and David Nulph (USDA, ERS) as well for constructing
                      the production maps in this report. Special thanks go to Kirse Kelly, Richard Mason, and
                      Andres Guerrero for their expert editing and design of the report, and to Melissa Biggs
                      Coupal for suggesting several key references about the history of corn in Mexico.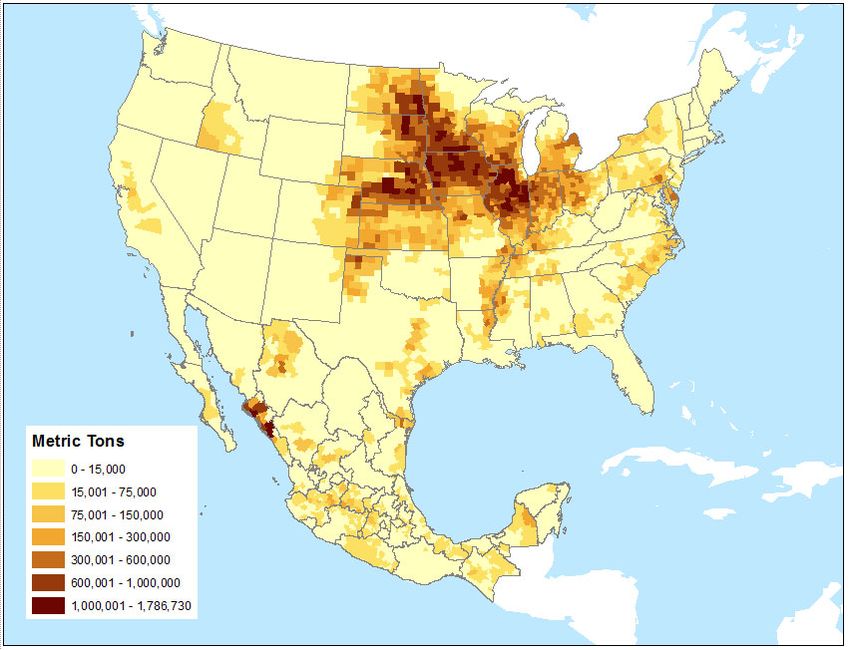
About the authors
Steven Zahniser and Tom Capehart are agricultural economists with ERS. Mesbah Motamed
was formerly a research agricultural economist with ERS when this work was conducted and
is now with the Millenium Challenge Corporation (MCC); the content of this report does not reflect
the views or position of the MCC. Nicolás Fernando López López works at SADER’s National
Service of Agroalimentary Health, Safety, and Quality (SENASICA—Servicio Nacional de
Sanidad, Inocuidad, y Agroalimentaria); he previously worked with ASERCA’s Agri-food Markets
Information Center (CIMA—Centro de Información de Mercados Agroalimentarios). Zully Yazmin
Silva Vargas is a professional service provider with CIMA. This report was primarily prepared when
both López López and Silva Vargas worked at CIMA.

                                                       ii
                     The Growing Corn Economies of Mexico and the United States, OCS-19F-02
                                       USDA, Economic Research Service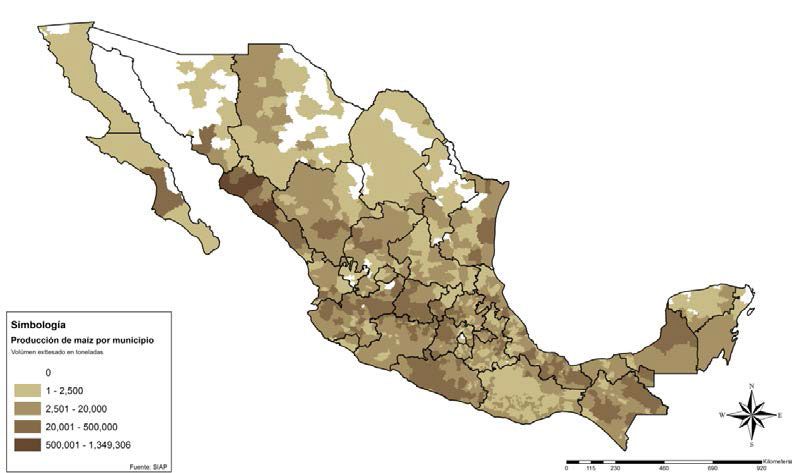
Contents
Introduction  .  .  .  .  .  .  .  .  .  .  .  .  .  .  .  .  .  .  .  .  .  .  .  .  .  .  .  .  .  .  .  .  .  .  .  .  .  .  .  .  .  .  .  .  .  .  .  .  .  .  .  .  .  .  .  .  .  .  .  .  .  .  .  .  .  .  .  .1
From NAFTA to USMCA .  .  .  .  .  .  .  .  .  .  .  .  .  .  .  .  .  .  .  .  .  .  .  .  .  .  .  .  .  .  .  .  .  .  .  .  .  .  .  .  .  .  .  .  .  .  .  .  .  .  .  .  .  .  .  .  .3
Both countries look to increase corn production  .  .  .  .  .  .  .  .  .  .  .  .  .  .  .  .  .  .  .  .  .  .  .  .  .  .  .  .  .  .  .  .  .  .  .  .  .  .6
Cross-country differences motivate U .S .-Mexico
corn trade  .  .  .  .  .  .  .  .  .  .  .  .  .  .  .  .  .  .  .  .  .  .  .  .  .  .  .  .  .  .  .  .  .  .  .  .  .  .  .  .  .  .  .  .  .  .  .  .  .  .  .  .  .  .  .  .  .  .  .  .  .  .  .  .  .  .  .  .  .15
U .S . and Mexican corn prices became more integrated with NAFTA  .  .  .  .  .  .  .  .  .  .  .  .  .  .  .  .  .  .  .  .20
      Livestock and poultry feed . . . . . . . . . . . . . . . . . . . . . . . . . . . . . . . . . . . . . . . . . . . . . . . . . . . . . .26
      Food uses . . . . . . . . . . . . . . . . . . . . . . . . . . . . . . . . . . . . . . . . . . . . . . . . . . . . . . . . . . . . . . . . . . .30
      Industrial uses other than fuel alcohol . . . . . . . . . . . . . . . . . . . . . . . . . . . . . . . . . . . . . . . . . . . . .30
      Feed co-products . . . . . . . . . . . . . . . . . . . . . . . . . . . . . . . . . . . . . . . . . . . . . . . . . . . . . . . . . . . . . 31
Continuity and change in farm programs  .  .  .  .  .  .  .  .  .  .  .  .  .  .  .  .  .  .  .  .  .  .  .  .  .  .  .  .  .  .  .  .  .  .  .  .  .  .  .  .  .  .32
      Mexico emphasizes small- and medium-scale farmers . . . . . . . . . . . . . . . . . . . . . . . . . . . . . . . . 32
      U.S. provides farm programs continuity through 2018 Farm Act . . . . . . . . . . . . . . . . . . . . . . . .37
Conclusion  .  .  .  .  .  .  .  .  .  .  .  .  .  .  .  .  .  .  .  .  .  .  .  .  .  .  .  .  .  .  .  .  .  .  .  .  .  .  .  .  .  .  .  .  .  .  .  .  .  .  .  .  .  .  .  .  .  .  .  .  .  .  .  .  .  .  .  .40
References  .  .  .  .  .  .  .  .  .  .  .  .  .  .  .  .  .  .  .  .  .  .  .  .  .  .  .  .  .  .  .  .  .  .  .  .  .  .  .  .  .  .  .  .  .  .  .  .  .  .  .  .  .  .  .  .  .  .  .  .  .  .  .  .  .  .  .  .41

To ensure the quality of its research reports and satisfy governmentwide standards, ERS requires that all research reports
with substantively new material be reviewed by qualified technical research peers. This technical peer review process,
coordinated by ERS' Peer Review Coordinating Council, allows experts who possess the technical background, perspective,
and expertise to provide an objective and meaningful assessment of the output’s substantive content and clarity of
communication during the publication’s review.

In accordance with Federal civil rights law and U.S. Department of Agriculture (USDA) civil rights regulations and policies, the
USDA, its Agencies, offices, and employees, and institutions participating in or administering USDA programs are prohibited
from discriminating based on race, color, national origin, religion, sex, gender identity (including gender expression), sexual
orientation, disability, age, marital status, family/parental status, income derived from a public assistance program, political
beliefs, or reprisal or retaliation for prior civil rights activity, in any program or activity conducted or funded by USDA (not all
bases apply to all programs). Remedies and complaint filing deadlines vary by program or incident.

Persons with disabilities who require alternative means of communication for program information (e.g., Braille, large print,
audiotape, American Sign Language, etc.) should contact the responsible Agency or USDA's TARGET Center at (202)
720-2600 (voice and TTY) or contact USDA through the Federal Relay Service at (800) 877-8339. Additionally, program
information may be made available in languages other than English.

To file a program discrimination complaint, complete the USDA Program Discrimination Complaint Form, AD-3027, found
online at How to File a Program Discrimination Complaint and at any USDA office or write a letter addressed to USDA and
provide in the letter all of the information requested in the form. To request a copy of the complaint form, call (866) 632-9992.
Submit your completed form or letter to USDA by: (1) mail: U.S. Department of Agriculture, Office of the Assistant Secretary
for Civil Rights, 1400 Independence Avenue, SW, Washington, D.C. 20250-9410; (2) fax: (202) 690-7442; or (3) email:
program.intake@usda.gov.

USDA is an equal opportunity provider, employer, and lender.

                                                                                                             iii
                                                 The Growing Corn Economies of Mexico and the United States, OCS-19F-02
                                                                   USDA, Economic Research Service
Introduction
In both Mexico and the United States, corn is the largest crop in terms of production and consump-
tion volume. In Mexico, corn accounts for a large share of the population’s caloric intake and is
used to make tortillas and other corn-based foods—a practice that dates back thousands of years
(see box, “Corn: More than a Commodity”). Corn farms in Mexico are diverse, ranging from large-
scale, irrigated, commercial operations to households growing local varieties on small, rainfed plots
for subsistence. In the United States, about 38 percent of corn use goes to ethanol production, and
about 33 percent serves as feed for livestock.1 U.S. growers are among the world’s most productive,
with the result that about 15 percent of U.S.-grown corn enters the world market, accounting for 40
percent of total world corn trade [USDA, Foreign Agricultural Service (FAS), 2019b]. Major desti-
nations for U.S. corn exports include Japan, South Korea, Colombia, and, most significantly, Mexico.
Since the start of 2008, U.S. corn exports to Mexico have been free of tariff and quota restrictions
due to a provision in the North American Free Trade Agreement (NAFTA) that allows Mexican
buyers to purchase substantial quantities of U.S. corn, primarily for use as livestock and poultry
feed.
This report provides an overview of the corn economies of Mexico and the United States, including
corn production and its geography; the sectoral composition of corn use; price relationships across
the two countries; and the domestic supports available to corn producers in each country. The
focus is on how the U.S. and Mexican corn sectors have changed since NAFTA’s transition to free
intraregional trade in corn and corn-based products and the extent to which the sectors may change
further in the coming decade, according to the scenario explored in USDA’s long-term agricultural
projections. While many of the broad features of the U.S. and Mexican corn sectors have changed
relatively little over the past decade, others have seen noteworthy developments, such as rising corn
production in both countries, the consolidation of the U.S. ethanol sector, increasing feed use of
corn in Mexico, and the Mexican Government’s creation of new, publicly available data resources
[Mexico’s Secretariat of Agriculture and Rural Development (SADER—Secretaría de Agricultura
y Desarrollo Rural), Agrifood and Fisheries Information Service (SIAP—Servicio de Información
Agroalimentaria y Pesquera), 2019b], similar to USDA’s World Agricultural Supply and Demand
Estimates (WASDE) [USDA, Office of the Chief Economist (OCE), 2019b].
This report does not address the delay in planting the 2019/20 U.S. corn crop due to excessive rains
in major corn-producing areas. The new crop is likely to be substantially reduced due to below-trend
acreage and yields, which will result in significant shifts in corn supply, demand, and price.
For details, see ERS's Feed Outlook Report (USDA, ERS, 2019c).
1The shares in this sentence are calculated using disappearance data from ERS’s Feed Grain Database for the past three
marketing years, 2015/16 to 2017/18 (Capehart, 2019b). The U.S. marketing year (MY) for corn as grain begins on Septem-
ber 1 and ends on August 31. For instance, MY 2018/19 began on September 1, 2018, and will end on August 31, 2019.
1
The Growing Corn Economies of Mexico and the United States, OCS-19F-02
USDA, Economic Research ServiceCorn: More than a Commodity
Human beings have cultivated corn (maize) in the Americas for millennia, and the origins
of the plant, its cultivation, and its use as a staple crop have prompted extensive study [e.g.,
Katz, et al. 1974; Coe, 1994; Doebley, 2004; Long, 2008; Cheetham, 2010; Tuxill, et al., 2010;
Mexico’s National Coordination of Anthropology (CNAN-INAH—Coordinación Nacional
de Antropología y Instituto Nacional de Antropología e Historia), 2016]. Maize, whose wild
ancestor is the grass teosinte, has been in cultivation for roughly 12,000 years and is one of
the world’s longest known food grains [Mexico’s Secretariat of Agriculture, Livestock, Rural
Development, Fisheries, and Food (SAGARPA—Secretaría de Agricultura, Ganadería,
Desarrollo Rural, Pesca, y Alimentación), Agency for Marketing Services and Development of
Agricultural Markets (ASERCA—Agencia de Servicios a la Comercialización y Desarrollo de
Mercados Agropecuarios), 2018]. Among the earliest evidence of maize production in Mexico
are maize fragments from approximately 6,250 years ago that were found in a cave in the
southern State of Oaxaca (Benz, 2001; Piperno and Flannery, 2001). Earlier evidence in the
form of stone tools with starch grain and other plant residues, excavated from beneath a rock
overhang in the southern State of Guerrero, suggests that maize production took place there at
least 8,700 years ago (Ranere, et al. 2009).
Researchers have identified several centers of maize domestication in central and southern
Mexico and Guatemala where farmers selected for traits that ultimately produced hundreds
of varieties of the familiar crop with large ears and soft, densely-packed kernels (Serratos-
Hernández, et al. 2016). After boiling and steeping dried maize kernels in an alkaline solu-
tion (usually of lime), Mesoamerican cooks would grind the resulting mixture into a dough
for making tortillas, the staple that fed emerging civilizations throughout the region. This
process—known as nixtamalization—was revolutionary from a nutritional standpoint, as it
greatly increases the corn’s content of protein, calcium, niacin, and iron and is still in use
today [International Maize and Wheat Improvement Center (CIMMYT—Centro Internacional
de Mejoramiento de Maíz y Trigo), 2015; Cravioto, et al., 1945; Bressani and Scrimshaw, 1958;
Bressani et al., 1958; Katz et al., 1974].
Knowledge and cultivation of the crop gradually spread throughout the Americas in complex
patterns that are still the subject of scholarship and debate (e.g., Serratos-Hernández, et al.
2016, Kistler, et al., 2018), including to native inhabitants of the southwest region and later
the eastern seaboard of what is today the United States (Ranum et al., 2014). Centuries later,
settlers spreading into the U.S. Midwest encountered a favorable geography and climate for corn
production to feed their livestock (Hudson, 1994). Over time, new technologies in transporta-
tion and refrigeration gradually delinked corn and livestock production, allowing corn growers
to specialize increasingly in their crop (Hamilton, 2008). With the aid of enhanced seed vari-
eties, mechanization, and fertilizers, farms grew in size, and corn production soared.
2
The Growing Corn Economies of Mexico and the United States, OCS-19F-02
USDA, Economic Research ServiceFrom NAFTA to USMCA
NAFTA, implemented in 1994, opened a new chapter in U.S.-Mexico corn trade. From 1994 to 2007,
the agreement permitted Mexico to regulate U.S. access to its corn market via a tariff-rate quota
(TRQ). While these TRQs aimed to assist Mexico’s domestic producers as they adjusted to inter-
national markets, they also constrained the country’s ability to satisfy its growing demand for corn
through the importation of yellow corn. Consequently, the Mexican Government opted to pursue a
more liberal trade policy toward corn than that which NAFTA outlined, particularly during the later
years of the transition to free trade. As a result, U.S. corn entered Mexico relatively freely during
this period.2
Figure 1
U.S. exports to Mexico of corn and corn-based products have increased since the end of
NAFTA’s transition to free trade
U.S. dollars (billions)
4.5
4.0
3.5
3.0
2.5
2.0
1.5
1.0
0.5
0.0
90
91
92
93
94
95
96
97
98
99
00
01
02
03
04
05
06
07
08
09
10
11
12
13
14
15
16
17
18
19
19
19
19
19
19
19
19
19
19
20
20
20
20
20
20
20
20
20
20
20
20
20
20
20
20
20
20
20
Calendar year
Yellow corn White corn DDGS HFCS Other
DDGS = distillers’ dried grains with solubles. HFCS = high fructose corn syrup.
Source: USDA, Economic Research Service, and SADER, ASERCA calculations, using data from U.S. Department of Com-
merce, Census Bureau, Foreign Trade Statistics, as cited by USDA, FAS (2019a).
2For example, NAFTA specified a duty-free quota for U.S. corn of about 3.7 million metric tons for 2007, with an over-
quota tariff equal to the greater of 18.2 percent or 1.7 U.S. cents per kilogram. However, Mexico opted to apply a tariff of
about 1–3 percent to yellow corn and created an additional duty-free quota of 1.3 million metric tons for corn imported from
any country. With these policies in place, U.S. corn exports to Mexico equaled about 8.2 million metric tons in 2007 (Zahn-
iser and Crago, 2009).
3
The Growing Corn Economies of Mexico and the United States, OCS-19F-02
USDA, Economic Research ServiceBeginning in 2008, NAFTA lifted all formal restrictions, allowing U.S. corn to enter Mexico free of
all tariffs and quotas. In this policy context, the annual value of U.S. exports to Mexico of corn and
corn-based products has increased by about $1.8 billion in nominal terms since 2007 (fig. 1). During
the period 2016-18, the United States sold an annual average of 15.1 million metric tons of corn to
Mexico, valued at about $2.8 billion, with additional corn-related products adding around another
$1 billion (USDA, FAS, 2019a). As the number one foreign buyer of U.S. corn, Mexico received
about one-fourth of all U.S. corn exports (USDA, FAS, 2019a), representing about 4 percent of
total U.S. corn production [USDA, National Agricultural Statistics Service (NASS), 2019]. Imports
accounted for roughly one-third of Mexico’s total corn supply (USDA, FAS, 2018b), and 98 percent
of those imports came from the United States during 2016–18, with most of the remainder coming
from Brazil [Mexico’s Secretariat of Economy (SE—Secretaría de Economía), 2019]. At the same
time, Mexico has emerged as a more consistent exporter of white corn, selling an annual average of
about 1.4 million metric tons of this product to foreign buyers during 2016–18 (SE, 2019). U.S. corn
imports from Mexico, however, are small in total volume, with an annual average of about 37,000
metric tons during 2016–18 (USDA, FAS, 2019a).
The bulk of U.S. corn exports to Mexico are shipped from the United States via two Customs
Districts: Laredo, Texas—a major crossing for U.S.-Mexico trade—and New Orleans, Louisiana—a
major seaport for U.S. agricultural trade in general (fig. 2).3 With U.S. corn exports to Mexico
growing since the end of NAFTA’s transition to free trade and particularly since 2013, a larger
share of this trade utilizes these two Customs Districts. Between 2005–07 and 2016–18, the Laredo
District’s share increased from 39 percent to 51 percent, while New Orleans’s share increased from
25 percent to 36 percent.
In November 2018, the Canadian, Mexican and U.S. Governments signed the United States-Mexico-
Canada Agreement (USMCA), a new trade accord that would replace NAFTA while continuing
tariff- and quota-free trade among the member countries in the overwhelming majority of products,
agricultural and nonagricultural, including corn. (Office of the U.S. Trade Representative, 2018;
Secretaría de Economía [SE], 2018a). The USMCA also includes new provisions regarding the noti-
fication of export restrictions and commitments to share information regarding domestic support
measures that potentially harm trade. In June 2019, the Mexican Senate ratified the USMCA by a
vote of 114 to 4; at the time of writing, the new agreement had not yet been ratified by the national
legislatures of the United States and Canada.
3One should take care not to confuse customs districts with the ports for which they are named. For instance, the Laredo
Customs District encompasses the Ports of Laredo and Eagle Pass, among others. During 2016–18, the Port of Laredo ac-
counted for 53 percent of the total value of U.S. corn exports to Mexico departing from the Laredo Customs District, and
Eagle Pass accounted for 42 percent, with other ports such as Progreso accounting for the remaining 5 percent. Similarly, the
New Orleans Customs District encompasses the Ports of New Orleans, Gramercy, and Baton Rouge, among others. During
2016–18, these ports accounted for 57 percent, 26 percent, and 15 percent, respectively, of the total value of U.S. corn exports
to Mexico departing from the New Orleans Customs District (U.S. Department of Commerce, Census Bureau, 2019).
4
The Growing Corn Economies of Mexico and the United States, OCS-19F-02
USDA, Economic Research ServiceFigure 2
The Customs Districts of Laredo and New Orleans have become more prominent departure
points for U.S. corn exports to Mexico
Metric tons (millions)
9
8
7
6
5
4
3
2
1
0
2005 2006 2007 2008 2009 2010 2011 2012 2013 2014 2015 2016 2017 2018
Calendar year
Laredo El Paso New Orleans Other
Source: USDA, Economic Research Service, and SADER, ASERCA calculations using data from USDA, FAS (2019a).
5
The Growing Corn Economies of Mexico and the United States, OCS-19F-02
USDA, Economic Research ServiceBoth countries look to increase corn production
The United States and Mexico are both large corn producers, and their production is expected to
rise in the coming decade. As the world’s largest corn producer, the United States accounts for 34
percent of global production, and Mexico, the world’s sixth largest, accounts for 3 percent (fig. 3).
During marketing years (MYs) 2015/16 to 2017/18, U.S. farmers produced an annual average of
367.1 million metric tons (about 14.5 billion bushels), while Mexican farmers produced 27.0 million
metric tons (1.1 billion bushels).4
Figure 3
The United States and Mexico are among the world’s largest corn producers
Rest of world,
Nigeria, 123.0, 12%
Indonesia, 10.7, 1%
South Africa 10.9, 1%
13.1, 1%
Canada, 13.9, 1%
Russia, 13.9, 1%
United States,
Ukraine, 25.1, 2%
, 367.1, 34%
India, 25.7, 2%
Mexico, 27.0, 3%
Argentina, 34.2, 3%
European Union
60.9, 6%
Brazil, 82.5, 8%
China, 262.6, 25%
Note: Figure depicts average annual corn production by country during U.S. marketing years 2015/16 to 2017/18. Data labels
indicate country, average annual production (millions of metric tons), and share of world production (percent).
Source: USDA, Economic Research Service and SADER, ASERCA calculations using production data from USDA, FAS
(2019b).
4The U.S. marketing year (MY) for corn as grain begins on September 1 and ends on August 31. For instance, MY
2018/19 began on September 1, 2018, and will end on August 31, 2019.
6
The Growing Corn Economies of Mexico and the United States, OCS-19F-02
USDA, Economic Research ServiceMexican corn production in the form of grain reached 27.7 million metric tons in Mexico’s 2017
agricultural year (AY).5 Of this quantity, about 87 percent was white corn, and the remainder was
yellow. The year before, AY 2016, saw a record crop for Mexico, owing to favorable weather and
expanding area planted, as many sorghum-growing areas switched to corn in response to a sugar-
cane aphid infestation.
Mexico’s corn production has grown since the end of NAFTA’s transition (fig. 4). Between 2007
and 2017, production increased at a compound annual rate of 1.6 percent, with white corn growing
at 1.2 percent and yellow corn at 7.0 percent. Behind these growth rates are rising yields, thanks to
increased mechanization and improved seed varieties. Over the period 2012–17, mechanized corn
area (for grain) grew at an annual average rate of 3.5 percent—7.8 percent for irrigated production
and 2.1 percent for rainfed production. Over that same period, the area cultivated with improved
corn seed increased at an annual average rate of 4.4 percent—8.2 percent for irrigated land and 2.7
percent for rainfed production. As a result of these advances in technological adoption, Sinaloa and
Jalisco, Mexico’s largest and second largest producing States for white corn, saw yields rise by 1.8
percent and 0.6 percent, respectively, between 2007 and 2017 (see box, “Where is Corn Grown in
Mexico and the United States?”).
In AY 2017, Mexico planted about 7.5 million hectares of corn (fig. 4). Due to rising yields, Mexico
has raised production while devoting less land to corn. Between 2007 and 2017, area planted fell at
a compound annual rate of 0.7 percent, or about 576,000 hectares over the period. Total area planted
to corn has fallen by about 706,000 hectares since AY 1993, the year before NAFTA’s implementa-
tion. Apart from the gains achieved through higher yields, rising prices over this time period helped
lift the value of corn production in Mexico by over 100 percent in the period starting after 2005
(Dyer et al., 2018).
5Mexico’s agricultural year (AY) is divided into two production cycles: fall-winter and spring-summer. For corn, planting
in fall-winter begins in October and ends in March, while the harvest begins in December and ends as late as September.
Planting in spring-summer begins in April and ends in September, while the harvest begins in June and ends as late as March.
Thus, AY 2018 for corn covers the crops planted from October 2017 to March 2018 (fall-winter 2017/18) or from April to
September 2018 (spring-summer 2018). Because Mexico’s AY differs from the U.S. marketing year (MY), making compari-
sons between Mexican production statistics and USDA’s estimates of Mexican production requires extra effort; for example,
Mexico’s spring-summer 2016 and fall-winter 2016/17 seasons roughly correspond to U.S. MY 2016/17. Rounding to the
nearest 100,000 metric tons, both the sum of Mexico’s corn production for spring-summer 2016 and fall-winter 2016/17 and
the USDA estimate for Mexico’s corn production in U.S. MY 2016/17 (as reported by USDA, FAS, 2019b) equal 27.6 mil-
lion metric tons.
7
The Growing Corn Economies of Mexico and the United States, OCS-19F-02
USDA, Economic Research ServiceFigure 4
Mexican corn area and production, agricultural years 1990–2017
Millions of hectares Millions of metric tons
10 Area planted Area harvested Production
30
9
8 25
7
20
6
5 15
4
10
3
2
5
1
0 0
90
91
92
93
94
95
96
97
98
99
00
01
02
03
04
05
06
07
08
09
10
11
12
13
14
15
16
17
19
19
19
19
19
19
19
19
19
19
20
20
20
20
20
20
20
20
20
20
20
20
20
20
20
20
20
20
Agricultural year
Source: USDA, Economic Research Service and SADER, ASERCA calculations using data from SADER, SIAP (2019a).
Figure 5
U.S. corn area and production, marketing years 1990/91–2018/19
Millions of hectares Millions of metric tons
40 Area harvested (left axis) Production (right axis)
400
Area planted (left axis)
35 350
30 300
25 250
20 200
15 150
10 100
5 50
0 0
1 3 5 7 9 1 3 5 7 9 1 3 5 7 9
/9 /9 /9 /9 /9 /0 /0 /0 /0 /0 /1 /1 /1 /1 /1
90 92 94 96 98 00 02 04 06 08 10 12 14 16 18
19 19 19 19 19 20 20 20 20 20 20 20 20 20 20
Marketing Year (September to August)
Source: USDA, Economic Research Service and SADER, ASERCA calculations using data from USDA, ERS (2019b).
8
The Growing Corn Economies of Mexico and the United States, OCS-19F-02
USDA, Economic Research ServiceU.S. corn production since NAFTA’s transition to intraregional free trade has also steadily increased,
due to both rising yields and increased area, enabling the sector to respond to growing domestic and
foreign demand (fig. 5). Corn area harvested in the United States averaged 33.8 million hectares
during 2015–17, a 7.7-percent rise compared with 2005–07 and a 22.8 percent rise compared with
1991–93. While some of this area is new to cultivation, a significant portion reflects more frequent
rotations of corn and the displacement of other crops (Wallender et al, 2011). Across the same two
periods, yields rose by around 35 percent and currently average close to 10 metric tons per hect-
are. In certain areas, irrigated production achieves average yields above 12 metric tons per hectare
(USDA, NASS, 2019a). Yield improvements are rooted in productivity-increasing inputs such as
enhanced seed varieties, fertilizers, and pesticides, as well as cultivation techniques such as reduced
tillage, more optimal crop rotations, and irrigation. Irrigated corn not only produces higher yields
but also is less vulnerable to fluctuations in rainfall. An annual average of 7.1 million hectares (17
million acres) of area harvested with corn for grain during 2015–17 was irrigated, accounting for 21
percent of the total (USDA, NASS, 2019a).
9
The Growing Corn Economies of Mexico and the United States, OCS-19F-02
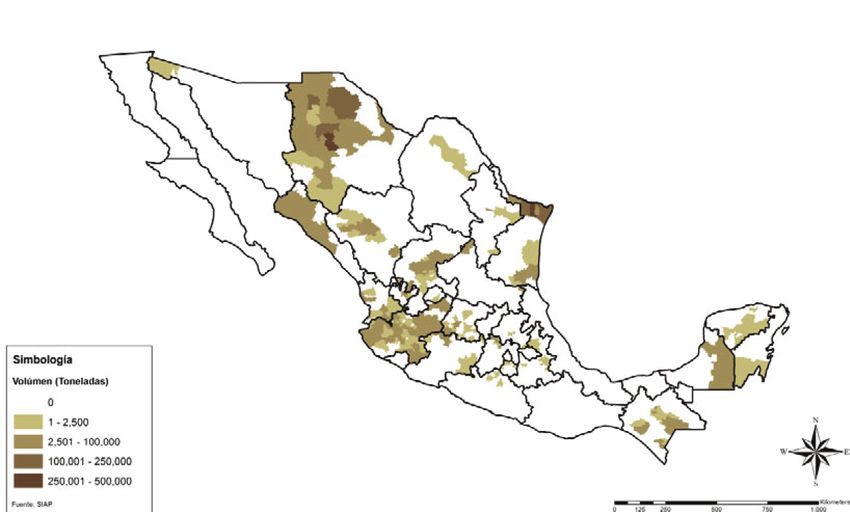
USDA, Economic Research ServiceWhere is corn grown in Mexico and the United States?
As the leading crop of both Mexico and the United States, corn appears across many parts
of each country, but cultivation is concentrated in areas better suited for corn (box fig. 1). For
example, although white corn is grown in each of Mexico’s 32 States (box fig. 2, box table 1),
10 States account for 84 percent of production, and two States—Sinaloa and Jalisco—account
for over one-third. The production attributes of these two States differ substantially from each
other. Sinaloa primarily grows white corn during the fall-winter season and relies almost
entirely on irrigation, while Jalisco plants white corn in the spring-summer season, with over
90 percent of its production rainfed. During AYs 2014–16, an average of 82 percent of Mexico’s
white corn area was rainfed, compared with 54 percent for yellow corn (SADER, SIAP, 2019a).
About three-fourths of Mexico’s white corn production comes from spring-summer plantings.
Figure 1
Geographic location of U.S. and Mexican corn production (all seasons, rainfed and irri-
gated, white and yellow)
Metric Tons
0 - 15,000
15,001 - 75,000
75,001 - 150,000
150,001 - 300,000
300,001 - 600,000
600,001 - 1,000,000
1,000,001 - 1,786,730
Source: Prepared by USDA, Economic Research Service and SADER, ASERCA, using municipal-level data from
SADER, SIAP (2019a) and county-level data from USDA, NASS (2018).
10
The Growing Corn Economies of Mexico and the United States, OCS-19F-02
USDA, Economic Research ServiceFigure 2
Geographic location of Mexico’s white corn production, 2017
Metric tons
0
1 - 2,000
2,501 - 20,000
20,001 - 500,000
500,001 - 1,349,306
Source: Prepared by SADER, ASERCA using municipal-level data from SADER, SIAP (2019a).
Table 1
Top 10 Mexican white corn producing States, based on 2014–17 average
Share of production that is:
Area
State Production Yield
harvested Spring-Summer
Irrigated
Plantings
Metric tons Hectares Metric tons per
Percent
(millions) (millions) hectare
Sinaloa 5.3 0.512 10.3 11.7 93.9
Jalisco 2.9 0.448 6.5 99.2 6.2
México 2.0 0.501 4.0 99.9 15.9
Michoacan 1.8 0.439 4.1 98.2 23.3
Guanajuato 1.5 0.383 4.0 99.9 32.4
Veracruz 1.3 0.565 2.2 66.4 0.9
Guerrero 1.2 0.452 2.8 94.1 8.2
Chiapas 1.1 0.586 1.8 83.1 1.8
Puebla 1.0 0.519 1.9 95.3 8.9
Hidalgo 0.7 0.242 2.9 89.2 23.8
Other States 3.9 2.033 1.9 90.1 28.3
Total 22.8 6.7 3.4 84.7 18.3
Source: USDA, Economic Research Service and SADER, ASERCA calculations using data from SADER, SIAP (2019a).
11
The Growing Corn Economies of Mexico and the United States, OCS-19F-02
USDA, Economic Research ServiceMexico’s yellow corn sector is about one-seventh the size of the country’s white corn sector in
terms of output (box fig. 3, box table 2). About three-fourths of Mexico’s yellow corn production
comes from spring-summer plantings, and roughly 70 percent is irrigated. Chihuahua, bordering
the U.S. States of New Mexico and Texas, accounts for about 40 percent of Mexico’s yellow corn
production and is the largest producing State for this commodity. All of Chihuahua’s yellow
corn production comes from spring-summer plantings and is irrigated.
Table 2
Top 10 Mexican yellow corn producing States, based on 2014–17 averages
Share of production that is:
Area
State Production Yield
harvested Spring-Summer
Irrigated
Plantings
Metric tons Hectares Metric tons per
Percent
(millions) (millions) hectare
Chihuahua 5.3 0.140 8.6 100.0 80.5
Jalisco 2.9 0.110 6.4 99.6 8.7
Tamaulipas 2.0 0.091 6.4 2.2 94.5
Sinaloa 1.8 0.015 9.9 0.4 100.0
Chiapas 1.5 0.080 1.5 90.3 0.5
Michoacán 1.3 0.014 5.5 100.0 34.3
Zacatecas 1.2 0.010 6.3 100.0 69.3
Campeche 1.1 0.018 2.4 97.9 0.1
Durango 1.0 0.011 3.1 100.0 23.7
Guanajuato 0.7 0.004 9.6 100.0 97.5
Other States 3.9 0.048 2.1 93.1 4.9
Total 22.8 0.540 5.8 79.0 48.9
Source: USDA, Economic Research Service and SADER, ASERCA calculations using data from SADER, SIAP (2019a).
In the United States, corn cultivation occurs primarily in the country’s Midwestern states,
stretching from Nebraska to Ohio, a region dubbed the Corn Belt (box fig. 1). Nearly 80 percent
of U.S. corn area is rainfed, with irrigated production occupying much of corn-growing areas
in Nebraska, Colorado, Kansas and Texas (USDA, NASS, 2019a). The largest quantities of
production occur in Iowa, Illinois, Nebraska, and Minnesota, States which also lead in yields
(box table 3). Among the leading producing States, yields range from 8.8 metric tons per
hectare (Kansas) to 12.5 metric tons per hectare (Iowa). The climate and geography in the
leading corn-producing states combine to create ideal conditions for growing corn, with warm
spring and summer temperatures averaging around 20–22 degrees Celsius, and average annual
total precipitation ranging from 193–257 centimeters. Planting begins within two weeks of the
last winter frost, which corresponds to early April for much of the region. Plants typically
reach maturity within 100–115 days, with more northern regions with shorter growing seasons
planting hybrids that mature in less than 80 days.
12
The Growing Corn Economies of Mexico and the United States, OCS-19F-02
USDA, Economic Research ServiceFigure 3
Geographic location of Mexico’s yellow corn production, 2016
Metric tons
0
1 - 2,500
2,501 - 100,000
100,001 - 250,000
250,001 - 500,000
Source: Prepared by SADER, ASERCA using municipal-level data from SADER, SIAP (2019a).
13
The Growing Corn Economies of Mexico and the United States, OCS-19F-02
USDA, Economic Research ServiceTable 3
Top 10 U.S. corn producing states, based on 2015–17 averages
Area
State Production Yield
harvested
Metric tons (millions) Hectares (millions) Metric tons per hectare
Iowa 66.5 5.3 12.5
Illinois 54.8 4.6 12.0
Nebraska 43.0 3.8 11.4
Minnesota 37.7 3.1 12.0
Indiana 22.9 2.2 10.5
South Dakota 20.0 2.1 9.7
Kansas 16.6 1.9 8.8
Ohio 13.4 1.3 10.2
Wisconsin 13.3 1.2 10.8
Missouri 13.2 1.3 10.0
Other States 65.7 7.0 9.5
Total 367.1 33.8 10.9
Note: USDA data on corn production (area, yield, volume, and farm price) do not distinguish among different types of
corn since most corn produced in the United States is Yellow No. 2. However cash market prices, trade data and
export grain inspection data are available for both yellow and white corn.
Source: USDA, Economic Research Service and SADER, ASERCA calculations using data from USDA, NASS (2019a).
The U.S. Federal Government does not collect production data for white corn because of the
crop’s small size, but both U.S. trade figures and grain inspection data include details about
white corn trade. Private-sector estimates place annual U.S. white corn production during the
2011–16 crop years in the range of 2.3–4.0 million metric tons (Global Risk Management,
2016), suggesting that white corn accounts for about 1 percent of U.S. corn production. The
available evidence points to concentrations of white corn production in Nebraska, Kentucky,
Tennessee, Illinois, Indiana, and Texas (Dahl and Wilson, 2002; U.S. Grains Council, 2006;
Global Risk Management, 2015). Most U.S. production is contract-based and sold to food
processors, including U.S. tortilla and chip makers. White corn yields are close to or on par
with yellow corn (U.S. Grains Council, 2006). Production methods broadly resemble those used
to grow yellow corn, with the stipulation that white corn fields remain removed from nearby
yellow corn fields to prevent cross-pollination. Quality consistency issues are more salient given
that the grain is destined for human consumption. As is the case for yellow corn, exports are
key to U.S. growers of white corn. During MYs 2015/16 to 2017/18, the United States exported
an annual average of 1.6 million metric tons of white corn, of which 59 percent went to Mexico
(USDA, FAS, 2019a).
14
The Growing Corn Economies of Mexico and the United States, OCS-19F-02
USDA, Economic Research ServiceCross-country differences motivate U.S.-Mexico
corn trade
The pattern of U.S.-Mexico corn trade is due to several differences between the corn sectors of
the two countries. First, relative to population, the U.S. corn sector is much larger than Mexico’s,
reflecting differences in the two countries’ land endowments. During MY 2017/18, U.S. corn produc-
tion per capita was about 1.1 metric tons, compared with 0.2 metric tons in Mexico (calculated using
production data from USDA, FAS, 2019b, and population data from U.S. Department of Commerce,
Census Bureau, 2018), and in 2016, arable land per capita was 0.47 hectares in the United States,
compared with 0.18 hectares in Mexico (World Bank, 2019). As a result, the United States enters the
global corn market primarily as an exporter, while Mexico participates mainly as an importer.6
Second, the two countries specialize in different types of corn. Mexico primarily produces white
corn, used mostly to make tortillas and other corn-based foods for direct human consumption, while
the United States mainly produces yellow corn—used primarily as livestock feed, as a feedstock
for ethanol production, and for export, with a small share consumed directly in the United States in
the form of cereals, tortillas, snacks, and other foods. White corn accounts for roughly 90 percent
of Mexican corn production, compared with just 1 percent in the United States. As a result, U.S.
corn exports to Mexico primarily consist of yellow corn—about 93 percent during MYs 2015/16 to
2017/18, according to U.S. trade statistics (USDA, FAS, 2019a).
Third, average corn yields are much higher in the United States than in Mexico, although some
Mexican producers achieve yields comparable to those in the United States. For U.S. corn crops
during 2015–17, annual yields averaged 10.9 metric tons per hectare (USDA, NASS, 2019a). For
Mexican crops during agricultural years (AYs) 2014–17, annual yields averaged 3.6 metric tons per
hectare (SADER, SIAP, 2019a). Mexico’s corn yields have registered an upward trend over the last
three decades (fig. 6). For irrigated white corn, this trend is particularly impressive, with yields
rising from 3.7 metric tons per hectare in 1991 to 8.4 metric tons per hectare in AY 2017, an increase
of 126 percent. For rainfed white corn, yield growth has been more modest, rising from 1.8 metric
tons per hectare in AY 1990 to 2.5 metric tons per hectare in AY 2017. Since the end of NAFTA’s
transition to free trade over a decade ago, U.S. yields have increased at a compound annual rate of
1.6 percent for rainfed corn and 1.0 percent for irrigated corn (using 2007–17 data), while Mexican
yields have increased at a compound annual rate of 1.9 percent for irrigated white corn, 1.3 percent
for rainfed white corn, and 2.3 percent for irrigated yellow corn (using 2006–16 data).
6The statistics presented in this paragraph were calculated using production and consumption estimates from USDA, FAS
(2018b) and population estimates from U.S. Department of Commerce, Census Bureau (2017).
15
The Growing Corn Economies of Mexico and the United States, OCS-19F-02
USDA, Economic Research ServiceFigure 6
U.S. and Mexican corn yield, by type and irrigation, 1990–2017
Tons per hectare
14
12
10
8
6
4
2
0
6
7
4
5
0
1
2
3
2
3
4
5
6
7
8
9
9
0
1
6
7
8
3
4
5
0
1
2
201
201
201
201
201
201
200
200
200
201
201
200
200
200
200
200
200
200
199
199
199
199
199
199
199
199
199
199
U.S. Yellow Rainfed U.S. Yellow Irrigated Mexico White Irrigated
Mexico Yellow Irrigated Mexico White Rainfed Mexico Yellow Rainfed
Notes: For Mexican data, the years correspond with Mexico’s agricultural years (AYs). Mexico’s AY is divided into two produc-
tion cycles: fall-winter and spring-summer. For corn, planting in fall-winter begins in October and ends in March, while the
harvest begins in December and ends as late as September. Planting in spring-summer begins in April and ends in Sep-
tember, while the harvest begins in June and ends as late as March. Thus, AY 2017 for corn covers the crops planted from
October 2016 to March 2017 (fall-winter 2016/17) or from April to September 2017 (spring-summer 2017). Prior to AY 2003,
Mexican production data for corn did not differentiate between white and yellow corn. For U.S. data, the years correspond
with U.S. marketing years. The U.S. marketing year (MY) for corn as grain begins on September 1 and ends on August 31.
For instance, MY 2017/18 began on September 1, 2017, and ended on August 31, 2018.
Sources: USDA, Economic Research Service and SADER, ASERCA calculations using data from SADER, SIAP (2019a) and
USDA, NASS (2019a).
Water availability matters to yields because two-thirds of Mexico’s white corn area is rainfed, and
many producers must contend with a semi-arid climate and frequent drought, particularly in the
country’s northern states. Management practices and technology vary widely across the country.
Whereas high-yielding producers in the State of Sinaloa plant improved seed varieties on large,
highly mechanized operations, small-scale and often subsistence farmers, particularly in the
southern States of Chiapas and Guerrero, rely on indigenous varieties and manual labor to cultivate
their crops—features which limit yield growth.
Also driving the two countries’ yield differences is the varying use of higher-yielding genetically
engineered (GE) varieties. In 2018, GE varieties accounted for about 92 percent of U.S. corn produc-
tion (Wechsler, 2018). The Mexican Government readily allows for science-based approvals of GE
corn for imports (consumption) but not for cultivation. In September 2013, a provisional injunction
issued by a Mexican federal court effectively prohibited both experimental and commercial planting
of GE corn in Mexico (Otero, 2017; Juárez and Harrison, 2018). The Mexican Government does
allow other GE crops, namely cotton, to be cultivated in Mexico.
Perhaps the largest explanation of yield differences, however, is farm size and its attendant scale
economies. In the United States, the average size of a corn operation is 101 hectares, based on data
16
The Growing Corn Economies of Mexico and the United States, OCS-19F-02
USDA, Economic Research Servicefrom the 2012 Census of Agriculture, compared with just 3.6 hectares in Mexico, based on agricultural
support program data for 2014 (tables 1 and 2). Large U.S. farms achieve greater land and labor effi-
ciencies through mechanized tillage, planting, and chemical applications—technologies that are more
profitable when applied at a large scale.7 In contrast, such technologies remain out of reach on Mexico’s
smaller plots, and farmers must use traditional practices of production, resulting in lower yields.
Moreover, some researchers have suggested that small-scale corn farmers in Mexico respond differently
to prices than large-scale ones. For example, subsistence farmers facing a decrease in the price of corn
may actually plant more corn for consumption to offset market-based losses as well as the accompanying
decrease in land rents and farm wages (Taylor, et al., 2005; Dyer, et al., 2006).
In Mexico, farm size in the corn sector varies widely from one State to the next (fig. 7). In the two
largest corn-producing States, Sinaloa and Jalisco, farm size in 2014 averaged 10.1 hectares and 7.4 hect-
ares, respectively, reflecting the commercial orientation and use of technology by corn farmers in those
States. States with larger numbers of corn producers tend to host much smaller operations. For instance,
the States of Chiapas, Oaxaca, and Puebla together accounted for about 33 percent of Mexico’s corn
producers in 2014; their average area per producer that year was 3.3 hectares, 2.2 hectares, and 2.9 hect-
ares, respectively.
Figure 7
Mexican corn sector: number of producers and average size of operation in 2014, by State
Producers Hectares
200,000 16
180,000
14
160,000
12
140,000
10
120,000
100,000 8
80,000
6
60,000
4
40,000
2
20,000
0 0
o
Oax s
aca
bla
Gue co
Mic cruz
can
algo
Gu alisco
to
as
Sin n
Chi aloa
Tlax a
cala
Que ngo
ntan taro
Cam Roo
Nue eche
Tab ón
o
Tam yarit
asc lipas
Coa es
Mor la
elos
Son a
ora
ral
alifo r
rnia
sí
Baj rnia Su
apa
rrer
atá
hu
asc
im
hui
o
San anajua
i
atec
nt
e
a C o Fede
Méx
Pue
Pot
hoa
Col
hua
a
vo L
é
a
Hid
alie
Na
Yuc
au
a
p
Chi
Dur
r
Ver
J
Zac
Luis
alifo
aC
i t
Qui
r
Agu
t
Dis
Baj
Number of producers Average area per producer
Source: SADER, ASERCA calculations using PROAGRO program data for 2014. PROAGRO is described in the policy section of
this report.
7About one-half hour of labor time is required to produce one metric ton of corn in the United States (Foreman, 2014).
17
The Growing Corn Economies of Mexico and the United States, OCS-19F-02
USDA, Economic Research ServiceIn spite of these differences, historical data show that the size of a corn farm has increased in both
countries, but the timing of these changes and the extent to which they occurred differ across the
two countries. In the United States, Census of Agriculture data indicate that the average size of a
corn operation experienced sizable growth between 1987 and 2007 and again between 2012 and
2017 (table 1). According to the 2017 Census of Agriculture, 82 percent of U.S. corn production took
place on farms larger than 250 acres (about 101 hectares) (USDA, NASS, 2019b).
Table 1
U.S. corn sector: number of farms and area harvested, 1987–2017
Average corn area
Census year Number of farms Area harvested
per farm
Millions of hectares Hectares per farm
2017 304,801 34.3 113
2012 348,530 35.4 101
2007 347,760 34.9 100
2002 348,590 27.6 79
1997 450,520 28.8 64
1992 430,711 28.2 66
1987 503,935 28.1 56
Note: Statistics cover only corn grown for grain and do not include corn grown for silage.
Source: USDA, Economic Research Service and SADER, ASERCA calculations using data from USDA, NASS (2019b, 2014,
2009, 2004, 1999, 1994).
Combining data from Mexico’s 1991 and 2007 agricultural censuses with the program data
presented in figure 6 reveals that the Mexican corn sector has also experienced consolidation—espe-
cially in the decade following NAFTA’s transition to intraregional free trade (table 2).8 Over the
period 1991 to 2007, the average size of a Mexican corn operation increased slightly from 2.7 hect-
ares to 2.8 hectares (spring-summer average). By 2014, however, the average size had grown to 3.6
hectares.
8Mexican census and production data distinguish between production obtained from the fall-winter and spring-summer
planting seasons. Since some farmers might take part in both agricultural cycles, one must be careful in comparing the num-
ber of producers for a particular agricultural cycle with the number for an entire agricultural year. Moreover, Mexican pro-
gram data do not include producers who opt not to receive government supports. The program data in figure 6, for example,
cover 5.1 million hectares of corn, compared with the roughly 7 million harvested in AY 2014. If one adjusts the Mexican
program data upwards to account for corn area not covered by the program, Mexico had roughly 2 million corn producers in
2014.
18
The Growing Corn Economies of Mexico and the United States, OCS-19F-02
USDA, Economic Research ServiceTable 2
Mexican corn sector: number of farms and area harvested
Average corn area
Agricultural Cycle Number of farms Area harvested
per farm
Millions of hectares Hectares per farm
Fall winter 1991
Total 471,586 1.2 2.6
Spring summer 1991
Total 2,679,813 7.4 2.7
Fall-winter 2007
Total 166,577 0.6 3.6
White 140,530 0.6 3.9
Yellow 26,047 0.1 2.0
Spring summer 2007
Total 2,627,363 7.3 2.8
White 2,143,099 6.0 2.8
Yellow 484,264 1.3 2.8
Agricultural year 2014 (PROAGRO participants only)
Total 1,427,068 5.1 3.6
Note: Mexican program data do not include producers who opt not to receive government support, as such programs are
voluntary.
Source: USDA, Economic Research Service, and SADER, ASERCA calculations, using data from Mexican agricultural cen-
sus and Mexico’s Agricultural Support Program (PROAGRO—Programa de Oferta Agropecuaria) program data.
19
The Growing Corn Economies of Mexico and the United States, OCS-19F-02
USDA, Economic Research ServiceU.S. and Mexican corn prices became more integrated
with NAFTA
The U.S. and Mexican corn markets have become more integrated since NAFTA’s implementation,
with corn and corn-based products flowing in both directions across the border, but primarily from
the United States to Mexico. Given the large volume of U.S. corn production and Mexico’s reliance
on corn imports from the United States, market forces in the United States can influence prices in
Mexico. An observable outcome of this relationship is the convergence of corn prices in different
locations (Fiess and Lederman, 2004; Jaramillo et al., 2015). But different parts of Mexico are not
all equally integrated with the U.S. market, and as such, prices across Mexico move with the U.S.
price to different degrees (Motamed et al., 2008).
Figure 8 illustrates the relationship between U.S. and Mexico prices by presenting four monthly
price series over the period January 1998 to October 2017. The first two series are the U.S. Gulf of
Mexico prices for yellow corn No. 2 and for white corn. The other two series are white corn prices
observed in Sinaloa and Jalisco, Mexico’s number one and two corn-growing States. All of the
prices are expressed in real terms (base year = 1982). U.S. corn prices have experienced a decline
from their high values of the period 2011–13, partially due to rising world corn production. By the
end of 2017, the prices of U.S. yellow and white corn fell below $200 per metric ton.
Figure 8
Corn prices in the Mexican States of Sinaloa and Jalisco broadly track the movements of
U.S. corn prices at Gulf of Mexico ports
Price (U.S. dollars per metric ton)
1,200
1,000
800
600
400
200
0
1998 2000 2002 2004 2006 2008 2010 2012 2014 2016
White - Sinaloa Yellow - U.S. Gulf of Mexico White - U.S. Gulf of Mexico White - Jalisco
Note: All prices are in real terms, and the base year is 1982. Weekly State-level price data from Mexico were averaged to ob-
tain monthly data and then converted into U.S. dollars per metric ton equivalent using contemporaneous exchange rates and
then converted into real terms using the producer price index for corn from the U.S. Department of Labor’s Bureau of Labor
Statistics. The vast majority of U.S. corn exported to Mexico is yellow corn No. 2.
Source: USDA, Economic Research Service and SADER, ASERCA calculations using data for Mexican prices from SE (2018b)
and monthly data for U.S. prices from USDA, ERS (2018).
20
The Growing Corn Economies of Mexico and the United States, OCS-19F-02
USDA, Economic Research ServicePrices in both Sinaloa and Jalisco appear to track the movement of U.S. prices broadly, implying
some commonly felt market forces. In Sinaloa, virtually all production is commercial, and most
producers participate in the Agricultura por Contrato program, a price guarantee program (described
later in the report) which customarily refers to the Chicago futures price in its contracts. In Jalisco,
while about 15–25 percent of production occurs on traditional small-scale operations, a sizeable
portion of modern, commercial production ensures that its connection with worldwide markets also
remains strong.
A simple way to observe the integration of markets is to measure how much prices in different loca-
tions move together. The map in figure 9 presents price correlations between each Mexican State
and the U.S. Gulf Port price, revealing the variation in market integration among Mexico’s different
corn producing states. To prepare the map, monthly state-specific Mexico prices, deflated using
Mexico’s corn-specific producer price index (PPI) from Mexico’s National Institute of Statistics and
Geography (INEGI–Instituto Nacional de Estadística y Geografía), were correlated with the monthly
U.S. Gulf port price, which was deflated using the corn-specific PPI from U.S. Bureau of Labor
Statistics. From the map, price correlations appear relatively high in States with large volumes of
corn production, including Sinaloa, Jalisco, Mexico, and Guanajuato. Meanwhile, smaller producing
states such as Oaxaca, Guerrero, and Veracruz exhibit much smaller correlations, suggesting weaker
connections with the U.S. market.
Figure 9
Mexico State level price correlations with U.S. gulf price (1998–2017)
State Level Correlations
-0.40 - 0.00
0.01 - 0.20
0.21 - 0.40
0.41 - 0.60
0.61 - 0.80
Insufficient data
Note: Weekly State-level price data from Mexico were averaged to a monthly basis and then converted into U.S. dollars per
bushel equivalent using contemporaneous exchange rates. States that lacked monthly price information during more than 75
percent of the period examined were omitted and labeled as “Insufficient data.”
Source: USDA, Economic Research Service and SADER, ASERCA calculations using weekly data for Mexican prices from
SE (2018b) and monthly data for U.S. prices from USDA, ERS (2018).
21
The Growing Corn Economies of Mexico and the United States, OCS-19F-02
USDA, Economic Research ServiceMany uses of corn are expected to increase
Corn is a versatile commodity that is present in many intermediate and consumer products in both
the United States and Mexico. USDA classifies corn use into three main categories: (1) feed and
residual; (2) exports; and (3) food, seed, and industrial use (FSI) (fig. 10), (Capehart, 2019a). FSI in
turn is divided into several subcategories, of which fuel ethanol is by far the most significant. During
MYs 2015/16 to 2017/18, total U.S. corn distribution averaged 417.3 million metric tons per year.
Alcohol for fuel was the largest category of corn use—33 percent—followed closely by feed and
residual, at 32 percent.9
Figure 10
Composition of U.S. corn distribution: marketing years 2015/16 to 2017/18
Ending stocks, 52.2, 13%
FSI: Cereal and other products,
5.2, 1%
FSI: Alcohol for
beverages and, FSI: Seed, 0.8, 0%
manufacturing,
3.7, 1% Exports,
FSI: Starch, 6.0, 1% 56.1, 14%
FSI: Glucose and dextrose,
9.1, 2%
FSI: HFCS, 11.8, 3%
Feed and residual,
134.5, 32%
FSI: Alcohol for fuel,
137.7, 33%
Note: Figure depicts average annual corn distribution during marketing years 2015/16 to 2017/18. The U.S. marketing year for
corn begins in September and ends in August. Data labels indicate distribution category, average annual volume (millions of
metric tons), and share of total distribution. FSI = Food, seed, and industrial. HFCS = High fructose corn syrup.
Source: USDA, Economic Research Service and SADER, ASERCA calculations using data from USDA, ERS (2019b).
9As defined by USDA, corn for grain does not include corn for silage or corn that is consumed directly by people, such as
in the form of corn on the cob or canned or frozen corn.
22
The Growing Corn Economies of Mexico and the United States, OCS-19F-02
USDA, Economic Research ServiceSADER uses a similar classification scheme for Mexico’s corn demand, but unlike USDA, SADER
distinguishes between white corn and yellow corn (fig. 11). For white corn, the five main categories
are: (1) human consumption; (2) household consumption; (3) livestock feed; (4) seed for planting;
and (5) losses. For yellow corn, there is also a sixth category: the starch industry. SADER’s catego-
ries approximate those of USDA, with the exception of household consumption (see Box, “How do
SADER’s Números del Campo compare to USDA’s WASDE?”). During MYs 2015/16 to 2017/18,
Mexico’s total corn distribution averaged 45.9 million metric tons per year. For the purposes of
Números del Campo, the marketing year begins in October and ends in September. Livestock feed
and human consumption were the two largest categories of total corn use according to Números del
Campo, with shares of 37 percent and 28 percent, respectively.
Figure 11
Composition of Mexican corn demand: Mexican marketing years 2015/16 to 2017/18
Ending stocks,
Losses, yellow, Ending stocks, yellow, 3,043, 6.62% Exports, white,
272, 0.59% white, 2,040, 4.44% 1,298, 2.83%
Exports, yellow,
Losses, white, 982, 2.14% 16, 0.03%
Seed for planting,
white,167.0.36%
Seed for planting,
yellow, 13, 0.03%
Human consumption,
Starch industry, yellow, white, 12,665, 27.57%
2,741, 5.97%
Livestock feed,
yellow, 12,556, 27.33%
Human consumption,
yellow,16, 0.78%
Household consumption,
white, 4,818,10.49%
Household consumption,
Livestock yellow, 375, 0.82%
feed, white,
4,599, 10.01%
Note: Figure depicts the composition of Mexican corn demand during marketing years 2015/16 to 2017/18. The Mexican
marketing year for corn, as reflected in Números del Campo, begins in October and ends in September. Data labels indicate
distribution category, average annual volume (millions of metric tons), and share of total distribution.
Source: USDA, Economic Research Service and SADER, ASERCA calculations using data from SADER, SIAP (2019a).
23
The Growing Corn Economies of Mexico and the United States, OCS-19F-02
USDA, Economic Research ServiceYou can also read