Battelle/BIO State Bioscience Jobs, Investments and Innovation 2014 - Presenting Sponsor
←
→
Page content transcription
If your browser does not render page correctly, please read the page content below
Battelle/BIO
                      State Bioscience
Presenting Sponsor:
                      Jobs, Investments
                      and Innovation 2014
June 2014
Battelle does not engage in research for advertising, sales promotion, or
endorsement of our clients’ interests including raising investment capital or
recommending investments decisions, or other publicity purposes, or for
any use in litigation.
Battelle endeavors at all times to produce work of the highest quality,
consistent with our contract commitments. However, because of the
research and/or experimental nature of this work the client undertakes the
sole responsibility for the consequence of any use or misuse of, or inability
to use, any information, apparatus, process or result obtained from Battelle,
and Battelle, its employees, officers, or Trustees have no legal liability for
the accuracy, adequacy, or efficacy thereof.

The Project Team

          Battelle—Every day, the people of Battelle apply science and technology to solving what matters
          most. At major technology centers and national laboratories around the world, Battelle conducts
          research and development, designs and manufactures products, and delivers critical services for
        government and commercial customers. Headquartered in Columbus, Ohio since its founding in 1929,
            Battelle serves the national security, health and life sciences, and energy and environmental
                               industries. For more information, visit www.battelle.org.
            In 1991, Battelle created the Technology Partnership Practice (TPP). We focus Battelle’s broad
        experience to better serve economic development organizations, universities, and nonprofit technology
                organizations across the U.S. For further information, please contact Mitch Horowitz at
                           horowitzm@battelle.org or Ryan Helwig at helwigr@battelle.org.
              BIO—Biotechnology Industry Organization—BIO is the world's largest trade association
        representing biotechnology companies, academic institutions, state biotechnology centers and related
         organizations across the United States and in more than 30 other nations. BIO members are involved
         in the research and development of innovative healthcare, agricultural, industrial and environmental
           biotechnology products. BIO also produces the BIO International Convention, the world’s largest
        gathering of the biotechnology industry, along with industry-leading investor and partnering meetings
        held around the world. BIOtechNOW is BIO's blog chronicling “innovations transforming our world” and
                          the BIO Newsletter is the organization’s bi-weekly email newsletter.
         PMP Public Affairs Consulting, Inc.—PMP— is an independent consulting firm serving the public
               and constituent relations needs of bioscience-related companies and associations.
            Bravo Group—We help our clients win tough fights, anywhere. Our difference is an integrated,
          campaign-style approach, where we match smart strategies with key relationships, a wide range of
             tactics, and the experience needed to get things done. We bring energy and urgency to every
        campaign... understanding the importance of tight timelines and winning every day... in the toughest
        circumstances. Winning requires understanding the challenge... making strategic choices for victory...
             and using clear, compelling communications to move audiences to action. With our integrated
            campaign-style approach, we’re built to win. Every day. Our work in public relations, advocacy,
           advertising and research, when integrated into a comprehensive campaign, is unbeatable. Bravo
                                     Group... win tough fights. thebravogroup.com

                                                                                                                 Page iii

Battelle/BIO State Bioscience Jobs, Investments and Innovation 2014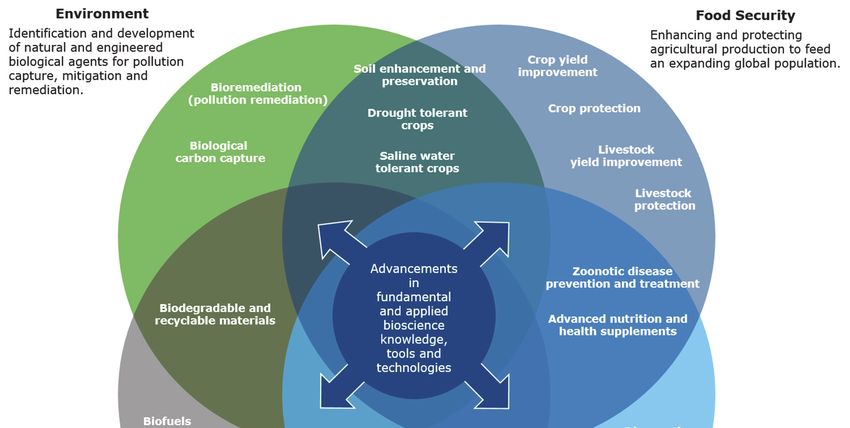
Highlights

A Robust Bioscience Industry with Strong Prospects for Growth
While not immune to the economic crisis and             The latest Battelle/BIO data indicate that:
resulting recession, the bioscience industry
                                                            In 2012, U.S. bioscience companies employed
weathered difficult economic times better than
                                                            1.62 million personnel across more than
most industries, and is on course to regain its
                                                            73,000 individual business establishments.
previous high employment levels. Indeed, the
promise of bioscience-based solutions to global             Over the past decade the industry has added
grand challenges in human health, food security,            nearly 111,000 new, high-paying jobs or 7.4
sustainable industrial production and environmental         percent to its employment base.
protection provides an optimistic picture for the
                                                            Economic output of the bioscience industry has
biosciences as a key economic development engine
                                                            expanded significantly with 17 percent growth
in the U.S.
                                                            for the biosciences since 2007, nearly twice the
In this sixth biennial report, Battelle and BIO             national private sector nominal output growth.
continue the tradition of reporting national and
                                                            The industry continues its tradition of creating
state statistics for the bioscience industry in the
                                                            high-wage, family-sustaining jobs with average
U.S. Returning for this edition are bioscience
                                                            wages 80 percent greater than the overall
metrics for leading U.S. metro areas.
                                                            private sector and growing at a faster rate.

Requirements for Sustaining the Promise of this Important Industry
While the prospects for bioscience-based economic           Research funding that supports both the
growth in the U.S. remain strong, attention must            understanding of basic biological precepts and
be paid to maintaining the innovation ecosystem             their ultimate translation into bioscience-
that powers the industry. Battelle/BIO does see             related products and services.
signs of stress that are a concern for the future if        Regulatory systems firmly grounded in science
not addressed. Federal funding for scientific               and predictable in their application.
research is critical to assuring progress in
                                                            Strong protections for intellectual property,
fundamental discoveries that underpin national
                                                            both domestically and internationally.
bioscience innovation, yet bellwethers, such as NIH
funding, are trending in the wrong direction.               Medical reimbursement and payment policies
Similarly, risk capital has also fallen off in recent       that are favorable to the development of new
years, creating barriers to advancing biosciences           and innovative biomedical products.
innovation.                                                 Government trade actions that sustain and
The threat from international competition is strong         improve the “openness” of international
and growing. Bioscience-based economic                      markets for U.S. bioscience goods and services.
development is the target of both first-world and           Federal and state tax policies and incentive
developing nations, and assuring U.S.                       systems that sustain industry competitiveness.
competitiveness requires:
                                                            Education and workforce development
                                                            programs providing the skilled workforce
                                                            needed for today and tomorrow.
                                                                                                               Page v

Battelle/BIO State Bioscience Jobs, Investments and Innovation 2014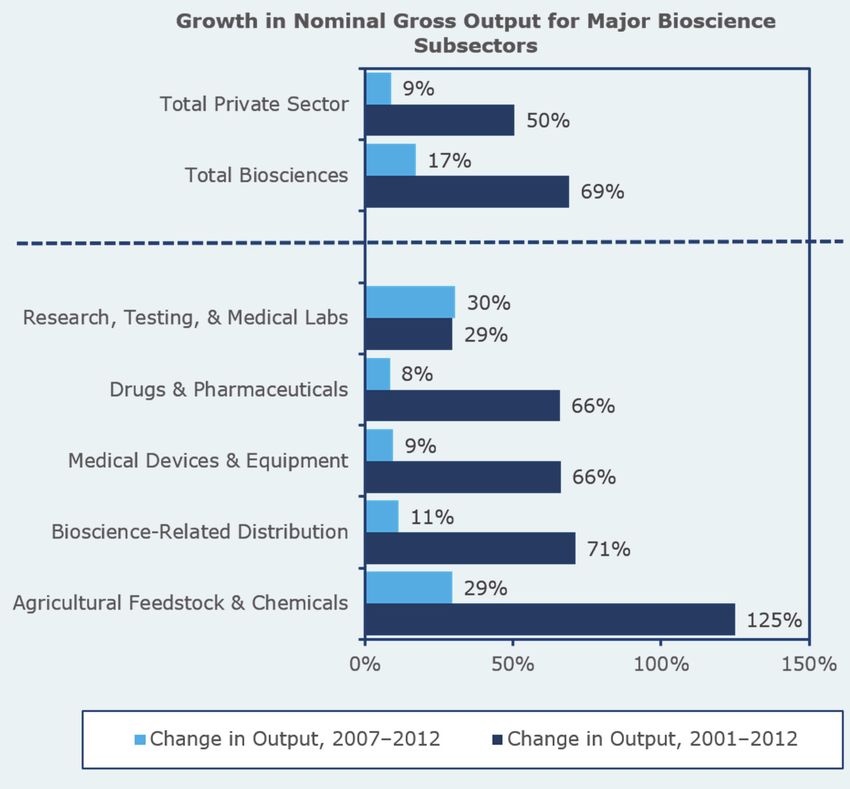
State-by-State & Metropolitan Area Bioscience Industry Trends
The bioscience industry is well distributed across Remarkably, 17 states and Puerto Rico are
states and plays a major role as an economic specialized in at least two of the five bioscience
driver, with many states maintaining niche subsectors, suggesting that there may be
strengths in specialized areas across the major spillover impacts from specialization in one
industry subsectors. Highlights of state industry niche into another.
performance include:
New Jersey and Puerto Rico stand out in having
Thirty three States and Puerto Rico have an a specialization in four of the five bioscience
employment specialization in at least one of the subsectors.
five bioscience subsectors in 2012. These
The longer term growth of the bioscience
include:
industry during the 2001 to 2012 period is
– 14 states specialized in Agricultural widely distributed across the nation, with 36
Feedstock & Chemicals states sharing in job gains (Figure A).
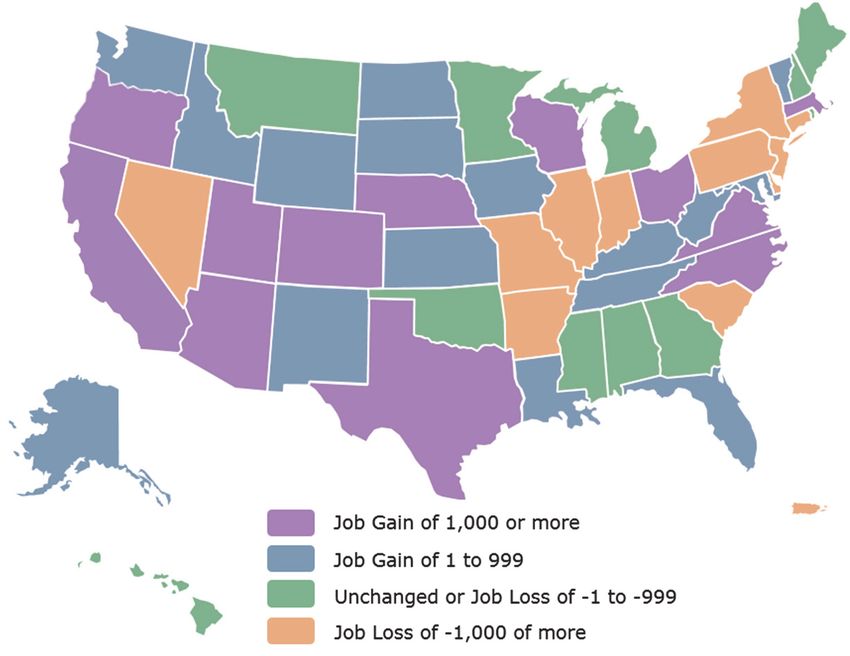
– 10 states and Puerto Rico specialized in In the recent 2007 to 2012 period, which
Bioscience-related Distribution includes the recession and early years of the
– 13 states and Puerto Rico specialized in recovery, 28 states had overall job gains in the
Drugs & Pharmaceuticals biosciences (Figure B).
– 14 states and Puerto Rico specialized in
Medical Devices & Equipment
– 11 states and Puerto Rico specialized in
Research, Testing and Medical Labs.
Figure A. Change in Bioscience Employment by State, 2001–2012
Page vi
Battelle/BIO State Bioscience Jobs, Investments and Innovation 2014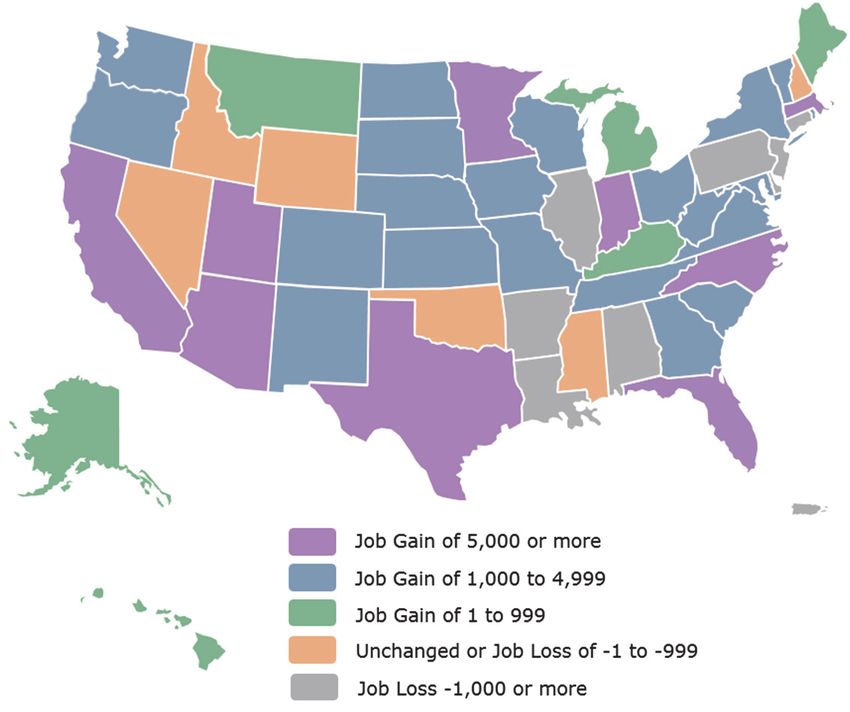
Figure B. Change in Bioscience Employment by State, 2007–2012

Highlights of metropolitan area industry                   –   Ames, IA (3)
performance include:                                       –   Bloomington, IN (3)
                                                           –   Boston-Cambridge-Quincy, MA-NH (3)
   The bioscience industry footprint is well
                                                           –   Boulder, CO (3)
   distributed across the nation’s metropolitan
                                                           –   Danville, IL (3)
   areas with 216 of the nation’s 381 metro
   regions having a specialized employment                 –   Durham-Chapel Hill, NC (3)
   concentration in at least one of the bioscience         –   Greensboro-High Point, NC (3)
   subsectors.                                             –   Hickory-Lenoir-Morganton, NC (3)
                                                           –   Iowa City, IA (3)
   Twenty nine metro regions have a specialized            –   Kankakee-Bradley, IL (3)
   employment concentration in at least three              –   Knoxville, TN (3)
   bioscience subsectors. The industry hubs differ
                                                           –   Lebanon, PA (3)
   significantly in size, ranging from as few as 600
                                                           –   Lincoln, NE (3)
   bioscience jobs in the smallest region to more
                                                           –   Memphis, TN-MS-AR (3)
   than 60,000 jobs among the largest. They are
                                                           –   Philadelphia-Camden-Wilmington, PA-NJ-
   (number of specializations in parentheses):                 DE-MD (3)
   –   Indianapolis-Carmel, IN (5)                         –   Raleigh-Cary, NC (3)
   –   Allentown-Bethlehem-Easton, PA-NJ (4)               –   Salt Lake City, UT (3)
   –   Kalamazoo-Portage, MI (4)                           –   San Francisco-Oakland-Fremont, CA (3)
   –   Lafayette, IN (4)                                   –   St. Joseph, MO-KS (3)
   –   Logan, UT-ID (4)                                    –   Trenton-Ewing, NJ (3)
   –   Madison, WI (4)
                                                       Indianapolis-Carmel, Indiana is the only
   –   Oxnard-Thousand Oaks-Ventura, CA (4)
                                                       metropolitan area with a specialized employment
   –   San Diego-Carlsbad-San Marcos, CA (4)
                                                       concentration in all five bioscience subsectors in
   –   South Bend-Mishawaka, IN-MI (4)
                                                       2012.
                                                                                                            Page vii

Battelle/BIO State Bioscience Jobs, Investments and Innovation 2014
Contents

                                                                                                                                   Page
   Highlights ........................................................................................................................ v
        A Robust Bioscience Industry with Strong Prospects for Growth.......................................... v
        Requirements for Sustaining the Promise of this Important Industry ................................... v
        State-by-State & Metropolitan Area Bioscience Industry Trends ......................................... vi
   U.S. Bioscience Industry: The National Picture ............................................................... 1
        Introduction ............................................................................................................... 1
        The U.S. Bioscience Industry: Current Status and Recent Trends ........................................ 4
             Bioscience Subsectors: Comparative U.S. Performance ................................................ 6
             The Different Story Told by “Output”......................................................................... 8
             High Wages, High Impact ........................................................................................ 9
             Broader Impact of the Bioscience Industry: Employment Multipliers ............................ 10
        An Engine of Innovation – Patent Activity in Biosciences.................................................. 11
        Signs of Stress in the U.S. Bioscience Innovation Ecosystem............................................ 13
             R&D Funding ....................................................................................................... 13
             Capital Availability ............................................................................................... 14
             International Competition and the U.S. Operating Environment................................... 16
        State and Local Initiatives: Innovations in Supporting Industry Growth ............................. 17
   State and Metropolitan Area Performance .....................................................................21
        Agricultural Feedstock & Chemicals .............................................................................. 23
             State Leaders & Highlights .................................................................................... 23
        Drugs & Pharmaceuticals ............................................................................................ 27
             State Leaders & Highlights .................................................................................... 27
        Medical Devices & Equipment ...................................................................................... 31
             State Leaders & Highlights .................................................................................... 31
        Research, Testing, & Medical Laboratories ..................................................................... 35
             State Leaders & Highlights .................................................................................... 35
        Bioscience-Related Distribution.................................................................................... 39
             State Leaders & Highlights .................................................................................... 39
   State Bioscience Innovation Performance Metrics .........................................................43
        Academic Bioscience R&D Expenditures ........................................................................ 43
        NIH Funding ............................................................................................................. 45
        Bioscience Venture Capital Investments ........................................................................ 46
        Bioscience-Related Patents ......................................................................................... 48
                                                                                                                                           Page ix

Battelle/BIO State Bioscience Jobs, Investments and Innovation 2014
Appendix A. Data & Methodology .................................................................................. 51
                   Industry Employment, Establishments, and Wages ......................................................... 51
                        Industry Employment Multipliers ............................................................................. 52
                   Additional Bioscience Performance Metrics Data.............................................................. 53
                        Bioscience Academic R&D Expenditures ................................................................... 53
                        National Institutes of Health (NIH) Funding .............................................................. 53
                        Bioscience Venture Capital Investments ................................................................... 53
                        Bioscience Patents ................................................................................................ 53

         List of Tables
                                                                                                                                             Page
         Table 1. Employment Changes, Total Biosciences and Total Private Sector ..................................... 4
         Table 2. U.S. Bioscience Establishment and Employment Data for 2012, and Percent Change,
              2001–2012 and 2007–2012 .............................................................................................. 6
         Table 3. Average Annual Wages for Selected Industries in the U.S., 2012 ...................................... 9
         Table 4. U.S. Bioscience Venture Capital Investments by Stage, 2009-2013 .................................. 15
         Table 5. States with Large and Specialized Employment in Agricultural Feedstock and Chemicals,
              2012 ............................................................................................................................ 23
         Table 6. Metropolitan Statistical Areas with the Largest Employment Levels in Agricultural
              Feedstock and Chemicals, 2012 ....................................................................................... 24
         Table 7. Metropolitan Statistical Areas with the Highest Location Quotients in Agricultural
              Feedstock and Chemicals, by Size of MSA, 2012 ................................................................. 25
         Table 8. States with Large and Specialized Employment in Drugs and Pharmaceuticals, 2012........... 28
         Table 9. Metropolitan Statistical Areas with the Largest Employment Levels in Drugs and
              Pharmaceuticals, 2012 .................................................................................................... 28
         Table 10. Metropolitan Statistical Areas with the Highest Location Quotients in Drugs and
              Pharmaceuticals, by Size of MSA, 2012 ............................................................................. 29
         Table 11. States with Large and Specialized Employment in Medical Devices and Equipment,
              2012 ............................................................................................................................ 31
         Table 12. Metropolitan Statistical Areas with the Largest Employment Levels in Medical Devices
              and Equipment, 2012 ..................................................................................................... 32
         Table 13. Metropolitan Statistical Areas with the Highest Location Quotients in Medical Devices
              and Equipment, by Size of MSA, 2012 ............................................................................... 33
         Table 14. States with Large and Specialized Employment in Research, Testing, and Medical
              Laboratories, 2012 ......................................................................................................... 35
         Table 15. Metropolitan Statistical Areas with the Largest Employment Levels in Research,
              Testing, and Medical Laboratories, 2012 ............................................................................ 36
         Table 16. Metropolitan Statistical Areas with the Highest Location Quotients in Research,
              Testing, and Medical Laboratories, by Size of MSA, 2012 ..................................................... 37
         Table 17. States with Large and Specialized Employment in Bioscience-Related Distribution,
              2012 ............................................................................................................................ 39
         Table 18. Metropolitan Statistical Areas with the Largest Employment Levels in Bioscience-
              Related Distribution, 2012 ............................................................................................... 40
         Table 19. Metropolitan Statistical Areas with the Highest Location Quotients in Bioscience-
              Related Distribution, by Size of MSA, 2012 ........................................................................ 41
         Table 20. Leading States—Academic Bioscience R&D Expenditures and Growth, FY 2012 ................. 44
Page x

         Battelle/BIO State Bioscience Jobs, Investments and Innovation 2014
Table 21. Leading States—Per Capita and Concentration of Academic Bioscience R&D
Expenditures, FY 2012 ................................................................................................... 44
Table 22. Leading States—NIH Funding, FY 2013 ...................................................................... 45
Table 23. Leading States in Bioscience Venture Capital Investments, 2009-2013 ........................... 46
Table 24. Leading States—Bioscience Venture Capital Investments, 2009-2013 ............................. 47
Table 25. Leading States—Bioscience-Related Patents, 2009-2013 .............................................. 48
Table 26. Leading States–Bioscience-Related Patents by Class Group, 2009-2013 .......................... 49
Table A-1. The Bioscience Industry, NAICS Definition ................................................................ 52
Table A-2. Bioscience-Related Patents—Classes and Groups ....................................................... 55
List of Figures
Page
Figure A. Change in Bioscience Employment by State, 2001–2012 ................................................ vi
Figure B. Change in Bioscience Employment by State, 2007–2012................................................vii
Figure 1. Global Grand Challenges with Bioscience Solutions ......................................................... 1
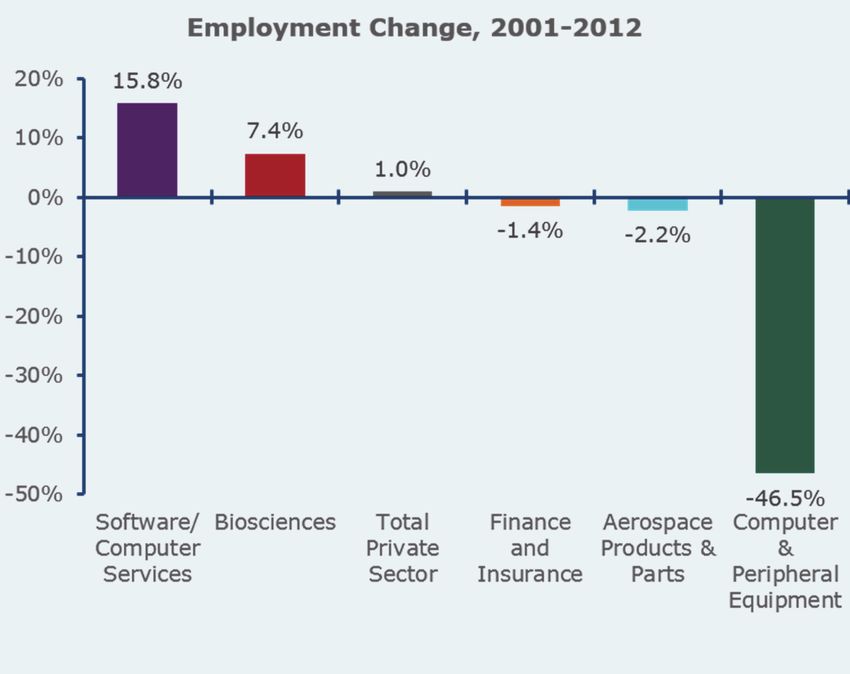
Figure 2. Trends in U.S. Bioscience and Private Sector Employment, 2001–2012 ............................. 4
Figure 3. Long-Term Employment Trend, Bioscience Industry vs. Other Technology Sectors .............. 5
Figure 4. Trends in Gross Economic Output, Bioscience Subsectors, and Total Private Sector ............. 8
Figure 5. Change in Real Average Annual Wages in the Biosciences, 2001– 2012 ........................... 10
Figure 6. U.S. Bioscience Patents by Year, 2009–2013 ............................................................... 11
Figure 7. U.S. Bioscience Patents by Class Group, 2009–2013..................................................... 12
Figure 8. National Institutes of Health Funding, 2009–2013 ($ Billions) ........................................ 13
Figure 9. U.S. Academic Bioscience R&D Expenditures, FY 2009–FY 2012 ..................................... 14
Figure 10. U.S. Bioscience Venture Capital Investments, 2009-2013 ($ Millions) ............................ 15
Figure 11. U.S. Bioscience Venture Capital Investments by Sector, 2009-2013 ($ Millions).............. 16
Page xi
Battelle/BIO State Bioscience Jobs, Investments and Innovation 2014U.S. Bioscience Industry: The National Picture
Introduction
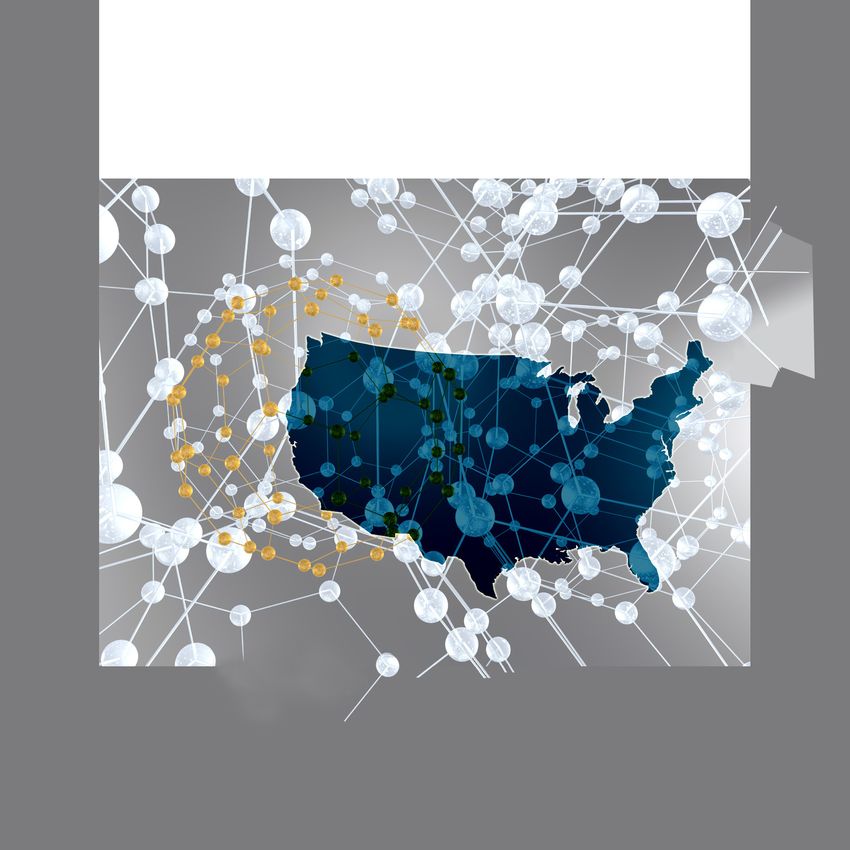
Substantial advancement in the knowledge of challenge is “how to meet the food security of a
biological processes and systems, enabled by rapidly expanding global population”, “how to
technological progress in imaging, genomics, protect and enhance human health”, “how to power
informatics, nanotechnology and other tools of and supply sustainable industries” or “how to
modern science, continue to create an environment preserve and protect our environment”, biosciences
in which bioscience innovation flourishes. Indeed, present a path forward – one rooted in the
no other area of innovation is likely to have such a development and utilization of biological
profound impact in addressing grand global knowledge, discoveries and innovations.
challenges. As Figure 1 illustrates, whether the
Figure 1. Global Grand Challenges with Bioscience Solutions
Page 1
Battelle/BIO State Bioscience Jobs, Investments and Innovation 2014Wherever technological advancements can address
global challenges there is typically a robust
Defining the Biosciences
economic opportunity. The growth of the global and
domestic bioscience industry reflects this economic An industrial definition of the biosciences is
challenging due to its diverse mix of technologies,
reality with dramatic advancements in fundamental
products, R&D focus, and companies themselves. The
biological knowledge and bioscience technologies industry includes companies engaged in advanced
being applied to the development and production of manufacturing, research activities, and technology
novel products and innovative services. As previous services but has a common thread or link in their
application of knowledge in the life sciences and how
Battelle/BIO reports have shown, bioscience in the
living organisms function. At a practical level, federal
21st Century has been a consistent producer of industry classifications don’t provide for one over-
innovation-driven economic growth – generating arching industry code that encompasses the
jobs, income and output growth for those regional biosciences. Instead, more than two dozen detailed
industries must be combined and grouped to best
economies with key bioscience assets.
organize and track the industry in its primary
activities.
In the United States, bioscience-based economic
development benefits from the world’s most The Battelle/BIO State Initiatives reports have
developed an evolving set of major aggregated
comprehensive bio-based innovation ecosystem. A
subsectors that group the bioscience industry into five
sustained leadership in bioscience R&D, a base of key components, including:
globally competitive bioscience multinationals, a Agricultural feedstock and chemicals —Firms
long-standing entrepreneurial culture, enlightened engaged in agricultural production and processing,
technology transfer and intellectual property organic chemical manufacturing, and fertilizer
manufacturing. The subsector includes industry
protections, and other key support elements have
activity in the production of ethanol and other
combined to make the United States a global hub biofuels.
for biosciences. Distributed across the nation,
Bioscience-related distribution —Firms that
present in every state, territory and major coordinate the delivery of bioscience-related products
metropolitan area, biosciences have proven to be a spanning pharmaceuticals, medical devices, and
go-to industry sector for economic developers, agbiosciences. Distribution in the biosciences is unique
in its deployment of specialized technologies including
capital and entrepreneurs. cold storage, highly regulated monitoring, and
automated drug distribution systems.
Battelle and BIO have been tracking the progress
Drugs and pharmaceuticals —Firms that develop
of the U.S. bioscience industry since 2001, and produce biological and medicinal products and
producing reports every two years that document manufacture pharmaceuticals and diagnostic
the state of the industry. This tradition continues in substances.
2014, with this report covering national, state and Medical devices and equipment —Firms that
metro bioscience performance by key subsectors develop and manufacture surgical and medical
instruments and supplies, laboratory equipment,
(see sidebar). Recent years, of course, have electromedical apparatus including MRI and ultrasound
brought challenging times to the global economy, equipment, dental equipment and supplies.
and the bioscience industry has not been immune Research, testing, and medical laboratories —
to the collapse of financial markets, consumer Firms engaged in research and development in
confidence, and purchasing power. Still, the biotechnology and other life sciences, life science
testing laboratories, and medical laboratories.
bioscience industry has proven to be resilient in the
face of economic conditions unprecedented since
the Great Depression.
Page 2
Battelle/BIO State Bioscience Jobs, Investments and Innovation 2014As both the domestic and global economies
continue to rise in the current post-recession
period, the bioscience industry remains of key
strategic importance to the economic development
of the U.S. and its individual states, territories and
metropolitan areas. Bioscience infrastructure and
intellectual capital assets in the U.S. remain world-
leading, and federal government and private sector
funding of R&D continue to presage bioscience
innovation and the commercialization of new
bioscience products and technologies. Ups and
downs in the global and domestic economy, of
course, impact the industry, but the fundamental
promise of the bioscience industry as a powerful
platform for economic and societal progress
continues unabated.
Industry Employment Data and Analysis
To measure the size, relative concentration, and
overall employment impacts of the biosciences in the
United States, Battelle tabulated employment,
establishment, and wage data for each state, the
District of Columbia, Puerto Rico, and every
metropolitan statistical area (MSA). The data were
calculated for each of the five bioscience industry
subsectors for 2001 through 2012 (though for MSA
data just 2012 data are included), the most current,
detailed, and comparable annual data available.
The Bureau of Labor Statistics (BLS) Quarterly Census
of Employment and Wages (QCEW) program data were
used as the primary data source for this industry
analysis. The QCEW provides the most accurate
employment data for detailed industries at the sub-
national level. The data represent a virtual “census” of
workers covered under the Unemployment Insurance
system, as reported by employers.
Metropolitan area data that measure employment and
the relative employment concentration in this analysis
are tabulated and presented in groups by the overall
private sector employment level of the MSA. Each MSA
is classified as either large, medium, or small with
respect to private sector employment. A “large” MSA
has total regional employment at or above 250,000. A
“medium” MSA has total employment greater than or
equal to 75,000, but less than 250,000. A “small” MSA
has employment less than 75,000. By presenting key
employment metrics among metro areas of a similar
overall size, the data provide a more useful
comparison.
For more information on the industry definition and
data used in this employment analysis, please see the
Data and Methodology appendix.
Page 3
Battelle/BIO State Bioscience Jobs, Investments and Innovation 2014The U.S. Bioscience Industry: Current Status and Recent Trends
The U.S. bioscience industry has been a signature The deep recession that began in late 2007 did not
performer for the U.S. economy. Since Battelle/BIO slow the biosciences until 2009 and 2010 when it
began reporting on the growth and development of had comparatively modest job losses. In 2011 and
the bioscience industry in 2001, there has been 2012, gains have erased one-third of these losses
significant growth in employment, business and stabilized the industry. The nation’s private
establishments, economic output and wages. In sector overall experienced a much deeper
2012, U.S. bioscience companies employed 1.62 contraction in the recession.
million personnel across more than 73,000
The long-term trend of employment from 2001 to
individual business establishments. Looking back
2012, demonstrates the strong performance of the
over the past decade, reveals an industry that has
bioscience industry as a job generation engine for
added nearly 111,000 new, high-paying jobs or 7.4
the U.S. (Table 1). Over this time period total
percent to its employment base.
private sector employment grew by only 1.0
While the industry was certainly impacted by the percent, whereas the bioscience industry grew at a
deep recession of 2008 and 2009, the bioscience rate more than seven times as high (7.4 percent).
industry weathered the recession far better than
the private sector overall (Figure 2).
Figure 2. Trends in U.S.
Bioscience and Private
Sector Employment,
2001–2012
Indexed: 2001 = 100
Source: Battelle analysis of
BLS, QCEW data; enhanced
from IMPLAN.
Table 1. Employment Changes, Total Biosciences and Total Private Sector
2001–2012 2007–2012 2009–2012
Industry Long-Term Trend (Since Previous Peak) (Recovery)
Total Biosciences 7.4% -0.4% 0.3%
Total Private Sector 1.0% -3.1% 3.3%
Note: U.S. Totals include Puerto Rico.
Source: Battelle analysis of Bureau of Labor Statistics, QCEW data; enhanced file from IMPLAN.
Page 4
Battelle/BIO State Bioscience Jobs, Investments and Innovation 2014It is evident, however, that during the recovery processing, precision agriculture, and other IT and
period of 2009–2012 the bioscience sector overall computing-intensive applications facilitate modern
experienced relatively slow employment growth of bioscience discoveries and uses. It is anticipated
0.3 percent, a rate below that of the total private that this track record of success will continue into
sector during this same time period. However, the the future given the powerful potential for
bioscience industry had not been anywhere near as bioscience solutions to global challenges and the
negatively impacted by the recession as the private pace of discovery occurring along post-genomic
sector overall, and has required less of a recovery sciences, advanced imaging technology,
rate on its way back to pre-recession employment regenerative medicine, plant improvement,
levels. industrial biotechnology and other promising
pathways.
Among technology sectors the bioscience industry,
along with the software and computer services Bioscience firms have continued to expand
sector, has been a signature employment operations and their physical footprint by adding
performer for the U.S. economy since 2001. new business establishments. The sector has
Interestingly, the software and computer services increased its base of establishments by nearly
sector is increasingly overlapping with biosciences 7,500 or 11 percent since 2007.
as bioinformatics, big data analysis, image
Figure 3. Long-Term
Employment Trend,
Bioscience Industry
vs. Other Technology
Sectors
Source: Battelle analysis
of BLS, QCEW data;
enhanced from IMPLAN.
Page 5
Battelle/BIO State Bioscience Jobs, Investments and Innovation 2014Bioscience Subsectors: Comparative U.S. Performance
While the bioscience industry contains industries at a healthy rate even through the recession.
that share a common link in the application of Medical devices and equipment have similarly
biological knowledge, there is great diversity in sustained positive employment growth.
terms of specific biological technologies and
The recession proved more challenging for
commercial applications. Obviously human health
employment in agricultural feedstock and
applications represent a very different market than
chemicals, bioscience-related distribution, and
bio-fuels or agricultural commodities. The
especially, drugs and pharmaceuticals. The drugs
Battelle/BIO definition of the bioscience industry
and pharmaceuticals sector, in particular, has
rolls-up the numerous bioscience-related
experienced a moderate decline in employment
commercial sectors (as defined by the North
over the full 2001–2012 tracking period of the
American Industry Classification System [NAICS])
Battelle/BIO analysis, and has continued to see
into five major subsectors: agricultural feedstock
declining job levels during the 2009–2012 recovery
and chemicals; drugs and pharmaceuticals; medical
period. This decline is partially due to structural
devices and equipment; research, testing and
changes in how the drugs and pharmaceuticals
medical laboratories; and, bioscience-related
subsector operates, as outsourcing of research
distribution.
grows and shifts bioscience industry employment to
There is significant variance in the employment contract research activities found in research,
trajectory of these five subsectors. As shown in testing, and medical labs.
Table 2, the research, testing and medical labs
Further summary information on subsector
subsector has been the primary engine of
performance is provided in the next section of the
bioscience industry job growth – managing to grow
report.
Table 2. U.S. Bioscience Establishment and Employment Data for 2012,
and Percent Change, 2001–2012 and 2007–2012
Establishment Data Employment Data
Bioscience Industry Count, Change, Change, Count, Change, Change,
& Subsectors 2012 2001–2012 2007–2012 2012 2001–2012 2007–2012
Agricultural Feedstock 1,772 2.9% 5.2% 76,404 -1.5% -1.0%
& Chemicals
Bioscience-related 36,793 0.6% 1.4% 442,016 6.3% -3.9%
Distribution
Drugs & 3,057 17.0% 12.0% 284,331 -7.1% -10.9%
Pharmaceuticals
Medical Devices & 7,235 16.1% 12.0% 349,432 1.5% 1.4%
Equipment
Research, Testing, & 24,231 62.4% 31.0% 467,563 28.1% 9.7%
Medical Laboratories
Total Biosciences 73,088 17.8% 11.4% 1,619,746 7.4% -0.4%
Note: U.S. Totals include Puerto Rico.
Source: Battelle analysis of Bureau of Labor Statistics, QCEW data; enhanced file from IMPLAN.
Page 6
Battelle/BIO State Bioscience Jobs, Investments and Innovation 2014Commentary on Bioscience Subsector Performance
Among the major subsectors, research, testing, and
medical labs is not only the largest of the five, but also
the fastest growing. The subsector employs more than
467,000 or nearly one in three U.S. bioscience workers
and has recorded an impressive set of steady job gains
over the full 11-year period since 2001. Over more than a
decade, the subsector has increased employment by 28
percent with an impressive annual average growth rate of
2.3 percent per year. Growth in research, testing, and
medical labs has continued in recent years despite the
recession with a 9.7 percent growth rate since 2007 when
the economy peaked.
Bioscience-related distribution companies stand just
behind research, testing, and medical labs with just over
442,000 jobs in 2012. This employee total has grown by
6.3 percent overall since 2001 though most of those job
gains were during the previous economic expansion that
ended in 2007. Since 2007, the subsector has shed
employment in 4 of 5 years and is down 3.9 percent.
Recent signs of stabilization, however, could signal an
impending rebound as the subsector grew slightly in 2011
(up 0.6 percent) and had a slight decline in 2012 (just 0.3
percent). In 2012, employment in bioscience-related
distribution accounted for 27 percent of all national
bioscience jobs.
The U.S. medical devices and equipment subsector
employed more than 349,000 in 2012 or 22 percent of all
bioscience employment. Medical device firms have
increased overall employment in 6 of the last 8 years and
since losing jobs in 2009 and 2010 amidst the recession,
have increased employment for two consecutive years.
Since 2007, subsector jobs are up 1.4 percent. Going back
more than a decade, the medical device subsector has
been relatively stable with overall employment up 1.5
percent since 2001.
Drugs and pharmaceuticals has struggled in recent
years with five consecutive years of job losses. With the
onset of the recession in 2008, the subsector began to
steadily lose jobs, and since its recent employment peak in
2007, is down 10.9 percent. Since 2007, employment
declines have averaged 2.3 percent in drugs and
pharmaceuticals but in 2012 the subsector stabilized,
declining by just 0.3 percent. In 2012, the subsector
accounted for 17 percent of the nation’s bioscience jobs.
Agricultural feedstock and chemicals, with more than
76,000 jobs in 2012, is smallest among the major
subsectors of the biosciences (5 percent of the
biosciences). Employment in the subsector has remained
relatively stable over the decade (down just 1.5 percent
since 2001) and since the economic peak in 2007 (down 1
percent). While the trend in the subsector has been
relatively flat overall since 2007, 2012 saw agricultural
bioscience firms increase employment. The 2012 job gain
of 2.3 percent, the first growth in several years, has offset
some of the job loss that occurred during the recession.
Page 7
Battelle/BIO State Bioscience Jobs, Investments and Innovation 2014The Different Story Told by “Output” total for the longer-term 2001–2012 period as well
as the more recent 2007–2012 period, and shows
Employment numbers only show one dimension of that nominal output for the biosciences has
a multi-dimensional economic reality. An industry continued to expand significantly, even during the
may, for example, be growing in terms of 2007 through 2012 period when bioscience output
production of goods and services or economic grew by 17 percent compared with 9 percent for
output, while reducing employment levels through the overall private sector. This includes output
increased productivity. Figure 4 presents the growth for drugs and pharmaceuticals despite
change in gross economic output for each of the declining employment.
five bioscience industry subsectors and the industry
Figure 4. Trends in Gross Economic Output, Bioscience Subsectors, and Total Private Sector
Source: Battelle analysis of Bureau of Economic Analysis gross output data.
Page 8
Battelle/BIO State Bioscience Jobs, Investments and Innovation 2014High Wages, High Impact Table 3. Average Annual Wages for Selected
Industries in the U.S., 2012
The importance of the bioscience industry as an
economic engine for the U.S. is further illustrated Average
Employment Sector Annual Wage
in reference to wage levels. While the total level of
employment in the nation is an important metric, Drugs & Pharmaceuticals $106,576
all jobs are not created equal when it comes to Research, Testing, & Medical Labs $91,248
wages and salaries above the national average. The Finance & Insurance $91,226
bioscience sector is particularly notable for being a
Total Biosciences $88,202
source of high-wage jobs.
Bioscience-related Distribution $85,188
The bioscience industry employs a highly skilled Professional & Technical Services $83,357
and well-educated workforce across a wide array of
Information $82,013
occupations that include laboratory technicians,
engineers, scientists, IT professionals, and Agricultural Feedstock & Chemicals $75,828
advanced production workers. The demand for Medical Devices & Equipment $75,695
these skilled professionals driving innovation and Manufacturing $60,491
deploying advanced technologies requires paying Construction $52,294
competitive wages. In addition, the high value-
Total Private Sector $49,130
adding nature of the biosciences translates into
Real Estate & Rental & Leasing $48,236
higher wages commensurate with these activities.
The biosciences, therefore, have a workforce Transportation & Warehousing $46,611
earning a substantial wage premium relative to Health Care & Social Assistance $45,407
workers in other industries. Retail Trade $27,729
In 2012, the industry-wide average annual wage Source: Battelle analysis of Bureau of Labor
for bioscience workers reached $88,202, a figure Statistics, QCEW data; enhanced file from IMPLAN.
that’s nearly $40,000 more (or 80 percent greater)
than that for the average worker in the nation’s Not only are bioscience wages significantly greater
private sector ($49,130, see Table 3). This wage than the overall private sector, but they have also
premium for bioscience workers has widened since grown at a much higher rate since 2001. Over the
2001 when it was 65 percent greater. decade, real (inflation-adjusted) average wages in
the biosciences have increased by 15 percent, or
Bioscience wages are competitive relative to other
three times the private sector growth rate (5
knowledge-intensive sectors such as finance and
percent). Strong wage growth within the
insurance and professional and technical services
biosciences is not limited to one or two subsectors,
and the information industry.
rather each of the five have seen wages grow by
Drugs and pharmaceutical manufacturers have double-digits (Figure 5).
workers earning the highest average wages in the
More recently, real wages have increased by 2
biosciences, reflecting the subsector’s high value-
percent for the biosciences since 2007, despite the
adding and innovative characteristics. These
challenging labor market situation through and
workers earned more than $106,000, on average,
after the deep national recession. Over this same
in 2012. Despite the employment challenges in the
5-year period, the overall private sector saw no
drugs and pharmaceuticals subsector, there
increase in average wages.
remains demand for highly-skilled workers in
production, scientific research, regulatory affairs,
and clinical research, among other skills.
Page 9
Battelle/BIO State Bioscience Jobs, Investments and Innovation 2014Figure 5. Change in Real
Average Annual Wages in
the Biosciences, 2001–
2012
Source: Battelle analysis of
BLS, QCEW data; enhanced
from IMPLAN.
Broader Impact of the Bioscience Industry: Employment Multipliers
The biosciences, like other industries, have At the national level, the employment multipliers
interdependent relationships with suppliers of other for each subsector are:
goods and services. The sector both supports and
Agricultural Feedstock & Chemicals: 18.1
depends upon other entities to supply everything
from business services to commodity inputs. As a Bioscience-related Distribution: 2.7
result, the industry has a regional and national
Drugs & Pharmaceuticals: 9.9
economic reach and impact that is greater than its
total direct employment or earnings might suggest. Medical Devices & Equipment: 3.9
State employment multipliers are used to measure Research, Testing, & Medical Laboratories: 2.7
the additional impact of bioscience jobs. Multipliers
The total indirect and induced employment impact
quantify the broad ripple effect where an industry
of the 1.62 million U.S. bioscience jobs is an
creates and supports additional economic activities.
additional 6.24 million jobs throughout the
Battelle has calculated state and national remainder of the economy. Together, these direct,
employment impact factors for each bioscience indirect, and induced bioscience jobs account for a
subsector using the direct-effect employment total employment impact of 7.86 million jobs. This
multipliers provided by IMPLAN Group, LLC. The amounts to an overall bioscience direct-effect
multipliers represent the total change in the employment multiplier of 4.9.
number of jobs in all industries (direct, indirect,
and induced effects) that result from a change of
one job in the corresponding industry sector.
Page 10
Battelle/BIO State Bioscience Jobs, Investments and Innovation 2014An Engine of Innovation – Patent Activity in Biosciences
The innovating nature of the U.S. bioscience from 13,344 U.S. bioscience patents issued in
industry has contributed to growth in employment, 2009, to 24,939 in 2013, the industry has
wages, and productivity. Innovation is “the act or experienced a compound annual growth rate in
process of introducing new ideas, devices, or patent activity of 16.9 percent over the five years.
methods.”1 When the innovation process leads to a This rapid growth in bioscience patents exceeds
tangible invention, the U.S. and global community overall U.S. patent growth of 11.9 percent
has a generally accepted standard whereby a novel compounded annually, over the same period.
invention may be protected via patenting. The
In terms of bioscience-related patent volumes in
generation of patents in advanced manufacturing
the U.S. (see Figure 7), biomedical products have
sectors like the biosciences is particularly important
seen the largest volume of issued patents.
given the intensity of R&D activity and capital
“Surgical and medical instruments” (31,466
expenditures typically required to advance
patents) and “drugs and pharmaceuticals” (23,681
bioscience innovations. In turn, data regarding the
patents) lead the way (together accounting for
generation of bioscience patents serves as a robust
59.5 percent of the 2009-2013 bioscience patents
metric for “bioscience industry innovation.”
issued). “Biochemistry” is also a highly productive
Within the U.S., bioscience patent volumes have arena for patent generation in the U.S. (with
been trending in a highly positive fashion. As 17,400 patents issued during the five-year period),
shown in Figure 6, the number of bioscience- as are “other medical devices and equipment” with
related patents issued in the United States has 10,604 issued patents.
increased every year for the past five years. Rising
2009 13,344
2010 19,022
Figure 6. U.S. Bioscience
Patents by Year, 2009–
2013 2011 19,978
Source: Battelle analysis of
USPTO and Thomson Reuters
Delphion Patent Analysis
Database information.
2012 22,955
2013 24,939
0 5,000 10,000 15,000 20,000 25,000 30,000
Number of Bioscience-Related Patents
1
Reference: Merriam-Webster Dictionary entry for Innovation. Accessed online at: http://www.merriam-
webster.com/dictionary/innovation
Page 11
Battelle/BIO State Bioscience Jobs, Investments and Innovation 2014Agricultural Bioscience 2,095
Biochemistry 17,400
Biomedical Imaging 2,131
Bioscience IT 880
Figure 7. U.S. Bioscience
Patents by Class Group,
2009–2013 Biotechnology 4,475
Source: Battelle analysis of
USPTO and Thomson Reuters Drugs &
Delphion Patent Analysis 23,681
Pharmaceuticals
Database information.
Surgical & Medical
31,466
Instruments
Other Medical Devices
10,604
& Equipment
Other
7,506
Bioscience-Related
0 10,000 20,000 30,000 40,000
Number of Bioscience-Related Patents
Page 12
Battelle/BIO State Bioscience Jobs, Investments and Innovation 2014Signs of Stress in the U.S. Bioscience Innovation Ecosystem
While the bioscience industry has excelled as an R&D Funding
engine of economic development for the U.S., its
ongoing success cannot be taken for granted. U.S. private sector bioscience R&D funding as a
Certainly, from a scientific standpoint there should percent of global bioscience R&D remains large, but
be little doubt that modern biosciences will has been relatively flat for the past four years.
continue to generate high impact innovations and Battelle and R&D Magazine’s “2014 Global R&D
new technologies for commercialization – the issue Funding Forecast”2 projects total U.S. corporate
is how much of that commercialization and bioscience R&D funding to be $92.6 billion (up
associated economic growth will take place in the moderately from $90.6 billion in 2013), comprising
United States? Technology-based economic 46 percent of a global $201.3 billion total.
development requires the efficient operation of a Overall bioscience research funding appears
complex innovation ecosystem – an ecosystem with relatively stable, but there are pressures on
robust R&D funding, predictable access to early- federally supported R&D. As Figure 8 illustrates,
stage and expansion capital, a supply of well- National Institutes of Health (NIH) funding has
trained and productive workers, strong intellectual declined in recent years (even without taking into
property protections, and a favorable regulatory account stimulus funding related to the American
environment that facilitates, rather than hinders, Recovery and Reinvestment Act of 2009 [ARRA]).
business development. Overall, the U.S. has
enjoyed comparatively healthy bioscience While the NIH funding environment has been
commercialization conditions, but there are cracks challenging, the overall academic bioscience
evident in the foundations that have supported research expenditures picture is certainly more
growth of this critically important industry. positive.
2009 $24.2 $4.4
2010 $24.2 $4.6
Figure 8. National Institutes 2011 $23.8
of Health Funding, 2009–
2013 ($ Billions)
Source: Battelle analysis of NIH 2012 $22.1 NIH ARRA
data.
2013 $22.3
$- $10 $20 $30
NIH Funding ($ Billions)
2
Reference: Battelle/R&D Magazine. December, 2013. “2014 Global R&D Funding Forecast.” U.S. comprised 45.9% of
projected global R&D life science funding in 2011, 46.1% in 2012, 46.4% in 2013, and a projected 46% for 2014.
Page 13
Battelle/BIO State Bioscience Jobs, Investments and Innovation 2014Figure 9 demonstrates that there has been a $4.7 billion more in academic bioscience
significant overall rise in total expenditures expenditures versus the 2009 baseline (a
between 2009 and 2012, with 2012 seeing 14.1 percent increase over the four-year period).
2009 $33,427
2010 $35,694
Figure 9. U.S. Academic
Bioscience R&D Expenditures,
FY 2009–FY 2012
2011 $38,138
Source: Battelle calculations based on
NSF Higher Education Research and
Development Survey.
2012 $38,140
$0 $10,000 $20,000 $30,000 $40,000 $50,000
Academic R&D Expenditures ($ Millions)
Capital Availability Within biosciences, venture capital investments are
quite broadly distributed by stage. It is evident,
The availability of capital is critically important to however, from Table 4 that VC is a relatively minor
sustaining the development and growth of an funder of the critically important start-up/seed
industry. In an innovation-driven, R&D intensive stage of company development, and Battelle in its
industry, like biosciences, the availability of early economic development practice continues to
stage capital is especially important – providing the observe the importance of state and local
funds necessary to sustain product development, government facilitated pre-seed and seed capital,
commercialization and business growth. and the important role that state and local
Figure 10 shows venture capital investment data economic development agencies play in the
for U.S. biosciences between 2009 and 2013. Year- formation and facilitation of angel capital networks.
to-year variability is to be expected in VC Within bioscience venture capital, biomedical
investments, and the overall trend has been a products and technologies continue to be the
moderate increase in VC funding between 2009 and largest recipient of VC investments (Figure 11). It
2013, with a peak year of investment occurring in is interesting to note the relative absence of plant
2011. Compared with other sectors, the biosciences and agricultural VC funding (especially given the
have seen a higher average annual growth rate in size and employment performance of the
VC funding over the 2009-13 period, averaging 4.5 “Agricultural Feedstock and Chemicals” subsector),
percent annually (despite the recent decline) but this is largely explained by the industry
versus 1.5 percent annual growth for non- characteristics of the agbioscience space which is
bioscience sectors. dominated by large-scale multinational
corporations that are not active in VC markets.
Page 14
Battelle/BIO State Bioscience Jobs, Investments and Innovation 2014–
US Bioscience VC Investments, 2009–2013 ($ Millions)
2009 $8,403
2010 $9,109
2011 $11,792
2012 $10,171
2013 $9,927
$- $2,000 $4,000 $6,000 $8,000 $10,000 $12,000 $14,000
Figure 10. U.S. Bioscience Venture Capital Investments, 2009-2013 ($ Millions)
Source: Battelle analysis of Thomson Reuters Thomson ONE database.
Table 4. U.S. Bioscience Venture Capital Investments by Stage, 2009-2013
Total VC Average Average Investment
Number of Number of Investments, Investment Per Per Company,
Stage Deals Companies $ Millions Deal, $ Millions $ Millions
Start-Up/Seed 706 495 $3,303 $4.68 $6.67
Early Stage 2,009 1,115 $14,755 $7.34 $13.23
Expansion 1,021 574 $7,887 $7.73 $13.74
Later Stage 2,958 1,245 $16,231 $5.49 $13.04
Buyout or Acquisition 192 156 $3,120 $16.25 $20.00
Other 244 161 $4,105 $16.82 $25.50
Grand Total 7,130 3,746 $49,402 $6.93 $13.19
Source: Battelle analysis of Thomson Reuters Thomson ONE database.
Page 15
Battelle/BIO State Bioscience Jobs, Investments and Innovation 2014U.S. Bioscience VC Investments, 2009–2013 ($ Millions)
Biotech-Human $18,121
Medical Therapeutics $10,908
Med/Health-Info Tech $4,752
Pharmaceutical $3,641
Med/Health-Products $2,274
Med/Health-Services $2,150
Biotech-Industrial $1,924
Medical Diagnostics $1,737
Biofuels $1,255
Biotech-Equipment $863
Biotech-Research $855
Biotech-Animal $567
Biosensors $354
$- $2,500 $5,000 $7,500 $10,000 $12,500 $15,000 $17,500 $20,000
Figure 11. U.S. Bioscience Venture Capital Investments by Sector, 2009-2013 ($ Millions)
Source: Battelle analysis of Thomson Reuters Thomson ONE database.
International Competition and the R&D funding and business development capital are
important factors in generating a favorable national
U.S. Operating Environment
ecosystem for bioscience business growth, but
The U.S. is far from alone in recognizing the multiple other factors must also be considered –
importance of the biosciences to modern economic many of which are highly influenced by policy
development, and competition for bioscience makers. Chief among these additional government-
business growth is intense. This is noted in a recent influenced factors are:
report3 by Battelle on the future of the U.S.
Research funding that supports both the
innovative biopharmaceuticals industry:
understanding of the basic biological precepts
While opportunities abound for advancing and their ultimate translation into bioscience-
biopharmaceutical R&D and manufacturing in related products and services.
the U.S., future growth is not a given as other
Regulatory systems firmly grounded in science
nations race to compete for the economic
and predictable in their application with the
benefits that these innovative activities bring.
ability to adapt as new technologies are
Given the economic contributions of this and
developed.
other R&D-intensive industries, the U.S. is now
facing increasing competition not just from Strong protections for intellectual property,
developed countries that want to expand their both domestically and internationally with the
own innovative capacity in these areas, but ability to adapt as new technologies are
also from emerging economies such as Brazil, developed.
China, and Singapore that are laying the
Page 16
groundwork for future growth.
Battelle/BIO State Bioscience Jobs, Investments and Innovation 2014You can also read