24x7 Power for All: Strategies for Karnataka - March 2016 - Selco Foundation
←
→
Page content transcription
If your browser does not render page correctly, please read the page content below
24x7 Power for All:
Strategies for Karnataka

                March 2016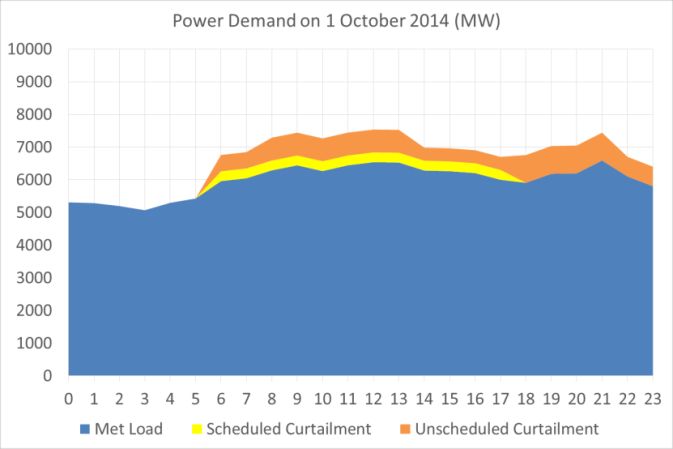
24x7 Power for All:
Strategies for Karnataka

Karnataka Electricity Regulatory Commission
       CSTEP and SELCO Foundation
                March, 2016
24x7 Power for All:
Strategies for Karnataka
CSTEP SELCO Foundation
Deepthi Swamy Felix Varghese
Nihit Goyal Juhi Chatterjee
Mohd. Saquib Vivek Shastry
Karnataka Electricity Regulatory Commission
CSTEP and SELCO Foundation
March, 2016Center for Study of Science, Technology and Policy (CSTEP) is a private, not-for-profit (Section 25) Research Corporation registered in 2005. CSTEP’s vision is to enrich the nation with science and technology-enabled policy options for equitable growth. SELCO Foundation is a 5 year old organization that engages in field-based R&D and Ecosystem building for deployment of clean energy solutions that alleviate poverty in rural and urban poor areas. The organization works closely with practitioners in the social sector, energy entrepreneurs and partners from various developmental sectors. The Policy Group at SELCO Foundation carries out research and advocacy interventions in the areas of Decentralized Renewable Energy (DRE), micro entrepreneurship and social enterprise. Designing and Editing by CSTEP Disclaimer This report has been jointly prepared by CSTEP and SELCO Foundation on behalf of the Karnataka Electricity Regulatory Commission (KERC). The report uses data that are in the public domain, and those provided by KERC and the Electricity Supply Companies (ESCOMs). While every effort has been made for the correctness of data/information used in this report, neither the authors nor CSTEP accept any legal liability for the accuracy or inferences for the material contained in this report and for any consequences arising from the use of this material. © 2016 Center for Study of Science, Technology and Policy (CSTEP) and SELCO Foundation No part of this report may be disseminated or reproduced in any form (electronic or mechanical) without permission from CSTEP and SELCO Foundation. This report should be cited as: CSTEP & SELCO Foundation, (2016). 24x7 Power for All: Strategies for Karnataka, (CSTEP-Report-2016-01). March, 2016 Center for Study of Science, Technology and Policy SELCO Foundation # 18, 10th Cross, Mayura Street, #690, 15th Cross, Papanna Layout, Nagashettyhalli, RMV II Stage, 2nd Phase J P Nagar Bangalore-560094 Karnataka, INDIA Bengaluru – 560078 Tel.: +91 (80) 6690-2500 Email: vivek@selcofoundation.org Fax: +91 (80) 2351-4269 Website: www.selcofoundation.org Email: cpe@cstep.in Website: www.cstep.in
Acknowledgements
The authors would like to express their gratitude to former Chairman, KERC, Mr. M. R. Sreenivasa
Murthy for giving us the opportunity to conduct this study as well as guidance in shaping the
report. The report was completed with the generous support from the officers of KERC – Mr. B. R.
Manjunath, Mr. H. S. Sheshadri, Mr. Y. K. Nagaraja and Technical Advisor to KERC, Mr. Jagannath
Gupta. Their efforts are gratefully acknowledged. Members of the Commission are duly
acknowledged for their valuable review feedback.
We are immensely thankful to KPTCL and BESCOM for their kind cooperation in providing us with
the data required for the analysis.
The report benefitted from inputs provided by colleagues at CSTEP at various stages. In particular,
we would like to thank Dr. Jai Asundi and Ms. Meera Sudhakar for suggestions towards improving
the report and Ms. Nagalakshmi Puttaswamy for helping with literature review. Finally, we are
grateful to Dr. Anshu Bharadwaj for his continued support and encouragement.
SELCO Foundation is grateful to Dr. Satish Agnihotri and Mr. Santosh Harish for the framework and
their valuable comments on the analysis. Thanks also to our colleagues Ms. Lakshmi Sundaresh and
Mr. Jonathan Bassett for helping with data analysis, Mr. Vikshut Mundkur and Ms. Surabhi
Rajagopal for their guidance throughout the report, and Dr. Harish Hande for his continued
support.
List of Abbreviations

AC           Air Conditioner
Ag DSM       Agricultural Demand Side Management
APPC         Average Power Purchase Cost
APRHVDS      Andhra Pradesh Rural High Voltage Distribution System
AT&C         Aggregate Technical & Commercial
BEE          Bureau of Energy Efficiency
BESCOM       Bangalore Electricity Supply Company
BJ/KJ        Bhagya Jyothi/ Kutir Jyothi
BPL          Below Poverty Level
BTPS         Bellary Thermal Power Station
CAGR         Compounded Average Growth Rate
CEA          Central Electricity Authority
CERC         Central Electricity Regulatory Commission
CESC         Chamundeshwari Electricity Supply Company
CFL          Compact Fluorescent Lamp
CGS          Central Generating Stations
CKms         Circuit Kilometers
CRT          Cathode Ray Tube
DDG          Decentralised Distributed Generation
DDUGJY       Deendayal Upadhyaya Gram Jyoti Yojana
DISCOMs      Distribution Companies
DRE          Decentralised Renewable Energy
DSM          Demand Side Management
DTC          Distribution Transformer Center
EE           Energy Efficiency
EPS          Electric Power Survey
ESCOMs       Energy Service Companies
FiTs         Feed in Tariffs
FoR          Forum Of Regulators
FRI          Feeder Reliability Index
FY           Financial Year
FYP          Five Year Plan
GDP          Gross Domestic Product
GHG          Green House Gas
GoK          Government of Karnataka
GSDP         Gross State Domestic Product
GST          Goods and Services Tax
GW           Giga Watt
GWh          Giga Watt hour
HESCOM       Hubli Electricity Supply Company
HT           High Tension
HTLS         High Temperature Low Sag
HVAC         Heating Ventilating and Air Conditioning
HVDC         High Voltage Direct Current
HVDS         High Voltage Distribution System
INR          Indian National Rupee
IPPs         Independent Power Producers
IPs          Irrigation Pump Sets
ITIs         Industrial Training Institutes
JGY          Jyothi Grama Yojana
JNNSM    Jawaharlal Nehru National Solar Mission
KERC     Karnataka Electricity Regulatory Commission
KPTCL    Karnataka Power Corporation Transmission Limited
KREDL    Karnataka Renewable Energy Development Limited
kV       kilo Volt
kWh      kilo Watt hour
LCD      Liquid Crystal Display
LED      Light Emitting Diode
LT       Low Tension
MESCOM   Mangalore Electricity Supply Company
MUs      Million Units
MVA      Mega Volt Amps
MW       Mega Watt
M&V      Measurement and Validation
NABARD   National Board of Agricultural And Rural Development
NEP      National Electricity Policy
NJY      Niranthara Jyothi Yojana
PCKL     Power Company of Karnataka Ltd.
PLF      Plant Load Factor
PPA      Power Purchase Agreement
PV       Photo Voltaic
RE       Renewable Energy
RRBs     Regional Rural Banks
RTPS     Raichur Thermal Power Station
SAIDI    System Average Interruption Duration Index
SAIFI    System Average Interruption Frequency Index
SCADA    Supervisory Control And Data Acquisition
SCEF     State Clean Energy Fund
SLDC     State Load Dispatch Center
SME      Small and Medium Enterprise
SPV      Special Purpose Vehicle
T&D      Transmission & Distribution
TIMES    The Integrated MARKAL EFOM System
UDAY     Ujwal DISCOM Assurance Yojana
UEC      Unit Electricity Consumption
VAT      Value Added Tax
Wp       Watt peak
YoY      Year on Year
Executive Summary
In June 2014 the Government of India launched the Power for All initiative with an aim to provide
24x7 power across the country by 2019. Subsequently, a sub-committee of the Forum of Regulators
(FoR) prepared a national roadmap for the initiative. FoR defined the scope of the initiative to
include reliable 24x7 power supply to domestic, industrial, and commercial consumers, power
supply to irrigation pump sets for 8 to 10 hours, and access to all connected households by 2018 –
19. The roadmap made recommendations for fuel supply, generation, transmission and distribution
sectors, and demand-side management. In view of the federal structure of India’s power sector, a
key recommendation of the FoR study was to formulate state level strategies to meet the objectives
of 24x7 Power for All.
With reference to the context mentioned above, this study was commissioned by Karnataka
Electricity Regulatory Commission (KERC) to identify key implementable strategies for the state of
Karnataka for achieving the objectives of 24x7 Power for All. The study describes the power supply
scenario in the State including estimates for future energy demand. The status of 24x7 power
supply is analysed along the dimensions of access (electrification), adequacy (per capita
consumption), affordability (cost of supply), availability (duration of supply), and reliability. Future
plans for generation capacity are analysed to determine the range of foreseeable shortfalls till
Financial Year (FY) 2020. Transmission capacity augmentation, renewable energy and energy
efficiency options available to meet future demand are discussed in detail. The report concludes
with the strategies that Karnataka should focus on in order to achieve the objectives of 24x7 Power
for All.
Key Findings
Power Supply Scenario: The current installed capacity in the State is 15,568 Mega Watt (MW).
Thermal and large-hydro sources contribute to nearly two thirds of this capacity. Short-term power
purchases have accounted for a significant portion of supply in the previous years. The quantity
purchased has grown at a Compounded Annual Growth Rate (CAGR) of 22% between FY2010 and
FY2015. In FY2015, the sector had an energy and peak deficit of 4.3% and 4.5% respectively.
Aggregate energy demand is expected to increase to about 1,12,675 MUs by FY2020, assuming that
the shortages and losses are expected to continue. Peak demand is expected to continue to grow at
a CAGR of 5.6% over the next five years, to reach 16,000 MW by FY2020.
Status of 24x7 power supply in Karnataka: This is assessed along the dimensions of access,
adequacy, affordability, availability, and reliability. Village electrification rate in the state is
currently at 99.5% in comparison to the national average of about 92-93%. However, nearly one
million households still do not have access to electricity in the state. Districts with particularly low
electrification rates are: Yadgir (78%), Bijapur (81%), Kodagu (82%) and Belgaum (84%). With a
per capita electricity consumption of nearly 1,100 kilo Watt hour (kWh) in 2012, the consumption
in Karnataka was above the country average of 884 kWh. However, its per capita consumption is
lower than that of comparable states such as Gujarat (1,663 kWh), Tamil Nadu (1,277 kWh), and
Andhra Pradesh (1,157 kWh).
Over the past four years, the peak demand was typically observed during the morning and the
evening, and the rate of growth of peak demand was higher than the average demand throughout
the year. For an illustrative analysis of an average daily load curve under Bangalore Electricity
Supply Company (BESCOM), it was observed that the consumption by domestic category mainly
gave rise to the shape of the morning and evening peaks. In terms of reliability of supply, in most
towns and cities, reliability was close to 97%, with the average being at least 93%. However rural
areas were lower on an average, at about 81%. A comparison with other states reveals that in terms
of affordability of power, on an average, electricity in Karnataka is not too expensive or highly
priced. At INR 4.76/kWh, it is cheaper than the national average of INR 4.79/kWh.
Generation Plan: The total energy generated from the current installed capacity is about 78,500
MUs, assuming typical operational capacity factors for the various sources. As per the current plans
for capacity augmentation over the next five years, it is estimated that 25,918 MW of installed
capacity will be available in FY2020 if there are no slippages in project commissioning timelines.
Based on generation estimates from this capacity as per typical capacity factors, energy shortfalls
are expected to increase from about 2,800 MUs in FY2016 to about 5,000 MUs in FY2019. Peak
shortfalls are expected to range from about 460 MW in FY2016 to nearly 300 MW in FY2019.
Hence, with the possibility of continued shortages even with current plans, in order to achieve 24x7
supply power supply, the state will need to implement the following additional options.
The performance of state-owned thermal plant can be improved by re-negotiation of fuel supply
contracts based on the analysis of cost benefits of washed coal vs. unwashed coal. This should be
accompanied by estimation of need for refurbishment and modernisation of plants, and
arrangements for mining coal in captive mines.
Long-term power purchase from Independent Power Producers (IPPs), captive plants, and
stranded capacity can be initiated. Exported volumes can be replaced by procurement through
long-term Power Purchase Agreements (PPAs). Tendering route for long term procurement of
power from IPPs can be explored, with contracting of peak power from stranded plants in the
southern region by offering peak tariffs
Transmission and Distribution Plan: In order to meet the forecasted demand with generation
capacity addition plans, adequate planning for augmenting both transmission (intra-state and inter-
state) and distribution networks will be critical. As per the current capacity augmentation plans,
1,356 substations are expected to be available by the end of the 13th Five Year Plan (FYP). For
managing reactive power in the network, it is recommended to initiate load characteristic studies,
increase the minimum Power Factor (PF) for Low Tension (LT) consumers to 0.9 in line with other
states, and place shunt capacitors in 11 kilo Volt (kV) distribution networks. Distribution
Companies (DISCOMs) and Karnataka Power Transmission Corporation Limited (KPTCL), need to
jointly develop maintenance practices and conduct detailed harmonics and equipment failure
analyses to ensure reliability of reactive power sources.
The current Transmission & Distribution (T&D) losses in the state are at an average of 20.6%. If
reduced to 12%, resultant savings in terms of energy would be around 4,200 MUs costing about
INR 1,470 Crore per year at an Average Power Purchase Cost (APPC) of INR 3.5/ kWh. Main
recommendations for the distribution sector include regular tariff revisions, uptake of financial
restructuring measures recommended under the recently launched Ujwal DISCOM Assurance
Yojana (UDAY) scheme, periodic Distribution Transformer Center (DTC) level metering to reduce
losses in the network, phased implementation of feeder separation along with impact assessment,
and initiation of High Voltage Distribution System (HVDS) pilots.
Role of Renewable Energy (RE): Karnataka has a high RE potential of about 30,000 MW. If
implementation barriers are resolved, up to 10,000 MW/ 17,250 MUs of wind generation capacity
can be added at a cost of INR 60,000 crore by FY2020. Similarly, up to 4000 MW/ 6300 MUs of solar
capacity can be added by FY2020 at a cost of INR 32,000 Crore. Grid-connected RE capacity
addition can be facilitated with effective implementation of single window clearance mechanism,
facilitating project land allocation, and strengthening grid infrastructure. Support for low RE
footprint technologies is recommended, along with the creation of a Renewable Energy
Management Center (REMC) to manage grid integration aspects from intermittent renewable
sources.
To enable 24x7 power supply, Distributed Renewable Energy (DRE) solutions can play an
important role in offsetting some of the issues associated with large-scale plants. They can offer
long-term solutions for energy access through some critical enablers such as encouraging solar
pump usage, and increased adoption of rooftop solar PV through suitable tariffs. It is also
recommended to provide Value Added Tax (VAT) relief for RE devices and spare parts, recognise
decentralised solar plants as industry, and evaluate the usage of DRE systems as an alternative to
Bhagya Jyothi (BJ) installations.
A conducive ecosystem for promotion of DRE can be created by including specific targets for DRE
under the state RE plans, and evaluating hybrid RE systems for micro and small-scale industries.
Further facilitating factors include conducting an electricity access mapping exercise, and
developing a skilled workforce to handle the maintenance of DRE technologies.
Role of Energy Efficiency (EE): EE measures that can be implemented by the state with the potential
for significant savings include Agricultural Demand-Side Management (Ag DSM) through efficient
Irrigation Pump Sets (IPs), and efficiency in end-use consumption from appliances and lighting.
The potential of energy savings from efficient pumping is gradually being recognised in different
parts of Karnataka. Savings in the range of 30-70% have been achieved in pilot studies at
Dodaballapur where 280 IPs were replaced, along with feeder separation, metering and HVDS lines
for electricity supply. Further, efficient irrigation practices were employed and farmers’ awareness
regarding cropping patterns and cultivation practices was increased. Across the state, it is
estimated that this option can be achieved at a cost of INR 200 Crore, with an energy saving of 1,
440 MUs and avoided capacity of 33 MW by 2020.
To estimate savings from energy efficient appliances, fans, refrigerators, television sets, air
conditioners were modelled in this study. An EE scenario can be achieved in the long-term at a cost
of INR 1,260 Crore, with an energy saving of 1,100 MUs and avoided capacity of 25 MW by FY2020.
Within lighting, technologies for both point and linear lighting are incorporated. In the case of
uptake of improved efficiency measures in lighting, it is assumed that the State will successfully tap
into opportunities for improving efficiencies, which would cost INR 1,030 Crore with a savings of
about 4,700 MUs and 11 MW by 2020.
In the residential sector, the state could incentivise efficient appliances to reduce their higher
upfront costs through appropriate financing mechanisms, such as loans and rebates. Establishment
of a State Clean Energy Fund (SCEF) presents one approach to facilitate such financing. DSM pilots
can be scaled up after measuring improvements from current consumption levels, and
establishment of Measurement & Validation (M&V) protocols to measure savings. Initial investment
risks need to be mitigated through appropriate financing mechanisms, which can be
operationalised through an Ag DSM Revolving Fund.
Contents

1.      Introduction...................................................................................................................................................................... 1
2.      Power Supply Scenario ................................................................................................................................................ 3
        2.1. Present Power Supply Position....................................................................................................................... 3
        2.2. Estimation of Future Demand for Providing 24x7 Power ................................................................... 8
3.      24x7 Power for All: The Challenge ....................................................................................................................... 10
        3.1. Access ..................................................................................................................................................................... 10
        3.2. Adequacy ............................................................................................................................................................... 12
        3.3. Availability............................................................................................................................................................ 12
        3.4.          Reliability ......................................................................................................................................................... 14
        3.5.          Affordability .................................................................................................................................................... 14
4.      Generation Plan............................................................................................................................................................ 16
        4.1.          Existing Generation ...................................................................................................................................... 16
        4.2.          Future Generation Plans ............................................................................................................................ 16
        4.3.          Available Capacity to meet Future Energy Demand ....................................................................... 17
        4.4.          Available and Required Capacity to meet Future Peak Demand............................................... 18
        4.5.          Recommendations for Supply Side ........................................................................................................ 18
5.      Transmission and Distribution (T&D) Plan ..................................................................................................... 21
        5.1.          Transmission System Plan ........................................................................................................................ 21
        5.2.          Distribution System ..................................................................................................................................... 23
        5.3.          Recommendations for Distribution System....................................................................................... 24
6.      Renewable Energy ...................................................................................................................................................... 26
        6.1.          Grid-connected Renewable Energy ....................................................................................................... 26
        6.2.          Decentralised Renewable Energy (DRE)............................................................................................. 27
7.      Energy Efficiency ......................................................................................................................................................... 31
        7.1.          Agricultural Demand-side Management (Ag DSM)......................................................................... 31
        7.2.          Energy Efficiency in Appliances .............................................................................................................. 32
        7.3.          Energy Efficiency in Lighting ................................................................................................................... 32
         7.4. Recommendations for Improving Energy Efficiency .......................................................................... 33
8.      Strategies for Achieving 24x7 Power Supply................................................................................................... 34
         8.1. Key Strategies...................................................................................................................................................... 35
References................................................................................................................................................................................ 37
Annexure 1: Detailed List of Generating Stations (FY2015) ............................................................................... 40 Annexure 2: Month-wise Short Term Purchases in FY2015 ............................................................................... 43 Annexure 3: Month-wise Power Supply Position in FY2015 .............................................................................. 44 Annexure 4: Methodology for Demand Estimation................................................................................................. 45 Annexure 5: Analysis of SCADA Data... ......................................................................................................................... 46 Annexure 6: Power Reliability Measures .................................................................................................................... 52 Annexure 7: Projects for Capacity Addition under 12th & 13th Plan................................................................. 53 Annexure 8: Existing methods for Load Management in Rural Areas ............................................................ 58 Annexure 9: Illustrative Costs of DRE Systems......................................................................................................... 60 Annexure 10: Estimation of Savings from Energy Efficiency in Appliances ................................................. 62
List of Figures
Figure 1: Installed Capacity in Karnataka in FY2015 (MW) - By Ownership.................................................. 4
Figure 2: Installed Capacity in Karnataka in FY2015 (MW) - By Fuel Source ................................................ 4
Figure 3: Short-term Energy Purchased and Costs (FY2008 – FY2015)........................................................... 5
Figure 4: Unrestricted and Met Demand in the State (FY2008 - FY2015) ....................................................... 6
Figure 5: Unrestricted Peak Demand vs. Peak Supplied from FY08 to FY15 ................................................. 7
Figure 6: Category-wise electricity consumption in Karnataka and other states ......................................... 8
Figure 7: Electrification Rates for Karnataka and other Comparable States (2010 & 2011) ................ 10
Figure 8: District-wise Status of households having Access to Electricity .................................................... 11
Figure 9: Per-capita electricity consumption in Karnataka and other states (2007 & 2012) ............... 12
Figure 10: Observed peak demand on typical days in 2014 (MW) .................................................................. 13
Figure 11: Consumer-category-wise consumption – BESCOM (FY2014) ..................................................... 13
Figure 12: Cost vs. Generation from Different Sources in Karnataka (FY2014) ......................................... 15
Figure 13: Investments in Transmission Network (FY2005 - FY2015) ......................................................... 22
Figure 14: Frequencies of observed morning and evening peaks (2014)..................................................... 46
Figure 15: Load Duration Curves (2011-2014)........................................................................................................ 47
Figure 16: Monthly Peak Load (2011-2014) ............................................................................................................. 47
Figure 17: Seasonal Variation in Power in Rural Feeders under BESCOM (2014).................................... 48
Figure 18: Seasonal Variation in Power in Rural Feeders under CESC (2014) ........................................... 48
Figure 19: Urban and Rural Power Availability in BESCOM (FY2014)........................................................... 49
Figure 20: Urban and Rural power availability in CESC ....................................................................................... 50
Figure 21: Urban and Rural power availability in MESCOM ............................................................................... 50
Figure 22: Urban and Rural power availability in Tumkur ................................................................................. 51
Figure 23: NJY analysis for BESCOM across Selected Dates from 2012-2014 ............................................. 58
List of Tables
Table 1: Current Installed Capacity (MW) in FY2015 ...............................................................................................3
Table 2: Year-wise Costs and Quantity of Short-term Power Purchases in Karnataka...............................5
Table 3: Sector-wise Projected Demand (Million Units) (MUs) ............................................................................8
Table 4: Future Projected End-use Demand (MUs) ...................................................................................................9
Table 5: Future Projected Peak Demand (MW) with 9% CAGR ............................................................................9
Table 6: Reliability Index (in %) for 5 DISCOMs in Karnataka for FY2015 ................................................... 14
Table 7: Average Cost of Power and Tariffs for Karnataka and Comparable States (FY2014)............. 15
Table 8: Energy Generated from Various Fuel Sources (FY2015) .................................................................... 16
Table 9: Planned Capacity Addition (FY2015 to FY2020) (MW) ...................................................................... 17
Table 10: Future Capacity Addition and Expected Energy Shortfalls (MUs)................................................ 18
Table 11: Future Capacity Addition and Expected Peak Shortfalls (MW) ..................................................... 18
Table 12: Year-wise Plant Load Factors (PLFs) of State-owned Thermal Plants ....................................... 19
Table 13: Region-wise Stranded Capacity (MW) (FY2013)................................................................................. 20
Table 14: Details of KPTCL Network (FY2015) ........................................................................................................ 21
Table 15: Proposed Addition of Substations (S/S) by the end of 2016 – 17 ................................................ 22
Table 16: Proposed Addition of Substations (S/S) by the end of 2021 – 22 ................................................ 22
Table 17: ESCOM-wise T&D Losses (FY2014) .......................................................................................................... 23
Table 18: Status of Grid-Connected RE Capacity in Karnataka (FY2015) ..................................................... 26
Table 19: Off-grid Projects Sanctioned under JNNSM (FY2015) ....................................................................... 28
Table 20: Costs of Incremental Capacity Addition by FY2020 ........................................................................... 34
Table 21: Detailed List of Generating Stations in Karnataka (FY2015).......................................................... 40
Table 22: Month-wise Short-term Power Purchases in Karnataka (FY2015) ............................................. 43
Table 23: Month-wise Power Supply Position during FY2015 (in terms of peak demand) (MW) ..... 44
Table 24: SAIFI and SAIDI for 5 DISCOMs in Karnataka for FY2014 ............................................................... 52
Table 25: Projects for Capacity Addition under 12th & 13th Plans ................................................................. 53
Table 26: Approximate Costs of Solar Pump Installations ................................................................................... 60
Table 27: JNNSM Subsidies for Solar Pumps ............................................................................................................. 60
Table 28: Costs and Beneficiaries for Bhagya Jyothi scheme (FY2013) ......................................................... 60
Table 29: Cost Comparion of BJ Connection and Solar Home System ............................................................. 61
Table 30: Domestic Appliances Modelled in the Study.......................................................................................... 62
Table 31: Lighting Appliances Modelled in the Study ............................................................................................ 62
Table 32: Technologies Available for Street Lighting ............................................................................................ 63
1. Introduction

The National Electricity Policy of 2005 (MoP, 2005) had strived to provide electricity access to all
within five years and eliminate peak and average energy deficits by 2012. While the country has
witnessed significant improvement in village and household electrification over the last decade,
over 30% of the population still does not have reliable electricity access. Also, at about 900 kWh,
per capita electricity consumption in the country is only one-third of the world average (The
Economist, 2012) and over 300 million people are yet to receive access to electricity (Banerjee S. G.,
2013). Even those with access to electricity receive unreliable and erratic supply, and the country
has both peak and energy deficits of about 9% each (MoSPI, 2013).
In a bid to improve the situation, the government launched the Power for All initiative in 2014. This
initiative aims to provide 24x7 power across the country by 2019 through various schemes to
address specific challenges (MoP, 2014). Illustratively, the Deendayal Upadhyaya Gram Jyoti Yojana
(DDUGJY) envisages feeder separation and strengthening of sub-transmission and distribution
network, including complete metering.
As part of this initiative, a sub-committee of the    Forum of Regulators (FoR) was tasked with
preparing a national roadmap for 24x7 Power for       All. FoR defined the scope of the initiative as
reflected in the objectives below (FoR, 2014). The    roadmap suggested several recommendations
spanning fuel supply, generation, transmission        and distribution sectors, and demand-side
management.

The objectives of the roadmap developed by the FoR were as follows:
       -   Reliable 24x7 power supply to domestic, industrial, and commercial consumers by
           2018-19
       -   Power supply for irrigation pump for 8 to 10 hours a day depending upon the agro-
           climatic factors in different States; and
       -   Access to all connected households by 2018-19
In recognition of the federal structure of India’s power sector, a key recommendation of the FoR
study was the formulation of state-level strategies to meet the objectives of 24x7 Power for All. The
state of Andhra Pradesh was the first to prepare such a plan and has already signed a Memorandum
of Understanding with the Ministry of Power to roll out the initiative. Subsequently, Rajasthan and
Delhi have also developed plans which are ready for implementation. To this end, the Karnataka
Electricity Regulatory Commission (KERC), commissioned this study to identify state-specific
strategies for achieving 24x7 power supply for all.
To give a brief overview of the power sector in Karnataka, the main institutions in the sector are the
state-owned Karnataka Power Corporation Ltd. (KPCL) for generation, the state-owned Karnataka
Power Transmission Corporation Ltd. (KPTCL) for transmission and five Electricity Supply
Companies (ESCOMs) in Bangalore, Mangalore, Gulbarga, Hubli, and Mysore, for distribution of
electricity to consumers. Additionally, Hukkeri Rural Electric Cooperative Society distributes power
to consumers in Hukkeri Taluk and a few other villages in the area. The State Load Dispatch Center
(SLDC) performs the role of system operator in the state’s power system. In 2007, the state set up
the Power Company of Karnataka Ltd. (PCKL), which is responsible for the procurement of power
on behalf of the ESCOMs, both through long-term (Power Purchase Agreements (PPAs)) and short-
term transactions.
Recognising the importance of the power sector in the economic progress in the State, Karnataka
was one of the first Indian states to implement power sector reforms with the enactment of the

                                                  1
Karnataka Electricity Reforms Act in 1999. KERC was established as the regulatory authority of the
state’s power sector. Among other functions, it regulates the tariff for different categories of
consumers. In the recent past, Karnataka state has been experiencing shortages consistently. The
State has taken various initiatives to implement projects in the public and private sector for
augmenting generation capacity.
This study analyses the status of 24x7 power supply in the state along the dimensions of access
(electrification), adequacy (per capita consumption), affordability (cost of supply), availability
(duration of supply), and reliability. The report concludes with the key strategies that Karnataka
should focus on in order to achieve the goal of 24x7 Power for All.
The report is structured as follows: Section 2 describes the power supply scenario in the State
which includes estimates for future energy demand; Section 3 deals with the status of power supply
in Karnataka along the dimensions of access, adequacy, affordability, availability, and reliability. It
also highlights the challenges faced by the state; Sections 4 and 5 lay out future plans for generation
and transmission capacity respectively, till FY2020. Sections 6 and 7 discuss the Renewable Energy
(RE) and Energy Efficiency (EE) options available to meet future demand; Section 8 concludes with
the summary of key strategies that the State needs to implement in order to achieve 24x7 Power for
All.
22. Power Supply Scenario
In this section, we assess the status of the power sector in the State, followed by a discussion of the
expected energy and peak demand till FY2020.
2.1. Present Power Supply Position
This section provides a snapshot of the power sector in Karnataka, in terms of installed capacity of
supply, trends in energy and peak deficits, and category-wise consumption.
2.1.1. Installed Capacity of Supply
The current capacity available on the supply side is listed in Table 1. In terms of ownership, state-
owned thermal, large-hydro, wind, and solar plants account for about 42% of the total installed
capacity. IPPs contracted under long-term PPAs contribute nearly as much at 43%. Of the
remaining, most of the capacity is accounted by the state’s share in Central Generating Stations
(CGS) (Figure 1).
In terms of fuel source, nearly two-thirds of the installed capacity is in thermal and large-hydro
sources, at 47% and 24% respectively. Most of the remaining capacity is accounted for by wind at
13% of the total share. Small hydro and nuclear power together account for 8% of the total capacity
(Figure 2). A detailed list of plant-wise capacity for each source is provided in Annexure 1.
Table 1: Current Installed Capacity (MW) in FY2015
By Fuel Type Installed By Ownership Installed
Capacity Capacity
(MW) (MW)
Large Hydro 3,674 State 6,499
Thermal 7,362 IPP 6,679
(including diesel)
Nuclear 501 CGS 2,258
Solar 91 Others 132
(inter-state hydro)
Wind 2,086
Small Hydro 813
Biomass 89
Co-generation 953
TOTAL 15,568 MW
Source: PCKL
3Installed Capacity in FY2015 (in MW)
(by ownership)
Others, 132, 1%
CGS, 2258, 14%
State, 6499, 42%
IPPs, 6679, 43%
Figure 1: Installed Capacity in Karnataka in FY2015 (MW) - By Ownership
Installed Capacity in FY2015 (in MW)
(by fuel source)
Biomass, 89, 1% Co-gen, 953, 6%
Solar, 91, 1%
Large Hydro ,
3674, 24%
Wind, 2086, 13%
Nuclear, 501, 3%
Small Hydro, 813,
5%
Thermal
(including diesel),
7362, 47%
Figure 2: Installed Capacity in Karnataka in FY2015 (MW) - By Fuel Source
Short-term power purchases have accounted for a significant portion of the supply in the previous
years. The state is increasingly relying on them, often in the peak months of the year when the rates
are expensive, in order to meet the growing energy demand. The quantity purchased has grown at a
CAGR of nearly 27% between FY2010 and FY2015. In FY2015, 5,867 MUs of short-term power was
purchased through exchanges and bilateral transactions. The year-wise costs and quantity of short-
term power purchases in the recent past are listed in Table 2 and Figure 3.
4Table 2: Year-wise Costs and Quantity of Short-term Power Purchases in Karnataka
Year Short-term Energy Cost per unit
Purchased (MUs) (INR/ kWh)
FY08 14 7
FY09 1, 964 6.8
FY10 1, 799 6.4
FY11 7, 815 5
FY12 6, 320 4.8
FY13 11, 046 4.3
FY14 6, 479 5
FY15 5, 867 5.3
Source: KERC
12000 8
7
10000
6
Million Units (MUs)
8000
5
Rs.
6000 4
3
4000
2
2000
1
0 0
FY-08 FY-09 FY-10 FY-11 FY-12 FY-13 FY-14 FY-15
Energy Purchased (MUs) Rate (Rs./unit)
Figure 3: Short-term Energy Purchased and Costs (FY2008 – FY2015)
The month-wise short-term purchases made by the state in the year FY15 is listed in Annexure 2.
2.1.2. Unrestricted Energy and Peak Deficits
In terms of deficits, as against the unrestricted aggregate and peak demands estimated by the
Electric Power Survey (EPS) of the Central Electricity Authority (CEA) (CEA, 2011), the State has
steadily faced a shortage situation at an average growth rate of 7.8% between FY2008 and FY2015
(Figure 4). In FY2015, the state had an unrestricted energy demand of 62,643 MUs but could supply
only 59,926 MUs, leading to an energy deficit of about 4.3%.
5Figure 4: Unrestricted and Met Demand in the State (FY2008 - FY2015)
Andhra Pradesh and Himachal Pradesh, which are comparable to Karnataka in Gross State
Domestic Product (GSDP) per capita, had energy deficits of 7% and 2%, respectively (NITIAayog,
2014). The reasons for such a high energy deficit in the state are numerous. First, the demand for
electricity has grown rapidly due to rising per capita income, with increasing urbanisation and
industrialisation. Second, the Plant Load Factors (PLFs) of state thermal plants have been as low as
60-68% in recent years, in comparison to PLFs of about 80% for central thermal plants. Third,
though the state has allocated over 10,000 MW of RE capacity, only a small portion of this capacity
has been commissioned.
The shortage situation observed at the aggregate level is further reflected in the inability of the
state to meet peak demand. The peak demand in the state has grown from 6,583 MW in FY2008 to
10, 000 MW in FY2015 at a CAGR of 6.2% (Figure 5). The peak deficit has varied over the same
period at an average rate of 10.6% and was 4.5% in FY2015. The highest peak deficit during the
period was in FY2012, at about 19%.
6Figure 5: Unrestricted Peak Demand vs. Peak Supplied from FY08 to FY15
The month-wise peak demand for the previous year is shown in Annexure 3. From the daily load
curves for Karnataka published by KPTCL (KPTCL, 2014), it is observed that the state faces
unscheduled shortages over and above the scheduled i.e. planned curtailments. The highest hourly
unscheduled load observed between 2011 and 20141 was at 1,200 MW.
2.1.3. Category-wise Consumption
The share of the agricultural sector in the state’s total electricity consumption is quite high at 37%
(NITIAayog, 2014) (Figure 6). The state has nearly 2 million energised IPs, each consuming 10,000
kWh per annum on an average. In comparison, the specific consumption per IPs in Gujarat, Andhra
Pradesh, and Tamil Nadu is approximately 16,000 kWh, 8,000 kWh, and 4,000 kWh, respectively. At
about 800 kWh, specific electricity consumption in Karnataka is slightly higher than that in Gujarat
(700 kWh), but significantly lower than that in Tamil Nadu (1,200 kWh) and Andhra Pradesh
(1,700 kWh) (NITIAayog, 2014). The share of industry is lower than agriculture, despite the
presence of several cement and steel industrial units in the state – possibly because of the heavy
reliance on captive power due to its higher reliability (Deepika, 2015).
1 Daily unscheduled loads are analysed for full years of 2011, 2012, 2013, 2014
7Figure 6: Category-wise electricity consumption in Karnataka and other states
2.2. Estimation of Future Demand for Providing 24x7 Power
While several projects are in the pipeline, is the situation of power shortages likely to change in the
future? This section provides estimates of the future demand and supply of electricity to address
this question.
2.2.1. Aggregate Energy Demand
The study uses the EPS estimates to project the future sector-wise energy demand in the state of
Karnataka. The sectors considered are domestic, commercial, public lighting and water works,
agriculture, industries, railway traction, and bulk supply. Demand is estimated till FY2020, as per
the 18th EPS conducted by CEA (CEA, 2011). The 18th EPS estimates are based on a partial end-use
methodology, which is a combination of time-series analyses and end-use methods. While using the
time series method, a higher weightage is given to recent trends in order to account for energy
conservation initiatives and improvements in technology. The demand is forecasted for various
consumer categories namely domestic, commercial, public lighting and water works, irrigation,
industrial, railway traction and bulk supply, at bus bars, for utilities only. The methodology used by
CEA for estimating the demand is briefly described in Annexure 4. The demand from various
consumer categories is expected to grow further by about 1.3 times of the current demand by
FY2020. The sector-wise estimated demand is presented in Table 3.
Table 3: Sector-wise Projected Demand (Million Units) (MUs)
Category/ FY2016 FY2017 FY2018 FY2019 FY2020
Year
Domestic 13,895 14,884 15,791 16,752 17,773
Commercial & Misc. 8,268 9,202 10,192 11,237 12,389
Public Lighting 1,240 1,366 1,468 1,557 1,651
Public Water Works 2,880 3,070 3,266 3,468 3,683
Irrigation 18,237 19,420 20,764 22,026 23,386
Industries LT 2,951 3,253 3,587 3,954 4,360
Industries HT 10,507 11,545 12,243 12,983 13,768
Railway Traction 543 567 591 615 640
Bulk Supply 2,770 2,780 2,790 2,800 2,810
18th EPS Unrestricted Energy Consumption 61,290 66,088 70,692 75,393 80,459
(Pre-T&D Loss Reduction)
Source: CEA
8By FY2020, the estimated energy consumption is expected be about 80,450 MUs. The year-wise
estimated demand till FY2020 is presented in Table 4. After accounting for Business As Usual (BAU)
shortages and Transmission and Distribution (T&D) losses, the total unrestricted energy
requirement is estimated to be 1,12,675 MUs in FY2020.
Table 4: Future Projected Energy Requirement (MUs)
Year 18th EPS Unrestricted Energy Estimated T&D Losses Estimated Unrestricted
Consumption Consumption (BAU) Energy Requirement
(Pre-T&D Loss Reduction) with BAU (21%) (MUs)
(MUs) shortages (MUs)
(MUs)2
FY2016 61,290 67,617 17,974 85,592
FY2017 66,088 72,909 19,381 92,290
FY2018 70,692 78,048 20,747 98,795
FY2019 75,393 83,324 22,149 1,05,473
FY2020 80,459 89,013 23,662 1,12,675
2.2.2. Peak Demand
Peak demand, as seen in the previous section, has grown at a CAGR of 6.2% over the past 8 years.
Table 5 below shows the projections for peak demand as per the estimates of the 18th EPS by CEA
(CEA, 2011). The peak demand is estimated to continue to grow at a CAGR of nearly 10% over the
next five years, to reach 16,000 MW by FY2020.
Table 5: Future Projected Peak Demand (MW) with 9% CAGR
Year 18th EPS Peak Demand
Estimate (MW)
FY2016 12, 102
FY2017 13, 010
FY2018 13, 964
FY2019 14, 945
FY2020 16, 005
Source: CEA
2 At an average BAU growth rate of 7.8%
93. 24x7 Power for All: The Challenge
What do we mean by 24x7 Power for All? FoR defined 24x7 power as reliable power for all urban
and rural non-agricultural consumers and 8-10 hours of daily power supply for agricultural
consumers. In this section, we explore this definition further and characterise it along the
dimensions of access (electrification), adequacy (per capita consumption), affordability (cost of
supply), availability (duration of supply), and reliability (quality of supply). We present the status
of power supply in the state along these dimensions, in the context of the challenges faced.
3.1. Access
Electricity is an important input for economic and social development – it can directly and
indirectly increase the standard of living of millions of people in our country through creation of
livelihoods, facilitation of public services such as education and health, and access to energy
services such as lighting and ventilation. In the international arena, attempts have been made to
place electricity access within the framework of human rights (Bradbook & Gardam, 2009). Within
the context of 24x7 power, ensuring access for all and last mile connectivity becomes an important
factor in this regard.
On the whole, Karnataka has a good record in electrification. Village electrification in the state is
99.5% in comparison to the national average of about 92-93%. Though household electrification is
also high (96% in urban areas; 88% in rural areas) and has increased significantly over the last
decade, nearly 1 million households still do not have access to electricity in the state.
Figure 7 depicts the improvement in rural and urban household electrification rates for states
comparable to Karnataka, from 2001 to 2011. The all India average for urban and rural household
electrification has increased from 88% to 93% and from 44% to 55% respectively, from 2001 to
2011. In the same period, Karnataka’s urban and rural household electrification rates have
increased from 91% to 96% and from 72% to 87% respectively. While Karnataka’s electrification
rates are higher than the national average, it is still lower than that of Andhra Pradesh, which has
an urban and rural household electrification of 97% and 90% respectively in 2011 (NITIAayog,
2014).
Figure 7: Electrification Rates for Karnataka and other Comparable States (2010 & 2011)
Electrification of remaining households has been challenging, in part, because of the hilly terrain
and relatively low population density, which make grid extension expensive. Where grid extension
10is not feasible, electricity access can be provided under the Distributed Decentralised Generation
(DDG) scheme of DDUGJY. Currently, there are 34 un-electrified villages in remote forests and
coastal regions in Karnataka that can be considered for off-grid electrification through DDG (GoI,
2015). Grid extension to these areas would not only be economically unfeasible, but also
environmentally harmful as transmission lines would have to cut through dense forests.
Additionally, successful implementation of DDG projects would entail an in-depth assessment of the
socio-technical factors in these villages.
Availability of reliable data can aid in formulating effective electrification policies. This includes
data regarding electricity access in public buildings such as schools, public health centres, and
Panchayat buildings that are crucial for providing services to citizens. Karnataka can aim to provide
100% electricity access with an emphasis on electrification of not only households but also public
buildings, the agriculture sector, and industries. To facilitate this, databases of current status and
power requirement for various institutional buildings and public utilities both in urban and rural
areas should be maintained so as to plan demand-side management and reduce the power deficits
that the ESCOMs face.
A decentralised mechanism for such data collection can be deployed by using existing ground level
resources and public officials such as Panchayat and Taluk offices, Block Development Officers
(BDOs), school administration, and entrepreneurs working in the energy sector.
3.1.1. District-wise Assesment of Access to Electricity
Assessment of district-wise access of the number and percentage of households to electricity
indicates that Karnataka fares well in comparison to the districts of other states. The average
percentage of households that have access to electricity over all the districts is approximately 89%.
This has been verified by using data from the Census survey of 20113. Bangalore is seen to have
almost 100% electrification, while districts with particularly low electrification rates are: Yadgir
(78%), Bijapur (81%), Kodagu (82%) and Belgaum (84%)(Figure 8).
Figure 8: District-wise Status of households having Access to Electricity
3
Note: criteria for deciding whether a household is electrified or whether supply is reliable hasn’t been defined clearly
113.2. Adequacy
Adequacy of electricity signifies the relative per capita electricity consumption4 and energy deficit
in the state. With a per capita electricity consumption of nearly 1,100 kWh in 2012, the
consumption in Karnataka was above the country average of 884 kWh. However, its per capita
consumption is lower than that of comparable states such as Gujarat (1,663 kWh), Tamil Nadu
(1,277 kWh), and Andhra Pradesh (1,157 kWh) (Figure 9).5 Further, the per capita electricity
consumption in Karnataka is one-fourth of the average per capita electricity consumption in China
and one-fifteenth of the per capita electricity consumption of most developed countries (Bhaskar,
2015).
Figure 9: Per-capita electricity consumption in Karnataka and other states (2007 & 2012)
A minimum lifeline household consumption of 30 kWh/month (1 unit/household/day), was fixed
as a norm in rural areas, by the National Electrification Policy (MoP, 2005) and tariff orders from
KERC (KERC, 2014). If a lifeline consumption of 506 kWh per month is envisaged, Karnataka can
reach a benchmark of about 1,500 kWh of production by FY2020 as the electricity infrastructure
has reached most regions in the state. In the case of urban households, the goal can be set at 125
kWh/month (Pargal & Banerjee, 2014)7 as per the growing trends, which presently for Karnataka
stands at 86 kWh per month (Banerjee, Barnes, Singh, Kristy, & Samad, 2015). To achieve these
goals, high energy deficits in the state must be addressed.
3.3. Availability
24x7 power for all includes availability of power to meet peak load at the diurnal and seasonal
levels. Load curves for the state for two typical days are illustrated in Figure 10 (KPTCL, 2014).
4 Here per capita consumption is measured on the basis of electricity fed into the grid and not the actual consumption,
which would be much lower on account of Transmission and Distribution (T&D) losses.
5 These states are considered to be comparable on the basis on proximate GSDP and population.
6 30 kWh/month has been fixed in line with current state level average consumption of 925 Kwh that could be increased
to 50 kWh/ month while aiming for per capita consumption of 1500 kWh for the state.
7 Derived from the assumption in this report that urban per capita consumption is double the rural per capita
consumption
12Figure 10: Observed peak demand on typical days in 2014 (MW)
Peak demand is typically observed during the morning and the evening. This is as per the frequency
distribution of the peak load over a period of three years. Additionally, the rate of growth of peak
demand is higher than the average demand throughout the year (summarised in Annexure 5).
Under BESCOM, the consumer category-wise consumption for an average of the 16 representative
days of the year can be visualised as below (Figure 11).8 On an average, the domestic category
mainly gives rise to the shape of the morning and evening peaks.
Figure 11: Consumer-category-wise consumption – BESCOM (FY2014)
Peak demand is typically met through quick ramping sources of generation such as hydro and gas,
or short-term power purchases. An analysis of the power availability across the state can present a
clearer picture of regional and seasonal disparities. As an illustration, supply availability has been
analysed using SCADA data taken from KPTCL for representative days in 2014 (Annexure 5).
In Karnataka, power availability can be set at the below standards based on the existing trends in
demand for both rural and urban areas. The ultimate aim should be to reach 24 hour supply for
every household in the state:
Rural areas should have 3 phase supply for a minimum of 12 hours during day time that can
be used for running cottage industries, water pumps and other livelihoods activities
Each household receives 20 hours of supply of single phase power and eventually moves
towards 24 hours.
8
Supervisory Control and Data Acquisition (SCADA) data for all the feeders along with the feeder classification as given
by BESCOM were used for this analysis.
133.4. Reliability
Uninterrupted availability of power is considered as a strong indicator of reliability. Thus, feeder
outages can be effectively used to compute a realibility index to gauge the efficacy of the quality of
reliable power supply. A Feeder Reliability Index (FRI) can also be used as a suitable indicator to
further study the disparities that exist between district headquarters and urban and rural areas.
This exercise is also an important tool for devising appropriate strategies for the state government
depending on how various areas within each ESCOM fare on providing reliable service of power.
A similar index has been developed by KERC to estimate the reliability of feeder outages for the five
major ESCOMs in Karnataka, the results for which are shown in Table 6. The index at 11kilo Volt
(kV) feeder level is calculated using the following formula (KERC):
Feeder Reliability Index= {[Total No of 11kv Feeder x 24 Hrs x No. of days] - [outage
duration of all 11kv feeders during the month in Hrs]} x 100/ [Total No of 11kv Feeders x
24Hrs x No. of days]
Table 6: Reliability Index (in %) for 5 DISCOMs in Karnataka for FY2015
DISCOMs District Towns and Rural Areas
Headquarters Cities
BESCOM 97.31 96.90 94.53
MESCOM 97.90 94.99 90.75
CESC 96.39 92.13 71.03
HESCOM 97.25 95.97 65.86
GESCOM 93.29 84.86 84.36
Source: KERC
The indices mentioned above reinforce the observation that rural areas receive unreliable power
supply in comparison to urban areas. In most towns and cities, reliability is close to 97%, with the
average being at least 93%. While a 97% reliability is relatively high within the state of Karnataka, a
higher standard of up to 99% may be achieved as has been by a few other states in the country
(CEA, 2014). In most rural areas, the situation has improved but still proper care has to be taken to
increase the reliability in some regions. The major observation are given below:
The district headquarters under HESCOM has a reliability index of 97% whereas that of
rural areas is about 65%
Rural areas under BESCOM have the highest reliability index of 94%.
Other measures of reliability that are widely used by electric power utilities in the country are
briefly described in Annexure 6.
3.5. Affordability
Affordability is an important criterion for 24x7 Power for All. While a detailed assessment of
affordability is beyond the scope of this report, an initial analysis has been attempted by comparing
the cost of power and electricity tariff in Karnataka to that in other states for information available
for FY2014 (Table 7) (NITIAayog, 2014). This comparison reveals that, on average, electricity in
Karnataka is not too expensive or highly priced – in fact, it is cheaper than the national average
even though average incomes in Karnataka are slightly higher.
14You can also read