The Renewable Energy Revolution Real Climate Action in the Sunshine State
←
→
Page content transcription
If your browser does not render page correctly, please read the page content below

Sustainable Queensland Submission to Advancing Climate Action Paper Aug 2016

              The Renewable Energy Revolution
       Real Climate Action in the Sunshine State

        Submission on behalf of Sustainable Queensland Forum
                           www.sustainablequeensland.info

                                 Author: Trevor Berrill

                       Sustainable Energy Systems Consultant
                                   www.trevolution.com.au

                                        Aug 2016

                                              1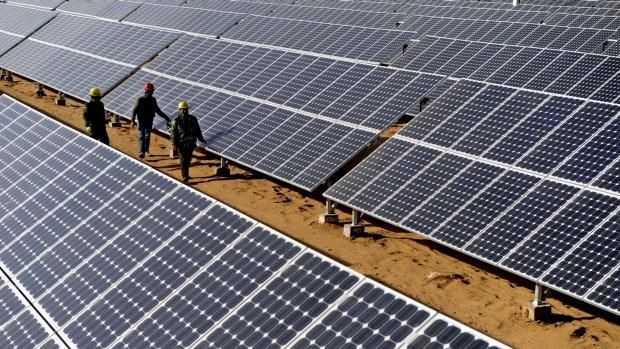
Sustainable Queensland Submission to Advancing Climate Action Paper Aug 2016

Contents
Acronyms .......................................................................................................................................... 4
Executive Summary .......................................................................................................................... 5
Submission Structure ........................................................................................................................ 6
Guiding Principles of Sustainable Energy Policy ................................................................................ 7
Energy Systems in Transition – Where we are at and what’s required ............................................. 7
   Employment and Investment ........................................................................................................ 9
Why Renewable Energy and Energy Efficiency are Important ........................................................ 10
   Political Reasons ......................................................................................................................... 10
   Economic Reasons ...................................................................................................................... 10
   Environmental Reasons .............................................................................................................. 11
   Social Reasons............................................................................................................................. 11
Key Barriers and Issues to a Clean Energy Future ........................................................................... 11
   Barriers ....................................................................................................................................... 11
       Market Failure......................................................................................................................... 11
       Metering ................................................................................................................................. 14
       Reforming the Electricity Industry ........................................................................................... 14
       Transitioning to an Energy Services Model based around a Smart Distributed Grid ............... 14
       Over-investment in Fossil Fuels............................................................................................... 15
Key Issues ....................................................................................................................................... 16
   Renewable Energy Resource Access............................................................................................ 16
   Security of Energy Supply............................................................................................................ 17
   Disaster Relief Cost Growth ........................................................................................................ 17
   Transitioning Other Sectors ........................................................................................................ 18
   Population Growth, Energy Consumption and Emissions ........................................................... 19
   Energy Consumption re Processing/Transporting Fossil Fuels .................................................... 19
   Is CSG the Transition Fuel? .......................................................................................................... 20
   Achieving Energy Efficiency......................................................................................................... 21
   Sharing the Responsibility for Action .......................................................................................... 22
Transitioning to Renewable Energy and Energy Efficiency – What we need to do to get there. ..... 24
   Planning and Targets................................................................................................................... 24
   Removing Barriers, Financing & Incentivising ............................................................................. 25
       Removing Barriers ................................................................................................................... 25
       Financing ................................................................................................................................. 26

                                                                         2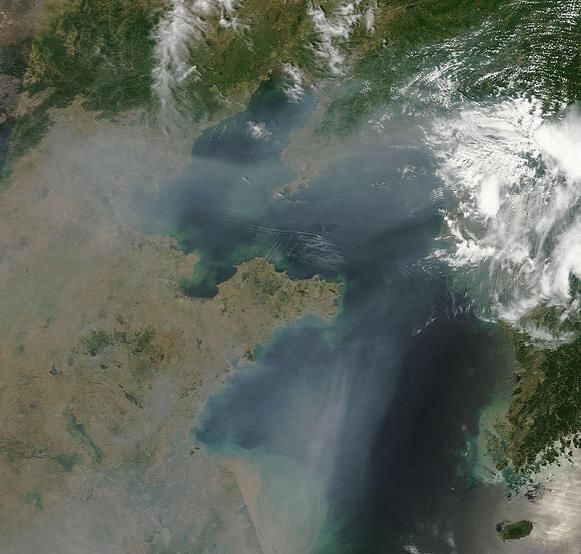
Sustainable Queensland Submission to Advancing Climate Action Paper Aug 2016

       Incentivising ............................................................................................................................ 27
   Reinforcing Existing Polices ......................................................................................................... 28
   Removing Subsidies and Exemptions .......................................................................................... 29
   Retiring Aged Fossil Fuel Generators .......................................................................................... 29
Appendix 1 - External Costs of Coal-Fired Electricity over Life Cycle ............................................... 30
Appendix 2 – RE Generation Queensland 2014 ............................................................................... 32
   How does Queensland compare to other States? ....................................................................... 36
Appendix 3 – Employment Creation and Investment by 2030 ........................................................ 37
Appendix 4 - A Fair Price for Solar PV ............................................................................................. 38
   Simplicity & Pricing ..................................................................................................................... 39
Appendix 5 – Modelling Renewable Electricity Generation on the National Electricity Market...... 41
References ...................................................................................................................................... 42
Glossary .......................................................................................................................................... 49
   Death Spiral ................................................................................................................................ 49
   Energy versus Power (Demand) .................................................................................................. 49
   Merit Order Effect ....................................................................................................................... 49
Units ............................................................................................................................................... 50
Conversions .................................................................................................................................... 50

                                                                           3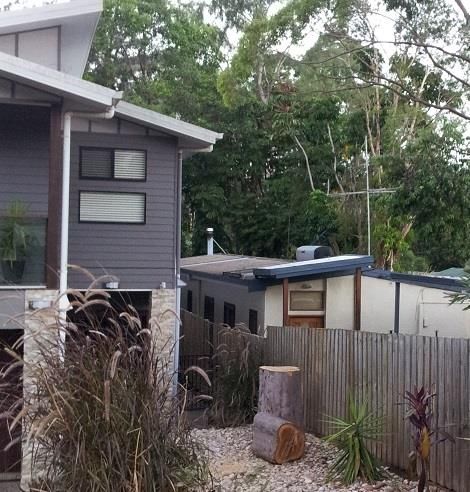
Sustainable Queensland Submission to Advancing Climate Action Paper Aug 2016

Acronyms
ACF – Australian Conservation Foundation

AEMO – Australian Energy Market Operator

ALP – Australian Labor Party

ASC – Australian Solar Council

ATA – Alternative Technology Association

BZE – Beyond Zero Emissions

CEC – Clean Energy Council

DEEDI – Department of Employment, Economic Development and Innovation

DERM – Department of Environment and Resource Management

DEWS – Department of Energy and Water Supply

DIP – Department of Infrastructure and Planning

DIRD – Department of Infrastructure and Regional Development

EE – Energy Efficiency

EROEI – Energy Return on Energy Invested

ESQ – Energy Skills Queensland

EV – Electric Vehicle

FTE – Full-time Equivalent Jobs

GBR – Great Barrier Reef

IEA – International Energy Agency

IMF – International Monetary Fund

LNP – Liberal National Party

NEM – National Electricity Market

QEPP – Queensland Environmental Protection Policy

RE – Renewable Energy

RMI – Rocky Mountain Institute

TAI – The Australia Institute

                                                  4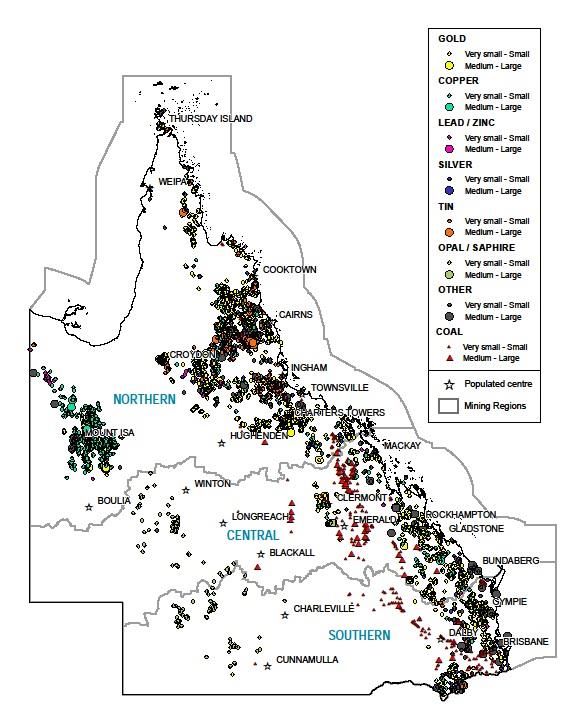
Sustainable Queensland Submission to Advancing Climate Action Paper Aug 2016

Executive Summary
It is well recognised that renewable energy and energy efficiency are two key elements in mitigating
global warming. The State Government’s goal of a 50 percent of electricity generation from
renewable energy by 2030 is to be applauded. There are other global impacts from the use of fossil
fuels that also need to be mitigated including atmospheric aerosol loading, chemical pollution and
overloading of biological systems by nitrogen fertilisers (Rockstrom et al, 2009). To play its role,
Queensland needs a very different energy fuel mix to the current one. This is even more necessary
given the failure of Federal Government policy in recent years to address global warming.

This submission aims to assist energy and climate change policy development for a rapid transition
to renewable energy (RE) and energy efficiency (EE), whilst establishing an alternative economic
base to coal and gas mining.

The focus of this submission is on electricity generation, since this is the largest contributor to all
emissions from fossil fuels. However, other sectors such as transport, mining and agriculture need
to be carefully considered in order to transition all sectors to renewable energy and energy
efficiency. Hence this submission is written in this larger context, as the proposed State renewable
energy target is only part of what is required to transition our energy use away from fossil fuels.
Beyond Zero Emissions’ comprehensive technical/economic reports provided examples of how to
move to a carbon free economy including stationary energy, transport, buildings, agriculture and
heavy industry. They clearly demonstrate Australia has the opportunity to be a global clean energy
super power (BZE, 2016).

The climate policy should be linked intimately to energy policy. This submission makes the following
key recommendations:

    1. Climate and energy policy must be intimately linked and be based on the allowable carbon
       budget approach as outlined by the Climate Council (Steffen et al, 2015).
    2. A renewable energy portfolio approach should be taken to support a mix of RE generating
       technologies, to provide a reliable, resilient and cost effective solution to a longer term goal
       of 100 percent RE generation across Australia. One such possible mix of RE generators is
       given in this submission. This approach is necessary due to:
           a. The inability of the market to solve complex societal problems such as global
               warming. Market failure in the energy sector is discussed in detail below.
           b. The urgency of the need to address global warming and preferably keep global
               temperature rise to less than 1.5 degrees Celsius.
           c. The need to diversify the energy mix to increase reliability and resilience to extreme
               disruptive events such as weather extremes or terrorism, whilst minimising energy
               storage losses and costs. This also assists with capturing synergies between variable
               RE sources where they exist.
           d. The need to assist less cost effective technologies such as solar thermal electric (STE)
               (also called concentrating solar power systems or CSP) with thermal storage to be
               scaled up and costs reduced. This is because such systems can provide high capacity
               factors and dispatchable power.

                                                   5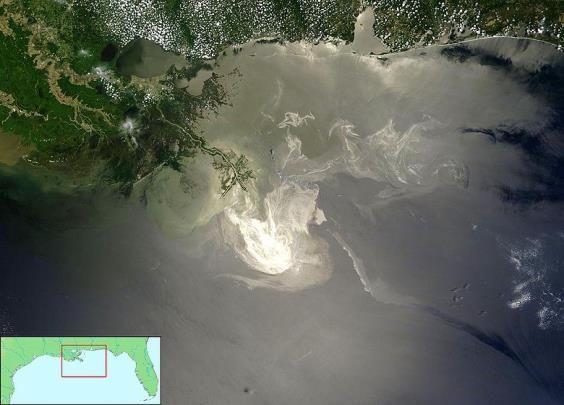
Sustainable Queensland Submission to Advancing Climate Action Paper Aug 2016

    3. The RE portfolio should be underpinned with modelling to identify the optimum mix of RE
       generators and energy storage across the Queensland electricity network, as undertaken by
       groups such as University of New South Wales (Elliston, 2013 & 2014) and Beyond Zero
       Emissions (Wright & Hearps, 2010).
    4. Implement reverse auctions within the RE portfolio sectors to provide competition and
       reduce costs within sectors.
    5. Provide a feed-in tariff (FIT) rate for small roof-top photovoltaic (PV) systems (maximum of
       30kVA inverter rating), on homes and small business, equivalent to the day time retail
       electricity rate (approximately 20 to 25 cents/kilowatt-hour). Such a one for one FIT rate
       provides clarity to PV system owners and simplifies customer metering and billing, and more
       fully reflects the true value of solar PV (Maine Public Utilities Commission, 2015).
    6. Provide incentives for energy storage, both large and small scale, that are structured to
       reduce the incentive level progressively over say 10 years. This provides planning certainty
       to industry and helps reduce storage installation costs rapidly as industry learns the
       requirements of best practice.
    7. Introduce smart gross metering on all homes and businesses to facilitate the expansion of
       the smart, distributed grid to ensure that both energy generation from embedded
       generators and energy consumption can be fully metered.
    8. Develop a suite of complementary policy measures to implement energy efficiency, in
       conjunction with the National Energy Productivity Plan.
    9. Upgrade current industry training to incentivise a best practice approach rather than just
       meeting minimum standards. Even these are not met in far too many cases at present. This
       is essential to ensuring safety and long life and good performance from energy systems. This
       should be supported with ongoing random system inspections to ensure compliance with
       codes and standards.

Globally, an energy transition to renewable energy and energy efficiency is already happening in
many countries. Queenslanders strongly support these technologies and Government policy should
reflect the people’s wishes. Whilst recent State Government commitments to renewable energy are
to be applauded, Queensland lags behind most other States in the uptake of renewable energy (CEC,
2014:9), particularly large scale systems, and energy efficiency.

Submission Structure
This submission follows on from two previous policy papers presented by Sustainable Queensland to
the Department of Energy and Water System during 2015. These include a policy paper (Berrill, Jun
2015) which discussed the political, economic, environmental and social reasons why government
should strongly support renewable energy and energy efficiency. It reported on the current status of
and barriers to renewable energy contributing to electricity generation in the State. Finally, it
outlined a range of supportive policy initiatives. These initiatives are represented here and some are
expanded upon in this submission.

The second paper (Berrill, Sep 2015) outlined one possible scenario of the scale of a mix of
renewable energy generators required to meet State Government’s stated target of 50 percent
renewable energy electricity generation by 2030. It gave estimates of the required investment and
jobs created. Parts of both these papers are reproduced here, partly or in full.

                                                  6
Sustainable Queensland Submission to Advancing Climate Action Paper Aug 2016

The first sections outline the current contribution of renewable energy to electricity consumption in
the State, the scale of RE generation, investment and employment to achieve a 50 percent RE target,
and summarise reasons to support renewable energy.

The later sections identify and discuss important barriers and issues that need to be addressed and
policy options that should be considered to achieve a transition to a renewable energy powered and
energy efficient society.

Guiding Principles of Sustainable Energy Policy
Key elements to a sustainable energy policy that guide this policy paper are:

    •   Acceptance of global warming science and the need for action via targets and other
        initiatives, based on an allowable carbon budget approach.

    •   The need for very low or no polluting emissions from energy supply technologies to address
        all emissions and costs from fossil fuel use.

    •   The need for highly efficient energy conversion to minimise waste.

    •   Provision of a reliable and resilient energy supply.

    •   Maximise the safety of workers and the community.

    •   Provision of affordable energy cost to the end-user.

    •   Promotion of regional development through diversification of income streams.

    •   Users pay a fair share of their energy costs and impacts.

    •   Responsibility for the global commons.

These key principles are expanded upon in previous work by this author (See Berrill, 2012).

Energy Systems in Transition – Where we are at and what’s
required
This section outlines the current status of renewable energy to the Queensland electricity system in
2014 and projects the potential generation capacity required by 2030 for one mix of RE
technologies. It uses AEMO projections of energy consumption growth. From 2008 to 2014, RE
contribution of electricity consumption in Queensland grew from 6 to 9.5 percent, including the
reduction in consumption due to solar water heating (Berrill, Jun 2015 - see appendix 2 for details).
This is equivalent to an annual growth rate of 8 percent.

It is important to calculate distributed RE generation as a proportion of consumption, not
generation. This best reflects the contribution of RE to final end-use consumption that is required,
before the final end-use conversion to the energy service we need - light, heat, sound, motion etc.
This is because RE is in the main generated close to the consumption point, minimising transmission
losses. This is one reason why transmission losses are lower than in the past in Queensland. The

                                                   7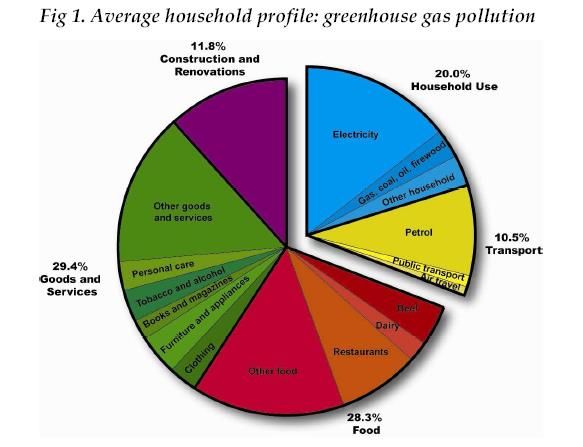
Sustainable Queensland Submission to Advancing Climate Action Paper Aug 2016
difference between generation and consumption is WASTED energy, which should always be
avoided.
Figure 1a shows the author’s estimate of the contribution of RE to electricity consumption in
Queensland in 2014. This analysis includes the contribution of solar water heating to reducing
electricity consumption as this is a major contributor and often overlooked. Figure 1a clearly shows
the important contribution from renewables that solar PV is now making to total electricity
consumption.
Figure 1a – RE Capacity (MW) and Energy Generation (GWh) in 2014
2014 Total RE Capacity (2,300 MW) &
Energy Generation (5,000 GWh Incl. Pumped Storage)
PV
Geothermal
Solar Thermal Electric
Wind
Solar Hot Water
Hydro (Pumped Storage)
Hydro (Run of River)
Biomass
0 2000 4000 6000 8000 10000 12000
2014 Estimated Energy (GWh) 2014 Estimated Capacity (MW)
Analysis in the author’s December 2015 energy transition paper showed that, to achieve the
government’s 50 percent RE target by 2030, Queensland needs about 9300 MW of RE capacity.
When combined with very modest energy efficiency measures to reduce the projected growth in
energy consumption (AEMO, 2015), this RE portfolio would provide an estimated 50 percent of
projected electrical energy consumption by 2030, or about 29,000GWh. This could be made up of a
diversified portfolio of technologies such as:
1000MW of biomass plant (currently 464MW)
200MW hydro plant (run of river)(currently 167MW)
1000MW hydro (pumped storage)(currently 500MW)
600MW solar hot water equivalent (currently 397MW)
1500MW wind farms (currently 12MW)
2000MW solar thermal electric (STE) plant (currently zero)
3000MW solar PV both small and medium-sized rooftop and on-ground power stations
(currently about 1300MW)
Figure 1b shows the rated maximum capacity (MW) and projected energy generation (GWh/yr) from
this mix of RE generators. The mix is based on the historical generation from biomass and hydro in
Queensland, and the author’s estimates for what are the most likely technologies to play a role in
8
Sustainable Queensland Submission to Advancing Climate Action Paper Aug 2016
Queensland given political, economic and social and environment factors. Solar thermal electric (STE
- also called concentrating solar thermal power (CSP)) is included due to the high capacity factor
available when molten salt thermal storage is included. This gives it an advantage over solar PV for
dispatchable power. Full details are given in appendix 2.
This projection shows a similar RE capacity (MW) but lower generation (GWh) to that forecast by
ACIL Allen report (QPC, 2016). This is largely because ACIL Allen figures are based on estimates of
energy sent out by 6300 MW of additional large scale wind farms, but no details of assumed capacity
factors or transmission losses are given.
Figure 1b – RE Capacity (MW) and Energy Generation (GWh) required by 2030
2030 RE Capacity (9,300 MW) &
Energy Generation (29,000GWh Incl. Pumped Storage)
PV
Geothermal
Solar Thermal Electric
Wind
Solar Hot Water
Hydro (Pumped Storage)
Hydro (Run of River)
Biomass
0 2000 4000 6000 8000 10000 12000
2030 Target Energy (GWh) 2030 Target Capacity (MW)
A diversity of renewable energy technologies is essential to:
Provide a more resilient and reliable system,
Achieve synergies or complementarities between demand and generation where they
occur,
Maximise capacity factors and energy return on energy invested ratios (EROEI)
Minimise energy storage losses and costs.
The optimal mix of renewable energies for electricity generation and supportive long term policy
measures need to be guided by modelling of the electricity network as performed by UNSW (Elliston
et al, 2013 & 2014).
Employment and Investment
What level of investment and jobs could result from this scenario? Using CEC and IEA reports, it is
estimated that such a RE portfolio would involve between about $10 and $19 billion of direct
investment, depending on final installed costs due to falling STE, PV and storage costs (See appendix
3 for assumptions and references). Using data from an extensive study of RE job creation in the USA,
and a Queensland Government report (Wei et al, 2010; ESQ, 2011), I calculate over 18,000 direct
and indirect full-time equivalent job years (FTE - a standard unit of employment measurement) by
2030, increasing from about 4000 FTEs in 2014. This is a very conservative estimate as it allows for
9
Sustainable Queensland Submission to Advancing Climate Action Paper Aug 2016
job losses in other parts of the economy, as workers transfer across to renewables, which may or
may not occur. Most industry estimates are higher.
Why Renewable Energy and Energy Efficiency are Important
There are important political, economic, environmental and social reasons why Queensland should
put in place policies that strongly support the adoption of renewable energy and energy efficiency.
These are summarised below. Full details with references are given in Berrill, June, 2015.
Political Reasons
The public overwhelmingly support the uptake and use of renewable energy and energy
efficiency as shown by survey after survey over decades.
A clean energy future is now a significant political issue at both State and Federal levels,
with public support firmly behind RE and EE, not coal or gas.
The threat to the Great Barrier Reef from climate change and other impacts is likely to play
an increasing role in public support for RE.
Economic Reasons
Renewable energy provides:
Cheaper energy – The levelised cost of RE generation have continued to fall, making RE by
and large cheaper than new coal or gas plant. As well, more capacity is being installed and
more money is now being invested in renewables than in coal, oil and gas power generation.
This is despite low oil prices and fossil fuels receiving 4 times the subsidy dollars globally
than renewables (REN21, 2016).
Longer term energy price certainty as the fuel cost is free and the infrastructure costs
continue to decrease.
Job creation and associated skills – it is more labour intensive per unit of delivered energy
than the fossil fuel industry.
Economic / regional diversification away from reliance on fossil fuels - helps avoid boom
and bust cycles, could diversify income streams for farms, and replaces job losses in fossil
fuels as many construction jobs are transferable.
Households and businesses can greatly reduce and secure their cost of electricity by on site
RE generation and energy efficiency.
Increased resilience of the electricity system against extreme weather or acts of terrorism
via a distributed, intelligent (or smart) grid and energy storage.
Opportunities for the development of innovative products/services and resulting in new
market opportunities in both RE and EE.
Opportunities to build energy self-sufficient new suburbia or villages in regional areas
without upgrades to transmission and distribution systems.
Energy Efficiency consists of three components:
1. More efficient technology which has a lower operational and life cycle energy consumption.
2. Demand side management where energy use is shifted from peak to off-peak periods to
reduce peak demand and associated infrastructure costs.
3. Behavioural change to improve energy management practices.
10Sustainable Queensland Submission to Advancing Climate Action Paper Aug 2016
These measures provide:
Ongoing reduction in energy costs for businesses and households.
Reductions in the need for new construction or delays in upgrades to power generation,
transmission and distribution systems.
Job creation and skills training for energy auditors/managers, product development,
manufacturer, sales, distribution and installation/maintenance staff.
Opportunities for the development of innovative products/services and resulting new
market opportunities.
Environmental Reasons
Queenslanders have one of the highest environmental footprints per capita in the world,
including greenhouse gas emission, and other pollution for fossil fuels.
Renewable energy, combined with energy efficiency, is now the cleanest and cheapest
energy option for electricity generation and heat.
Social Reasons
Communities are less likely to suffer social and economic disruption with a decentralised
distributed generation system as this provides a more resilient electricity supply, protecting
against extreme weather events and terrorism threats.
Renewable energy such as wind and solar PV farms can assist regional development by
providing additional long term jobs and revenue for cash-strapped primary producers and
rural communities.
Home owners and businesses can reduce energy costs and take greater personal
responsibility for pollution reduction from fossil fuels.
The jobs created are long term jobs that are not subject to mining boom/bust cycles. This
provides for stability in jobs, families and society generally and hence increased social
cohesion.
Key Barriers and Issues to a Clean Energy Future
There are a number of key barriers that need to be addressed, and issues to consider, before a clean
and efficient energy future can be achieved. These are outlined below.
Barriers
Key big picture barriers are outlined here. Further barriers and actions / solutions to address these
barriers are outline in the section, “Removing Barriers, Financing & Incentivising” page 25.
Market Failure
There has been and continues to be on-going market failure in the energy sector for many years
through:
The avoidance of paying external costs of fossil fuels over their life. For full details, see the
Sustainable Queensland Energy Policy paper (Berrill, Jun, 2015). These range from $19/Megawatt-
hour (gas), $40/MWh (black coal) (Australian report by Biegler, 2009) to as high as $200/MWh (coal)
based on the comprehensive Harvard University study in the USA (Epstein et al, 2011). The Biegler
study is a very conservative estimate and the cost in Australia is likely to be between $40 and
11Sustainable Queensland Submission to Advancing Climate Action Paper Aug 2016
$200/MWh for coal. This is because many environmental costs such as mine rehabilitation are
predicted to be billions of dollars across the State (Main & Schwartz, 2015) as there are over 15,000
abandoned mine sites (of all types) across Queensland (See map in appendix 1). Ultimately,
economics can’t put a full price on preventing the deterioration of our natural wonders such as the
Great Barrier Reef and the Wet Tropics due to global warming and other pollution. University of
Queensland economist, Professor John Quiggin, in reviewing the International Monetary Fund’s
(IMF) report estimating $5.3 trilllion of subsidies to fossil fuels in 2015 (Coady, 2015:6), suggested
that the Australian Government is in denial about these sobering external costs. He states that “the
costs of burning fossil fuels outweigh the benefits in many cases” (Quiggin, May, 2015).
State Government subsidies to the fossil fuel industry. Subsides to the fossil fuel industry includes
monies for port development, rail, road and electricity transmission infrastructure development that
directly benefit the fossil fuel industry. Both my own research (Berrill, 2012) in reviewing 5 years of
State budget papers and similar work by The Australia Institute (Peel, 2014) show that Queensland
Governments have been contributing about $1 to 2 billion annually to this industry. Similar subsidies
have happened in New South Wales (Climate & Health Alliance, 2015). The Federal Government also
provides subsidies to the fossil fuel industry. The Grattan Institute (Wood et al, 2012:12) and an
Australian Conservation Foundation report (ACF, 2011) state that these subsidies range between
about $8 and $12 billion annually, well in excess of that spent on renewable energy or energy
efficiency, as shown by Riedy’s review in 2007 (Riedy, 2007).
Tables 1 & 2 summarise the various Australian and overseas studies on both the annual external
costs of fossil fuels and subsidies.
Table 1 – Annual External Costs of Fossil Fuels Use in Australia and Overseas
Externality Cost / State / Australia/
Year Report Title Source Range International
2004 Reshaping cities for a Newman, P. $3 - $5 Bill. Health Australia
more sustainable $3 - $5 Bill. Property
future. CSIRO report & Materials Damage
reported in ECOS
magazine.
2009 The Hidden Cost of Biegler, T. Coal $40/MWh = Australia
Electricity: $1.2 Bill. (from Qld.
Externalities…..– ATSE 2011 Coal
Report Generation)
2011 Full cost accounting for Epstein, P. et $200/MWh average International - USA
the life cycle of coal - al = $6 Bill. (from Qld.
Harvard Uni. Study 2011 Coal
Generation)
2013 Building our nation's Deliotte $6.3 Bill. In 2011, Australia
resilience to natural Access growing 3.5% pa.
disasters. Economics
2015 Coal and Health in the Climate and $0.6 Bill. Health Cost NSW and
Hunter: Lessons from Health in Hunter Valley. International
one valley in the Alliance $16 - $66 Bill. Global
world. costs of coal.
12Sustainable Queensland Submission to Advancing Climate Action Paper Aug 2016
Table 2 – Annual Subsidies to Fossil Fuels in Australia and Internationally
State / Australia/
Year Report Title Source Subsidy Cost / Range International
2007 Energy and Transport Riedy, C. $9 - $10 Bill. For 2005- Australia
Subsides in Australia. 06
2011 Australia spends $11 ACF up to $12 Bill. Australia
billion more encouraging Website
pollution than cleaning it
up - Media release 1 Mar
2011
2012 No Easy Choices: Which Wood, T. $7.2 - $9.3 Bill. Australia
way to Australia's Energy et al Reporting Govt,& TAI
Future. Grattan Insitute estimates
report.
2013 Clean Energy Pathways? - Berrill, T. $6.92 Bill. Over 5 yrs Qld.
A Review of Energy Policy of State Govt. Budget
in Qld….. Papers
2014 Mining the Age of Peel, M. et $9.5 Bill. Over 6 yrs of Qld.
Entitlement - The Australia al State Govt. Budget
Institute (TAI) Papers
2015 How large are Global Coady, D. $5.3 Trill. In 2015 International
Energy Subsidies - IMF et al
Working Paper
2015 Fossil Fuels Subsidies ACF > $6 Bill. Australia
Website
These subsidies contribute to market distortions as mature industries should not require subsidies.
These distortions are well recognised by the International Energy Agency (IEA) and the IMF and the
Queensland externalities and subsidies are discussed in the Sustainable Queensland energy policy
paper (Berrill, June 2015). These subsidies produce the following negative impacts:
Distort markets and create barriers to clean energy investment
Encourage wasteful consumption
Increase CO2 emissions and exacerbate local pollution
Discourage investment in (clean) energy infrastructure
Cross-subsidies are another form of market failure and contribute to wasteful energy use (measured
in Gigawatt-hours) and peak demand (measured in MVA). Air conditioning is particularly problematic
and has contributed greatly to peak demand and costs across the network (EY, 2015:11). Previous
estimates have put the cost to upgrade the network at between $10,000 and $13,000 per kilowatt of
air conditioning. This cost is subsidised by the 25 percent of homes that don’t need, choose not to
have or can’t afford air conditioning.
There is also substantial cross subsidising of the commercial and industrial sectors by the residential
sector. This is because electricity tariff costs to both commercial and industrial users have historically
13Sustainable Queensland Submission to Advancing Climate Action Paper Aug 2016
been lower than residential users, even though each sector consumes about 30 percent of total
electricity generation (GWh).
Metering
Measurement of energy flows through economies is crucial to good policy. Currently this is poorly
done with energy efficiency in particular missing out. Main street-level metering and sub-metering
of all fuels and water should be mandatory. There is a need for smart metering on all customers and
gross smart metering is the preferred option. This is because:
Smart meters monitor average half-hourly power consumption and allow determination of
the load profile (Power VS Time) of individual homes and businesses. This facilitates full cost
reflective pricing and peak demand management. This should be mandatory.
Gross smart metering (separate meter for PV output and consumer load) allows for:
o Full performance assessment of PV system output – this could be done via the
inverter energy meter as most inverters log power / energy output. This allows
Government to use performance assessment rather than deem the output of PV
systems. It gives feedback to PV owners regarding the performance of their systems.
o Measurement of the energy use (kWh) and peak power demand (MVA) within
residences or businesses allows full assessment of energy efficiency measures. This
allows Government to measure the benefit of energy efficiency policy. It gives
feedback to home and business owners regarding the benefits of energy efficiency.
The current net metering for roof-top PV, using a single ‘dumb’ meter with import and export
registers, is a low cost compromise that:
Does not allow full measurement of demand with residences or businesses and so can’t fully
measure energy efficiency savings.
Only measures the exported part of PV energy generation and so doesn’t show that part
that is supplied direct to home or business appliances.
Reforming the Electricity Industry
The current National Electricity Market fails to address pollution for fossil fuels and hence climate
change as a key objective. Hence it acts to restrict the uptake of RE and EE. Furthermore, the
revenue model of the electricity industry provides little incentive for the distribution companies to
support variable (non-dispatchable) renewables such as wind and solar without storage. This is
partly because distributors’ costs and revenue are dominated by peak demand (MVA) and hence
demand charges ($/MW), rather than sales of units of energy ($/kilowatt-hours). The distribution
companies however do benefit from:
a. Renewables with energy storage, both large and small scale, as it allows shifting of
renewable energy to peak periods and hence peak demand (MVA) reduction,
b. Energy efficiency measures as these measures generally reduce peak demand also.
Transitioning to an Energy Services Model based around a Smart Distributed Grid
A fundamental problem is that the current electricity supply model is outdated, being based around
large centralised generators, remotely located near coal mines, supplying all energy use via long
transmission/distribution systems to end users. It continues to encourage growth in electricity
consumption as it generates its income via sales of units of electricity, and in some sectors by
14Sustainable Queensland Submission to Advancing Climate Action Paper Aug 2016
demand changes. Historically, it tried to forecast consumption (GWh) and demand (MVA) growth
over long time periods, and build large centralised plant to meet both consumption and peak
demand. Long term planning by these projections led to large step increases in generation capacity
(e.g. 1500MW). This has invariably led to both over-supply (too much generation capacity) and over-
building of the transmission and distribution network, via over-estimates of peak demand. This
planning method mostly ignored the impact of energy efficiency and embedded generation such as
solar PV. As we have seen over the past 5 years across the National Electricity Market (NEM), these
growth predictions were completely wrong.
This is an unsustainable model that is rapidly being replaced by a new model, the smart (or
intelligent) distributed grid model. As CSIRO has pointed out in its Intelligent Grid program, the new
model is cheaper, helps maximise efficient use of energy and minimise emissions, and is more
resilient to extremes in weather or terrorist attacks. In this model, embedded, modular, variable
scale generators can be added or removed to follow the long term trend in electricity demand.
The Rocky Mountain Institute has long promoted the alternative utility model, the Energy Services
Model. This is where energy utilities change their focus from sales of units of energy to the supply
the energy services we need (light, sound, heat, coolth etc.) at the least cost (including
environmental cost). It has been stated many times that it is not gigawatt-hours that we need but
the service the energy provides. This model also assists to decouple energy use and emissions from
gross domestic product growth. This is essential if we are to address the global warming crisis. This is
the approach that the most forward looking countries such as Germany are now adopting.
Germany’s energy transition program aims to halve all primary energy use by 2050 and supply 80
percent of electricity from renewable energy. It is well on the path, already generating 30 percent of
electricity from renewables.
Over-investment in Fossil Fuels
The State Government has invested about $1 to $2 billion each year in assistance to the fossil fuel
industry over the past 6 years or so. These investments are effectively subsidies. Government
subsidies are designed to help emerging industries that Governments see as needing assistance to
establish and grow, to achieve societal goals, or have been temporarily impacted by events beyond
their control. In the past, extreme weather events have been one example. Subsidies that support
mature, profitable industries are perverse as they distort markets. Note that there is no agreed
upon definition of fossil fuel subsidies by the G20 group of countries (EIA, 2011; IMF, 2013).
It is now recognised that this huge investment by the State Government that is very likely to lead to
‘stranded assets’ if climate change is to be addressed in accordance with the urgency of the science
and the allowable global carbon budget (Caldecott, 2014). However, there has been a commitment
by the State Government to continue to expand coal and gas mining, including the Gallilee Basin and
more recently oil and gas in the Cooper Creek Basin. Funding these projects assumes a healthy, long
term, return on investment. Royalties are often stated by the Queensland Minerals Council to be
part of this return. This misrepresents the purpose of royalties. Furthermore, the Adani project has
been extensively reviewed now via the recent court action by the Environmental Defenders Office
(Qld.). It have been found to be making vastly inflated claims to government about employment
opportunities and financial returns to the State Government (Quiggin, April, 2015).
15Sustainable Queensland Submission to Advancing Climate Action Paper Aug 2016
Key Issues
Other key issues include:
Renewable Energy Resource Access
Currently in Queensland the laws or regulations are weak in protecting our access to use solar and
wind energy in particular. For example, you may have renovated or built a new solar passively
designed home that achieves more than 6 stars on the national energy rating system, as it is well
insulated, maximises winter solar gain and summer cooling breezes (requiring no air conditioning),
has energy efficient appliances, solar PV and hot water systems and an outdoor clothes dryer in a
sunny location. These measures have greatly reduced your need for fossil fuel, possibly by more than
100 percent. Then suddenly all this could be compromised by a single high rise development to the
north or your neighbour deciding to plant fast growing trees, both over-shadowing your solar
systems and blocking your cooling breezes from the north-east.
Figure 2 – Overshading by buildings and trees of solar passive gain, hot water and PV systems.
As well, subdivision of land for housing seldom allows for good solar passive design orientation and
layout. The Greeks and Chinese mandated this requirement in their best developments over 2500
years ago. There has been a long history of such requirements being implemented in many parts of
the world, including Europe, during periods of high energy costs, but then being pushed aside with
the discovery of more “cheap” fossil fuels. The same has happened repeatedly to the solar water
heating industry (Butti & Perlin, 1980).
Urban consolidation via in-fill housing is also considerably compromising the energy performance of
existing and new houses as more and more large houses are crowded beside one another by:
North facing windows are often shaded by either a privacy screen (top storey) or by a
two storey house to the north at most 3 metres away (less between eaves). This restricts
solar energy from entering in winter to heat homes. Our climate still requires 3 months
of heating.
Natural light is restricted by privacy screens and shading.
Windows remain closed as noise is easily transmitted through open windows,
preventing breezes from cooling homes.
16Sustainable Queensland Submission to Advancing Climate Action Paper Aug 2016
Air flow is restricted and the whole vertical wind speed profile is shifted upwards, resulting
in lower average wind speeds around the building. Hence breezes are less effective for
cooling.
Larger houses in general are likely to use more energy to heat/cool and illuminate.
More hard surfaces and less green space contribute to the heat island effect, creating more
need for air conditioning.
Hence there is a need to strengthen laws and regulations at a number of levels to ensure that we
gain the intergeneration benefits of living off renewable energy including:
Nationally through Building Codes to enshrine the degree of solar / wind energy access
according to climate zones.
State and Local Government Planning for consistency in the design of subdivisions to
maximise good solar design, and sustainable housing policy.
Security of Energy Supply
Energy supply security is key to a functioning society. Climate change is contributing to instability in
the Middle East including Syria, and Asia. Also there is conflict over oil reserves in the South China
See. This in turn threatens our oil supply. Automotive gasoline, for example, is sourced entirely from
Singapore (52 per cent), Taiwan (27 per cent) and Korea (21 per cent) while 67 per cent of Australia’s
petroleum imports must transit through the waters of the Indonesian archipelago (Medcalf & Brown,
2014). As a result, Australia spends many millions of dollars each year on maintaining a military
presence in both Asia and the Middle East. The rapid development of a renewable energy based
electricity system combined with a shift to electric transport is now possible and happening. It would
contribute to avoiding the need for military expenditure in defending our access to oil.
Disaster Relief Cost Growth
Disaster relief costs due to extreme weather event impacts are increasing. Disaster relief costs in
Australia were about $6.3 billion in 2011 and are expected to grow at about 3.5 percent per annum
(Deloitte Access Economics, 2013). This is in line with climate science predicting for decades more
extreme weather events. Communities can be made more resilient to extreme weather events
through distributed generation and hence renewables have a key role to play in reducing societal
costs due to these extremes.
Figure 3 -Projected Disaster Economic Cost ($billions/yr)
Source: Deloitte Economics, 2013
17Sustainable Queensland Submission to Advancing Climate Action Paper Aug 2016
Transitioning Other Sectors
If we are serious about transitioning to a clean energy future, government needs to give much more
attention to transport and especially the impact on transport demand of urban planning. Current
urban planning models are still predominantly locking people into car use, with spending on roads
exceeding other transport modes for example by about 2.5 to 1 (See figure 4). This comes largely at
the expense of public transport and has the effect of generating more road traffic, not less. While
improvements have been made, Brisbane and other Queensland regional centres have relatively
poor public transport systems by international standards. There is also a need for greatly improved
facilities for walking and cycling. Without these improvements, there will be continuing needless
energy use and social costs. Congestion costs alone resulting from reduced energy efficiency are
estimated at $15 billion each year across Australian capital cities (DIRD, 2014:10).
Figure 4 – State Expenditure on Roads versus Other Transport
Source: ACF, 2011:5
Figure 5 - Queensland’s CO2 Emissions Projection under Business as UsualSource: DERM, 2009,
Chp.3:20
18Sustainable Queensland Submission to Advancing Climate Action Paper Aug 2016
Population Growth, Energy Consumption and Emissions
The task of reducing energy use and associated emissions is dramatically impacted by a rate of
population growth. Queensland’s population growth rate of about 2 percent for the past 15 years
(DIP, 2009) is more like that of a poor Third World country than a modern economy (World Bank,
2015), although it has slowed recently to about 1.5 percent (Queensland Economy Watch, 2015). As
well, Queensland Governments have for many years encouraged a strong inter-State migration. Land
released for housing is used inefficiently, with Australia having the dubious honour of the largest
houses now on average in the world (ABC, 2011). This is at a time when the average household
consists of about two and a half people.
Some governments embrace population growth under the belief that it is good for the economy. The
evidence for that is very weak (Cocks, 1996; O’Conner & Lines, 2008, O’Sullivan, 2014:7), but the
evidence that it increases energy use and associated emissions is very strong (O’Sullivan, 2013:5).
The current population growth rate makes the 2030 target much more difficult to achieve, as energy
consumption then would be about 30% greater than today on a business-as-usual trajectory.
Figure 6 - Historical Relationship of Population Growth, Energy Consumption and Emissions
Source: O’Sullivan, 2013:5 (data from IPCC and UN Population Division).
Energy Consumption re Processing/Transporting Fossil Fuels
There is a large and increasing energy demand for exploration, mining, storage, transporting and
processing fossil fuels for export, particularly liquefaction. There is very little local benefit from this
energy consumption but very large global negative impacts. The impacts of our fossil fuel use include
global scale air, land and water pollution (Rockstrom et al, 2009). Nowhere is this more evident than
in the massive scale of particulate pollution now over Asia, or from oil spills such as in the Gulf of
Mexico, or Brisbane’s air pollution, exacerbated by temperature inversions.
19Sustainable Queensland Submission to Advancing Climate Action Paper Aug 2016
Figure 7a – Air Pollution over China and Yellow Sea from Space (Left), Gulf of Mexico Oil Spill from
Space (Right). Source: Wikipedia & Google Images
Figure 7b – Air Pollution over Brisbane
Is CSG the Transition Fuel?
Coal seam gas is promoted as a “cleaner” fossil fuel and therefore as a transition fuel to renewables.
Firstly, gas generation is now more costly than large scale wind, hydro and some biomass
(Bloomberg, 2013; REN21, 2016). More recently, large solar PV in particular, and concentrating solar
thermal power levelized costs are starting to out-compete gas generation. Secondly, many
countries/regions/cities renewable energy transition plans do not involve a shift to gas generation
first and then renewables. As Beyond Zero Emissions have pointed out, this is misdirection of
funding to address global warming in the ever decreasing time frame required as there are now
sufficient mature renewable energy technologies available to transition to a mix of renewable
energies combined with energy efficiency (BZE, 2015:VII). Thirdly, there is now growing evidence
that coal seam gas’s life cycle GHG emissions may be much higher than commonly suggested and in
some cases may be no better than coal (Howarth, 2010; Tollefson, 2012). Research by Wigley from
the US National Centre for Atmospheric Research and reported by Pears (2012) suggests:
“The gas industry has promoted shifting to gas as the panacea to cut greenhouse gas
emissions. A recent study by climate specialist Tom Wigley has challenged
this………………….There are actually two independent factors at work in Wigley’s study.
First, there is the effect of a reduction in coal use, which cuts emissions of CO2 and methane
leakage from coal mines, reducing warming. But it also reduces air pollutants such as oxides
20Sustainable Queensland Submission to Advancing Climate Action Paper Aug 2016
of sulphur and carbon particulates, which reduces their short-term cooling effects. Wigley’s
paper suggests this loss of cooling will offset most of the reduction in warming from cutting
coal use until mid-century, when the long-term effect of reducing CO2 begins to swamp the
air pollution effect.”
“Unconventional gas emissions up to seventy times worse than industry claims - immediate
moratorium a must - Real time air sampling of gas fields in the US has shown leakage rates
of up to over seventy times greater than the rates assumed by industry and accepted by
government in Australia. The study by the US National Oceanic and Atmospheric
Administration (NOAA) and the University of Colorado, has found rates of fugitive emissions
up to 7.7%, with a mean of 4%.” (BZE, 2012)
Finally, Queensland Government GHG emission estimates shown in the “ClimateQ: toward a greener
Queensland” (DERM: 2009:Chp. 10, p.82) show fugitive GHG emissions becoming an increasingly
larger proportion of total energy sector emissions when projected out to 2050 under business as
usual, from the current estimate of 6 percent. This is a major concern as much of these fugitive
emissions are methane, which is a much stronger GHG than CO2. If the studies by Howarth, (2010)
and Tollefson (2012) are indicative of fugitive emissions from CSG mining, then our “cleaner” gas
industry may lose that image and sales quickly.
Achieving Energy Efficiency
There have been many starts and stops over the years in Australian government support for
improving energy efficiency. It has been very similar to the boom/bust cycles imposed on the
renewable energy industry. There has been a lack of coordination and consistency between State
programs and this has resulted in poorer policy outcomes in some cases. In other cases, programs
were poorly implemented. The incorrectly named ‘pink batts’ policy fiasco is one example. While
achieving some worthwhile energy savings in many homes, it was hastily implemented and resulted
in the death of some workers. This then brought about the shut-down of the scheme, rather than it
being improved with higher quality training and appropriate safety measures. Australia now finally
has a nationally energy productivity plan (COAG, 2015).
By comparison, many countries have implemented energy efficiency plans and use far less energy
per capita than Australia. Denmark and Germany are two examples, using about half that of
Australia (World Bank, 2015). Yet Germany has a goal to further reduce all energy consumption by
50 percent by 2050 (Morris, 2015). Australia has much more low hanging fruit to harvest through
efficiency gains. Setting an energy efficiency target (GWh reduction), in conjunction with a demand
target (MVA reduction) will make the task of achieving a 50 percent renewables target by 2030
easier.
21Sustainable Queensland Submission to Advancing Climate Action Paper Aug 2016
Figure 8 - Germany Transition (Source: Morris, 2014 & 2015)
Sharing the Responsibility for Action
Often the educational material and policy campaigns by government have focused on what we as
individuals must do in response to climate change. Figure 9 shows the full picture of where we each
contribute to greenhouse gas emissions.
Figure 9 – Average Household Profile of Greenhouse Gas Pollution
Source: University of Sydney Consumption Atlas 2007
22Sustainable Queensland Submission to Advancing Climate Action Paper Aug 2016
Figure 9 clearly shows that if we take direct action in our homes to reduce energy use in our day to
day activities, use solar energy or cycle to work, we are acting on only 30 percent of our total
emissions. We are limited in action across 70 percent of our carbon footprint. This shows that
collective action by individuals, government and industry is crucial. Furthermore, research by Heede,
tracing anthropogenic greenhouse gas emissions historically, showed that 90 leading investor and
state owned producers of oil, natural gas, coal and cement are responsible for 63 percent of
emissions from 1854 to 2010 (Heede, 2014).
Finally, research in Sydney shows that the wealthy have a far higher per capita energy use and hence
greenhouse gas footprint and should also take more responsibility for climate change action. This is
partly because they have far more emissions embodied in assets such as more homes, vehicles or
recreational activities such as yachts. Figure 10 shows the energy requirement (both direct and
embodied energy) across suburbs in Sydney, from the harbor-side wealthy to the western suburbs
poor. It shows the increasingly large share of embodied energy as wealth increases (black arrow in
figure 10).
Figure 10 – Energy Use and Income (Source: See below)
23Sustainable Queensland Submission to Advancing Climate Action Paper Aug 2016
Transitioning to Renewable Energy and Energy Efficiency –
What we need to do to get there.
The following points outline recommended policy directions that the State Government
should consider in the following areas:
Planning and Targets
Clean Energy Office - Establish a new Office of Clean Energy or similar department,
dedicated to developing and delivering the “Renewable Energy and Energy Efficiency
Transition Strategy”. This office should report directly to the Premier.
Renewable Energy and Energy Efficiency Plans – A RE plan is under development but it
is crucial to address the waste of energy in the Queensland economy via an energy
efficiency plan.
Carbon Budgeting – Design energy and emissions policy around the carbon budget
approach, that identifies the ‘’burnable proportion” of remaining fossil fuels to keep
global temperature rise to no more than 1.5 degrees Celsius rise (Steffen et al, 2015).
Targets for Renewable Energy and Energy Efficiency - The Government’s target of 50
percent renewable energy electricity generation by 2030 is an appropriate target. Note
however that it should be consider a minimum target. In addition, an energy efficiency
target for the reduction in electricity consumption and transport energy use should be
set. Ensure there are suitable measurement and reporting systems. These targets should
be consistent with the carbon budget approach. These combined targets should aim to
reduce CO2 emissions by at least 50 percent below 2000 levels by 2030. That would
place Queensland in line with the CO2 emissions targets suggest by the Climate Change
Authority (CCA, 2014:9).
Industry Consultation – Continue to consult with both the renewable energy and energy
efficiency sectors to identify barriers, policy solutions and targets. This should include
the Australian Solar Council, the Clean Energy Council, the Australian PV Institute, the
Alternative Technology Association, Solar Citizens, the Energy Efficiency Council and
associated local businesses.
Scenario Analysis – Undertake hourly simulation modelling of the operation of the
Queensland electricity system with 100 percent renewable energy electricity system,
based on the work of the University of New South Wales (See appendix 5 for more
information re Elliston et al, 2013 & 2014). This process helps to inform policy with
regard to the best mix of renewable energy technologies that, in combination, can
provide a reliable and affordable electricity generation system.
Energy Return on Energy Invested Ratio (EROEI) – Select, whenever possible, those
renewable energy technologies that give the highest EROEI ratio. This ensures the
highest potential net energy generation is delivered from renewable energy and
therefore displaces fossil fuel use more rapidly (See Berrill, 2012:23-27).
Energy Portfolio Approach – There is a mix of RE technologies that are likely, when
combined, to provide for an optimised sustainable energy system in Queensland. This is
because:
24You can also read