100% RENEWABLE ENERGY FOR COSTA RICA - A decarbonization roadmap.
←
→
Page content transcription
If your browser does not render page correctly, please read the page content below
100% RENEWABLE ENERGY FOR COSTA RICA

       A decarbonization roadmap.

2020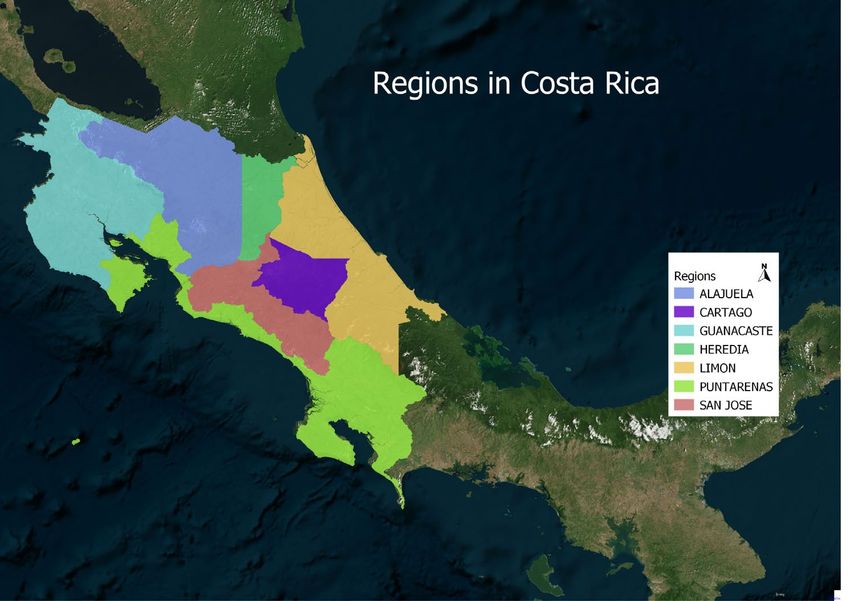
UNIVERSITY OF TECHNOLOGY SYDNEY                             Institute for Sustainable Futures (ISF)
100% Renewable Energy for Costa Rica

ABOUT THE AUTHORS
The Institute for Sustainable Futures (ISF) was established by the University of Technology Sydney in
1996 to work with industry, government, and the community to develop sustainable futures through
research and consultancy. Our mission is to create change towards establishing sustainable futures that
protect and enhance the environment, human well-being, and social equity. We use an inter-disciplinary
approach to our work and engage our partner organisations in a collaborative process that emphasises
strategic decision-making.

For further information visit: www.isf.uts.edu.au

Research team: Dr. Sven Teske, Tom Morris, Kriti Nagrath

CO-OPERATION PARTNER
This project has been conducted in cooperation World Future Council: Anna Skowron, Anna Leidreiter and
Iker Urdangarin; La Ruta del Clima: Adrian Martinez and Earth Alliance: Karl Burkart, Justin Winters

ENERGY MODELS
Utility-scale solar photovoltaic and wind power potential were mapped with [R]E-SPACE, a mapping tool
developed by the Institute for Sustainable Futures of the University of Technology Sydney (ISF-UTS)
based on QGIS (open source).
The long-term energy scenario software for the long-term projections and economic parameters is based
on the development of the German Aerospace Centre (DLR), Institute for Technical Thermodynamics,
(Pfaffenwaldring 38-40, 70569 Stuttgart, Germany) and was applied to over 100 energy scenario
simulations for global, regional, and national energy analyses.
Regional Power Analysis calculated with [R]E 24/7 was developed by Dr. Sven Teske (PhD), with further
developments by ISF-UTS.

CITATION
Teske, S., Morris, T., Nagrath, K (2020) 100% Renewable Energy for Costa Rica. Report prepared by ISF
for the World Future Council/Germany and the One Earth Foundation, USA, February 2020.

ACKNOWLEDGEMENTS
The authors gratefully acknowledge those who contributed data and advice up to November 2020.
All conclusions and any errors that remain are the authors’ own: Jam Angulo, Researcher EPERLab,
Guido Godinez, Researcher EPERLab, Luis Victor, Researcher EPERLab, Jairo Quirós-Tortós,
Researcher EPERLab
All workshop participantsThe authors gratefully acknowledge those who contributed data and advice up to
November 2019.

DISCLAIMER
The authors have used all due care and skill to ensure that the material is accurate at the date of this
report. UTS and the authors do not accept any responsibility for any loss that may arise from the reliance
by anyone upon its contents.

INSTITUTE FOR SUSTAINABLE FUTURES
University of Technology Sydney
PO Box 123
Broadway NSW 2007
AUSTRALIA
www.isf.edu.au
© UTS February 2020

                                                        2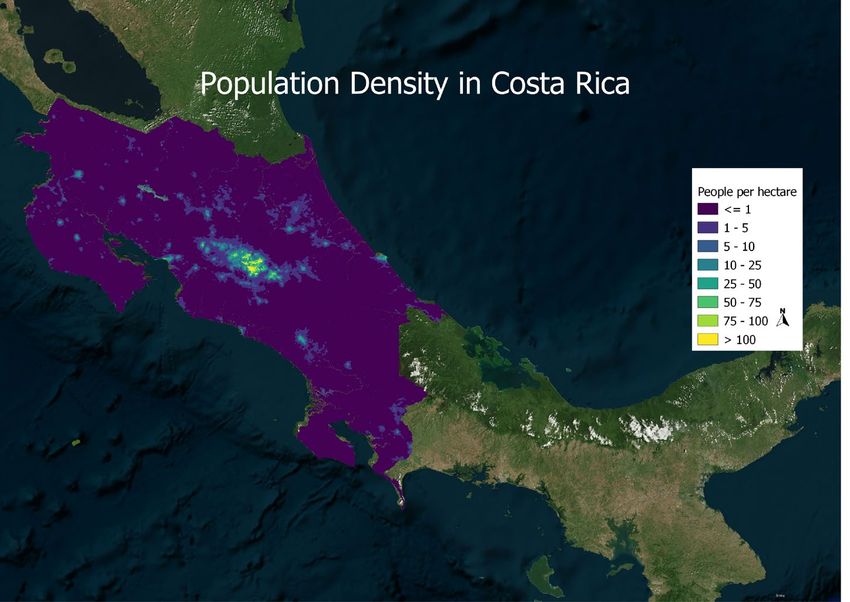
UNIVERSITY OF TECHNOLOGY SYDNEY                                                                             Institute for Sustainable Futures (ISF)
100% Renewable Energy for Costa Rica

TABLE OF CONTENTS

EXECUTIVE SUMMARY ....................................................................................................................................................... 6

1    Methodology and Assumptions ................................................................................................................................. 19

           1.1     [R]E 24/7—GIS Mapping tool ......................................................................................................................... 20
           1.2     Long-term Scenario Modelling ....................................................................................................................... 21
           1.3     [R]E 24/7—POWER ANALYSIS .................................................................................................................... 22
           1.3.1 Meteorological data ....................................................................................................................................... 23
           1.4     Power Demand Projection and Load Curve Calculation ................................................................................. 24
           1.5     The [R]E 24/7 Dispatch module ..................................................................................................................... 26

2    Costa Rica: Scenario Assumptions ........................................................................................................................... 28

           2.1     Political Context ............................................................................................................................................. 28
           2.2     Social Context ............................................................................................................................................... 28
           2.3     Economic Context.......................................................................................................................................... 28
           2.4     Socio-Economic parameterS ......................................................................................................................... 29
           2.5     Costa Rica: Electricity Demand development Projection ................................................................................ 29
           Demand projections for the industry and business sectors ...................................................................................... 30
           Costa Rica—Electricity demand projections—households....................................................................................... 31
           2.6     Technology and fuel cost projections ............................................................................................................. 33
           Background: Fuel price projections ......................................................................................................................... 33
           Power and combined heat and power (CHP) technologies ...................................................................................... 34
           Heating technologies............................................................................................................................................... 35
           Fuel cost projections ............................................................................................................................................... 36
           2.7     Costa Rica: Geographic information .............................................................................................................. 37
           2.8     Renewable Energy potential .......................................................................................................................... 39
           2.8.1 Solar potential analysis by uts-isf ................................................................................................................... 39
           2.9     economic and policy Assumptions ................................................................................................................. 43
           2.10 Assumptions for scenarios ............................................................................................................................. 44

3    Key Results for COSTA RICA: Long-term energy scenario ...................................................................................... 46

           3.1     Costa Rica: Final Energy Demand ................................................................................................................. 46
           3.2     Electricity generation ..................................................................................................................................... 48
           3.3     Energy supply for cooking and Industrial Process heat .................................................................................. 50
           3.4     Transport ....................................................................................................................................................... 52
           3.5     Primary energy consumption ......................................................................................................................... 53
           3.6     CO2 emissions trajectories ............................................................................................................................. 54
           3.7     Cost analysis: Long-term energy scenario ..................................................................................................... 55
           Future costs of electricity generation ....................................................................................................................... 55
           Future investments in the power sector ................................................................................................................... 56
           3.8     Future investments in the heating sector........................................................................................................ 57
           3.9     Investment and fuel cost savings in the power sector .................................................................................... 58

4    Costa Rica: Power Sector analysis ............................................................................................................................ 59

           4.1     Costa Rica: development of power plant capacities ....................................................................................... 59
           4.2     Costa Rica: utilization of power generation capacities .................................................................................... 60
           4.3     Costa Rica: development of load, generation, and residual load .................................................................... 63
           4.4     Costa Rica: development of inter-regional exchange of capacity ................................................................... 64
           4.5     Storage requirements .................................................................................................................................... 67
           4.6     Summary: Power sector analysis for Costa Rica............................................................................................ 70

5    APPENDIX .................................................................................................................................................................... 71

           5.1     Results .......................................................................................................................................................... 71

                                                                                                     3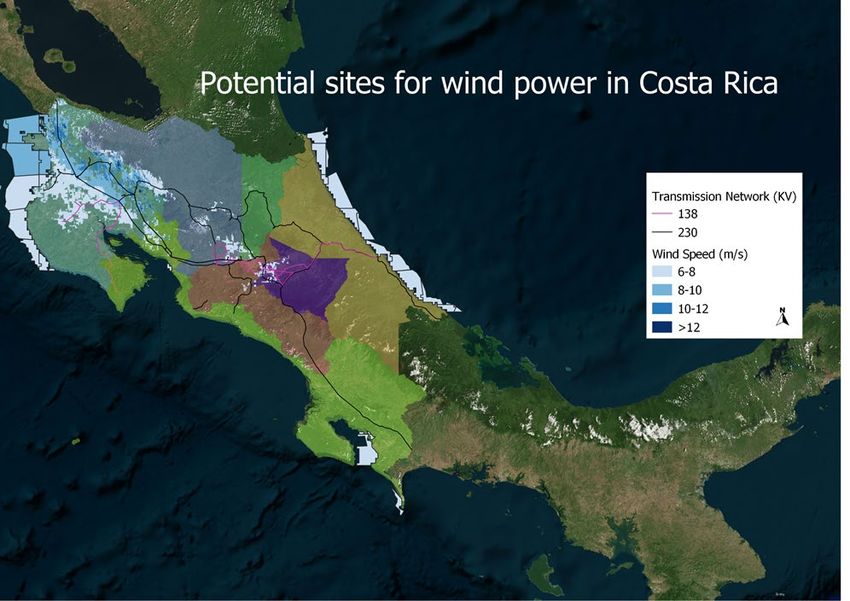
UNIVERSITY OF TECHNOLOGY SYDNEY                                                                      Institute for Sustainable Futures (ISF)
100% Renewable Energy for Costa Rica

Figures
Figure 1: Overview—Modelling concept.............................................................................................................................................. 7
Figure 2: Potential for utility-scale solar energy generation in Costa Rica ......................................................................................... 12
Figure 3: Costa Rica—Breakdown of electricity generation by technology ........................................................................................ 15
Figure 4: Costa Rica—Projection of total primary energy demand by energy carrier (incl. electricity import balance) ........................ 15
Figure 5: Overview—Modelling concept............................................................................................................................................ 19
Figure 6: Overview—Energy demand and load curve calculation module ......................................................................................... 22
Figure 7: Dispatch order within one cluster ....................................................................................................................................... 26
Figure 8: Overview—Input, output, and dispatch order ..................................................................................................................... 27
Figure 9: Historic development and projections of oil prices .............................................................................................................. 33
Figure 10: Regional breakdown of Costa Rica for the power sector analysis .................................................................................... 37
Figure 11: Distribution of population in Costa Rica............................................................................................................................ 37
Figure 12: Existing electricity infrastructure by type .......................................................................................................................... 38
Figure 13: Potential for utility-scale solar energy generation in Costa Rica ....................................................................................... 40
Figure 14: On- and offshore wind energy generation potential in Costa Rica .................................................................................... 41
Figure 15: Costa Rica—Projection of total final energy demand by sector ........................................................................................ 47
Figure 16: Costa Rica—Development of the electricity demand by sector in both RENEWABLES scenarios.................................... 47
Figure 17: Costa Rica—Development of the final energy demand for transport by sector in both RENEWABLES scenarios ............ 47
Figure 18: Costa Rica—Breakdown of electricity generation by technology ...................................................................................... 49
Figure 19: Costa Rica—Projection of heat supply by energy carrier (REF, RE1, and RE2) ............................................................... 50
Figure 20: Costa Rica—Final energy consumption by transport under the scenarios ........................................................................ 53
Figure 21: Costa Rica—Projection of total primary energy demand by energy carrier (incl. electricity import balance) ...................... 53
Figure 22: Costa Rica—Development of CO2 emissions by sector under the RENEWABLES scenarios .......................................... 54
Figure 23: Costa Rica—Development of total electricity supply costs and specific electricity generation costs in the scenarios ........ 55
Figure 24: Cost Rica—Cumulative investment in power generation under the three scenarios in 2020–2030 ................................... 56
Figure 25: Costa Rica—Cumulative Investment in heat generation under the three scenarios in 2020–2030.................................... 57
Figure 26: Costa Rica—Utilization of variable and dispatchable power generation ........................................................................... 62
Figure 27: Costa Rica—Maximum inter-regional exchange capacities, additional to the required grid capacity expansion in response
to the load increase, under the REFERENCE scenario..................................................................................................................... 64
Figure 28: Costa Rica—Maximum inter-regional exchange capacities, additional to the required grid capacity expansion in response
to the load increase, under the RENEWABLES 1 scenario ............................................................................................................... 65
Figure 29: Costa Rica—Maximum inter-regional exchange capacities, additional to the required grid capacity expansion in response
to the load increase, under the RENEWABLES 2 scenario ............................................................................................................... 65
Figure 30: Costa Rica—Peak load and maximum generation development by region, in GW ........................................................... 66

                                                                                               4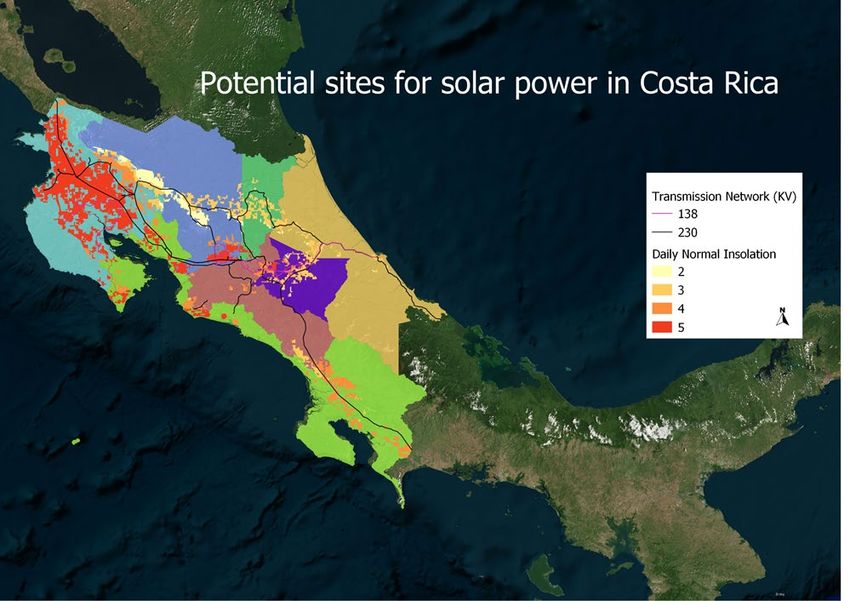
UNIVERSITY OF TECHNOLOGY SYDNEY                                                                                  Institute for Sustainable Futures (ISF)
100% Renewable Energy for Costa Rica

Tables
Table 1: Costa Rica—Population and GDP projections....................................................................................................................... 8
Table 2: Development of GDP shares by industry sector across all regions of Costa Rica (2017)....................................................... 9
Table 3: Development of Costa Rica’s shares of GDP by region ........................................................................................................ 9
Table 4: Investment cost assumptions for power generation plants (in US$/kW) until 2050 .............................................................. 10
Table 5: Development projections for fossil fuel prices ..................................................................................................................... 10
Table 6: Overview—Costa Rica’s utility-scale solar photovoltaic, onshore wind, and offshore wind potential .................................... 11
Table 7: Costa Rica—Projections of renewable electricity generation capacity ................................................................................. 14
Table 8: Costa Rica—Projection of load, generation, and residual load until 2050 ............................................................................ 16
Table 9: Costa Rica—Estimated electricity storage requirements for both RENEWABLES scenarios ............................................... 18
Table 10: [R]E 24/7—GIS-mapping—data sources ........................................................................................................................... 20
Table 11: Costa Rica—Population and GDP projections................................................................................................................... 29
Table 12: Development of GDP shares by industry sector across all regions of Costa Rica (2017)................................................... 30
Table 13: Development of Costa Rica’s shares of GDP by region..................................................................................................... 30
Table 14: Distribution of residential electricity consumption in 2018 .................................................................................................. 31
Table 15: Household types used in both RENEWABLES scenarios and their assumed annual electricity demands ......................... 31
Table 16: Household types—changes in electricity shares countrywide ............................................................................................ 32
Table 17: Investment cost assumptions for power generation plants (in US$/kW) until 2050 ............................................................ 35
Table 18: Specific investment cost assumptions (US$/kW) for heating technologies in all scenarios until 2050 ................................ 36
Table 19: Development projections for fossil fuel prices.................................................................................................................... 36
Table 20: Utility-scale solar potential for Costa Rica under different restrictions ................................................................................ 39
Table 21: Onshore wind potential for Cost Rica under different restrictions ...................................................................................... 40
Table 22: Offshore wind potential for Costa Rica under different restrictions..................................................................................... 41
Table 23: Overview—Costa Rica’s utility-scale solar photovoltaic, onshore wind, and offshore wind potential .................................. 42
Table 24: Costa Rica—Projections of renewable electricity generation capacity ............................................................................... 48
Table 25: Costa Rica—Projection of renewable heat supply ............................................................................................................. 50
Table 26: Costa Rica—Installed capacities for renewable heat generation ....................................................................................... 51
Table 27: Projection of the transport energy demand by mode (excluding pipeline transport) ........................................................... 52
Table 28: Costa Rica—Cumulative investment costs for electricity generation and fuel cost savings under the RENEWABLES 1
scenario............................................................................................................................................................................................ 58
Table 29: Costa Rica—Cumulative investment costs for electricity generation and fuel cost savings under the Renewables 2 scenario
......................................................................................................................................................................................................... 58
Table 30: Costa Rica—Average annual changes in installed power plant capacity ........................................................................... 59
Table 31: Costa Rica—Installed photovoltaic and wind capacities by region in the RENEWABLES 1 scenario (2030)...................... 60
Table 32: Costa Rica—Installed photovoltaic and wind capacities by region in the RENEWABLES 2 scenario (2030)...................... 60
Table 33: Costa Rica—Installed photovoltaic and wind capacities by region in the RENEWABLES 2 scenario (2050)...................... 60
Table 34: Costa Rica—Power system shares by technology group .................................................................................................. 61
Table 35: Cost Rica—System-relevant generation types .................................................................................................................. 62
Table 36: Costa Rica—Projection of load, generation, and residual load until 2050 .......................................................................... 63
Table 37: Costa Rica—Storage requirements to avoid curtailment ................................................................................................... 68
Table 38: Costa Rica—Estimated electricity storage requirements for both RENEWABLES scenarios ............................................. 69
Table 42: Results for the long-term energy scenario in all sectors—REFERENCE ........................................................................... 71
Table 43: Results for the long-term energy scenario in all sectors—RENEWABLES 1...................................................................... 71
Table 44: Results for the long-term energy scenario in all sectors—RENEWABLES 2...................................................................... 72

                                                                                                          5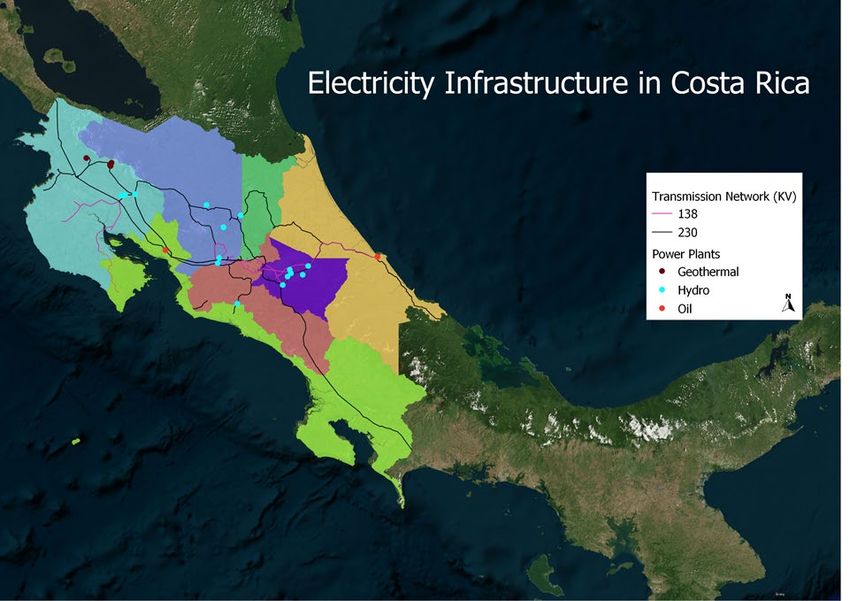
UNIVERSITY OF TECHNOLOGY SYDNEY                              Institute for Sustainable Futures (ISF)
100% Renewable Energy for Costa Rica

EXECUTIVE SUMMARY
The World Future Council and La Ruta del Clima/Costa Rica commissioned this report, financed by the
One Earth Foundation USA to provide input into Costa Rica’s plan to achieve 100% renewable energy.
Costa Rica is a global leader when it comes to ensuring energy production comes from renewable energy
sources. With a 98% share of renewables in its electricity matrix and solid achievements to prevent
deforestation—around 25% of the country’s land area is in protected National Parks and other protected
areas—Costa Rica is at the forefront environmental sustainability, climate action and driving the renewable
energy transition.

Wanting to go even further, Costa Rica has adopted the National Decarbonization Plan in February 2019
to achieve a net-zero emissions economy by 2050, in line with the objectives of the Paris Climate Change
Agreement. The planned measures, activities and improvements also form part of the country’s extended
Nationally Determined Contributions (NDCs) that Costa Rica will present in 2020 to the UNFCCC to
demonstrate and strengthen its commitment to reduce greenhouse gas emissions and participate in the
global effort to avoid a temperature rise above 1.5 degrees Celsius with respect to the pre-industrial era.

As the Costa Rican President, Carlos Alvarado Quesada, noted during the launch of the Plan,
“Decarbonization is the great challenge of our generation and Costa Rica must be among the first countries
to achieve it, if not the first.”

The biggest challenge will be to increase the share of renewables in energy consumption. More than 60%
of energy consumption in the country is from petroleum derivatives. 64% of Costa Rica’s emissions come
from energy use, and more than two thirds of that is from transport. A critical part will thus be to
decarbonize the transport sector. The growing demand for personal vehicles, the majority of which run on
petrol, is keeping a high share of fossil fuels in the country’s energy consumption. The Decarbonization
Plan aims to have 70 percent of public transport powered by electricity in 2035—and the whole fleet by
2050.
This study aims to complement these efforts and show pathways to 100%RE in order to meet the
decarbonisation challenge.

•   Solar PV: Costa Rica has 203,000 MW of utility-scale solar PV potential. Even the most ambitious
    100%RE scenario can be implemented with the utilisation of only 6% of the utility-scale solar power
    plant potential (196 GW). In addition, San José has significant potential for rooftop solar photovoltaic.
•   Wind: Costa Rica has around15 GW worth of on-shore wind potential and an additional 21 GW
    offshore wind potential. However, due to off-shore wind resources being located in marine protected
    areas, they are not utilised in the study. However, the wind resource is concentrated in only one
    region—Guanacaste—therefore transmission capacity needs to be increased to distribute the
    electricity across the country.
•   Generation costs: implementing 100%RE will save almost US$1cent per kWh power generation.
•   Investments and savings: For the whole modelling period until 2050, the Reference and the RE1
    scenarios have similar investment needs of US$ 30 billion over 30 years. The RE2 scenario requires
    higher investments – a total of US$ 40 billion over the same period of time, due to higher electricity
    needs as a result of the electrification of the transport sector. The fuel cost savings will reach up to
    US$ 5.3 billion up to 2050 (US$180 million per year), which will cover 84% of the total additional
    investments compared with the Reference scenario.
•   Transport: The transport sector can be electrified up to 78% with increased share of renewables.
    Hydrogen and other synthetic fuels generated with renewable electricity may be complementary for
    the transport sector, but have not been considered in all scenarios.
•   Heating: The heating sector can be completely decarbonised by 2040. Biomass will remain the main
    contributor, with increasing investment in highly efficient modern biomass technologies. After 2025, a
    massive growth in solar collectors and increasing proportions of geothermal and environmental heat
    will further reduce the dependence on fossil fuels.
•   Infrastructure: To harvest Costa Rica’s onshore wind and solar resources, as well as geothermal and
    bio energy potential, the power grid must be able to transport large loads from the west coast further
    inland, whereas decentralized power will shoulder a significant part of the residential sector demand.
    Onshore wind requires transmission lines to the load centres of Costa Rica.

                                                         6
UNIVERSITY OF TECHNOLOGY SYDNEY Institute for Sustainable Futures (ISF)
100% Renewable Energy for Costa Rica
Storage: The majority of storage facilities will be required in Guanacaste because this region has Costa
Rica’s largest wind resources and a significant proportion of the wind generation is concentrated here. For
the whole of Costa Rica, the required estimated storage capacity will be between 1.0% and 3.5% in 2050.
This research was led by the University of Technology Sydney–Institute for Sustainable Futures (UTS-
ISF). This report provides a technical and economic analysis of long-term energy and power development
plans for Costa Rica. The analysis is based on the [R]E24/7 energy access pathway methodology
developed by the Institute for Sustainable Futures (ISF) at the University of Technology Sydney (UTS) and
is based on the long-term energy scenario model of the Institute for Thermodynamics of German Aero
Space Centre (DLR), energy models developed for various UTS-ISF surveys, and the [R]E 24/7 model.
Figure 1 provides an overview of the models used and their interactions.
Figure 1: Overview—Modelling concept
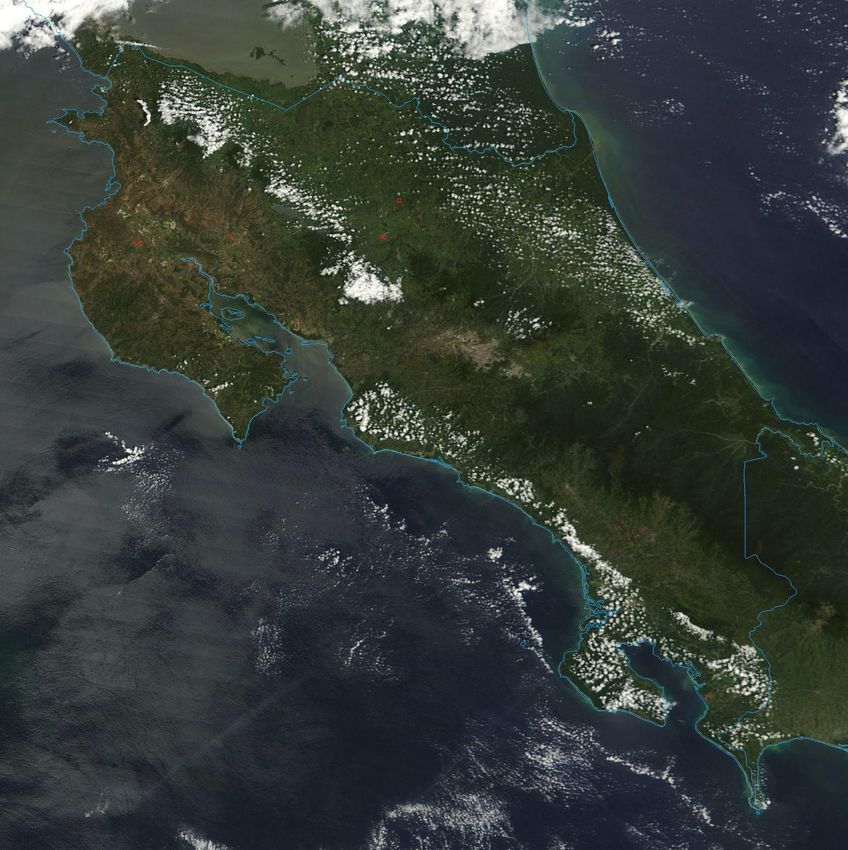
In the mapping analysis, a global information system (GIS) was used for the regional analysis of Costa
Rica’s population density and distribution, its solar and wind resources, and the currently existing energy
infrastructure (transmission power lines and power plants with over 100 MW installed capacity). This
information has been used to define the cluster breakdown.
The long-term scenario—LT [R]E 24/7—has been used to re-model the Plan de Expansion de La
Generation Electrica (GEP 2019)6 which was published in May 2019 (see section 1) and to develop
alternative national energy pathways for Costa Rica. This model considers all sectors (power, heat, and
transport) and includes cost and energy-related CO2 calculations.
The [R]E 24/7 power sector analysis tool computes the annual demand for up to five different years (here
2020, 2030, 2040, and 2050) and the load curves for a full year (8760 h). The hourly load curves are
required for the simulation of the demand and supply for each of the seven regions of Costa Rica. The
results are the development of loads, generation mix, and storage demand.
7UNIVERSITY OF TECHNOLOGY SYDNEY Institute for Sustainable Futures (ISF)
100% Renewable Energy for Costa Rica
Socio-economic data
Projections of population and economic growth are important factors in building energy scenarios because
they affect the size and composition of the energy demand, both directly and through their impact on
economic growth and development.
The current population of Costa Rica is 5 million, an increase from the 4.58 million at the 2011 census.
This makes Costa Rica the 120th most populous country in the world. Population growth has remained
steady at around 1% per year. 80% of the country’s population live in a city or a surrounding urban area.
The capital and largest city is San José, with a population of about 335,000 and a high population density
of 6,455 people per square kilometre. The greater metropolitan area has 2.15 million residents or a third of
the country's entire population. In 2018, the life expectancy at birth for Costa Ricans was 79.8 years,
ranking the country 29th in the world in terms of longevity.
According to projections 1, the population of Costa Rica will grow by 4% per year until 2025 to 5.25 million
people. The population growth is estimated to slow down to around 3% by 2030 and to 1.5% by 2040.
Based on these estimates, the population will increase to 5.76 million by 2050 (see Table 1).
For the development of the energy scenario, it is assumed that Costa Rica’s economic development will
grow by 2.75% per year until 2035 and by 2% until 2050.
Table 1: Costa Rica—Population and GDP projections
t 2017 2020 2025 2030 2035 2040 2045 2050
[billion
GDP 58.2 63 72 82 94 104 115 127
US$2010/a]
GDP/Person [US$/capita] 11,867 12,438 13,696 15,200 16,987 18,416 20,081 22,022
Population [million] 4.902 5.044 5.246 5.413 5.548 5.650 5.721 5.759
2017– 2020– 2025– 2030– 2035– 2040– 2045–
2020 2025 2030 2035 2040 2045 2050
Economic growth [%/a] 2.75% 2.75% 2.75% 2.75% 2.00% 2.00% 2.00%
Population growth [%/a] 4.7% 4.0% 3.4% 2.7% 2.0% 1.4% 0.8%
The electricity demand projections documented in this section were calculated for the residential and
business sectors with the [R]E 24/7 model in a bottom-up process. The further electricity demand entailed
by transport (especially under the two alternative scenarios, with increased electric mobility) and by the
internal electricity demand of power plants (“own consumption”), and the distribution losses are calculated
with the long-term model (see sections 2.2 and 4.2) and added to the calculated demand projections.
However, the [R]E 24/7 power analysis only considers the additional electricity demand for distribution
losses, because the power plant consumption does not influence storage or grid requirements.
1
The Population Pyramid, Online database, viewed September 2019, https://www.populationpyramid.net/costa-rica/2050/
8UNIVERSITY OF TECHNOLOGY SYDNEY Institute for Sustainable Futures (ISF)
100% Renewable Energy for Costa Rica
Projected development of electricity demand
The development of industry and business demand is based on the GDP breakdown (Table 2). It assumes
that the overall structure of the economy does not change and that all sectors grow at rates equal to that
of GDP over the entire modelling period. Table 3 shows the assumed breakdown of GDP by sub-category.
The shares are based on CIA (2019) 2.
Table 2: Development of GDP shares by industry sector across all regions of Costa Rica (2017)
Industry 20.5%
Manufacturing 10.0%
Mining 2.0%
Iron + Steel 1.0%
Cement 1.0%
Construction 5.5%
Energy intensive industry 1.0%
Services 73.5%
Offices & Services 65.5%
Tourism 8.0%
Agriculture 6%
Agriculture 6%
The GDP distribution by region is based on 2017 data and is assumed to remain the same for the entire
modelling period, until 2050. In the industry sector, an efficiency gain of 0.5% per year has been
calculated between 2020 and 2030 and of 0.75% per year between 2031 and 2050. In the service and
agricultural sectors, an efficiency development of 0.5% per year until 2030 has been calculated, with
0.25% for the rest of the modelling period.
Table 3: Development of Costa Rica’s shares of GDP by region
Region [%]
Alajuela 20%
Cartago 11%
Guanacaste 8%
Heredia 10%
Limon 9%
Puntarenas 10%
San Jose 33%
Cost projections
The speed of an energy system transition depends, to some extent, on overcoming the economic barriers.
These largely relate to the relationships between the costs of renewable technologies and those of their
fossil and nuclear counterparts. The projection of these costs for the various scenarios is vital to ensure that
valid comparisons of energy systems are made. However, there have been significant limitations to these
projections, in the past in terms of investment and fuel costs. Moreover, efficiency measures also generate
costs, which are usually difficult to determine, depending on the technical, structural, and economic
boundary conditions. During the last decade, fossil fuel prices have seen huge fluctuations. After extremely
high oil prices in 2012, we are currently in a low-price phase. Gas prices saw similar fluctuations. Therefore,
fossil fuel price projections have also varied considerably and have had a considerable influence on the
scenario outcomes ever since, especially those scenarios that are based on cost optimization algorithms.
Most renewable energy technologies provide energy with no fuel costs, so the projections of investment
costs become more important than the fuel cost projections, and this limits the impact of errors in the fuel
price projections. Fuel costs are only important for biomass-based energy generation because the cost of
feedstock remains a crucial economic factor. Today, these costs range from negative costs for waste wood
(based on credits when waste disposal costs are avoided), through inexpensive residual materials, to
comparatively expensive energy crops.
2
CIA 2019, Central Intelligence Agency, The World Factbook, Central America / Costa Rica, Page last updated October 24, 2019,
https://www.cia.gov/library/publications/the-world-factbook/geos/cs.html
9UNIVERSITY OF TECHNOLOGY SYDNEY Institute for Sustainable Futures (ISF)
100% Renewable Energy for Costa Rica
Table 4: Investment cost assumptions for power generation plants (in US$/kW) until 2050
Assumed Investment Costs for Power Generation Plants
2017 2020 2030 2040 2050
Coal power plant $/kW 1,816 1,816 1,816 1,816 1,816
Lignite power plant $/kW 1,998 1,998 1,998 1,998 1,998
Gas power plant $/kW 608 454 454 454 608
Oil power plant $/kW 863 845 808 781 745
Diesel generator $/kW 817 817 817 817 817
Nuclear power plant $/kW 5,993 5,449 4,631 4,086 4,086
Co-Generation– fossil
CHP coal $/kW 1,456 1,456 1,456 1,456 1,456
CHP gas $/kW 510 510 510 510 510
CHP lignite $/kW 1,456 1,456 1,456 1,456 1,456
CHP oil $/kW 957 937 899 861 823
Renewables
Biomass power plant $/kW 2,179 2,134 2,089 1,998 1,916
Hydro power plant $/kW 4,200 4,200 4,100 4,100 4,100
Wind turbine offshore $/kW 2,200 2,100 1,371 1,317 1,271
Wind turbine onshore $/kW 3,632 3,351 2,897 2,570 2,370
Photovoltaic, rooftop $/kW 1,418 1,181 663 509 427
Photovoltaic—utility scale $/kW 1181 890 663 509 427
Geothermal power plant $/kW 7,700 7,700 7,500 6,600 6,500
CSP power plant (incl. $/kW 5,176 4,540 3,360 2,770 2,488
storage)
Ocean energy power plant $/kW 6,311 6,039 3,996 2,815 1,916
Hydrogen production $/kW 1253 1108 835 636 518
Co-Generation–renewable
CHP biomass $/kW 1,820 1,784 1,747 1,675 2,460
CHP fuel cell $/kW 4540 4540 2270 2270 1017
CHP geothermal $/kW 9,610 8,147 6,476 5,432 4,700
*Costs for a system with a solar multiple of two and thermal storage for 8 h of turbine operation
**Values apply to both run-of-the-river and reservoir hydro power
Table 5: Development projections for fossil fuel prices
Development projections for fossil fuel prices
All Scenarios 2017 2020 2030 2040 2050
Biomass $/GJ 7.80 13.80 20.10 26.20 30.60
Oil $/GJ 6.58 8.80 11.80 13.40 14.50
Gas $/GJ 12.58 13.60 14.00 14.40 14.80
Coal $/GJ 1.95 2.21 3.18 3.50 3.80
Nuclear $/GJ 0.9 0.9 1.1 1.3 1.5
Although fossil fuel price projections have seen considerable variations, as described above, we based
our fuel price assumptions on INEC (2018)6 and LAZARDS (2018) 3. Although these price projections are
highly speculative, they provide a set of prices consistent with our investment assumptions. For bioenergy,
3
LAZARDS (2018); Lazard’s Levelized Cost of Energy Analysis—Version 12.0, November 2018
10UNIVERSITY OF TECHNOLOGY SYDNEY Institute for Sustainable Futures (ISF)
100% Renewable Energy for Costa Rica
we assumed that fuels will be supplied from harvesting and process residuals in a price range of $3/GJ to
$5/GJ (IRENA 2014) 4
Assessment of solar and wind potential
Costa Rica has a largely untapped potential for renewable energy, and the only resource used
significantly is biomass as well as hydro power. Biomass and geothermal resources are utilized in both the
heating and power sectors. Hydro power has only minor potential for further increase because Costa
Rica’s utilization rate for hydro power plants is already close to the maximum level in terms of
sustainability.
Solar energy is abundant, with excellent potential for utility-scale photovoltaic power stations. The three
regions with the highest potential for utility scale solar photovoltaics are Guanacaste, Alajuela and
Puntarenas. However, solar photovoltaic is surprisingly underutilized compared with the available solar
resource and the low generation costs. This is due to unfavourable policy regarding grid connections,
feed-in rates, and construction permits.
Costa Rica’s wind resources are concentrated in the north-western region of Guanacaste, which extends
between Lake Managua and the Pacific Coast. Off-shore wind has not been considered in this study, due
to its close proximity to protected areas. Table 6 shows Costa Rica’s potential for utility-scale solar and
wind power generation under the most restricted scenarios described in section 3.5.
Table 6: Overview—Costa Rica’s utility-scale solar photovoltaic, onshore wind, and offshore wind potential
within 10 km of existing power lines
Cluster Solar Area in km2 Solar Potential Onshore Wind Onshore Wind
in GW Area in km2 Potential in GW
Alajuela 1,584.01 39.60 472.81 1.89
Cartago 483.89 12.10 89.62 0.36
Guanacaste 3,734.38 93.36 3,101.44 12.41
Heredia 381.13 9.53 29.81 0.12
Limon 271.59 6.79 - -
Puntarenas 1,112.53 27.81 80.92 0.32
San Jose 283.15 7.08 19.42 0.08
Total 7,850.68 196.27 3,794.03 15.18
4
IRENA (2014), Global Bioenergy Supply and Demand Projections: A working paper for Remap 2030, International Renewable Energy Energy Agency, Abu Dhabi,
United Arab Emirates
11UNIVERSITY OF TECHNOLOGY SYDNEY Institute for Sustainable Futures (ISF)
100% Renewable Energy for Costa Rica
Figure 2: Potential for utility-scale solar energy generation in Costa Rica
Source: ISF mapping, July 2019
12UNIVERSITY OF TECHNOLOGY SYDNEY Institute for Sustainable Futures (ISF)
100% Renewable Energy for Costa Rica
Assumptions for the scenarios
In February 2019, the government launched its Decarbonization Plan, which defines activities in key sectors
to be implemented in three steps until 2050 in order to achieve a modern, emission-free, resilient and
inclusive economy. 5 The Plan underpins the National Plan for Development and Public Investments and the
long-term Plan Estratégico Costa Rica 2050. To reach this goal, Costa Rica will make changes and
modifications to mobility and transport (both public and private), optimize energy management, promote
sustainable construction and industry, and improve recycling and waste disposal. The Plan offers a roadmap
to promote the modernization of Costa Rica’s economy, generate jobs, and boost its growth, based on the
generation of “3D” services and goods: Decarbonized, Digitized and Decentralized. The planned measures,
activities, and improvements also form part of the country’s extended Nationally Determined Contributions
(NDCs), which Costa Rica will present in 2020 to the UNFCCC. It will thus demonstrate and strengthen its
commitment to reducing greenhouse gas emissions and to its participation in the global effort to avoid a
temperature rise above 2 °C with respect to the pre-industrial era.
The REFERENCE scenario in this analysis is consistent with the Plan de Expansión de La Generación
Eléctrica of May 2019 and suggests two additional scenarios, which go further in the deployment of
renewable energy and energy efficiency across all sectors. The scenario-building process for all scenarios
includes assumptions about policy stability, the role of future energy utilities, centralized fossil-fuel-based
power generation, population and GDP, firm capacity, and future costs.
● Policy stability: This research assumes that Costa Rica will establish a secure and stable framework
for the deployment of renewable power generation. In essence, financing a gas power plant or a wind
farm is quite similar. In both scenarios, a power purchase agreement, which ensures a relatively
stable price for a specific quantity of electricity, is required to finance the project. Daily spot market
prices for electricity and/or renewable energy or carbon are insufficient for long-term investment
decisions for any kind of power plant with a technical lifetime of 20 years or longer. In short, the better
the investment certainty, the lower the cost of capital.
● Strengthened energy efficiency policies: Existing policy settings (i.e., the energy efficiency
standards for electrical applications, buildings, and vehicles) must be strengthened to maximize the
cost-efficient use of renewable energy and achieve high energy productivity by 2030.
● Role of future energy utilities: With the ‘grid parity’ of rooftop solar photovoltaics below most current
retail tariffs, this modelling assumes that energy utilities of the future will take up the challenge of
increased local generation and develop new business models that focus on energy services, rather
than simply on selling kilowatt-hours.
● Population and GDP: All three scenarios are based on the same population and GDP assumptions.
The projections of population growth are documented in Table 11 in section 2.4.
● Cost assumptions: The same cost assumptions are used across all three scenarios. Because
technology costs decline as the scale of deployment increases rather than with time, the renewable
energy cost reduction potential in both RENEWABLES scenarios may be even larger than in the
REFERENCE scenario because of the larger market sizes. The reverse is true for the fuel cost
assumptions because all the scenarios are based on the same fossil fuel price projections, but
whereas both RENEWABLES scenarios have a significant drop in demand, the REFERENCE
scenario assumes an increased demand, which may lead to higher fuel costs. Therefore, these costs
should be considered conservative. The cost assumptions are documented in section 5.3.
5
https://presidencia.go.cr/wp-content/uploads/2019/05/National-Decarbonization-Plan-Costa-Rica.pdf
13UNIVERSITY OF TECHNOLOGY SYDNEY Institute for Sustainable Futures (ISF)
100% Renewable Energy for Costa Rica
Key results—long-term scenario
In the executive summary, we focus on the key results for the power sector and the primary energy
demand. The results for the transport and heating sectors are documented in section 3.
Electricity generation
The development of the electricity supply sector will be characterized by a dynamically growing renewable
energy market and an increasing share of renewable electricity. This trend will more than compensate the
phase-out of oil power plants by 2025 and the increased electricity demand due to electric mobility under
both alternative scenarios. By 2030, 100% of the electricity produced in Costa Rica will come from
renewable energy sources in all scenarios. In the RE1 scenario, ‘new’ renewables—mainly solar
photovoltaic and onshore wind—will contribute 33% to the total electricity generated in 2030 and 54% by
2050. The installed capacity of renewables will reach close to 5,500 MW in 2030 and 12,800 MW by 2050.
Table 7: Costa Rica—Projections of renewable electricity generation capacity
In MW 2015 2020 2030 2040 2050
Hydro REF 1,935 2,356 2,375 2,375 2,375
RE1 1,935 2,342 2,401 2,401 2,401
RE2 1,935 2,342 2,401 2,401 2,401
Biomass REF 40 82 85 86 104
RE1 40 43 167 403 793
RE2 40 48 120 285 555
Wind REF 396 408 490 810 1,318
RE1 396 737 1,552 2,527 4,115
RE2 396 737 1,552 2,527 4,116
Geothermal REF 208 262 322 375 415
RE1 208 262 322 336 385
RE2 208 262 322 336 385
Photovoltaic REF 3 28 585 1,517 2,472
(PV)
RE1 3 35 1,093 2,770 5,080
RE2 3 56 741 4,762 12,857
Total REF 2,682 3,123 3,858 5,165 6,684
RE1 2,681 3,347 5,437 8,417 12,774
RE2 2,681 3,384 5,038 10,290 20,313
The RE2 scenario will also achieve 100% renewable electricity generation in 2030. However, the
renewable capacity will increase after 2030 beyond the RE1 values due to more-ambitious electric
mobility. By 2040, the capacity will reach 10,300 MW and 20,300 MW in 2050, around 8,000 MW higher
than under the RE1 scenario. Table 7 shows the comparative evolution of the different renewable
technologies in Costa Rica over time. The installed capacity of hydro power will dominate as the major
renewable power capacity over decades, but will be taken over by solar photovoltaics in 2040 and will
remain the largest renewable power capacity through-out the remaining scenario period. Wind power will
increase in both RENEWABLES scenarios to just over 4,000 MW, whereas hydro power will remain on
around 2,400 MW. Both renewable scenarios will result in a high proportion of variable power generation
(photovoltaics and wind): 33%–31% by 2030 and 54%–66% by 2050. Therefore, smart grids, demand-
side management, energy storage capacities, and other options must be expanded to increase the
flexibility of the power system to ensure grid integration, load balancing, and a secure supply of electricity.
14UNIVERSITY OF TECHNOLOGY SYDNEY Institute for Sustainable Futures (ISF)
100% Renewable Energy for Costa Rica
Figure 3: Costa Rica—Breakdown of electricity generation by technology
The calculated potential for utility-scale solar power plants (photovoltaic, PV) under all restrictions and
excluding areas further than 10 km from transmission lines is 203,000 MW. Even the most ambitious RE2
scenario can be implemented with the utilisation of only 6% of the utility-scale solar power plant potential.
Additional to this potential, Costa Rica has significant rooftop solar PV potential. The RE1 scenario has
less solar photovoltaic power generation and wind power generation because of the lower electrification
rates in the industry and transport sectors.
In terms of onshore wind, both alternative scenarios use around 25% of the onshore wind potential, with
the highest restriction identified in section 3.5.1 until 2050. However, the wind resource is concentrated in
only one region, Guanacaste, so the transmission capacity must be increased to distribute the electricity
across the country (see section 5).
Primary energy
Based on the assumptions discussed above, the primary energy consumptions under both
RENEWABLES scenarios and the REFERENCE scenario are shown in Figure 4. Under the RE1 scenario,
the primary energy demand will increase from the present level of around 185 PJ/a to around 250 PJ/a in
2030, a reduction of 34%. Compared with the REF scenario, the overall primary energy demand will be
reduced by 52 PJ by 2030 under the RE1 scenario (REF: 298 PJ in 2030). The RE2 scenario will result in
primary energy consumption of around 242 PJ in 2030. In comparison, the REF scenario leads to 437
PJ/a by 2050, whereas the RENEWABLES scenarios will; result in 372 PJ/a (RE1) and 325 PJ/a (RE2).
Figure 4: Costa Rica—Projection of total primary energy demand by energy carrier (incl. electricity import
balance)
The RENEWABLES scenarios aim to reduce the fossil fuel consumption as fast as is technically and
economically possible by the expansion of renewable energy generation and the rapid introduction of very
15UNIVERSITY OF TECHNOLOGY SYDNEY Institute for Sustainable Futures (ISF)
100% Renewable Energy for Costa Rica
efficient vehicles into the transport sector to replace oil-based combustion engines. This will lead to an
overall renewable primary energy share of 61% in 2030 and 78% in 2050 in the RE1 scenario and 100%
in 2050 in the RE2 scenario (excluding non-energy consumption).
Power sector analysis
Costa Rica’s current plans for the future development of the power capacities (GEP)6 will maintain a share
of over 90% renewable electricity, but will not be sufficient to supply the transport sector to satisfy the
additional power demand in the face of a shift of electric mobility. Therefore, the transport sector will be
increasingly dependent on imported oil, and carbon emissions would continue to rise, even with a
decarbonized power sector. The current installed power plant capacity will reach 3.5 GW, with a majority
of hydro power (2.4 GW). The capacity of solar photovoltaics and onshore wind will increase under all
three scenarios. However, the solar photovoltaic market varies significantly. Whereas the annual average
market until 2025 will range around only 3 MW per year under the REFERENCE scenario, RE1 requires
an annual installation of 15 MW and the RE2 scenario 85 MW. However, after 2025, the solar photovoltaic
market will grow substantially in all scenarios reflecting the cost advantages for solar systems. The wind
market will significantly increase and will reach around 175 MW per year at the end of the modelling
period – between 2040 and 2050. Almost all wind farms will be located in Guanacaste, the province with
the most favourable wind resource. Furthermore, Costa Rica will increase its geothermal capacities as
projected under the Generation Expansion Plan (GEP)6. Additional bio-energy capacity will add to the
diverse renewable power generation mix after 2025.
Development of load, generation and residual load
Table 8: Costa Rica—Projection of load, generation, and residual load until 2050
REF RE1 RE2
Costa Rica
Development of load Max. Max. Max. Peak Max Max Max Peak Max Max Max Peak
and generation load Demand Residual load Demand Generati Residual load
Demand Generati Residual increase Generati Load increase on Load increase
on Load on
Costa Rica [GW/h] [GW/h] [GW/h] [%] [GW/h] [GW/h] [GW/h] [%] [GW/h] [GW/h] [GW/h] [%]
2020 0.4 0.3 0.2 100% 0.4 0.4 0.2 100% 0.5 0.5 0.1 100%
Alajuela
2030 0.5 0.5 0.1 113% 0.6 0.5 0.2 128% 0.6 0.6 0.1 118%
2050 0.7 0.7 0.3 165% 1.0 1.0 0.5 228% 1.2 2.4 0.8 231%
2020 0.2 0.4 0.0 100% 0.2 0.4 0.0 100% 0.3 0.6 0.1 100%
Cartago 2030 0.2 0.5 0.0 113% 0.3 0.5 0.0 128% 0.3 0.6 0.0 118%
2050 0.4 0.7 0.1 165% 0.5 0.8 0.0 228% 0.6 1.1 0.1 231%
2020 0.2 0.3 0.0 100% 0.2 0.3 0.0 100% 0.2 0.3 0.1 100%
Guanacaste 2030 0.2 0.7 0.0 111% 0.2 1.5 0.1 126% 0.2 1.5 0.0 116%
2050 0.2 1.8 0.1 151% 0.4 4.1 0.1 215% 0.4 4.6 0.2 220%
2020 0.2 0.2 0.0 100% 0.2 0.2 0.1 100% 0.3 0.3 0.1 100%
Heredia
2030 0.2 0.2 0.1 111% 0.3 0.3 0.1 126% 0.3 0.3 0.0 116%
2050 0.3 0.4 0.2 151% 0.5 0.5 0.2 215% 0.6 1.2 0.4 220%
2020 0.2 0.2 0.0 100% 0.2 0.3 0.0 100% 0.2 0.4 0.1 100%
Limon
2030 0.2 0.2 0.0 111% 0.2 0.2 0.0 126% 0.3 0.3 0.0 116%
2050 0.3 0.4 0.1 152% 0.4 0.5 0.2 216% 0.5 1.0 0.3 221%
2020 0.2 0.2 0.0 100% 0.2 0.2 0.1 100% 0.3 0.3 0.1 100%
Puntarenas
2030 0.2 0.2 0.1 111% 0.3 0.2 0.1 126% 0.3 0.3 0.0 116%
2050 0.3 0.4 0.2 152% 0.5 0.5 0.2 216% 0.6 1.2 0.4 221%
2020 0.6 0.5 0.2 100% 0.6 0.6 0.2 100% 0.7 0.9 0.2 100%
San Jose
2030 0.7 0.7 0.2 130% 0.9 0.8 0.3 144% 1.0 1.0 0.1 131%
2050 1.1 1.2 0.6 195% 1.6 1.6 0.8 259% 1.9 3.8 1.1 261%
2020 2.0 2.2 0.6 100% 2.1 2.4 0.6 100% 2.5 3.3 0.7 100%
Costa Rica
2030 2.3 3.1 1.0 112% 2.7 4.1 1.0 127% 3.0 4.7 0.3 117%
2050 3.3 5.4 2.0 156% 4.8 8.9 2.0 220% 5.9 15.3 3.1 224%
Figure 8 shows that Costa Rica’s average load is predicted to increase over the next decade by
approximately 15% under the REFERENCE and RENEWABLES 1 scenarios, and by 27% under the
16UNIVERSITY OF TECHNOLOGY SYDNEY Institute for Sustainable Futures (ISF)
100% Renewable Energy for Costa Rica
RENEWABLES 2 scenario. The RE2 scenario will have the highest peak load by 2050, as a result of
increased electrification of the heating and transport sectors, and the energy efficiency targets are more
ambitious than under the RE1 scenario. The RE2 scenario has a stringent electrification strategy, especially
in the transport sector, with an earlier phase-out target for fossil fuels for the transport sector, but a more
ambitious energy efficiency strategy. In comparison, the load under RE1 in 2050 will be 1.5 GW higher than
in the REF scenario, but 1.1 GW lower than under the RE2 scenario.
Although there are regional differences, load will increase in percentage across all regions quite similarly.
However, the actual loads will be significantly different between the regions. The lowest peak load will be in
Guanacaste in 2050, of only 400 MW, whereas the maximum calculated generation capacity will reach
4,600 MW. However, the San José region will continue to have the highest peak load at around 1,900 MW
(RE2), with maximum generation of 3,800 MW, which is twice the maximum demand. This is an indication
of the need to introduce energy efficiency parallel to the implementation of electric mobility to limit the
required investment in the upgrade of Costa Rica’s power grid infrastructure. However, in any case and
independent of the type of power generation, the power grid must by expanded over the next two decades,
because increased electric mobility will require additional capacity in the power grid to accommodate the
higher charging loads for vehicles. However, the locations of transmission grids will be dependent on the
form of generation because the locations of generation and the demand centres may differ for decentralized
and centralized power generation.
Storage requirements
The quantity of storage required is largely dependent on the storage costs, grid expansion possibilities,
and the generation mix itself. In terms of grid expansion, the geographic situation greatly influences the
construction costs; crossing mountains, rivers, or swamps is significantly more expensive than crossing
flat lands. Furthermore, the length of the permission process and whether people will be displaced by grid
expansions may make storage economically preferable to grid expansion, even though the current
transmission costs are lower per megawatt-hour than storage costs. In general terms, PV-dominated grids
correlate directly with high storage requirements, in both power capacity and energy capacity. Conversely,
wind-dominated scenarios require significantly lower storage power and energy capacities, if grid
expansion is unlimited or cheap.
In all scenarios, the share of variable generation will not exceed 30% by 2030 in any region, except in one,
Guanacaste, where the share will already be around 80%.
The REFERENCE scenario requires the lowest storage capacity for Costa Rica, with the majority
concentrated in the wind-dominated region. The oversupply in the North West region will result from the
high installed capacity (relative to the local load) of onshore wind. The RE1 scenario will lead to around
2.5 times higher storage capacity than the REFERENCE scenario, all of which will be located in
Guanacaste. By 2030, only one region will require storage in all scenarios, whereas by 2040, storage will
be required in all seven regions. The storage requirements have been assessed based on the
assumptions that all the regions will have established interconnection capacities, as indicated in section
4.3, and that the economic curtailment rates will be fully exhausted.
Table 9 gives an overview of the estimated storage capacity requirements for both RENEWABLES
scenarios. The majority of storage facilities will be required in Guanacaste because this regions has Costa
Rica’s largest wind resources and a significant proportion of wind generation will be concentrated here.
For the whole of Costa Rica, the required estimated storage capacity will be 1.0% of the total variable
generation in 2050 under the RE1 scenario, and 3.5% under the RE2 scenario. However, there will be
significant regional differences. To remain within the economic curtailment range, storage will be required
in all regions under both scenarios. For the whole of Costa Rica, the simulation of renewable power
generation in scenarios RE 1 and RE2 will lead to storage requirements of 76 GWh/a and 719 GWh/a,
respectively, with installed input/output capacities of 60–100 MW and around 600 MW, respectively. The
requirement for utility-scale storage will occur by 2030. The storage demand will vary significantly and will
be a function of the regional distribution of variable power generation and the extent to which the regions
can exchange load via interconnections.
The storage capacity in electric vehicles is not included in this calculation and is assumed to be used for
load management via charging strategies, but not as storage capacities for stationary power system
requirements.
17You can also read


