Wind sensing with drone-mounted wind lidars: proof of concept - Atmos. Meas. Tech
←
→
Page content transcription
If your browser does not render page correctly, please read the page content below
Atmos. Meas. Tech., 13, 521–536, 2020
https://doi.org/10.5194/amt-13-521-2020
© Author(s) 2020. This work is distributed under
the Creative Commons Attribution 4.0 License.

Wind sensing with drone-mounted wind lidars: proof of concept
Nikola Vasiljević1 , Michael Harris2 , Anders Tegtmeier Pedersen1 , Gunhild Rolighed Thorsen1 , Mark Pitter2 ,
Jane Harris3 , Kieran Bajpai3 , and Michael Courtney1
1 TechnicalUniversity of Denmark – DTU Wind Energy, Frederiksborgvej 399, Building 118-VEA, 4000 Roskilde, Denmark
2 ZX Lidars, The Old Barns, Fairoaks Farm, Hollybush, Ledbury HR8 1EU, UK
3 Department of Physics, University of Exeter, Exeter EX4 4QL, UK

Correspondence: Nikola Vasiljević (niva@dtu.dk)

Received: 14 March 2019 – Discussion started: 17 July 2019
Revised: 4 December 2019 – Accepted: 11 December 2019 – Published: 7 February 2020

Abstract. The fusion of drone and wind lidar technology in-      stalled capacity of wind energy has seen a consistent growth
troduces the exciting possibility of performing high-quality     of about 5 %. Wind power accounted for 55.2 % of total in-
wind measurements virtually anywhere. We present a proof-        stalled power in Europe in 2017 (WindEurope, 2018) and
of-concept (POC) drone–lidar system and report results from      overall represents 18 % of total installed power generation
several test campaigns that demonstrate its ability to mea-      capacity. Wind energy satisfies about 11.6 % of total EU elec-
sure accurate wind speeds. The POC system is based on            tricity demands (WindEurope, 2018).
a dual-telescope continuous-wave (CW) lidar, with drone-            The growth of wind energy is heavily dependent on accu-
borne telescopes and ground-based optoelectronics. Com-          rate wind speed measurements, which are essential for vari-
mercially available drone and gimbal units are employed.         ous applications, such as the prediction of annual energy pro-
The demonstration campaigns started with a series of com-        duction (AEP) for wind farms and power curve verifications.
parisons of the wind speed measurements acquired by the          Given the size of modern wind turbines, which today oper-
POC system to simultaneous measurements performed by             ate between 60 to 220 m above ground level (a.g.l.), and the
nearby mast-based sensors. On average, an agreement down         need to capture wind across the entire rotor plane, there is a
to about 0.1 m s−1 between mast- and drone-based measure-        demand for measurements at heights well above 100 m.
ments of the horizontal wind speed is found. Subsequently,          However, beyond 60 m a.g.l. conventional in situ wind
the extent of the flow disturbance caused by the drone down-     speed measurements require costly towers. Any tower-based
wash was investigated. These tests vindicated the somewhat       measurement is usually prohibitively expensive, especially
conservative choice of lidar measurement ranges made for         offshore. These economic realities have fostered the devel-
the initial wind speed comparisons. Overall, the excellent re-   opment of ground-based (Courtney et al., 2008), nacelle-
sults obtained without any drone motion correction and with      mounted (Borraccino et al., 2016), floating (Gottschall et al.,
fairly primitive drone position control indicate the potential   2017) and multi-lidar (Vasiljević et al., 2016) systems, all of
of drone–lidar systems in terms of accuracy and applications.    which are now competitive in various wind energy use cases.
The next steps in the development are outlined and several          Wind lidars, unlike conventional anemometry, retrieve in-
potential applications are discussed.                            formation about the wind without being in direct contact with
                                                                 the moving air. This is done by remotely probing the atmo-
                                                                 sphere using laser light. Two types of Doppler wind lidars are
                                                                 available, distinguished by how they probe the atmosphere
1   Introduction                                                 (Courtney et al., 2008). Continuous-wave (CW) lidars stream
                                                                 a continuous laser beam, focused at the location of interest.
For many years, wind energy has been one of the fastest-         Pulsed lidars stream a burst of short laser pulses and can re-
growing power production technologies in Europe. Based on        trieve wind speeds at various distances along this line. CW
average predictions, wind will deliver a quarter of power de-    lidars have a typical range from 10 to 250 m, with a high
mands in Europe by 2030 (EWEA, 2015). The annual in-

Published by Copernicus Publications on behalf of the European Geosciences Union.
522                                    N. Vasiljević et al.: Wind sensing with drone-mounted wind lidars: proof of concept

measurement frequency (several hundred scans per second            systems, are needed to accurately retrieve the full wind flow.
are possible in good conditions) at a single range. Pulsed li-     This of course drastically increases costs (several lidars) as
dars have a range from 50 m up to 10 km, with a low mea-           well the complexity of measurements (installation, configu-
surement frequency (around 1 Hz) but the ability to measure        ration, synchronization and monitoring) and corresponding
at many ranges simultaneously.                                     data analysis (processing and integrating several datasets).
   Since the introduction of wind lidars in the wind energy        This is one of the main reasons why multi-lidar measure-
domain in 2003 (Harris et al., 2007), they have been exten-        ments are mainly used in research projects for short-term
sively used in industry and research for resource assessment       measurement campaigns (e.g., Lundquist et al., 2017; Mann
(Krishnamurthy et al., 2013), wind turbine power curve mea-        et al., 2017; Fernando et al., 2019).
surements (Wagner et al., 2014), feed-forward control (Sim-           To formulate the research problem, currently there are no
ley et al., 2018), wake measurements (Herges et al., 2017),        measurement solutions that would provide the following fea-
wake steering (Fleming et al., 2017) and short-term fore-          tures:
casts (Würth et al., 2019). Over the last decade wind lidars
have became an established measurement technique within              – low-cost, yet accurate measurements at all sites (off-
the wind energy community. Beyond the wind energy do-                  shore, flat and complex terrain) and at altitudes where
main, wind lidars have been used in wind engineering, es-              modern wind turbines operate (60 to 220 m a.g.l.),
pecially to provide wind measurements to properly estimate           – a simple approach for performing measurements in dif-
wind loading on bridges (Cheynet et al., 2017). Historically           ferent locations in the atmosphere (mobile measure-
(since the 1980s), wind lidars have been used extensively in           ments),
variety of atmospheric science studies (e.g., McCarthy et al.,
1982; Newsom et al., 2008; Collier et al., 2005; Grubišić           – high-frequency measurements with a small probe vol-
et al., 2008; Fernando et al., 2015).                                  ume (i.e., simultaneous mean flow and turbulence mea-
   Even though wind lidars are cost-attractive instruments for         surements),
measurements beyond 100 m, they are still relatively expen-
sive. A minimum cost of an accurate wind lidar is about              – high availability of data (i.e., not to be hindered by fog,
EUR 60 000 and EUR 1–2 million for onshore and offshore                low clouds, etc.),
applications, respectively.                                          – long measurement duration (e.g., months).
   Also, there are circumstances where wind lidars can ex-
perience difficulties, in which traditional in situ measure-          A potential solution for the above-formulated problem is
ments can measure successfully. Lidar range is influenced by       to use a small unmanned aircraft system (SUAS), such as
atmospheric conditions (i.e., aerosol concentrations), which       multi-copter drones, as a platform for a wind lidar even
impacts the data availability (in certain locations lidar data     though SUAS currently cannot offer a long uninterrupted op-
availability can fall below mast-based sensor data availabil-      eration. Typically, SUAS acquires wind speed information
ity). For example, clouds, fog and snow are highly attenuat-       either by utilizing flow sensors, such as multi-hole pitot tube
ing for the laser beam, which limits the lidar range and thus      probes (e.g., Wildmann et al., 2014) or sonic anemometers
data availability. Furthermore, any precipitation will affect      (e.g., Nolan et al., 2018), or without flow sensors by measure-
the wind speed measurements by lidars. Specifically, the ver-      ment and conversion of aircraft dynamics (e.g., Neumann
tical component of the wind will be biased since the lidar         and Bartholmai, 2015). For example, studies by Neumann
will dominantly measure the fall velocity of the precipitation     and Bartholmai (2015), Palomaki et al. (2017), and Brosy
(Lindelöw, 2009).                                                  et al. (2017) utilized real-time measurements of multi-copter
   Beyond the range of 50 m, independent of the lidar type,        dynamics to estimate wind speed. These studies reported a
the effects of measurement volume become significant, and          good agreement of the estimated wind speed with the speed
this limits the lidar applicability for the assessment of small-   measured by mast-mounted sonic anemometers, where the
scale turbulence. Single lidars only measure the projection        sonic anemometer and estimated wind speed agreed to about
of the wind velocity on the laser propagation path (i.e., ra-      0.5 to 0.7 m s−1 for 10 s averaged data (Palomaki et al., 2017;
dial velocity), which in fact requires assumption of the hor-      Brosy et al., 2017) and 0.3 m s−1 for 20 s averaged data (Neu-
izontal homogeneity of the flow to reconstruct the wind            mann and Bartholmai, 2015). Brosy et al. (2017) stated that
speed (Browning and Wexler, 1968; Strauch et al., 1987).           the wind speed estimated using only drone dynamics should
This bounds the usability of single lidars to offshore sites       not be used as information about atmospheric turbulence
(Peña et al., 2008) and sites with simple topography onshore       since, due to the volume, drones do not react to the small
(Courtney et al., 2008). Therefore, when the flow is com-          eddies, and thus this approach cannot capture a full range
plex, as it is the case in more than 50 % of the onshore sites     of wind speeds. In the LAPSE-RATE experiment (Barbieri
(e.g., hilly terrain) with good wind resources (Bingöl, 2010),     et al., 2019) several multi-copter drones were equipped with
multi-lidar instruments, such as long-range (Vasiljević et al.,   sonic anemometers. The calibration flights of such drones
2016) or short-range (Sjöholm et al., 2014) WindScanner            (which entail hovering the equipped drones close to masts

Atmos. Meas. Tech., 13, 521–536, 2020                                                 www.atmos-meas-tech.net/13/521/2020/
N. Vasiljević et al.: Wind sensing with drone-mounted wind lidars: proof of concept                                           523

equipped with sonic anemometers) showed agreement be-                 In this paper we present the preliminary results of realizing
tween the mast- and drone-based 15 s averaged wind speed           the aforementioned drone–lidar system in practice. Specif-
measurements to about 0.75 m s−1 (Nolan et al., 2018). Like        ically, we will present the results of the proof-of-concept
in the case of multi-copter drones, the aircraft dynamics          (POC) stage of a drone-based wind lidar system develop-
of fixed-wing SUAS can be used to determine wind speed             ment. As such, the POC system is developed only to demon-
(Rautenberg et al., 2018), with the wind speed accuracy gen-       strate the feasibility of the proposed concept and thus to show
erally worse than multi-copter drones (Barbieri et al., 2019).     that the concept has practical potentials.
As stated in Rautenberg et al. (2018), utilizing a flow sensor,       The paper is organized as follows. Section 2 presents the
such as a pitot tube, on board the fixed-wing SUAS generally       POC drone-based wind lidar system. Section 3 presents re-
provides better results. Nevertheless, as reported in Barbieri     sults of several demonstration experiments conducted with
et al. (2019), an average accuracy of SUAS of both fixed-          the described measurement system. Section 4 discusses the
wing and multi-copter concepts with or without flow sensors        results of the POC stage as well as outlines our future work,
is about 0.5 m s−1 , which for the majority of wind energy ap-     while Sect. 5 provides our concluding remarks.
plications is not sufficient.
   However, the accuracy and the ability of the system to
acquire turbulence measurements could potentially be im-           2     Measurement system description
proved if we use a wind lidar as a flow sensor. Equipping
SUAS with wind lidars has been suggested in an early study         2.1    Overview
using SUAS for wind energy applications (Giebel et al.,
2012). At the time of the study, it was technically unfeasi-       For the POC, we used a non-production dual-telescope CW
ble to pursue this idea. Roughly a decade later, both the lidar    lidar system built by ZX Lidars (ZXT2 lidar) and an off-
and drone technology have advanced significantly, unlocking        the-shelf drone and gimbal system (DJI Matrice 600 Pro and
the potential to explore the proposed idea.                        Ronin-MX). The selected drone and gimbal system are typi-
   In the concept we propose in this paper the drone would be      cally used in the motion picture industry, while the lidar was
used to position the lidar in the vicinity of the measurement      optimized for wind tunnel measurements or for turbine blade
points and to steer the outgoing laser beam. This would have       mounting, thus the transceiver units (telescopes) are sepa-
several radical implications on wind lidar development.            rated from the rest of the lidar.
   First, the required maximum range would be on the order            Instead of mounting the entire lidar to the drone, for the
of a few meters (i.e., just enough to avoid the impact of the      POC we only mounted the telescopes to the gimbal (attached
drone downwash on intended measurements of the free flow).         to the drone). The telescopes were connected to the lidar
Second, since the drone can be used to steer the outgoing          located on the ground using 100 m long optical fibers. The
laser beam the lidar would not need to have a variable focus       drone was battery powered.
or a scanning mechanism. Third, since the drone alone can             The main reason why the POC system was built as de-
be used to sense the wind (see Brosy et al., 2017), we can         scribed above was that it did not require any costly devel-
eliminate an acousto-optic modulator (AOM) from the lidar          opment since many of the parts were already built or were
design because the Doppler shift sign can be calculated from       readily available off the shelf. Moreover, since we intended
the drone dynamics.                                                to investigate the overall feasibility of the proposed concept,
   The combination of the above-described implications             this type of study (i.e., proof of concept) is often undertaken
leads to a significant reduction in the lidar complexity (fewer    on a much lower budget and before investing in the build of
and cheaper components), size, weight, and power consump-          a full prototype or product development.
tion and thus potentially in the overall costs.                       In the text that follows, we will describe each part of the
   The requirements for the drone-mounted lidar can be met         POC measurement system in more detail.
by a low-power small-optics CW lidar with a manual fo-
cus adjustment. The use of CW technology will allow for a          2.2    Lidar system
high measurement frequency (∼ 50 Hz). Due to the expected
short focus range, the resulting probe length would be rather      The ZXT2 lidar is an experimental system that was built in
small (∼ 10 cm), allowing accurate measurements of both the        2014 (Neininger, 2017). It has since been used in a variety of
mean wind and turbulence. Additionally, short-range mea-           trials, including several wind tunnel tests and lidar calibration
surements would not be hindered by fog or clouds. In fact,         exercises. ZXT2 is a two-channel CW wind lidar system con-
these atmospheric conditions would be favorable due to the         sisting of a 3U 19 in. (48.2 cm ) rack unit with two separate
substantially increased backscatter and thus an improvement        staring transceiver units (telescopes), allowing simultaneous,
in signal-to-noise (SNR) ratio and data availability. Addition-    continuous and independent line-of-sight (LOS) wind mea-
ally, if we have a fully non-tethered drone, measurements can      surements. It achieves this by sharing the laser power 50/50
be made in difficult locations, such as above thick forests that   between the two channels. As a result, the unit exhibits re-
do not have suitable clearings for ground-based lidars.            duced sensitivity compared to a unit that uses 100 % of the

www.atmos-meas-tech.net/13/521/2020/                                                     Atmos. Meas. Tech., 13, 521–536, 2020
524                                    N. Vasiljević et al.: Wind sensing with drone-mounted wind lidars: proof of concept

power in a single channel. The main specifications are listed
in Table 1.
   The rack unit contains an internal Windows PC; normal
operation involves accessing the internal PC via remote desk-
top. In the drone experiment, the telescopes with a 1 in. aper-
ture were connected to the rack unit with lightweight 100 m
fiber cables. Four fibers were required to provide the transmit
and receive paths on the two channels.
   The beam from each telescope is brought to a near-
diffraction-limited focus, at a distance that can be manually
adjusted on the ground then locked in position. The total laser
output can range from 0.3 to 1.3 W, but here it was set to
0.8 W, giving an output on the order of 0.3 W on each channel
(after accounting for losses). This output level provided ex-
cellent signal strength under the conditions experienced dur-
ing the tests. Care was taken to avoid fiber bend losses during    Figure 1. Complete system on the ground. Purple squares: three
flight operations.                                                 central GNSS antennas for positioning; turquoise squares: two
   The detector output is sampled at 100 MHz, and Doppler          DGNSS receivers with RTK for real-time position correction; yel-
                                                                   low square: four joined optical fibers; and red square: gimbal with
signals are obtained as an average of 4000 independent
                                                                   telescopes and GoPRO camera. Picture taken from the following
512-point fast Fourier transformation spectra. Each averaged       photo gallery: https://work.courtney.dk/#collection/364601, last ac-
spectrum consists of 256 bins, spanning a speed range 0–           cess: 28 January 2020.
39 m s−1 and allowing calculation of LOS wind speed via
different estimation algorithms. For this experiment, a sim-
ple median method was used (e.g., Held and Mann, 2018) so
that the basic output consists of two simultaneous channels        measurements and providing improved measurements of
of speed values at nearly 50 Hz data rate. ZXT2 is a homo-         the drone orientation, we have additionally equipped the
dyne system (no AOM), and therefore the sign of the Doppler        drone with two receivers for real-time differential GNSS
shift was not detected. For systems that use AOMs, the out-        measurements (DGNSS), which communicate with a mobile
going laser light frequency is shifted in order to be able to      ground-based real-time kinematics (RTK) station (i.e.,
detect the sign of the Doppler shift of the backscattered light.   rover). The baseline distance between the two DGNSS
One approach to eliminate an AOM from the lidar design is          antennas of 25 cm allows the orientation measurements
to have an external source of information about the wind di-       accuracy to be about 0.8◦ , as stated by DJI in the product
rection, which in the case of Zephir profiling lidars is accom-    sheet (DJI, 2017). Beside the GNSS receivers, the drone is
plished by having an additional wind sensor attached to the        equipped with three inertia measurement units (IMUs). The
lidar (Courtney et al., 2008). All raw spectral data are stored    combination of RTK and IMU should, in principle, provide
to allow more detailed analysis to be carried out if required.     a solid foundation for accurate measurements of the drone’s
                                                                   six degrees of freedom (6DOF) in real time (i.e., position,
2.3   Drone and gimbal                                             orientation, leveling, velocity and acceleration). The drone
                                                                   has been equipped with an onboard camera to provide visual
DJI Matrice 600 Pro is an aerial platform built for various        information. DJI provides a well-documented software
industrial and scientific applications (DJI, 2018). This           development kit (SDK) and an application programming
hexacopter has a solid loading capability and hovering             interface (API) for the drone that allows the development of
time of about 20 min, with a payload of about 5 kg (see            automated drone applications.
Table 2 for the basic drone specifications). The flight               To improve the stability (e.g., damp vibrations), orien-
time can be significantly improved by converting the               tation and tilt of the drone-mounted telescopes we have
drone to be tethered (e.g., power line auto-track tension          equipped the drone with a three-axis programmable gimbal
system,         https://15ztv31uyflip68j23s11j11-wpengine.         system (Ronin-MX; see the basic specifications in Table 3
netdna-ssl.com/wp-content/uploads/2017/09/                         extracted from the product sheet DJI, 2016). This avoids the
Brochure-M600-PowerLine-Tethered-Drone1-1AT.pdf,                   need to develop a custom beam steering unit. The gimbal
last access: 28 January 2020). The drone comes equipped            system can be used stand-alone and as an integrated part
with three Global Navigation Satellites System (GNSS)              of the drone. It comes with its own IMU and a 32 bit digi-
receivers for position measurements (accuracy of a few             tal signal processor (DSP), which acts as a control unit for
meters). The drone has a modular design, which allows              three servo motors equipped with encoders on their shafts.
the integration of both the DJI-branded sensors as well as         There are wired and wireless options when it comes to the
third-party sensors. For boosting the accuracy of position         communication with the gimbal system. Like in the case of

Atmos. Meas. Tech., 13, 521–536, 2020                                                   www.atmos-meas-tech.net/13/521/2020/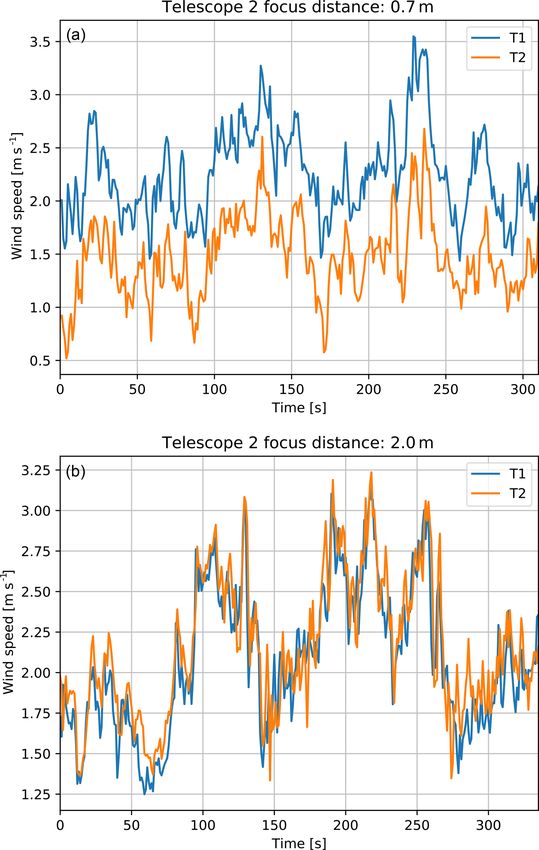
N. Vasiljević et al.: Wind sensing with drone-mounted wind lidars: proof of concept 525
Table 1. Basic specifications of the ZXT2 lidar.
Base unit dimensions 3U 19 in. rack unit
Length of fibers connecting telescopes to base unit 100 m
Type of fibers single mode
Telescope dimensions 25 cm length by 3 cm diameter
Telescope weight 100 g
Focal range 0.5 to 50 m
Transmitted laser power 300 mW CW per channel
Laser wavelength 1.56 µm
Probe length (FWHM) approx. 5 cm at 3 m range
Line-of-sight speed range ±0.3–39.0 m s−1 (sign not distinguishable)
Analog-to-digital converter sample rate 100 MHz on both channels simultaneously
Data rate 48.83 Hz independent line-of-sight speed values on both channels
Number of averages per measurement 4000
Bin width 0.1523 m s−1
Table 2. Basic specifications of the drone from the DJI product sheet (DJI, 2018, 2017).
Dimensions 1668 mm (width) × 1518 mm (length) × 727 mm (height)
Dimensions (folded) 437 mm (width) × 402 mm (length) × 553 mm (height)
Weight ∼ 10 kg
Maximum takeoff weight ∼ 15 kg
Hovering time no payload ∼ 35 min
Hovering time with ∼ 5 kg payload ∼ 20 min
Operating temperature −10 to 40 ◦ C
Maximum angular velocity tilt: 300◦ s−1 ; yaw: 150◦ s−1
Maximum ascent velocity 5 m s−1
Maximum descent velocity 3 m s−1
Maximum flying velocity in zero wind 18 m s−1
Maximum wind resistance (recommended) 8 m s−1
Hovering uncertainty horizontal: ±1.5 m; vertical: ±0.5 m
Position read-out uncertainty (with RTK) horizontal: ±1 cm; vertical: ±2 cm
Orientation read-out uncertainty (with RTK) ±0.8◦
the drone, DJI provides a well-documented SDK and AP for 3 Measurement campaign descriptions
the gimbal system, allowing, for example, the implementa-
tion of custom motion profiles for all three axes, either as As a part of the POC stage of the drone-based wind lidar sys-
feed rates (constant velocity) or time moves. Therefore, the tem development we performed several measurement cam-
gimbal system alone can act as a very good beam steering paigns. In comparison to more typical wind measurement
unit (i.e., scanner). Overall, the entire drone ecosystem (hard- campaigns (e.g., Vasiljević et al., 2017), the POC stage cam-
ware, software, documentation, etc.), provides a means for paigns were shorter in duration (10 to 30 min). With the POC
developers to adapt the drone and gimbal for various appli- campaigns our prime focus was to demonstrate the feasibility
cations. It should be pointed out that the specifications pro- of the drone-based wind lidar concept.
vided in Tables 2 and 3 are acquired from DJI product sheets To operate the drone we followed the Danish drone rules
and thus need to be validated. set by the Danish transport, construction and housing author-
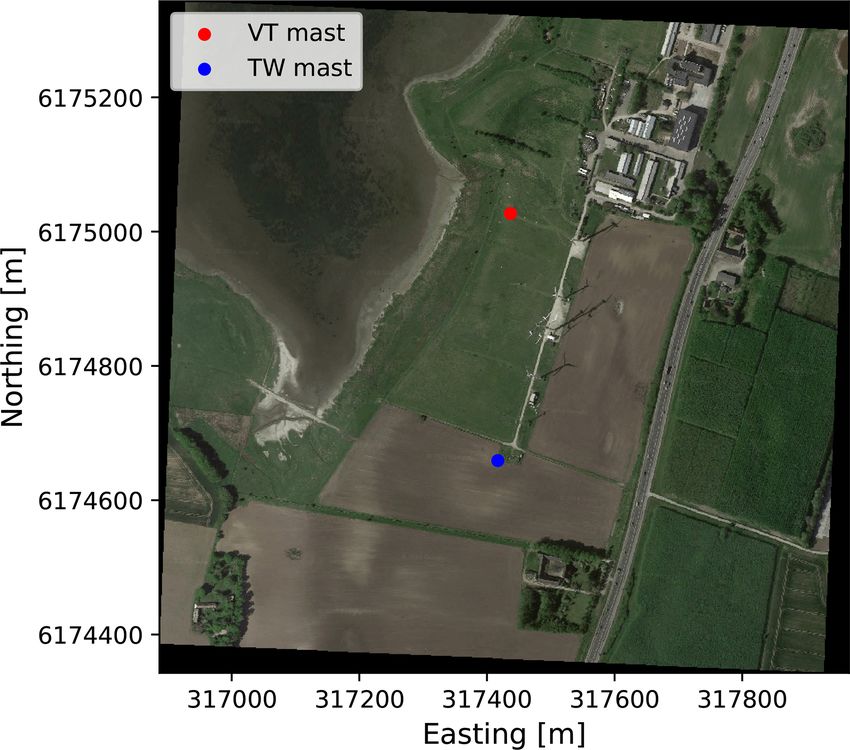
To attach the two telescopes to the gimbal, we have 3-D ity. Our drone pilots were required to have drone licenses.
printed a mounting bracket for the telescopes. The bracket The campaigns took place at the DTU Risø campus. The
was made such that it allows manual setup of the “open- campus is located 5 km north of Roskilde, on the island of
ing” angle between telescopes. The bracket was attached to Zealand, Denmark. Within the campus there is a test cen-
a custom-made aluminum “tray” that slides into the gimbal ter for wind turbines (Fig. 3). The test center is surrounded
camera mounting system. The tray also had a mount for a Go- by the Roskilde fjord (to the west), campus buildings (to the
Pro camera. The entire custom-built sensor setup is shown in north) and agricultural land (to the east and south). It is lo-
Fig. 2. cated in flat terrain, though the terrain mildly slopes in the
direction from the fjord towards the row of turbines. The
www.atmos-meas-tech.net/13/521/2020/ Atmos. Meas. Tech., 13, 521–536, 2020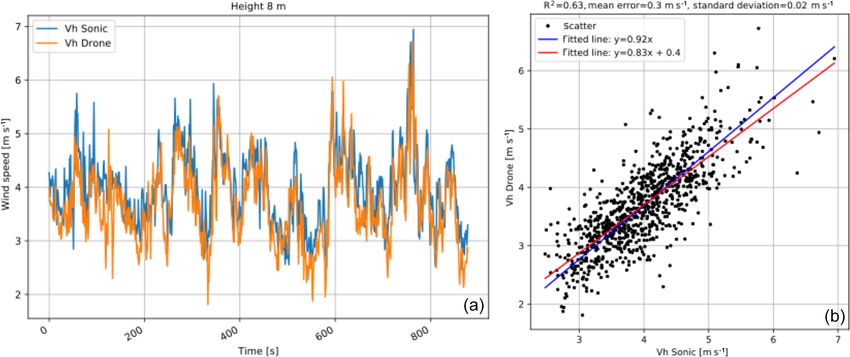
526 N. Vasiljević et al.: Wind sensing with drone-mounted wind lidars: proof of concept
Table 3. Basic specifications of gimbal from the DJI product sheet (DJI, 2016).
Dimensions 280 mm (width) × 370 mm (length) × 340 mm (height)
Maximum dimensions of attached peripherals (recommended) 160 mm (width) × 120 mm (depth) × 130 mm (height)
Weight (with vibration absorber) 2.15 kg
Maximum payload weight 4.5 kg
Runtime 3h
Operating temperature −15 to 50 ◦ C
Maximum controlled angular velocity yaw axis: 200◦ s−1 ; pitch axis: 100◦ s−1 ; roll axis: 30◦ s−1
Angular range yaw axis: endless; pitch axis: +270 to −150◦ ; roll axis: ±110◦
Angular accuracy ±0.02◦
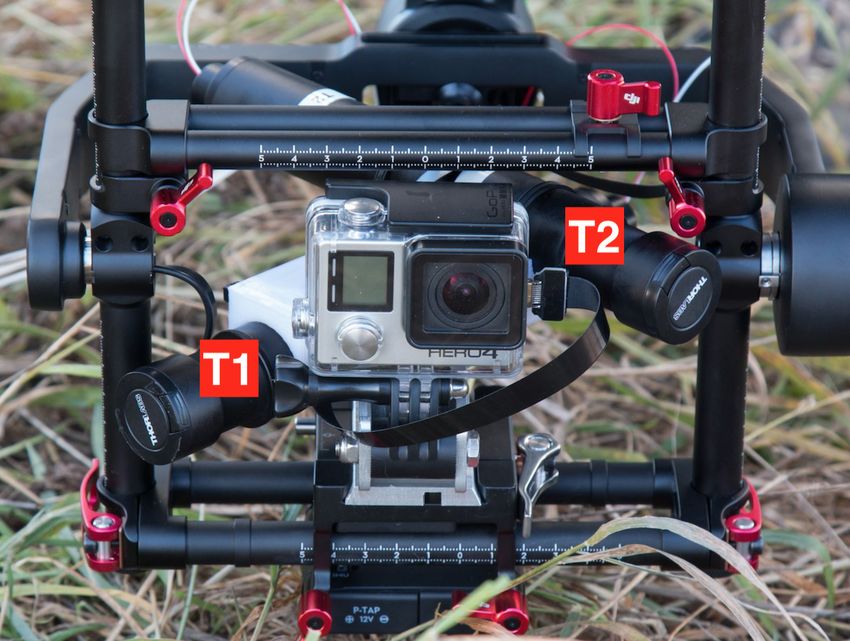
Figure 2. Gimbal payload: GoPro camera and two telescopes high-
lighted with T1 and T2 (here mounted with 90◦ opening angle
between them) with protective lens caps. Picture taken from the
photo gallery (https://work.courtney.dk/#collection/364601, last ac- Figure 3. Aerial photo of test center at Risø campus. Blue point:
cess: 28 January 2020). position of 10 m mast, denoted as “TW”. Red point: position of 70 m
mast, denoted as “VT”. Aerial data: © Google Maps, DigitalGlobe.
Instead of developing the drone and gimbal customization
prevailing wind direction is from the fjord, i.e., from the via SDK for the POC stage, we decided initially to assess
west. The test center includes test pads for small wind tur- to what level the drone and gimbal straight “out of the box”
bines (currently three in use) and several well-instrumented are already a turn-key solution for wind lidar applications.
met masts. For the purpose of the drone campaigns we used Hence, we simply attached the telescopes to the gimbal sys-
measurements from two masts denoted as “VT” mast and tem and manually positioned the drone and oriented the gim-
“TW” mast in Fig. 3. These two masts are 70 m and 10 m bal system using the onboard drone camera and GoPro cam-
tall, respectively. The masts are International Electrotech- era mounted on the gimbal tray. The drone was manually
nical Commission compliant and include calibrated in situ steered to hover within a couple of meters from the mast-
wind sensors (cup or sonic anemometers and wind vanes). In mounted sonic anemometers. These sensors were used as the
this study we used measurements from a number of Metek reference for the comparisons in the text that will follow.
USA-1 3-D sonic anemometers. The flight conditions during The onboard drone camera was used to coarsely position the
the campaigns were good with relatively low wind speed and drone at the right height. Since the telescopes were attached
no precipitation (Table 4). The biggest challenge involved to the gimbal, the GoPro camera was used to make sure that
during the measurements was handling of the 100 m fibers the telescopes are at the same height of the reference instru-
to avoid snagging, which could lead to bend loss and distur- ment and that they are pointing the laser beams in the desired
bance of the drone’s flight. Careful stacking of the uncoiled directions. Once this was performed, the drone and gimbal
fibers on the ground was essential, with separation of the T were simply locked into position. Afterwards, the drone A3
(transmitting) and R (receiving) fibers to minimize risk of Pro flight controller automatically maintained the drone po-
tangling. sition and orientation and leveling of the telescopes carried
Atmos. Meas. Tech., 13, 521–536, 2020 www.atmos-meas-tech.net/13/521/2020/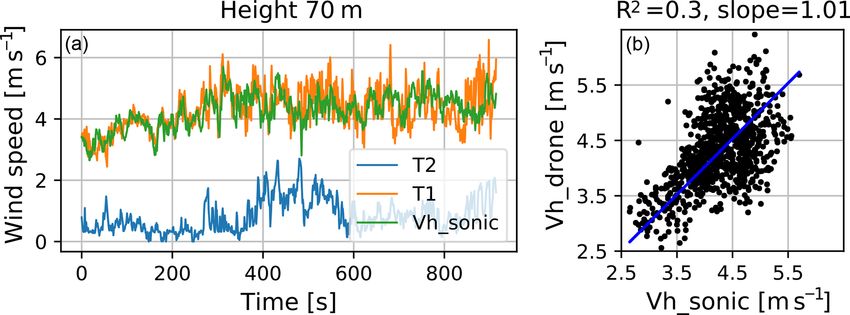
N. Vasiljević et al.: Wind sensing with drone-mounted wind lidars: proof of concept 527
3.1 Experiment 1: hovering next to the 10 m mast
To gain the experience in operating the newly built drone–
lidar system we started with measurements close to the TW
mast. The 10 m mast was chosen for the first measurements
as it does not have guy wires that could impose a risk while
flying the drone close to it. We performed three flights next to
this mast. During these flights the drone was positioned 6 m
upstream of the sonic anemometer (8 m from the mast). We
used the telescope configuration with the opening angle of
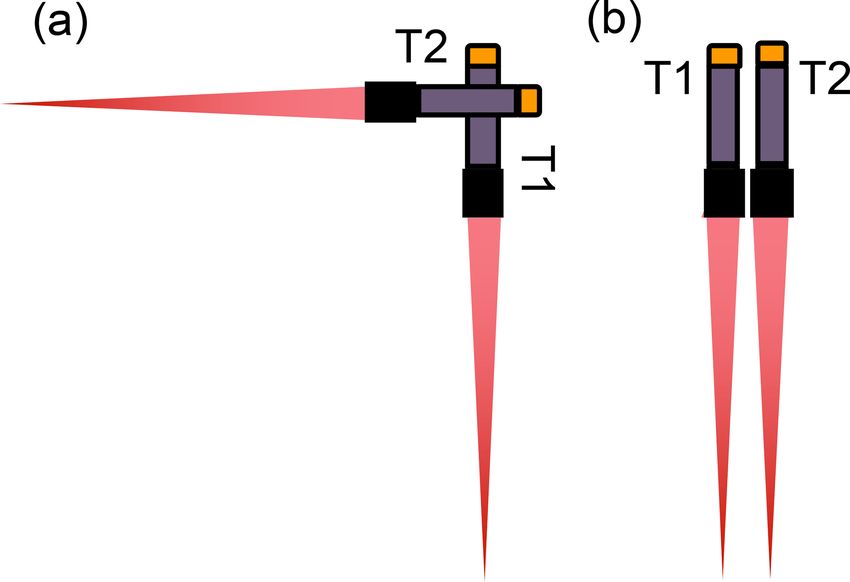
Figure 4. Telescope setup: (a) opening angle of 90◦ and (b) opening 90◦ (see Fig. 4a). This telescope configuration allowed us to
angle of 0◦ . make straightforward measurements of the horizontal wind
speed amplitude:
q
by the gimbal. The focus of the telescopes and the opening 2
Vh = VLOS_T1 2
+ VLOS_T2 , (1)
angles between them were adjusted on the ground prior to
the flights. where Vh is the horizontal wind speed, while VLOS_T1 and
We used two configurations of the opening angles (see VLOS_T2 are LOS speeds measured by the telescopes 1 and 2,
Fig. 4). In the first configuration the opening angle between respectively.
telescopes was set to 90◦ , thus the outgoing beams were per- Undoubtedly the previous relation is true assuming that
pendicular to each other (Fig. 4a). In the second configura-
– the gimbal is capable of retaining the leveling of the
tion the opening angle was set to 0◦ , thus the outgoing laser
telescope mount,
beams were parallel to each other (Fig. 4b).
We performed four experiments (see Table 4 with details). – the flow is homogeneous at the two measured lidar focus
We started first with an experiment in which we hovered points.
the drone in the vicinity of a sonic anemometer mounted
8 m a.g.l. on the 10 m mast (TW mast in Fig. 3). With this The focus distance, as previously mentioned, was set to
experiment we secured the first batch of data for the inter- 5 m, which considering the size of the optics results in the
comparison between the mast- and drone-based wind sen- effective probe lengths of about 15 cm for each telescope.
sors to prove the concept’s feasibility. In the second experi- During the flights, we were able to point the bisector of the
ment we hovered the drone at several heights next to the 70 m LOS to face the sonic anemometer by pointing the beams
mast (VT mast in Fig. 3) attempting to test the feasibility of downwind using the gimbal system (see Fig. 5). The wind
doing multi-height measurements (i.e., vertical profiling of direction during the flight was about 240◦ . As mentioned ear-
the wind) as well as acquiring the wind speed measurements lier, with this configuration we measured the horizontal wind
beyond 60 m a.g.l. In the third experiment, we explored the speed next to the sonic anemometer mounted 8 m a.g.l. on the
possibility of using measurements from a single telescope to 10 m mast, denoted as TW in Fig. 3.
reconstruct the horizontal wind speed, as the single telescope The LOS velocity from the two telescopes and the hori-
concept is a lower-cost option for drone-based wind lidar de- zontal wind speed measured with the sonic anemometer were
velopment. In these three campaigns we used the telescope collected with a 50 Hz data rate with two separate data ac-
configuration shown in Fig. 4a, in which the focus distance quisition systems. To simplify the data sync and a follow-up
of the two telescopes was fixed to 5 m in order to be sure that intercomparison, both the sonic anemometer and drone data
we were measuring the flow undisturbed by the drone pres- were averaged to give a 1 Hz sampling rate.
ence. In the last experiment the goal was to detect the drone Figure 6 shows a time series and the correlation plot
disturbance zone, i.e., the area of the air disturbed by the from the flight done next to the sonic anemometer mounted
drone downwash (telescope configuration shown in Fig. 4b). 8 m a.g.l. on the TW mast. Considering that we do not ac-
Although it would be logical to start with the downwash ex- count for the movement of the drone, which will influence the
periment, we first needed to get assurance that the proposed measured wind speed, the comparison is reasonably good.
drone-based lidar concept really works. Therefore, we started
3.2 Experiment 2: hovering above several different
directly by acquiring wind speed measurements close to a
heights next to the V52 mast
mast-mounted sensor with what later proved to be a rather
conservative configuration of the focus distance. Once we got confident in operating the drone–lidar sys-
tem, we started measurements next to the VT mast, which
has sonic anemometers installed at five heights (18, 31, 44,
57 and 70 m a.g.l.; see Fig. 7a). With a total of 21 anchor
points distributed at seven heights, the mast is fixed to the
www.atmos-meas-tech.net/13/521/2020/ Atmos. Meas. Tech., 13, 521–536, 2020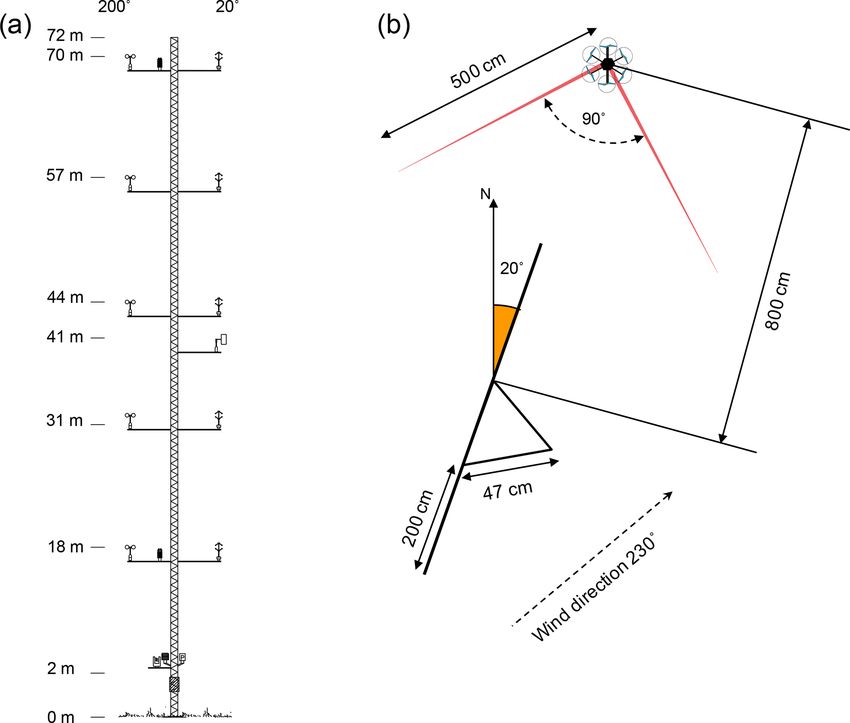
528                                      N. Vasiljević et al.: Wind sensing with drone-mounted wind lidars: proof of concept

Table 4. Overview of the experiments.

              Experiment     Flight                   Flight     Telescope     Telescope      Wind          Wind     Weather
              no.             time                    height    orientation        setup      speed     direction    condition
                             (min)                      (m)             (◦ )          (◦ )   (m s−1 )         (◦ )
              1                22                           8          240             90      3–7      190–260      Clear sky
              2                15       18, 31, 44, 57 and 70           20             90      2–6      206–259      Clear sky
              3                16                          70           20             90      3–6      206–251      Clear sky
              4               6×5                           5        30–70              0      1–4        30–70      Cloudy

Figure 5. Configuration of the first experiment: (a) 10 m mast sketch with position of instruments (2 m: humidity and temperature probe;
6 m: wind vane and humidity and temperature probe; 8 m: sonic anemometer; 10 m: cup anemometer) and (b) 10 m mast cross section at 8 m
height with the orientation of the drone with respect to the boom at which the sonic anemometer is installed.

ground using corresponding number of guy wires, which re-                measurement campaign the wind was coming from the south-
quired extra caution during the drone flight. We have retained           west (mean wind direction of 230◦ ). Accordingly, we posi-
the opening angle of 90◦ between the two telescopes (see                 tioned the drone northeast of the mast and oriented the gim-
Figs. 4a and 7b). Using the gimbal system we were able to                bal system such that the laser beams were steered towards the
point the bisector of the LOS to face the sonic anemome-                 southeast. In this way, the bisector of the two beams pointed
ters; however, this time the beams were pointed into the wind            approximately into the wind, thus the drone itself did not in-
(see Fig. 7b). The wind direction during the flight was around           terfere with the flow where the beams were focused.
230◦ .                                                                      During the measurement campaign, we manually started
   The aim of this experiment performed next to the VT mast              and stopped the measurements at each height. More accu-
was to hover and measure wind speed next to each of the                  rately, we waited for the drone and gimbal operators to po-
sonic anemometers (Fig. 8) to vertically profile the wind. The           sition the drone, and once this was completed we initiated
total measurement time was approximately 15 min.                         measurements. Similarly, after a certain period of time we
   We started with the lowest sonic anemometer (18 m a.g.l.),            have stopped the measurements and indicated to the oper-
measured for a period of time and then repositioned the drone            ators to move the drone to the consecutive heights. At each
to the next height. This process continued until we reached              height we produced two datasets that corresponded to the two
the highest-mounted sonic anemometer. Once the measure-                  telescopes.
ments next to the highest-mounted sonic anemometer were                     Since we did not record the orientation of the gimbal sys-
completed, we initiated the landing of the drone. During the             tem for each height, we were only able to determine the

Atmos. Meas. Tech., 13, 521–536, 2020                                                         www.atmos-meas-tech.net/13/521/2020/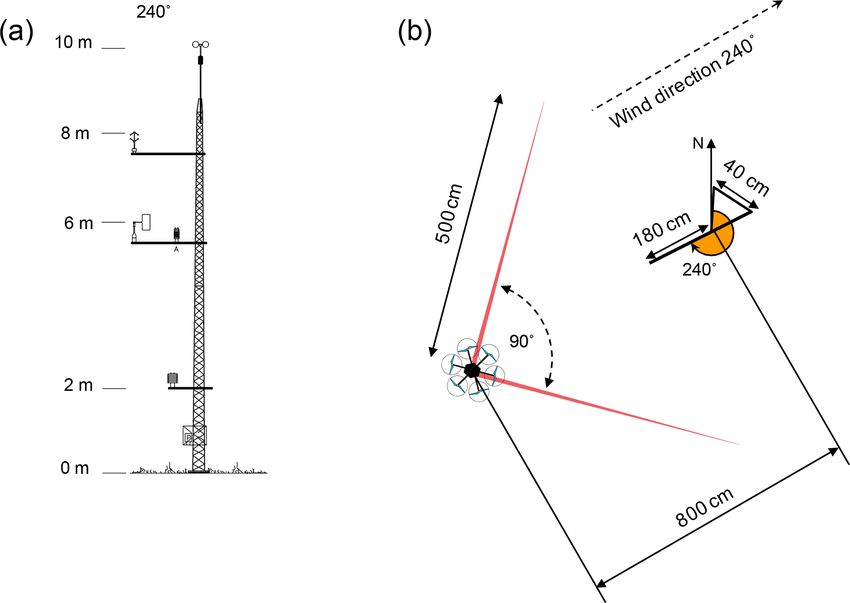
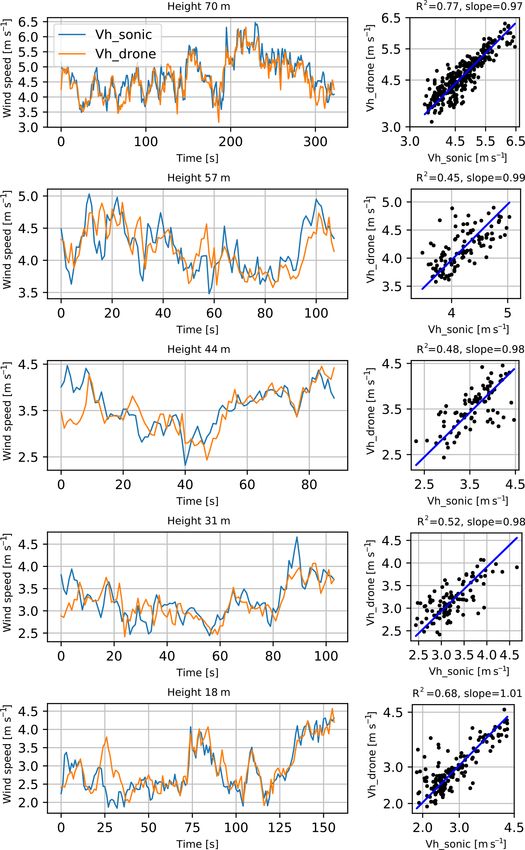
N. Vasiljević et al.: Wind sensing with drone-mounted wind lidars: proof of concept                                                529

Figure 6. Measurements acquired next to the TW mast: (a) 1 Hz time series of the horizontal wind speed acquired with the drone–lidar
system and the sonic anemometer and (b) a linear regression plot.

Figure 7. Second experiment configuration: (a) 70 m mast sketch with positions of instruments (2 m: humidity and temperature probe; 18 m:
cup and sonic anemometers and humidity and temperature probe; 31 m: cup and sonic anemometers; 41 m: wind vane; 44 m: cup and sonic
anemometers; 57 m: cup and sonic anemometers; 70 m: cup and sonic anemometers and humidity and temperature probe) and (b) 70 m mast
cross section at 70 m height with the orientation of the drone with respect to the boom at which the sonic anemometer is installed.

amplitude of the horizontal wind speed. Like in the case of            drone and mast is at the top height, mainly due to the fact that
the experiment next to the TW mast, we averaged the 50 Hz              we spent the most time hovering next to the corresponding
data from the lidar and sonic anemometers to 1 Hz. Figure 9            sonic anemometer. Nevertheless, the comparisons are quite
shows 1 Hz data recorded by both sonic anemometers and the             good for all heights considering that they are using high-
drone–lidar system. Table 5 summarizes the results of all the          frequency (1 Hz) data.
comparisons.
   From the aforementioned figure and table we can see that
the best comparison between the measurements from the

www.atmos-meas-tech.net/13/521/2020/                                                        Atmos. Meas. Tech., 13, 521–536, 2020
530                                       N. Vasiljević et al.: Wind sensing with drone-mounted wind lidars: proof of concept

                                                                     shows the time series from analysis of approximately 15 min
                                                                     of data. When the speed measured by T2 is low, as in the
                                                                     first 250 s, then agreement between the sonic anemometer
                                                                     and T1 is very good. Although the corresponding correla-
                                                                     tion plot from the full data period (Fig. 10) exhibits signifi-
                                                                     cant scatter (a consequence of high data rate combined with
                                                                     drone–sonic-anemometer separation of several meters), the
                                                                     mean wind speeds are in close agreement. The mean differ-
                                                                     ence between the wind speed measured by sonic anemometer
                                                                     and T1 is 0.05 m s−1 with the standard deviation of difference
                                                                     of 0.03 m s−1 .
                                                                        From this brief experiment we conclude that this approach
                                                                     could be a viable option as long as a reliable simple method
                                                                     of beam alignment along the wind direction can be devised.

                                                                     3.4   Experiment 4: drone disturbance zone

                                                                     It is obvious that the downwash from the drone itself can
                                                                     severely influence the lidar measurements, and it is therefore
                                                                     important to establish how far out from the drone center this
                                                                     disturbance zone stretches. This was done by mounting the
                                                                     telescopes on top of each other in the gimbal with the laser
                                                                     beams pointing parallel and horizontally out from the drone
                                                                     (see Fig. 4a). We first started by conservatively guessing that,
Figure 8. Drone parked next to the sonic anemometer at 70 m a.g.l.   given the size of the drone, at a distance of 5 m from its cen-
                                                                     ter the drone downwash should not have any impact on the
Table 5. Summary of comparison of multi-height measurements.         free stream. Accordingly, in the first measurement series both
                                                                     telescopes were focused at 5 m and data were acquired for
  Parameters                    18 m   31 m   44 m   57 m   70 m     about 5 min. The drone was then landed and the focus dis-
                                                                     tance of telescope 2 decreased by approximately 1 m while
  Number of samples              157    104     89    108    323
  R2                            0.68   0.52   0.48   0.45   0.77     that of telescope 1 was kept constant and a new measure-
  Mean difference (m s−1 )      0.08   0.05   0.06   0.02   0.11     ment series was acquired. We repeated this process six times
  Standard deviation (m s−1 )   0.04   0.06   0.08   0.06   0.03     until a focus distance 0.7 m for telescope 2 was reached.
  Slope                         1.01   0.98   0.98   0.99   0.97        Figure 11a shows an example of a 1 Hz time series ob-
                                                                     tained with telescope 2 focused at 2 m. With the measure-
                                                                     ment volumes being separated by only 3 m, the measure-
3.3   Experiment 3: single-beam trial                                ments from telescopes 1 and 2 are expected to resemble each
                                                                     other to a high degree and that is indeed seen to be case.
The simplest and cheapest configuration for drone-mounted            Any differences between the two are mostly due to the mea-
lidar is a single horizontally aligned staring telescope. This       surement volumes not being exactly co-located. In contrast,
is capable of accurately measuring wind speed if the beam            Fig. 11b shows a time series where telescope 2 is focused at
is aligned closely to point along the wind direction. The re-        0.7 m with the measurement volume clearly within the drone
sulting speed error is an underestimate given by the cosine          disturbance zone. Although some general features are seen to
of the misalignment angle. As such, the error is relatively          be the same in the two plots, telescope 2 measures a signifi-
small even for quite a significant misalignment (e.g., 1.5 %         cantly lower average wind speed, which is due to the block-
for 10◦ ). This concept was tested in an experiment where the        age effect of the drone, while the downwash is perpendicular
drone was hovered in close proximity to the sonic anemome-           to the beam and hence has no Doppler contribution.
ter at 70 m, and only one of the telescope outputs (T1) was             Figure 12 shows the relative difference in average wind
used for speed comparisons (Fig. 10). It is likely that sim-         speed measured by the two telescopes as a function of tele-
ple methods can be devised to align the beam with the wind           scope 2 focus distance. With the measurement volumes co-
based on drone flight characteristics, but in this experiment        located at 5 m focus distance there is, as expected, virtually
it was achieved by minimizing the Doppler offset observed            no difference between the measured average wind speeds and
by the other, orthogonal, telescope (T2). If this speed from         the difference stays low (less than 1 %) down to 3 m. At a 2 m
T2 can be maintained close to zero, then this ensures the            focus distance there is a positive difference of about 3.9 %
beam from T1 is closely aligned with the wind. Figure 10             and at 1 m the difference becomes negative, with a value

Atmos. Meas. Tech., 13, 521–536, 2020                                                   www.atmos-meas-tech.net/13/521/2020/
N. Vasiljević et al.: Wind sensing with drone-mounted wind lidars: proof of concept 531
Figure 9. Comparison of multi-height measurements from the second experiment. Left column: time series. Right column: linear regression
plot forced through zero.
of −2.3 %, indicating that the downwash starts to disturb From these measurements we conclude that the distur-
the measurement. Finally, there is a very large difference of bance zone stretches between 1 and 2 m from the drone cen-
−35 % when telescope 2 is focused at 0.7 m and thus mea- ter, and when focusing the laser beams at 3 m or more the
suring directly inside the disturbance zone. influence of the drone itself on the measurements is negligi-
ble.
www.atmos-meas-tech.net/13/521/2020/ Atmos. Meas. Tech., 13, 521–536, 2020532 N. Vasiljević et al.: Wind sensing with drone-mounted wind lidars: proof of concept
Figure 10. Single-beam comparison at 70 m: (a) time series, (b) linear regression forced through (R 2 = 0.3; slope = 1.01; µ(Vhsonic −T1) =
0.05 m s−1 ; σ(Vhsonic −T1) = 0.03 m s−1 ).
Figure 12. Relative difference in average wind speed measured by
the two telescopes as function of telescope 2 focus distance.
4 Discussion
In our first two experiments (Sect. 3.1 and 3.2), we en-
deavored to demonstrate that the wind speed measured by
the drone system is consistent with that measured by the
nearby sonic anemometers. This has been successfully ac-
complished, as can be seen from both the time series and
scatter plots in Figs. 6 and 9. A summary of the results from
the VT mast is shown in Table 5. Here we can see that the
slope of the constrained linear regression is close to unity in
all cases.
While these tests serve to demonstrate the plausibility of
the measured drone system wind speed, a more detailed and
convincing testing methodology needs to be developed that
Figure 11. Example of 1 s averaged wind speed measurements ac- can be used to assign a traceable uncertainty to the drone sys-
quired by the two telescopes: (a) telescope 1 focused at 5 m and tem. Two inherent problems are (i) the short flight time avail-
telescope 2 focused at 2 m and (b) telescope 1 focused at 5 m and able and (ii) the necessary separation between the drone sys-
telescope 2 focused at 0.7 m.
tem and the reference mast instrumentation. The latter gives
rise to an inherent degradation in correlation at the timescales
available, as dictated by the former (only a few minutes of
flight time).
Atmos. Meas. Tech., 13, 521–536, 2020 www.atmos-meas-tech.net/13/521/2020/N. Vasiljević et al.: Wind sensing with drone-mounted wind lidars: proof of concept 533 There are some obvious improvements to be made here be- to measure wind profiles with the described system, a drone fore the method becomes applicable to practical real-world could vary position only in height (fixed northing and east- measurements – primarily maximizing the flight time at any ing position of the drone) and thus repetitively flying up and given height. Battery-powered drones cannot provide contin- down between the range of heights. In the third experiment uous measurements over long periods of many hours. There- (Sect. 3.3) our aim was to investigate to what extent a single- fore, ultimately we envisage using a tethered system receiv- beam system would suffice to measure wind speed. Critical ing flight power umbilically. Using such a system it should be readers might with some justification claim that using two possible to measure over hours as opposed to minutes. Alter- beams to show that only one is necessary is unconvincing. natively, a charging deck with several drones could be em- Potentially, we could substitute the second beam (here we ployed allowing near-uninterrupted measurements (a short used it to ensure that the cross-wind component was close to interruption would probably occur during the drone substi- zero) with data from the drone (e.g., tilt or differential mo- tute). However, even if we provide continuous power to the tor power) to substantiate that we are pointing into the wind. drones, the life expectancy of their motors is still currently Alternatively, using the gimbal or drone itself a single beam in the realm of a couple of days of continuous operation, af- could be steered in multiple directions performing a full or ter which the motors may need to be serviced or replaced. partial plan position indicator (PPI) scans and wind speed Nevertheless, the recent pace of development of drone tech- reconstructed from the acquired LOS measurements using nology suggests that we can expect significant improvements known techniques, such as those from Chen et al. (2017). in their capabilities; this work aims to anticipate these devel- Nevertheless, various methods for the substitution of the sec- opments as they could make drone-mounted lidar a practical ond beam should be tested to find the most suitable one. and cheaper option in the future. In the last experiment (Sect. 3.4) we tested our assump- A second approach to assessing the uncertainty could be tion that our initial focus distance of 5 m was outside the using what has become known as the “white box” approach drone downwash influence zone. This was confirmed, and in the field of nacelle-mounted lidar calibration (Borraccino it appears overconservative for the setup and conditions ex- et al., 2016). For these systems it has been found that it is es- perienced here. We can conclude that at 3 m no downwash sentially impossible to compare the reconstructed wind speed influence is discernible. In future testing we will use this as directly with a reference measurement in a calibration envi- the focus distance. However, a dedicated study and model- ronment. Instead the component uncertainties in the line-of- ing of the downwash under different conditions is necessary sight speed and in the lidar geometry are propagated through since we expect it to have different behavior with respect to the reconstruction algorithm to give an estimate of the uncer- the payload and wind conditions. tainty on the reconstructed speed. Drone-based lidar speed Reducing the focus distance will reduce the separation be- measurement lends itself to this technique for two reasons. tween the probing beams. This is an advantage as the drone Firstly, the very short range lidars can be calibrated directly system will be able to measure in inhomogeneous flow with using a flywheel approach (Pedersen and Courtney, 2018), reduced error. In homogeneous flow, with a smaller probe which has a much lower reference uncertainty than the al- separation, the drone system will be able to acquire meaning- ternative of using calibrated cup anemometers. Secondly, the ful time series of wind speed to a higher frequency since the geometry and reconstruction is simple and easy to solve an- flow will remain correlated at the two probe positions over alytically. shorter averaging times. It will thus be possible to perform Despite this being a first attempt, we have already accom- scalar averaging without significant error (this is a known plished a close agreement to the nearby mast instrumenta- problem with nacelle lidar systems). tion. This has been achieved using only the basic drone po- Probe separation could be further reduced by using a sition stabilization and without correcting in any way for the smaller opening angle than the 90◦ used in this initial trial drone motion. A clear next step (outlined below) is to imple- or by separating the telescopes as much as possible and con- ment the differential GPS positioning (already installed but verging their beams. Conceivably, the opening angle could inoperable in the initial tests) and to log these data. Not only be reduced to as little as 30◦ (common for nacelle-mounted will the drone be even more stable but we will be able to lidars), especially if the drone tilt or differential rotor power correct for the induced speed from the perturbations. can be used to keep the beams more or less aligned with the Our first experiments had the primary aim of demonstrat- wind direction and away from the (for homodyne CW lidars) ing the recording of plausible wind speed from the drone troublesome trans-zero zone where radial speed polarity is- system. Should the system later fail, our proof of concept sues (inability to distinguish between positive and negative) would have been already been achieved. Actually, the system could also arise. Further work is clearly needed to find the proved to be quite robust (we had no catastrophic failures) optimal probe geometry for measuring horizontal as well as and we were able to proceed with secondary but important vertical wind speeds. tests. In the second experiment we hovered the drone at mul- Conventionally, it has been troublesome for lidar to carry tiple heights (mimicking mast measurements), which corre- out point measurements of turbulence analogous to what a sponded to the locations of sonic anemometers. In principle, cup or sonic anemometer would measure: probe volumes ex- www.atmos-meas-tech.net/13/521/2020/ Atmos. Meas. Tech., 13, 521–536, 2020
534                                     N. Vasiljević et al.: Wind sensing with drone-mounted wind lidars: proof of concept

tend typically over many meters, and the beams that inter-          mounted sonic anemometers. A good agreement between the
rogate the flow at different angles in a scanning system are        sonic anemometers and the drone-based wind lidar measure-
often separated in space by many tens of meters. By con-            ments has been found even without any motion compensa-
trast, due to their short measurement range and very small          tion.
measuring volume, drone lidar systems will be able to make             It is expected that motion compensation will result in fur-
turbulence measurements in and above the frequency range            ther improvement of wind speed accuracy and will also al-
relevant in wind energy applications. The lidars we have used       low detailed investigation of turbulence. The rapid data rates
have a probe length (FWHM) of 5 cm when focused at 3 m.             and very small measurement volume suggest the exciting
This would be sufficient for useful wind speed spectral con-        prospect of tracking fast atmospheric fluctuations and de-
tent up to at least 10 Hz at 10 m s−1 wind speeds. The lidar        riving turbulence spectra for comparison with cup and sonic
data acquisition is able to acquire signals at 50 Hz. The gen-      anemometers.
eration of accurate turbulence data from drone-mounted lidar           Overall, excellent results have been obtained in these first
requires knowledge of the telescope’s orientation and speed         attempts with a fairly simple measurement system, which
to allow motion compensation, and this will form the topic          provide a necessary vindication for the proposed measure-
for a future study.                                                 ment technique and secure the foundation for the technique’s
   An obvious application is in situ wake turbulence measure-       future developments.
ments where the drone can be positioned at a desired position
relative to the turbine or can perform a pre-described tra-
jectory. Multiple drones (swarms) could also be envisioned          Data availability. Datasets are pushed for publication on DTU
to provide simultaneous measurements at a number of posi-           Data platform (https://data.dtu.dk/, last access: 28 January 2020;
tions.                                                              Vasiljevic et al., 2020).
   Similarly, a drone swarm upstream of a wind turbine could
provide inflow data of unprecedented detail and quality for
power performance or load validations, including horizontal         Author contributions. Conceptualization was performed by NV,
                                                                    MH and MC. The methodology was created by NV, MH, MC, ATP,
and vertical shear, wind veer, turbulence intensities, and the
                                                                    MP, JH and KB. The software was created by MP and MH. The
spatial structure (coherence) of (at least) the longitudinal tur-
                                                                    validation was performed by NV, MH, MC and ATP. Formal anal-
bulence component.                                                  ysis was performed by NV, MH, ATP and GRT. Investigation was
   Many other drone–lidar applications can be envisioned            undertaken by NV, MH, ATP and GRT. Resources were provided
once some degree of drone autonomy can be developed (abil-          by NV, MH, MP and JH. Data curation was performed by NV, GRT,
ity to fly pre-programmed sequences, land and recharge au-          MP, JH and KB. Writing was performed by NV, MH, ATP, GRT,
tomatically, fly again, etc.). Indeed, the power and load veri-     and MC for the original draft; NV, MH, and MC during the review
fication duties described above only become realistic outside       and editing process; and NV, ATP, GRT, and MH during the visu-
a research environment once these abilities are developed.          alization phase. The writing was supervised by NV and MH. The
Truly operational applications could include flow monitor-          project administration was performed by NV and MC. Funding was
ing inside and upstream of wind farms. This could both en-          acquired by NV and MC.
hance wind farm control and provide a degree of forecasting.
Outside wind energy there are obvious applications in wind
                                                                    Competing interests. Michael Harris and Mark Pitter are employed
engineering (e.g., flow, turbulence and coherence measure-
                                                                    at ZX Lidars, which is a company focused on the commercialization
ments at remote sites), as well as exciting possibilities in a
                                                                    of the wind lidar technology. The other authors declare that they
variety of recreational areas (sailing, golfing, skiing).           have no conflict of interest.

5     Conclusion                                                    Acknowledgements. The authors would like to express special grat-
                                                                    itude to Michael Rassmussen (DTU), Claus Pedersen (DTU), and
A novel wind measurement technique based on the fusion              Per Hansen (DTU) for their help in setting up and operating the
of a standard drone with a prototype wind lidar has been            measurement system and Poul Hummelshøj (DTU) for backing up
reported. We have described the proof-of-concept (POC)              the internal project.
drone–lidar system, which was developed to demonstrate the
feasibility of this new measurement technique. Besides the
POC system description, we have reported on the first exper-        Review statement. This paper was edited by Robert Sica and re-
iments performed with this system. In these experiments the         viewed by three anonymous referees.
drone-disturbance zone (caused largely by the influence of
drone downwash) was characterized, and an intercomparison
was performed between wind measurements acquired by the
drone-based wind lidar and those acquired by adjacent mast-

Atmos. Meas. Tech., 13, 521–536, 2020                                                   www.atmos-meas-tech.net/13/521/2020/
N. Vasiljević et al.: Wind sensing with drone-mounted wind lidars: proof of concept 535
References Fernando, H. J. S., Pardyjak, E. R., Di Sabatino, S., Chow, F. K.,
De Wekker, S. F. J., Hoch, S. W., Hacker, J., Pace, J. C., Pratt,
Barbieri, L., Kral, S. T., Bailey, S. C. C., Frazier, A. E., Jacob, J. D., T., Pu, Z., Steenburgh, W. J., Whiteman, C. D., Wang, Y., Zajic,
Reuder, J., Brus, D., Chilson, P. B., Crick, C., Detweiler, C., D., Balsley, B., Dimitrova, R., Emmitt, G. D., Higgins, C. W.,
Doddi, A., Elston, J., Foroutan, H., González-Rocha, J., Greene, Hunt, J. C. R., Knievel, J. C., Lawrence, D., Liu, Y., Nadeau,
B. R., Guzman, M. I., Houston, A. L., Islam, A., Kemppinen, D. F., Kit, E., Blomquist, B. W., Conry, P., Coppersmith, R. S.,
O., Lawrence, D., Pillar-Little, E. A., Ross, S. D., Sama, M. P., Creegan, E., Felton, M., Grachev, A., Gunawardena, N., Hang,
Schmale, D. G., Schuyler, T. J., Shankar, A., Smith, S. W., C., Hocut, C. M., Huynh, G., Jeglum, M. E., Jensen, D., Ku-
Waugh, S., Dixon, C., Borenstein, S., and de Boer, G.: Intercom- landaivelu, V., Lehner, M., Leo, L. S., Liberzon, D., Massey,
parison of Small Unmanned Aircraft System (sUAS) Measure- J. D., McEnerney, K., Pal, S., Price, T., Sghiatti, M., Silver, Z.,
ments for Atmospheric Science during the LAPSE-RATE Cam- Thompson, M., Zhang, H., and Zsedrovits, T.: The MATER-
paign, Sensors, 19, 2179, https://doi.org/10.3390/s19092179, HORN: Unraveling the Intricacies of Mountain Weather, B. Am.
2019. Meteorol. Soc., 96, 1945–1967, https://doi.org/10.1175/BAMS-
Bingöl, F.: Complex Terrain and Wind Lidars, PhD thesis, avail- D-13-00131.1, 2015.
able at: http://orbit.dtu.dk/files/5245709/ris-phd-52.pdf (last ac- Fernando, H. J. S., Mann, J., Palma, J. M. L. M., Lundquist, J. K.,
cess: 28 January 2020), 2010. Barthelmie, R. J., Belo-Pereira, M., Brown, W. O. J., Chow, F. K.,
Borraccino, A., Courtney, M., and Wagner, R.: Generic Methodol- Gerz, T., Hocut, C. M., Klein, P. M., Leo, L. S., Matos, J. C., On-
ogy for Field Calibration of Nacelle-Based Wind Lidars, Remote cley, S. P., Pryor, S. C., Bariteau, L., Bell, T. M., Bodini, N.,
Sensing, 8, 907, https://doi.org/10.3390/rs8110907, 2016. Carney, M. B., Courtney, M. S., Creegan, E. D., Dimitrova, R.,
Brosy, C., Krampf, K., Zeeman, M., Wolf, B., Junkermann, Gomes, S., Hagen, M., Hyde, J. O., Kigle, S., Krishnamurthy,
W., Schäfer, K., Emeis, S., and Kunstmann, H.: Simulta- R., Lopes, J. C., Mazzaro, L., Neher, J. M. T., Menke, R., Mur-
neous multicopter-based air sampling and sensing of me- phy, P., Oswald, L., Otarola-Bustos, S., Pattantyus, A. K., Ro-
teorological variables, Atmos. Meas. Tech., 10, 2773–2784, drigues, C. V., Schady, A., Sirin, N., Spuler, S., Svensson, E.,
https://doi.org/10.5194/amt-10-2773-2017, 2017. Tomaszewski, J., Turner, D. D., van Veen, L., Vasiljević, N., Vas-
Browning, K. A. and Wexler, R.: The Determination of Kine- sallo, D., Voss, S., Wildmann, N., and Wang, Y.: The Perdigão:
matic Properties of a Wind Field Using Doppler Radar, Peering into Microscale Details of Mountain Winds, B. Am.
J. Appl. Meteorol., 7, 105–113, https://doi.org/10.1175/1520- Meteorol. Soc., 100, 799–819, https://doi.org/10.1175/BAMS-
0450(1968)0072.0.CO;2, 1968. D-17-0227.1, 2019.
Chen, F., Liang, X., and Ma, H.: Application of IVAP-Based Ob- Fleming, P., Annoni, J., Scholbrock, A., Quon, E., Dana, S.,
servation Operator in Radar Radial Velocity Assimilation: The Schreck, S., Raach, S., Haizmann, F., and Schlipf, D.: Full-Scale
Case of Typhoon Fitow, Mon. Weather Rev., 145, 4187–4203, Field Test of Wake Steering, J. Phys. Conf. Ser., 854, 012013,
https://doi.org/10.1175/MWR-D-17-0002.1, 2017. https://doi.org/10.1088/1742-6596/854/1/012013, 2017.
Cheynet, E., Jakobsen, J. B., Snæbjörnsson, J., Mann, J., Court- Giebel, G., Schmidt Paulsen, U., Bange, J., La Cour-Harbo, A.,
ney, M., Lea, G., and Svardal, B.: Measurements of Surface- Reuder, J., Mayer, S., van der Kroonenberg, A., and Mølgaard,
Layer Turbulence in a Wide Norwegian Fjord Using Synchro- J.: Autonomous Aerial Sensors for Wind Power Meteorology – A
nized Long-Range Doppler Wind Lidars, Remote Sens., 9, 977, Pre-Project, Danmarks Tekniske Universitet, Risø Nationallabo-
https://doi.org/10.3390/rs9100977, 2017. ratoriet for Bæredygtig Energi, 2012.
Collier, C. G., Davies, F., Bozier, K. E., Holt, A. R., Middleton, Gottschall, J., Gribben, B., Stein, D., and Würth, I.: Float-
D. R., Pearson, G. N., Siemen, S., Willetts, D. V., Upton, G. ing lidar as an advanced offshore wind speed measurement
J. G., and Young, R. I.: Dual-Doppler Lidar Measurements for technique: current technology status and gap analysis in re-
Improving Dispersion Models, B. Am. Meteorol. Soc., 86, 825– gard to full maturity, WIREs Energy Environ., 6, e250,
838, https://doi.org/10.1175/BAMS-86-6-825, 2005. https://doi.org/10.1002/wene.250, 2017.
Courtney, M., Wagner, R., and Lindelöw, P.: Testing and Grubišić, V., Doyle, J. D., Kuettner, J., Mobbs, S., Smith, R. B.,
comparison of lidars for profile and turbulence measure- Whiteman, C. D., Dirks, R., Czyzyk, S., Cohn, S. A., Vosper,
ments in wind energy, IOP C. Ser. Earth Env., 1, 012021, S., Weissmann, M., Haimov, S., De Wekker, S. F. J., Pan,
https://doi.org/10.1088/1755-1315/1/1/012021, 2008. L. L., and Chow, F. K.: THE TERRAIN-INDUCED ROTOR
DJI: Ronin-MX User Manual, available at: https://dl.djicdn.com/ EXPERIMENTA: Field Campaign Overview Including Obser-
downloads/ronin-mx/en/Ronin-MX_User_Manual_V1.2_en_ vational Highlights, B. Am. Meteorol. Soc., 89, 1513–1534,
20160711.pdf (last access: 28 January 2020), 2016. https://doi.org/10.1175/2008BAMS2487.1, 2008.
DJI: D-RTK User manual, available at: https://dl.djicdn.com/ Harris, M., Bryce, D. J., Coffey, A. S., Smith, D. A., Birke-
downloads/D-RTK/20171026/D_RTK_User_manual_v1.0_en. meyer, J., and Knopf, U.: Advance measurement of gusts by
pdf (last access: 28 January 2020), 2017. laser anemometry, J. Wind Eng. Ind. Aerod., 95, 1637–1647,
DJI: Matrice 600 Pro User manual, available at: https: https://doi.org/10.1016/j.jweia.2007.02.029, 2007.
//dl.djicdn.com/downloads/m600pro/20180417/Matrice_600_ Held, D. P. and Mann, J.: Comparison of methods to de-
Pro_User_Manual_v1.0_EN.pdf (last access: 28 January 2020), rive radial wind speed from a continuous-wave coherent li-
2018. dar Doppler spectrum, Atmos. Meas. Tech., 11, 6339–6350,
EWEA: Wind energy scenarios for 2030, available at: https://doi.org/10.5194/amt-11-6339-2018, 2018.
https://www.ewea.org/fileadmin/files/library/publications/ Herges, T. G., Maniaci, D. C., Naughton, B. T., Mikkelsen, T.,
reports/EWEA-Wind-energy-scenarios-2030.pdf (last access: and Sjöholm, M.: High resolution wind turbine wake measure-
28 January 2020), 2015.
www.atmos-meas-tech.net/13/521/2020/ Atmos. Meas. Tech., 13, 521–536, 2020You can also read