Chlorine partitioning near the polar vortex edge observed with ground-based FTIR and satellites at Syowa Station, Antarctica, in 2007 and 2011
←
→
Page content transcription
If your browser does not render page correctly, please read the page content below
Atmos. Chem. Phys., 20, 1043–1074, 2020
https://doi.org/10.5194/acp-20-1043-2020
© Author(s) 2020. This work is distributed under
the Creative Commons Attribution 4.0 License.

Chlorine partitioning near the polar vortex edge observed with
ground-based FTIR and satellites at Syowa Station, Antarctica,
in 2007 and 2011
Hideaki Nakajima1,2 , Isao Murata2 , Yoshihiro Nagahama1 , Hideharu Akiyoshi1 , Kosuke Saeki2,a , Takeshi Kinase3 ,
Masanori Takeda2 , Yoshihiro Tomikawa4,5 , Eric Dupuy1 , and Nicholas B. Jones6
1 National Institute for Environmental Studies, Tsukuba, Ibaraki, 305-8506, Japan
2 Graduate  School of Environmental Studies, Tohoku University, Sendai, Miyagi, 980-8572, Japan
3 Meteorological Research Institute, Tsukuba, Ibaraki, 305-0052, Japan
4 National Institute of Polar Research, Tachikawa, Tokyo, 190-8518, Japan
5 The Graduate University for Advanced Studies, Tachikawa, Tokyo, 190-8518, Japan
6 University of Wollongong, Wollongong, New South Wales, 2522, Australia
a now at: Weathernews Inc., Chiba, 261-0023, Japan

Correspondence: Hideaki Nakajima (nakajima@nies.go.jp)

Received: 10 May 2019 – Discussion started: 12 June 2019
Revised: 3 December 2019 – Accepted: 10 December 2019 – Published: 27 January 2020

Abstract. We retrieved lower stratospheric vertical pro-         tail. From CCM model results, the rapid conversion of chlo-
files of O3 , HNO3 , and HCl from solar spectra taken            rine reservoir species (HCl and ClONO2 ) into Cl2 , gradual
with a ground-based Fourier transform infrared spectrome-        conversion of Cl2 into Cl2 O2 , increase in HOCl in the winter
ter (FTIR) installed at Syowa Station, Antarctica (69.0◦ S,      period, increase in ClO when sunlight became available, and
39.6◦ E), from March to December 2007 and September to           conversion of ClO into HCl were successfully reproduced.
November 2011. This was the first continuous measurement         The HCl decrease in the winter polar vortex core continued
of chlorine species throughout the ozone hole period from        to occur due to both transport of ClONO2 from the subpo-
the ground in Antarctica. We analyzed temporal variation of      lar region to higher latitudes, providing a flux of ClONO2
these species combined with ClO, HCl, and HNO3 data taken        from more sunlit latitudes into the polar vortex, and the het-
with the Aura MLS (Microwave Limb Sounder) satellite sen-        erogeneous reaction of HCl with HOCl. The temporal varia-
sor and ClONO2 data taken with the Envisat MIPAS (the            tion of chlorine species over Syowa Station was affected by
Michelson Interferometer for Passive Atmospheric Sound-          both heterogeneous chemistries related to polar stratospheric
ing) satellite sensor at 18 and 22 km over Syowa Station. An     cloud (PSC) occurrence inside the polar vortex and transport
HCl and ClONO2 decrease occurred from the end of May             of a NOx -rich air mass from the polar vortex boundary re-
at both 18 and 22 km, and eventually, in early winter, both      gion, which can produce additional ClONO2 by reaction of
HCl and ClONO2 were almost depleted. When the sun re-            ClO with NO2 . The deactivation pathways from active chlo-
turned to Antarctica in spring, enhancement of ClO and grad-     rine into reservoir species (HCl and/or ClONO2 ) were con-
ual O3 destruction were observed. During the ClO-enhanced        firmed to be highly dependent on the availability of ambient
period, a negative correlation between ClO and ClONO2 was        O3 . At 18 km, where most ozone was depleted, most ClO
observed in the time series of the data at Syowa Station. This   was converted to HCl. At 22 km where some O3 was avail-
negative correlation was associated with the relative distance   able, an additional increase in ClONO2 from the prewinter
between Syowa Station and the edge of the polar vortex. We       value occurred, similar to the Arctic.
used MIROC3.2 chemistry–climate model (CCM) results to
investigate the behavior of whole chlorine and related species
inside the polar vortex and the boundary region in more de-

Published by Copernicus Publications on behalf of the European Geosciences Union.
1044                                                  H. Nakajima et al.: Chlorine partitioning near the polar vortex edge

1   Introduction                                                 There are three types of PSCs, i.e., nitric acid trihydrate
                                                                 (NAT), supercooled ternary solution (STS), and ice PSCs.
Discussion of the detection of the recovery of the Antarctic     When the stratospheric temperatures get warmer than NAT
ozone hole as the result of chlorofluorocarbon (CFC) regu-       saturation temperature (about 195 K at 50 hPa) and no PSCs
lations has been attracting attention. The occurrence of the     are present, deactivation of chlorine starts to occur. Refor-
Antarctic ozone hole is predicted to continue at least until     mation of ClONO2 and HCl mainly occurs through reactions
the middle of this century. The world’s leading chemistry–       (Santee et al., 2008; Grooß et al., 2011; Müller et al., 2018)
climate models (CCMs) indicate that the multimodel mean
time series of the springtime Antarctic total column ozone       ClO + NO2 + M → ClONO2 + M,                             (R12)
will return to 1980 levels shortly after the midcentury (about   Cl + CH4 → HCl + CH3 ,                                  (R13)
2060) (WMO, 2019). In fact, the recovery time predicted
by CCMs has a large uncertainty, and the observed ozone          CH2 O + Cl → HCl + CHO.                                 (R14)
hole magnitude also shows year-to-year variability (e.g., see
                                                                 The reformation of ClONO2 by Reaction (R12) from ac-
Figs. 4–6 in WMO, 2019). Although Solomon et al. (2016)
                                                                 tive chlorine is much faster than that of HCl by Reac-
and de Laat et al. (2017) reported signs of healing in the
                                                                 tions (R13) and (R14) if enough NOx are available (Mel-
Antarctic ozone layer only in September, there is no statisti-
                                                                 lqvist et al., 2002; Dufour et al., 2006). But the formation
cally conclusive report on the Antarctic ozone hole recovery
                                                                 rates of ClONO2 and HCl are also related to ozone concen-
(Yang et al., 2008; Kuttippurath et al., 2010; WMO, 2019).
                                                                 tration. Grooß et al. (1997) showed that HCl increases more
   To understand ozone depletion processes in polar regions,
                                                                 rapidly in the Antarctic polar vortex than in the Arctic polar
understanding the behavior and partitioning of active chlo-
                                                                 vortex due to lower ozone concentrations in the Antarctic po-
rines (ClOx = Cl+Cl2 +ClO+ClOO+Cl2 O2 ) and chlorine
                                                                 lar vortex. Low ozone reduces the rate of Reaction (R8) and
reservoirs (HCl and ClONO2 ) is crucial. Recently, the im-
                                                                 then the Cl/ClO ratio increases. Low ozone also reduces the
portance of ClONO2 was reviewed by von Clarmann and Jo-
                                                                 rate of the following reaction:
hansson (2018). The chlorine reservoir is converted to active
chlorine that destroys ozone on polar stratospheric clouds
                                                                 NO + O3 → NO2 + O2 .                                    (R15)
(PSCs) and/or cold binary sulfate through heterogeneous re-
actions:                                                         This makes the NO/NO2 ratio high and increases the Cl/ClO
                                                                 ratio using the following reaction:
ClONO2 (g) + HCl(s, l) → Cl2 (g) + HNO3 ,                (R1)
ClONO2 (g) + H2 O(s, l) → HOCl(g) + HNO3 ,               (R2)    ClO + NO → Cl + NO2 .                                   (R16)
where g, s, and l represent the gas, solid, and liquid phases,   A high Cl/ClO ratio leads to rapid HCl formation by Re-
respectively (Solomon et al., 1986; Solomon, 1999; Drdla         actions (R13) and (R14) and reduces the formation ratio of
and Müller, 2012; Wegner et al., 2012; Nakajima et al.,          ClONO2 by Reaction (R12) (Grooß et al., 2011; Müller et
2016).                                                           al., 2018).
   Heterogeneous reactions,                                         The processes of deactivation of active chlorine are differ-
N2 O5 (g) + HCl(s, l) → ClNO2 (g) + HNO3 ,               (R3)    ent between typical conditions in the Antarctic and those in
                                                                 the Arctic. In the Antarctic, the temperature cools below the
HOCl(g) + HCl(s, l) → Cl2 (g) + H2 O,                    (R4)    NAT PSC existence threshold (about 195 K at 50 hPa) in the
                                                                 whole area of the polar vortex in all years, and almost com-
are responsible for additional chlorine activation. When so-
lar illumination is available, Cl2 , HOCl, and ClNO2 are pho-    plete denitrification and chlorine activation occur (WMO,
tolyzed to produce chlorine atoms by reactions                   2007), followed by severe ozone depletion in spring. In the
                                                                 chlorine reservoir recovery phase, HCl is mainly formed by
Cl2 + hν → Cl + Cl,                                      (R5)    Reaction (R13) due to the lack of ozone (typically less than
                                                                 0.5 ppmv) using the mechanism described in the previous
HOCl + hν → Cl + OH,                                     (R6)
                                                                 paragraph (Grooß et al., 2011).
ClNO2 + hν → Cl + NO2 .                                  (R7)       On the other hand, in the Arctic, typically less PSC forma-
                                                                 tion occurs in the polar vortex due to generally higher strato-
The yielded chlorine atoms then start to destroy ozone cat-
                                                                 spheric temperatures (∼ 10–15 K on average) compared with
alytically through reactions (Canty et al., 2016):
                                                                 that of Antarctica. Then only partial denitrification and chlo-
Cl + O3 → ClO + O2 ,                                     (R8)    rine activation occur in some years (Manney et al., 2011;
                                                                 WMO, 2014). In this case, some ozone and NO2 are avail-
ClO + ClO + M → Cl2 O2 + M,                              (R9)
                                                                 able in the chlorine reservoir recovery phase. Therefore, the
Cl2 O2 + hν → Cl + ClOO,                                (R10)    ClONO2 amount becomes higher than that of HCl after PSCs
ClOO + M → Cl + O2 + M.                                 (R11)    have disappeared due to the rapid Reaction (R12) (Michelsen

Atmos. Chem. Phys., 20, 1043–1074, 2020                                           www.atmos-chem-phys.net/20/1043/2020/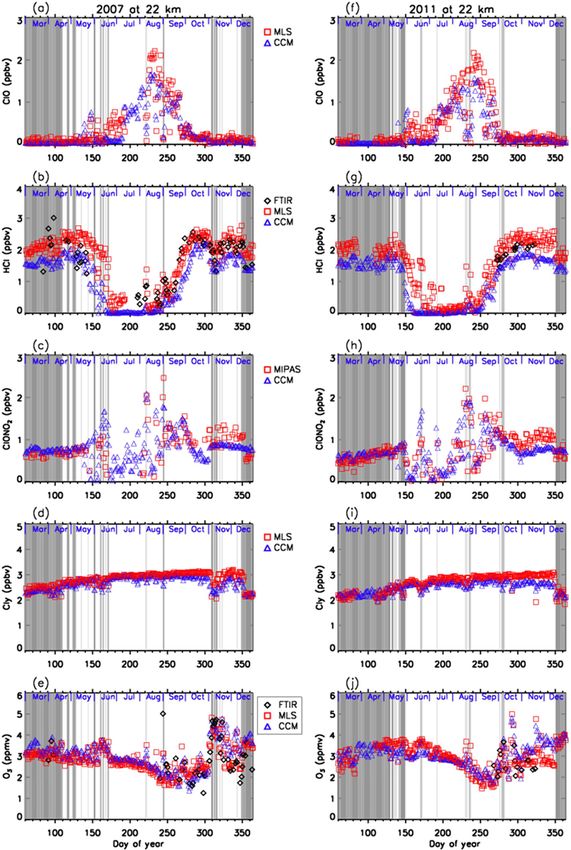
H. Nakajima et al.: Chlorine partitioning near the polar vortex edge                                                       1045

et al., 1999; Santee et al., 2003), which results in an addi-     etc. have been performed. The ozone hole was first de-
tional increase in ClONO2 than the prewinter value at the         tected by Dobson spectrometer and ozonesonde measure-
time of chlorine deactivation in spring (von Clarmann et al.,     ments from Syowa Station in 1982 (Chubachi, 1984) and
1993; Müller et al., 1994; Oelhaf et al., 1994). In this way,     by Dobson spectrometer measurements at Halley Bay (Far-
the partitioning of the chlorine reservoir in springtime is re-   man et al., 1985). We installed a Bruker IFS-120M high-
lated to temperature, PSC amounts, ozone, and NO2 concen-         resolution Fourier transform infrared spectrometer (FTIR) in
trations (Santee et al., 2008; Solomon et al., 2015).             the observation hut at Syowa Station in March 2007. This
   In the polar regions, the ozone and related atmospheric        was the third high-resolution FTIR site in Antarctica in op-
trace gas species have been intensively monitored by several      eration after the USA’s South Pole Station (90.0◦ S) (Gold-
measurement techniques since the discovery of the ozone           man et al., 1983, 1987; Murcray et al., 1987), the USA’s Mc-
hole. These measurements consist of direct observations by        Murdo Station, and New Zealand’s Arrival Heights facility
high-altitude aircraft (e.g., Anderson et al., 1989; Ko et al.,   at the Scott Base station (77.8◦ S, 166.7◦ E) (Farmer et al.,
1989; Tuck et al., 1995; Jaeglé et al., 1997; Bonne et al.,       1987; Murcray et al., 1989; Kreher et al., 1996; Wood et al.,
2000), remote-sensing observations by satellites (e.g., Müller    2002, 2004). The IFS-120M FTIR has a wavenumber resolu-
et al., 1996; Michelsen et al., 1999; Höpfner et al., 2004; Du-   tion of 0.0035 cm−1 , with two liquid-nitrogen-cooled detec-
four et al., 2006; Hayashida et al., 2007), remote-sensing ob-    tors (with InSb and HgCdTe covering the frequency ranges
servations of OClO using a UV–visible spectrometer from           2000–5000 and 700–1300 cm−1 , respectively) with six op-
the ground (Solomon et al., 1987; Kreher et al., 1996), and       tical filters, and is fed by an external solar tracking system.
remote-sensing observations of ClO by a microwave spec-           One measurement takes about 10 min. At least six spectra
trometer from the ground (de Zafra et al., 1989). Within these    were taken per day, covering each filter region. Since Syowa
observations, ground-based measurements have the charac-          Station is located at a relatively low latitude (69.0◦ S) com-
teristic of high temporal resolution. In addition, the Fourier    pared with McMurdo or Scott Base stations (77.8◦ S), there
transform infrared spectrometer (FTIR) has the capability of      is an advantage of the short (about 1 month) polar night pe-
measuring several trace gas species at the same time or in a      riod, when we cannot measure atmospheric species using the
short time interval (Rinsland et al., 1988). In this paper, we    sun as a light source. Since FTIR measurements at Syowa
show the results of ground-based FTIR observations of O3          Station are possible from early spring (late July), FTIR can
and other trace gas species at Syowa Station in the Antarc-       measure chemical species during ozone hole development.
tic in 2007 and 2011, combined with satellite measurements        On the other hand, FTIR observations become possible only
of trace gas species from the Microwave Limb Sounder on           after September at McMurdo and Scott Base stations. An-
board the Aura satellite (Aura MLS) and Michelson Interfer-       other advantage of Syowa Station is that it is sometimes lo-
ometer for Passive Atmospheric Sounding on board the Eu-          cated at the vortex boundary as well as inside and outside
ropean Environmental Satellite (Envisat MIPAS), to show the       of the polar vortex, and this enables us to measure chemical
temporal variation and partitioning of active chlorine (ClOx )    species at different regions of polar chemistry related to the
and chlorine reservoirs (HCl, ClONO2 ) from fall to spring        ozone hole. From March to December 2007, we made in to-
during the ozone hole formation and dissipation period. In        tal 78 d of FTIR measurements on sunny days. Another 19 d
order to monitor the appearance of PSCs over Syowa Station,       of FTIR measurements were performed from September to
we used the Cloud-Aerosol Lidar with Orthogonal Polariza-         November 2011. After a few more measurements were per-
tion (CALIOP) data on board the Cloud-Aerosol Lidar and           formed in 2016, the FTIR was brought back to Japan in 2017.
Infrared Pathfinder Satellite Observations (CALIPSO) satel-       In Appendix A, Table A1 shows the days when FTIR mea-
lite. The methods of FTIR and satellite measurements are de-      surements were made at Syowa Station with the information
scribed in Sect. 2. The validation of FTIR measurements is        inside, in the boundary region, and outside of the polar vor-
described in Sect. 3. The results of FTIR and satellite mea-      tex defined by the method described in Appendix B using
surements and discussion on the behavior of active and in-        ERA-Interim reanalysis data. Strahan et al. (2014) showed
ert chlorine species using the MIROC3.2 chemistry–climate         the year-to-year variation of Cly observed in the lower strato-
model are described in Sect. 4.                                   sphere of the Antarctic polar vortex. The Cly observed in
                                                                  2007 (2.88 ppbv) was about +4.3 % more and that observed
                                                                  in 2011 (2.53 ppbv) was about −5.2 % less than the pro-
2     Measurements                                                jected Cly from Newman et al. (2007) (2.76 ppbv for 2007
                                                                  and 2.67 ppbv for 2011).
2.1    FTIR measurements                                             The retrieval of the FTIR spectra was done with the SFIT2
                                                                  version 3.92 program (Rinsland et al., 1998; Hase et al.,
The Japanese Antarctic Syowa Station (69.0◦ S, 39.6◦ E)           2004). SFIT2 retrieves a vertical profile of trace gases us-
was established in January 1957. Since then, several sci-         ing an optimal estimation formulation of Rodgers (2000),
entific observations related to meteorology, upper atmo-          implemented with a semiempirical method which was origi-
spheric physics, glaciology, biology, geology, seismology,        nally developed for microwave measurements (Parrish et al.,

www.atmos-chem-phys.net/20/1043/2020/                                              Atmos. Chem. Phys., 20, 1043–1074, 2020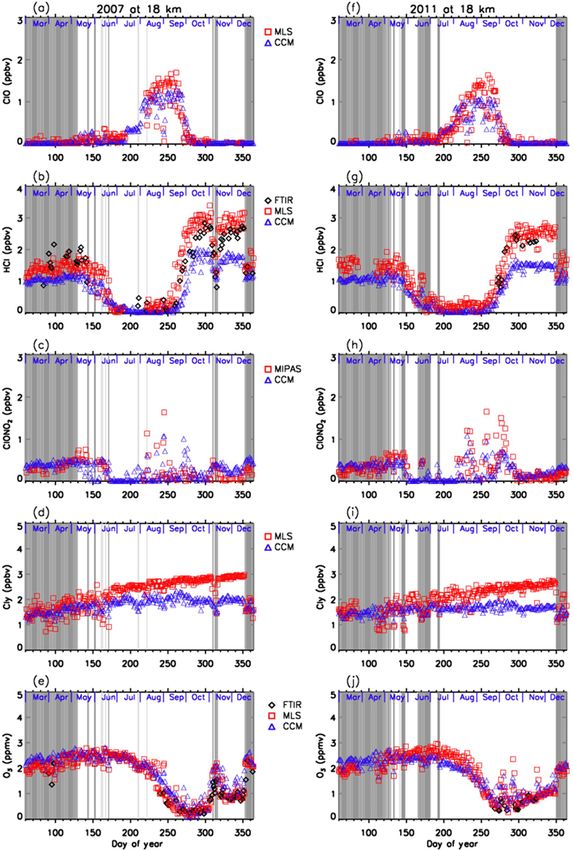
1046                                                   H. Nakajima et al.: Chlorine partitioning near the polar vortex edge

1992; Connor et al., 1995). The SFIT2 forward model fully         42, 47, 52, 60, and 68 km. In this mode, about 73 limb scans
describes the FTIR instrument response, with absorption co-       are recorded per orbit. The measurements of each orbit cover
efficients calculated using the algorithm of Norton and Rins-     nearly the complete latitude range from about 87◦ S to 89◦ N.
land (1991). The atmosphere is constructed with 47 layers         MIPAS was placed on board Envisat, which was launched
from the ground to 100 km, using the FSCATM (Gallery et           on 1 March 2002, and was put into a polar sun-synchronous
al., 1983) program for atmospheric ray tracing to account         orbit at an altitude of about 800 km with an inclination of
for refractive bending. The retrieval parameters for each gas,    98.55◦ (von Clarmann et al., 2003). On its descending node,
typical vertical resolution, and typical mean degrees of free-    the satellite crosses the Equator at 10:00 local time. En-
dom for signal (DOFS) are shown in Table 1. Temperature           visat performs 14.3 orbits per day, which results in a good
and pressure profiles between 0 and 30 km are taken by the        global coverage. The ClONO2 profiles which we used in this
rawinsonde observations flown from Syowa Station on the           study were taken from Envisat MIPAS IMK/IAA version
same day by the Japanese Meteorological Agency (JMA),             V5R_CLONO2_220 and V5R_CLONO2_222 (Höpfner et
while values between 30 and 100 km are taken from the             al., 2007). The daily MIPAS data within 320 km distance be-
COSPAR International Reference Atmosphere 1986 (CIRA-             tween the measurement location and Syowa Station were se-
86) standard atmosphere profile (Rees et al., 1990).              lected.
   We retrieved vertical profiles of O3 , HCl, and HNO3              The CALIPSO satellite was launched on 28 April 2006.
from the solar spectra. We used monthly averaged ozoneson-        On the CALIPSO satellite, the CALIOP instrument was on
des profiles (0–30 km) and Improved Limb Atmospheric              board to monitor aerosols, clouds, and PSCs (Pitts et al.,
Spectrometer-II (ILAS-II) (Nakajima, 2006; Nakajima et al.,       2007). CALIOP is a two-wavelength, polarization-sensitive
2006; Sugita et al., 2006) profiles (30–100 km) for the a pri-    lidar that provides high-vertical-resolution profiles of the
ori profiles of O3 , monthly averaged profiles from ILAS-         backscatter coefficient at 532 and 1064 nm, as well as two
II for HNO3 , and monthly averaged profiles from HALOE            orthogonal (parallel and perpendicular) polarization compo-
(Anderson et al., 2000) for HCl. We focus on the altitude         nents at 532 nm (Winker et al., 2007). In order to monitor the
range of 15–25 km in this study. Typical averaging kernels        appearance of PSCs over Syowa Station, the daily CALIOP
of the SFIT2 retrievals for O3 , HNO3 , and HCl are shown in      PSC data (Pitts et al., 2007, 2009, 2011) within 320 km dis-
Fig. 1a, b, and c, respectively.                                  tance between the measurement location and Syowa Station
                                                                  were selected.
2.2    Satellite measurements

The Earth Observing System (EOS) MLS on board the                 3   Validation of retrieved profiles from FTIR spectra
Aura satellite was launched on 15 July 2004 to monitor                with other measurements
several atmospheric chemical species in the upper tropo-
                                                                  We validated retrieved FTIR profiles of O3 with ozonesondes
sphere to mesosphere (Waters et al., 2006). The Aura or-
                                                                  and Aura MLS version 3.3 data (Livesey et al., 2013) for
bit is sun-synchronous at 705 km altitude, with an inclina-
                                                                  2007 measurements. Also, retrieved FTIR profiles of HNO3
tion of 98◦ , 13:45 ascending (north-going) Equator-crossing
                                                                  and HCl were validated with Aura MLS data. We identified
time, and 98.8 min period. Vertical profiles are measured ev-
                                                                  the nearest Aura MLS data from the distance between the
ery ∼ 165 km along the suborbital track, the horizontal res-
                                                                  Aura MLS tangent point and the point for the direction of the
olution is ∼ 200–600 km along track and ∼ 3–10 km across
                                                                  sun from Syowa Station at the time of the FTIR measurement
track, and the vertical resolution is ∼ 3–4 km in the lower-
                                                                  at 20 km. The spatial and temporal collocation criteria used
to-middle stratosphere (Froidevaux et al., 2006). ClO, HCl,
                                                                  were within a 300 km radius and ±6 h. The ozonesonde and
and HNO3 profiles used in this study were taken from Aura
                                                                  Aura MLS profiles were interpolated onto a 1 km grid and
MLS version 4.2 data (Livesey et al., 2006, 2018; Santee et
                                                                  then smoothed using a 5 km wide running mean.
al., 2011; Ziemke et al., 2011). Only daytime ClO data were
                                                                     Figure 2a–b show absolute and relative differences of
used for the analysis. The daily MLS data within 320 km dis-
                                                                  O3 profiles retrieved from FTIR measurements and those
tance between the measurement location and Syowa Station
                                                                  from model 1Z ECC-type ozonesonde measurements, re-
were selected.
                                                                  spectively, calculated from 14 coincident measurements from
   MIPAS is a Fourier transform spectrometer sounding the
                                                                  5 September to 17 December 2007. The typical precision and
thermal emission of the earth’s atmosphere between 685 and
                                                                  accuracy of the ECC-type ozone sondes are considered to be
2410 cm−1 (14.6–4.15 µm) in limb geometry (Fischer and
                                                                  ± (3–5) % and ± (4–5) %, respectively (Komhyr, 1986). We
Oelhaf, 1996; Fischer et al., 2008). The maximum optical
                                                                  define the relative percentage difference D as
path difference of MIPAS is 20 cm. The field of view of the
instrument at the tangent points is about 3 km in the verti-      D(%) = 100 · (FTIR − sonde)/((FTIR + sonde)/2).            (1)
cal and 30 km in the horizontal. In the standard observation
mode in one limb scan, 17 tangent points are observed with        The mean absolute difference between 15 and 25 km was
nominal altitudes 6, 9, 12, 15, 18, 21, 24, 27, 30, 33, 36, 39,   within −0.02 to 0.40 ppmv. The mean relative difference D

Atmos. Chem. Phys., 20, 1043–1074, 2020                                            www.atmos-chem-phys.net/20/1043/2020/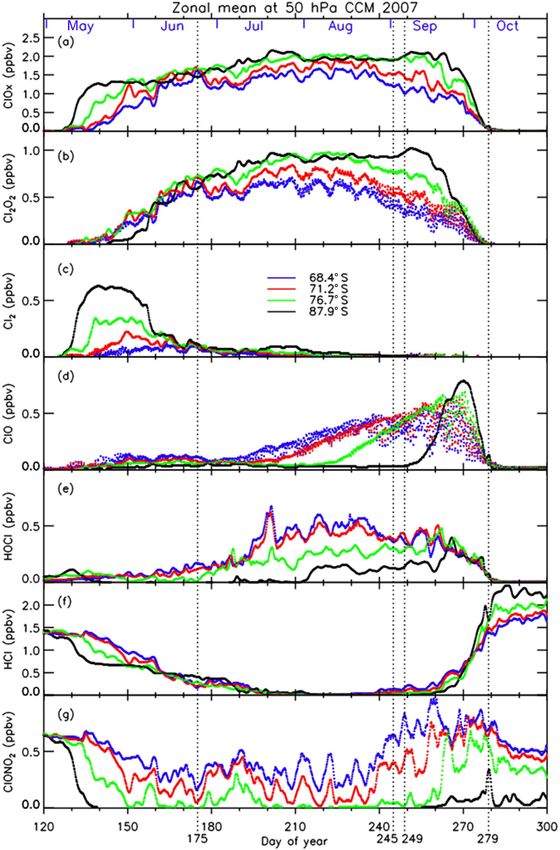
H. Nakajima et al.: Chlorine partitioning near the polar vortex edge                                                               1047

Table 1. Retrieval parameters of SFIT2.

 Species                                      O3                               HNO3                        HCl
 Spectroscopy                                 HITRAN 2008                      HITRAN 2008                 HITRAN 2008
 Pressure and temperature profile             Daily sonde (0–30 km)            Daily sonde (0–30 km)       Daily sonde (0–30 km)
                                              CIRA 86 (30–100 km)              CIRA 86 (30–100 km)         CIRA 86 (30–100 km)
 A priori profiles                            Monthly averaged by              Monthly averaged by         Monthly averaged by
                                              ozonesonde (0–30 km) and         ILAS-II                     HALOE
                                              ILAS-II (30–100 km)
 Microwindows (cm−1 )                         1002.578–1003.500                867.000–869.591             2727.730–2727.830
                                              1003.900–1004.400                872.800–874.000             2775.700–2775.800
                                              1004.578–1005.000                                            2925.800–2926.000
 Retrieved interfering species                O3 (668), O3 (686), CO2 ,        H2 O, OCS, NH3 , CO2 ,      CO2 , H2 O, O3 , NO2
                                              H2 O                             C 2 H6
 Typical retrieval error (%) for 15–25 km     5                                15                          17
 Typical vertical resolution (km)             5                                7                           6
 Mean degrees of freedom for signal           4.9                              2.8                         2.3
 (DOFS)

Figure 1. Averaging kernel functions of the SFIT2 retrievals for (a) O3 , (b) HNO3 , and (c) HCl.

between 15 and 25 km was within −10.4 % to +24.4 %. The                   tween 16 and 18 km are due to the small ozone amount in
average of the mean relative differences D of O3 for the alti-            the ozone hole. Our validation results are quite comparable
tude of interest in this study (18–22 km) was +6.1 %, with                with the validation study at Izaña Observatory by Schneider
the minimum of −10.4 % and the maximum of +19.2 %.                        et al. (2008).
FTIR data agree with validation data within root mean                        Figure 2c–d show absolute and relative differences of O3
squares of typical errors in FTIR and validation data at the              profiles retrieved from FTIR measurements and those from
altitude of interest. Note that relatively large D values be-             Aura MLS measurements, respectively, calculated from 33

www.atmos-chem-phys.net/20/1043/2020/                                                      Atmos. Chem. Phys., 20, 1043–1074, 2020
1048                                                        H. Nakajima et al.: Chlorine partitioning near the polar vortex edge

                                                                        Atmospheric Chemistry Experiment Fourier transform spec-
                                                                        trometer (ACE-FTS) at 70◦ S, which may explain the nega-
                                                                        tive bias of FTIR data compared with MLS data.
                                                                           Figure 2e–f show absolute and relative differences of
                                                                        HNO3 profiles retrieved by FTIR measurements and those
                                                                        from Aura MLS measurements, respectively, calculated from
                                                                        47 coincident measurements from 25 March to 20 Decem-
                                                                        ber 2007. The mean absolute difference between 15 and
                                                                        25 km was within −0.56 to +0.57 ppbv. The mean relative
                                                                        difference D between 15 and 25 km was within −25.5 %
                                                                        to +21.9 %. The average of the mean relative differences
                                                                        D for HNO3 for the altitude of interest in this study (18–
                                                                        22 km) was +13.2 %, with the minimum of +0.2 % and the
                                                                        maximum of +21.9 %. This positive bias of FTIR data is
                                                                        still within the error bars of FTIR measurements. Livesey et
                                                                        al. (2013) showed that Aura MLS version 3.3 data have no
                                                                        bias within errors (∼ 0.6–0.7 ppbv (10 %–12 %) at a pressure
                                                                        level of 100–3.2 hPa) compared with other measurements.
                                                                        Livesey et al. (2018) showed no major differences between
                                                                        Aura MLS version 3.3 and version 4.2 data for HNO3 .
                                                                           Figure 2g–h show absolute and relative differences of
                                                                        HCl profiles retrieved by FTIR measurements and those
                                                                        from Aura MLS measurements, respectively, calculated from
                                                                        50 coincident measurements from 25 March to 20 Decem-
                                                                        ber 2007. The mean absolute difference between 15 and
                                                                        25 km was within −0.20 to −0.09 ppbv. The mean relative
                                                                        difference D between 15 and 25 km was within −34.1 % to
                                                                        −3.0 %. The average of mean relative differences D for HCl
                                                                        for the altitude of interest in this study (18–22 km) is −9.7 %,
                                                                        with a minimum of −14.6 % and a maximum of −3.0 %.
                                                                        This negative bias of FTIR data is still within the error bars of
Figure 2. (a) Mean absolute and (b) mean relative differences of        FTIR measurements. Moreover, Livesey et al. (2013) showed
O3 profiles retrieved from FTIR measurements minus those from           that Aura MLS version 3.3 values are systematically greater
ozonesonde measurements. (c) Mean absolute and (d) mean rela-           than HALOE values by 10 %–15 % with a precision of 0.2–
tive differences of O3 profiles retrieved from FTIR measurements        0.6 ppbv (10 %–30 %) in the stratosphere, which may partly
minus those from Aura MLS measurements. (e) Mean absolute               explain the negative bias of FTIR data compared with MLS
and (f) mean relative differences of HNO3 profiles retrieved from       data. Livesey et al. (2018) showed no major differences be-
FTIR measurements minus those from Aura MLS measurements.               tween Aura MLS version 3.3 and version 4.2 data for HCl.
(g) Mean absolute and (h) mean relative differences of HCl profiles        Table 2 summarizes the validation results of FTIR profiles
retrieved from FTIR measurements minus those from Aura MLS
                                                                        compared with ozonesonde or Aura MLS measurements, as
measurements. Horizontal bars indicate the root mean squares of
                                                                        well as possible Aura MLS biases from the literature.
differences at each altitude. Horizontal dashed bars indicate the al-
titude range of our focus (15–25 km).

                                                                        4     Results and discussion

coincident measurements from 1 April to 20 December 2007.               4.1    Time series of observed species
The accuracy of MLS O3 data is reported to be 5 %–8 % be-
tween 0.5 and 46 hPa (Livesey et al., 2013). The mean ab-               Figure 3a shows daytime hours at Syowa Station. Polar night
solute difference between 15 and 25 km was within −0.13                 ends at Syowa Station on 14 July (day 195). Figure 3b–e
to +0.16 ppmv. The mean relative difference D between 15                show the time series of temperatures at 18 and 22 km over
and 25 km was within −16.2 % to +5.2 %. The average of                  Syowa Station using ERA-Interim data (Dee et al., 2011)
the mean relative differences D for O3 for the altitude of in-          for 2007 and 2011. Approximate saturation temperatures for
terest in this study (18–22 km) was −5.5 %, with the mini-              NAT (TNAT ) and ice (TICE ) calculated by assuming 6 ppbv
mum of −16.3 % and the maximum of +4.5%. Froidevaux                     HNO3 and 4.5 ppmv H2 O are also shown in the figures. The
et al. (2008) showed that Aura MLS is +8 % higher than the              dates when PSCs were observed at Syowa Station identi-

Atmos. Chem. Phys., 20, 1043–1074, 2020                                                  www.atmos-chem-phys.net/20/1043/2020/
H. Nakajima et al.: Chlorine partitioning near the polar vortex edge                                                                                      1049

Table 2. Summary of validation results of FTIR profiles compared with ozonesonde and Aura MLS measurements, as well as possible Aura
MLS biases from the literature.

                      Number of                Root mean            D (%) at       Min/max (%)           Range of mean      Literature values
                    coincidences                squares of         18–22 km         at 18–22 km      absolute differences
                                           official errors∗                                                for 15–25 km
                                         (%) at 18–22 km                                                     (O3 : ppmv;
                                                                                                        HNO3 and HCl:
                                                                                                                    ppbv)
  O3 (sonde)                      14                      7.1            +6.1          −10.4/+19.2       −0.02 to +0.40
  O3 (MLS)                        33                      9.4            −5.5           −16.3/+4.5       −0.13 to +0.16     Aura MLS is +8 % higher than
                                                                                                                            ACE-FTS at 70◦ S (Froidevoux et
                                                                                                                            al., 2008)
  HNO3                            47                     19.2          +13.2            +0.2/+21.9       −0.56 to +0.57     Aura MLS shows no bias with er-
                                                                                                                            rors
                                                                                                                            (0.6 ppbv) (Livesey et al., 2013)
  HCl                             50                     39.5            −9.7           −14.6/−3.0       −0.20 to +0.09     Aura MLS > HALOE by
                                                                                                                            10 %–15 %, precision 0.2–0.6 ppbv
                                                                                                                            (Livesey et al., 2013)
∗ Root mean squares of official absolute and relative errors given by each data set.

fied by the nearest CALIOP data of that day were indicated                                    Cl∗y is calculated from the N2 O value (in ppbv) measured by
by asterisks at the bottom of the figures. Over Syowa Sta-                                    MLS and by using the empirical polynomial equation derived
tion, PSCs were observed when temperature fell ∼ 4 K be-                                      from the correlation analysis of Cly and N2 O from the Pho-
low TNAT . PSCs were often observed at 15–25 km from the                                      tochemistry of Ozone Loss in the Arctic Region in Summer
beginning of July (day 183) to late August (day 241) in 2007                                  (POLARIS) mission which took place from April to Septem-
and from late June (day 175) to early September (day 251) in                                  ber 1997 (Bonne et al., 2000). In order to compensate for
2011.                                                                                         the temporal trends of Cly and N2 O values (2.90, 2.76, and
   PSCs were observed only at 18 km after August, due to                                      2.67 ppbv for Cly (Strahan et al., 2014) and 313, 321, and
the sedimentation of PSCs and downwelling of vortex air in                                    324 ppbv for N2 O (WMO, 2007, 2011, 2014) for the years
late winter as is seen in Fig. 3. Although temperatures above                                 1997, 2007, and 2011, respectively), we used values 8 and
Syowa Station were sometimes below TNAT -4 K in June and                                      11 for constant A and 140 and 230 for constant B for years
in late September, no PSC was observed during those peri-                                     2007 and 2011 in the following equation, respectively:
ods. This may be due to other reasons, such as a different
time history of temperature for PSC formation, and/or low                                     Cl∗y (pptv) = 4.7070 × 10⁻⁷ (N2 O − A)4
HNO3 (denitrification) and/or H2 O concentration (dehydra-                                               − 3.2708 × 10⁻⁴ (N2 O − A)3
tion), which are needed for PSC formation in the late winter
season (Saitoh et al., 2006).                                                                            + 4.0818 × 10⁻² (N2 O − A)2
   Figures 4–7 show time series of HCl, ClONO2 , ClO,                                                    − 4.6856(N2 O − A) + 3225 − B.                       (2)
Cl∗y , O3 , and HNO3 over Syowa Station in 2007 and 2011
at altitudes of 18 and 22 km for all ground-based and                                         A transport barrier of minor constituents at the edge of the
satellite-based observations used in this study, respectively.                                polar vortex was reported by Lee et al. (2001) and Tilmes et
O3 (sonde) is observed with the KC96 ozonesonde for 2007,                                     al. (2006). The distribution of minor constituents is quite dif-
which is different from the ones that were used for the valida-                               ferent among the inside, in the boundary region, and outside
tion in Sect. 3 and the ECC-1Z ozonesonde for 2011 by JMA                                     of the polar vortex. In Figs. 4–7, the dark shaded area, the
(Smit and Straeter, 2004). HCl and HNO3 observed by Aura                                      light shaded area, and the white area indicate the days when
MLS and FTIR are plotted by different symbols. Total inor-                                    Syowa Station was located outside, in the boundary region,
ganic chlorine Cl∗y corresponds to the sum of HCl, ClONO2 ,                                   and inside of the polar vortex, respectively. In the Antarctic
and Clx , where the active chlorine species Clx is defined as                                 winter, there are often double peaks in the isentropic poten-
the sum of ClO, Cl, and 2 · Cl2 O2 (Bonne et al., 2000). It                                   tial vorticity (PV) gradient with respect to equivalent latitude
is known that total inorganic chlorine Cl∗y has a compact re-                                 at the 450–600 K level (Tomikawa et al., 2015). The method
lationship with N2 O (Bonne et al., 2000; Schauffler et al.,                                  to determine the three polar regions, i.e., inside the polar vor-
2003; Strahan et al., 2014). Inferred total inorganic chlorine                                tex, in the boundary region of the polar vortex, and outside
                                                                                              the polar vortex, is described in Appendix B. Note that the

www.atmos-chem-phys.net/20/1043/2020/                                                                           Atmos. Chem. Phys., 20, 1043–1074, 2020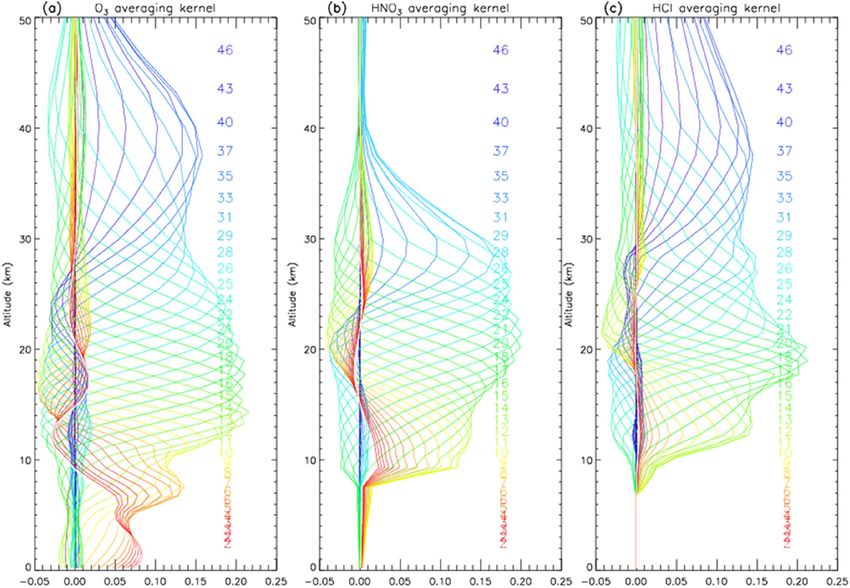
1050                                                        H. Nakajima et al.: Chlorine partitioning near the polar vortex edge

                                                                       altitude of 22 km, where only about half of the ozone was
                                                                       depleted, was selected to show the difference in the behavior
                                                                       of chemical species from that at 18 km.
                                                                          The general features of the chemical species observed in-
                                                                       side the polar vortex at 18 and 22 km in 2007 and 2011 are
                                                                       summarized as follows: HCl and ClONO2 decreased first,
                                                                       and then ClO started to increase in winter, while HCl in-
                                                                       creases and ClO decreases were synchronized in spring. HCl
                                                                       was almost zero from late June to early September, and
                                                                       the day-to-day variations were small over this period. HCl
                                                                       over Syowa Station indicates relatively larger values when
                                                                       it was located outside the polar vortex: for example, early
                                                                       August and the beginning of September at 22 km, 2007, in
                                                                       Fig. 6. HNO3 showed large decreases from June to July and
                                                                       then gradually increased in summer. Day-to-day variations
                                                                       of HNO3 from June to August were large. O3 decreased
                                                                       from July to late September when ClO concentration was in-
                                                                       creased. ClO was enhanced in August and September, and
                                                                       the day-to-day variations were large over this period. Cl∗y
                                                                       gradually increased in the polar vortex from late autumn to
                                                                       spring. The Cl∗y value became larger compared with its mix-
                                                                       ing ratio outside of the polar vortex in spring.
                                                                          The following characteristics are evident at 18 km (Figs. 4
                                                                       and 5). O3 gradually decreased from values of 2.5–3 ppmv
                                                                       before winter to values less than one-fifth, 0.3–0.5 ppmv, in
                                                                       October. The values of HCl from late June to early September
                                                                       were as small as 0–0.3 ppbv. The recovered values of HCl
                                                                       inside the vortex in spring (October–December) were larger
                                                                       than those before winter and those outside the polar vortex
                                                                       during the same period. ClONO2 inside the vortex kept near
                                                                       zero even after ClO disappeared and did not recover to the
Figure 3. Time series of (a) daytime hour and temperatures at 18 km    level before winter until spring.
in (b) 2007 and (c) 2011 and at 22 km in (d) 2007 and (e) 2011            At 22 km (Figs. 6 and 7), O3 gradually decreased from
over Syowa Station using ERA-Interim data. Approximate satura-         winter to spring, but the magnitude of the decrease was much
tion temperatures for nitric acid trihydrate (TNAT ) and ice (TICE )   smaller than that at 18 km. The values of HCl from late June
calculated by assuming 6 ppbv HNO3 and 4.5 ppmv H2 O are also          to early September were 0–1 ppbv, which are larger than
plotted in the figures by dotted lines. Dates when PSCs were ob-       those at 18 km. The recovered values of HCl in spring were
served over Syowa Station are indicated by asterisks on the bottom     nearly the same as those before winter (around 2.2 ppbv).
of the figures.
                                                                       ClONO2 recovered to larger values than those before winter
                                                                       after ClO disappeared.
                                                                          As for the temporal increase in ClONO2 in spring during
Syowa Station is often located near the vortex edge, and the           the ClO decreasing phase, we can see a peak of 1.5 ppbv at
temporal variations of chemical species observed over Syowa            18 km in 2011 and at 22 km in both 2007 and 2011 around
Station reflect the spatial distributions as well as local chemi-      27 September (day 270), but we see no temporal increase in
cal evolution. When Syowa Station was located at the bound-            ClONO2 at 18 km in 2007.
ary region or outside the polar vortex (e.g., day 310–316 in              Figure 7 shows that temporal ClO enhancement and de-
Fig. 4, day 192–195 in Fig. 5, day 309–316 in Fig. 6, and day          crease in O3 , ClONO2 , and HNO3 occurred in early win-
276–282 in Fig. 7), chemical species showed different values           ter (30 May–19 June; day 150–170) at 22 km in 2011. This
compared with the ones inside the polar vortex. The lack of            small ozone depletion event before winter may be due to an
data for ClO and HCl (MLS) from day 195 to day 219, 2007,              air mass movement from the polar night area to a sunlit area
and ClONO2 from day 170 to day 216, 2007 (Figs. 4a and                 at lower latitudes.
6a), is due to unrealistic large error values in Aura MLS or
Envisat MIPAS data products during these periods.
   The altitude of 18 km was selected because it was one of
the altitudes where nearly complete ozone loss occurred. The

Atmos. Chem. Phys., 20, 1043–1074, 2020                                                 www.atmos-chem-phys.net/20/1043/2020/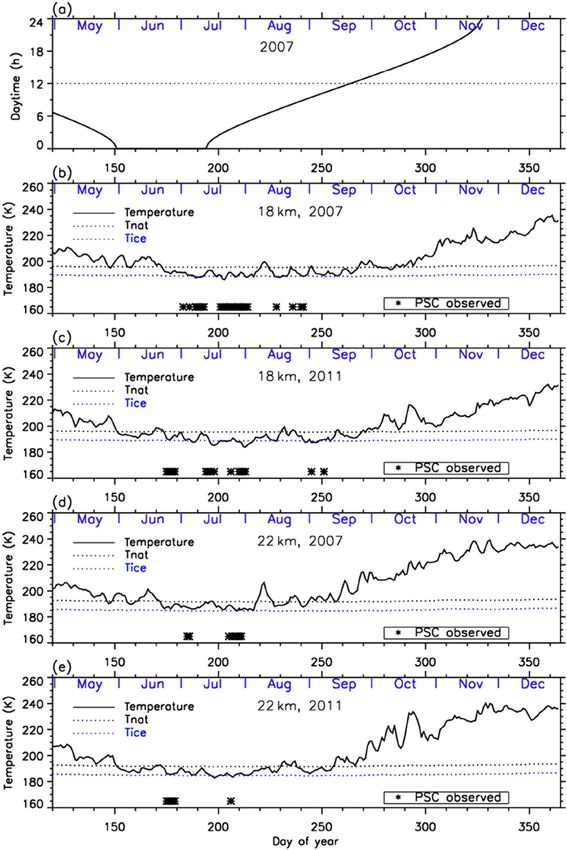
H. Nakajima et al.: Chlorine partitioning near the polar vortex edge                                                                 1051

Figure 4. Time series of (a) HCl, ClONO2 , ClO, and Cl∗y as well as (b) O3 and and HNO3 mixing ratios at 18 km in 2007 over Syowa Station.
O3 (FTIR), HCl(FTIR), and HNO3 (FTIR) were measured by FTIR at Syowa Station, while HCl(MLS), ClO(MLS), and HNO3 (MLS) were
measured by Aura MLS. O3 (sonde) was measured by ozonesonde. ClONO2 was measured by Envisat MIPAS. Cl∗y is calculated from the
Aura MLS N2 O value. See text in detail. The unit of O3 is parts per million by volume (ppmv) and the other gases are parts per billion by
volume (ppbv). The dark shaded area, the light shaded area, and the white area indicate the days when Syowa Station was located outside the
polar vortex, in the boundary region of the polar vortex, and inside the polar vortex, respectively.

Figure 5. Same as Fig. 4 but in 2011.

4.2   Time series of ratios of chlorine species                         cuss the ratios of chlorine species only for the cases when
                                                                        Syowa Station was located inside the polar vortex.
In order to discuss the temporal variations of the chlorine               Figures 8 and 9 show the time series of the ratios of
partitioning, the ratios of observed HCl, ClONO2 , and ClO              each chlorine species with respect to Cl∗y in 2007 (a) and in
with respect to Cl∗y were calculated. Hereafter, we will dis-           2011 (b) at 18 and 22 km, respectively. In these plots, HCl

www.atmos-chem-phys.net/20/1043/2020/                                                     Atmos. Chem. Phys., 20, 1043–1074, 2020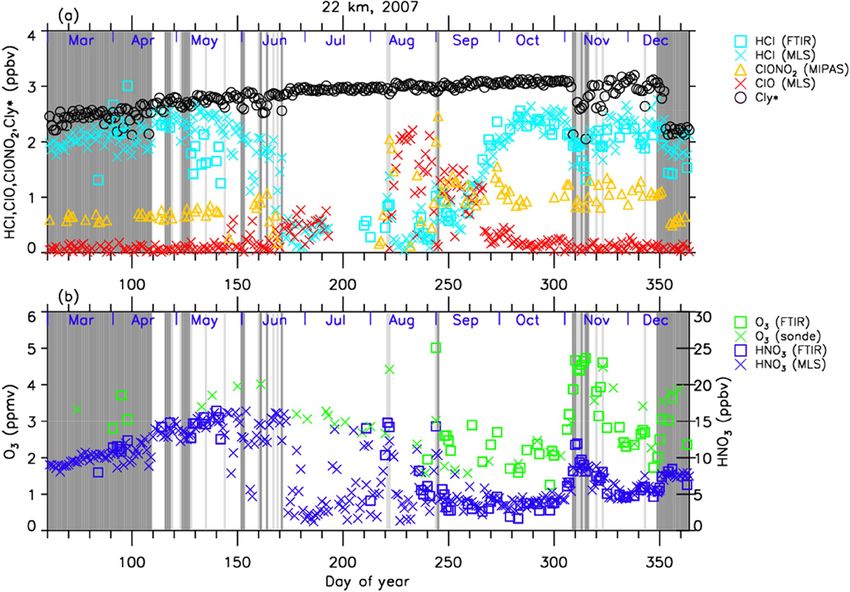
1052                                                H. Nakajima et al.: Chlorine partitioning near the polar vortex edge

Figure 6. Same as Fig. 4 but at 22 km.

Figure 7. Same as Fig. 5 but at 22 km.

data from Aura MLS were used. Note that light blue in these    than 80 % of its maximum value: 18 August–17 Septem-
figures shows that either ClONO2 or ClO data were miss-        ber; day 230–260). HCl/Cl∗y was 0–0.2 and ClONO2 /Cl∗y
ing on that day, while dark blue shows that all three data     was 0-0.6 during this same period. ClONO2 shows a neg-
sets were available on that day. For both 2007 and 2011 at     ative correlation with ClO, while HCl remained low even
18 km (Fig. 8), HCl/Cl∗y was 0.6–0.8 and ClONO2 /Cl∗y was      when ClO was low during this period. This negative corre-
0.2–0.3 before winter (10–20 May; day 130–140). The ra-        lation is shown in Fig. 10. When ClO was enhanced, the O3
tio of HCl to Cl∗y was 3 times larger than that of ClONO2      amount gradually decreased and finally reached < 0.5 ppmv
at that time. ClO/Cl∗y increased to ∼ 0.5 during the ClO-      (> 80 % destruction) in October (7 October; day 280) (see
enhanced period (the period when ClO values were more          Figs. 4 and 5). The ratios to Cl∗y became 0.9–1.0 for HCl and

Atmos. Chem. Phys., 20, 1043–1074, 2020                                        www.atmos-chem-phys.net/20/1043/2020/
H. Nakajima et al.: Chlorine partitioning near the polar vortex edge                                                      1053

0–0.1 for ClONO2 after the recovery in spring (after 17 Oc-      to the boundary region during this period (see Fig. B2 in Ap-
tober; day 290), indicating that almost all chlorine reser-      pendix B). Therefore, the temporal increase in ClONO2 in
voir species became HCl via Reactions (R13) and/or (R14),        2011 at 18 km was attributed to spatial variation, not to chem-
due to the lack of O3 and NO2 during this period. The sum        ical evolution.
ratios (HCl + ClONO2 + ClO)/Cl∗y were around 0.5–0.8 at
the time of the ClO-enhanced period. The remaining chlo-         4.3   Correlation between ClO and ClONO2
rine is thought to be either Cl2 O2 or HOCl, which will be
shown in model simulation result in Sect. 4.6. The sum ratio     Figure 10 shows the correlation between ClO and ClONO2
(HCl + ClONO2 )/Cl∗y became close to 1 after the recovery        during the ClO-enhanced period (8 August–17 September;
period (after 7 October; day 280).                               day 220–260) at 18 km in 2007 (a) and 2011 (b) and at 22 km
   For both 2007 and 2011 at 22 km (Fig. 9), HCl/Cl∗y            in 2007 (c) and 2011 (d). In this plot, the location of Syowa
was 0.8–0.9 and ClONO2 /Cl∗y was 0.2–0.3 before winter           Station with respect to the polar vortex (inside, in the bound-
(20 April–20 May; day 110–140). The ratio of HCl to Cl∗y         ary region, and outside of the polar vortex) is indicated by
was 3 to 4 times larger than that of ClONO2 . ClO/Cl∗y           different symbols. Note that MLS ClO and MIPAS ClONO2
increased to 0.5–0.7 during the ClO-enhanced period (8–          data were sampled on the same day at the nearest orbit to
28 August – day 220–240 in 2007; 18 August–7 September –         Syowa Station for both satellites. The maximum differences
day 230–250 in 2011). HCl/Cl∗y was 0–0.2 and ClONO2 /Cl∗y        between these two satellites’ observational times and loca-
was 0–0.6 during this period. ClONO2 shows a negative cor-       tions are 9.0 h in time and 587 km in distance. Mean differ-
relation with ClO, while HCl remained low even when ClO          ences are 6.8 h in time and 270 km in distance, respectively.
was low during this period as in the case at 18 km. The O3       Solid lines show regression lines obtained by reduced ma-
amount gradually decreased during the ClO-enhanced pe-           jor axis (RMA) regression. Negative correlations of slope of
riod but the concentration remained at more than 1.5 ppmv        about −1.0 between ClO and ClONO2 are seen in all figures.
(less than half destruction) at this altitude (see Figs. 6 and      The negative correlation between ClO and ClONO2 at
7). When the ClO enhancement ended, the increase in both         Syowa Station is explained by the difference in the concen-
ClONO2 and HCl occurred simultaneously in early spring           tration of ClO, NO2 , ClONO2 , and HNO3 inside, outside,
(17 September–7 October; day 260–280). Then the ratios           and at the boundary region of the polar vortex around the
to Cl∗y became 0.6–0.7 for HCl and 0.3–0.4 for ClONO2 in         station. Outside of the polar vortex, the ClO concentration
spring (after 7 October; day 280). This phenomenon shows         is lower and NO2 concentration is higher than those inside
that more chlorine deactivation via Reaction (R12) occurred      the polar vortex. Inside the polar vortex, HNO3 is taken up
towards ClONO2 at 22 km rather than at 18 km. This is at-        by PSCs and removed by the sedimentation of PSCs from
tributed to the existence of O3 and NO2 during this period       the lower stratosphere (denitrification process). The NOx
at 22 km, which was different from the case at 18 km. The        concentration is low because HNO3 is a reservoir of NOx
sum ratios (HCl + ClONO2 + ClO)/Cl∗y were around 0.7–            through the reactions
1.2 at the time of the ClO-enhanced period. The remaining
                                                                 NO2 + OH + M → HNO3 + M,                                (R17)
chlorine is thought to be either Cl2 O2 or HOCl. The sum ra-
tio (HCl + ClONO2 + ClO)/Cl∗y became around 1.2 after the        HNO3 + hν → NO2 + OH,                                   (R18)
recovery period (after 27 September; day 270). The reason
                                                                 and
why the observed sum ratio exceeds the calculated Cl∗y value
might be because the N2 O–Cly correlation from the one in        HNO3 + OH → NO3 + H2 O.                                 (R19)
Eq. (2) is not applicable at this altitude.
   In 2011 at 18 km (Fig. 8), another temporal increase in       The NO2 concentration is low and ClONO2 concentration
ClONO2 up to a ratio of 0.4 occurred in early spring (around     is also low due to the consumption of ClONO2 by the het-
2–12 October; day 275–285) in accordance with the HCl in-        erogeneous Reaction (R2) inside the polar vortex. In spring,
crease, and then the ClONO2 amount gradually decreased to        the ClO amount increases due to the activation of chlorine
nearly zero after late October (after 27 October; day 300).      species by Reactions (R1)–(R8) inside the polar vortex. At
This temporal increase in ClONO2 could be attributed to the      the boundary region, ClO and NO2 concentrations indicate
temporal change of the location of Syowa Station with re-        the value between the inside and outside of the polar vor-
spect to the polar vortex. Although Syowa Station was judged     tex; that is, the ClO concentration is much higher than that
to be inside the polar vortex during 14 July–16 December         outside of the polar vortex and NO2 concentration is much
(day 195–350) by our analysis, the difference between the        higher than that inside of the polar vortex. Thus, the ClONO2
equivalent latitude over Syowa Station and that at the inner     concentration there is elevated in August–September due to
edge became less than 10◦ on around 7 October (day 280),         Reaction (R12). This causes the negative correlation between
while it was typically between 15 and 20◦ on other days. O3      ClO and ClONO2 due to the relative distance between Syowa
and HNO3 showed higher values around 7 October (day 280)         Station and the edge of the polar vortex. When Syowa Sta-
(see Fig. 5), indicating that Syowa Station was located close    tion was located deep inside the polar vortex, there was more

www.atmos-chem-phys.net/20/1043/2020/                                             Atmos. Chem. Phys., 20, 1043–1074, 2020
1054 H. Nakajima et al.: Chlorine partitioning near the polar vortex edge
Figure 8. Time series of the ratios of HCl (dark blue or light blue), ClONO2 (yellow), and ClO (red) to total chlorine (Cl∗y ) over Syowa
Station at 18 km in (a) 2007 and in (b) 2011. Light blue shows that either ClONO2 or ClO data were missing on that day, while dark blue
shows that all three data sets were available on that day. Shaded areas are the same as Fig. 4.
ClO and less ClONO2 . On the contrary, when Syowa Sta- reactive chlorines; i.e., Cly = Cl + 2 · Cl2 + ClO + 2 · Cl2 O2 +
tion was located near the vortex edge, there was less ClO OClO+HCl+HOCl+ClONO2 +ClNO2 +BrCl. Note that we
and more ClONO2 . The equivalent latitude (EL) over Syowa plotted modeled values at 12:00 UTC (∼ 15:00 local time of
Station was calculated as described in Appendix B for each Syowa Station) calculated by the MIROC3.2 CCM in order
correlation point. The EL at each correlation point is now to compare the daytime measurements of FTIR and satellites.
shown by the color code in Fig. 10. It generally shows the In Fig. 11b, d, g, and i, modeled HCl and Cly are systemat-
tendency that warm-colored higher equivalent latitude points ically smaller by 20 %–40 % compared with FTIR or MLS
are located more towards the bottom right-hand side. This is measurements. The cause of this discrepancy may be partly
further confirmed by three-dimensional model simulation as due to either smaller downward advection and/or faster hor-
shown later. izontal mixing of an air mass across the subtropical barrier
in MIROC3.2 CCM (Akiyoshi et al., 2016). Nevertheless,
4.4 Comparison with model results evolutions of measured ClO and ClONO2 for the period are
well simulated by the MIROC3.2 CCM. Modeled O3 were in
very good agreement with FTIR and/or MLS measurements
Figures 11 and 12 show comparisons of daily time series of
throughout the year in both altitudes for both years. Here-
simulated mixing ratios of ClO, HCl, ClONO2 , Cly , and O3
after, the result of MIROC3.2 CCM at 50 hPa (∼ 18 km) is
by the MIROC3.2 chemistry–climate model (Akiyoshi et al.,
discussed.
2016) with FTIR, Aura MLS, and Envisat MIPAS measure-
ments at 18 and 22 km. For a description of the MIROC3.2
CCM, please see Appendix A. In these figures, Cly for Aura 4.5 Polar distribution of minor species
MLS in the panels (d) and (i) actually represents the Cl∗y
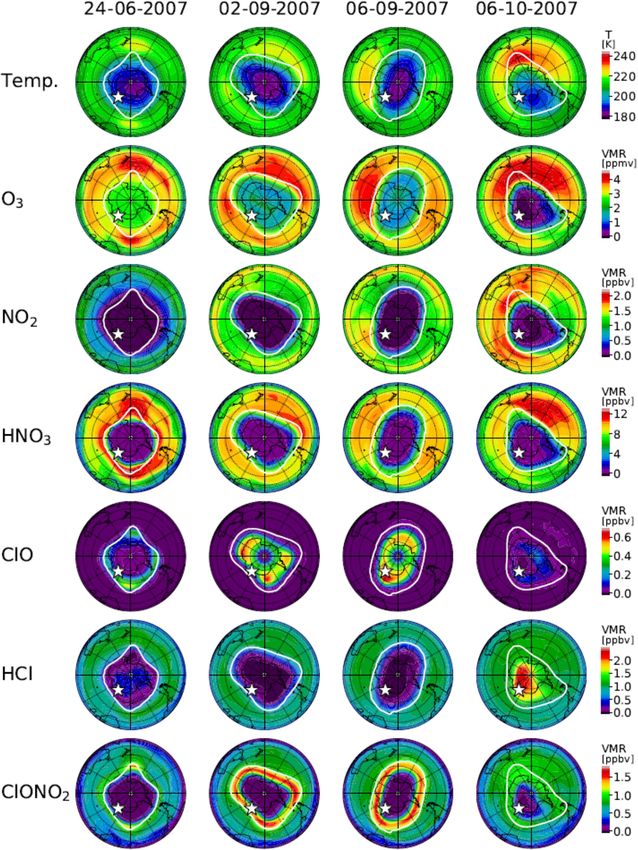
value calculated by Eq. (2) using the N2 O value measured by Figure 13 shows distributions of temperature from the model
Aura MLS. Cly from the MIROC3.2 CCM is the sum of total nudged toward the ERA-Interim data and simulated mix-
Atmos. Chem. Phys., 20, 1043–1074, 2020 www.atmos-chem-phys.net/20/1043/2020/H. Nakajima et al.: Chlorine partitioning near the polar vortex edge 1055 Figure 9. Same as Fig. 8 but at 22 km. ing ratios of O3 , NO2 , HNO3 , ClO, HCl, and ClONO2 On 2 September (day 245), amounts of NO2 , HNO3 , HCl, by the MIROC3.2 CCM at 50 hPa for 24 June (day 175), and ClONO2 all show very depleted values in the polar vor- 2 September (day 245), 6 September (day 249), and 6 Oc- tex. The amount of ClO shows some enhanced values inside tober (day 279) in 2007. Polar vortex edges defined by the the polar vortex. The development of ozone depletion was method described in Appendix B were plotted with white seen in the polar vortex. Note that ClONO2 shows enhanced outlines. The location of Syowa Station is shown by a white values around the boundary region of the polar vortex. This star in each panel. On 24 June (day 175), stratospheric tem- might be due to Reaction (R12) at this location. On this day peratures over Antarctica were already low enough for the (day 245), Syowa Station was located inside the polar vor- onset of heterogeneous chemistry. Consequently, NO2 was tex close to the vortex edge, where ClO was smaller and converted into HNO3 via Reaction (R17), and HNO3 in the ClONO2 was greater than the values deep inside the polar polar vortex was condensed onto PSCs. Note that the de- vortex as observed and indicated by the upper-left circle with pleted area of NO2 was greater than that of HNO3 . This is a cross in Fig. 10a. due to the occurrence of Reaction (R12) that converts ClO On 6 September (day 249), most features were the same and NO2 into ClONO2 at the edge of the polar vortex, which as on 2 September, but the shape of the polar vortex was dif- is shown by the enhanced ClONO2 area at the vortex edge ferent. Consequently, Syowa Station was located deep inside in Fig. 13. Also, HCl and ClONO2 are depleted in the po- the polar vortex, where ClO was greater and ClONO2 was lar vortex due to the heterogeneous Reactions (R1), (R2), smaller than the values around the boundary region of the (R3), and (R4) on the surface of PSCs and aerosols. Some polar vortex as observed and indicated by the lower-right cir- HCl remains near the core of the polar vortex, because the cle with a cross in Fig. 10a. Hence, the negative correlation initial amount of the counterpart of the heterogeneous Reac- between ClO and ClONO2 seen in Fig. 10 was due to varia- tion (R1) (ClONO2 ) was less than that of HCl, as was also tion of the relative distance between Syowa Station and the shown by CLaMS, SD-WACCM, and TOMCAT/SLIMCAT edge of the polar vortex. model simulations by Grooß et al. (2018). The O3 amount As for HCl, it remained near zero not only on this day was only slightly depleted within the polar vortex on this day. (6 September) but also on 2 September when Syowa Sta- www.atmos-chem-phys.net/20/1043/2020/ Atmos. Chem. Phys., 20, 1043–1074, 2020
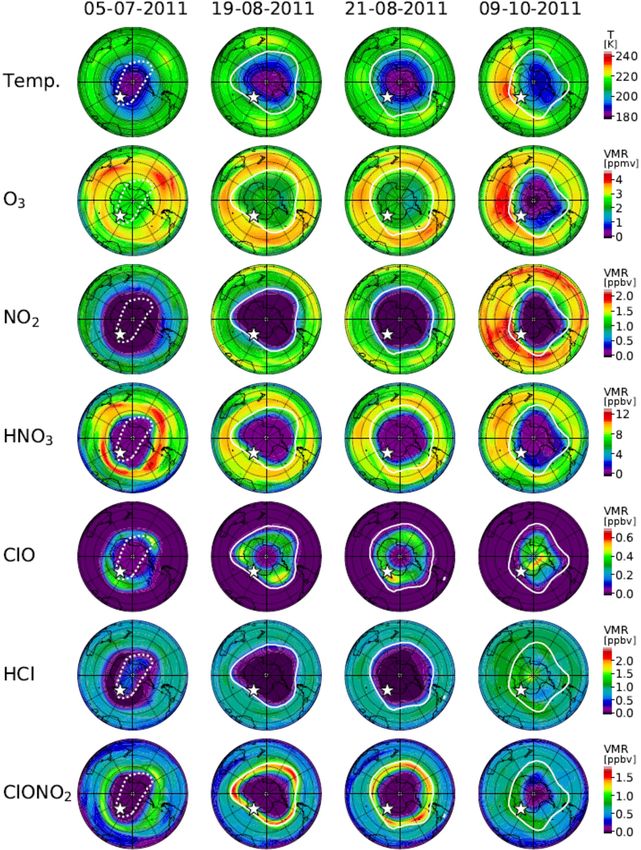
1056                                                         H. Nakajima et al.: Chlorine partitioning near the polar vortex edge

Figure 10. Scatter plot between ClO (Aura MLS) and ClONO2 (Envisat MIPAS) mixing ratios between 8 August and 17 September (day
220–260) at 18 and 22 km in 2007 and 2011. Crosses, triangles, and squares represent the data when Syowa Station was located inside the
polar vortex, in the boundary region of the polar vortex, and outside the polar vortex, respectively. Solid lines are regression lines obtained by
reduced major axis (RMA) regression. Color represents the equivalent latitude over Syowa Station on that day. Circles with crosses represent
the days which are shown in Figs. 13 and 14.

tion was located inside the polar vortex close to the vortex               gust (day 231), 21 August (day 233), and 9 October (day 282)
edge. Therefore, observed day-to-day variations of HCl were                in 2011. The polar vortex edges and location of Syowa Sta-
small and did not show any correlation with ClO (see Figs. 4–              tion were also plotted. On 5 July (day 186), the situation was
7). A possible explanation to keep a near zero HCl value                   similar to that of 24 June (day 175) in 2007. Note that the in-
close to the vortex edge is due to so-called “HCl null cy-                 ner edge of the polar vortex was defined on this day. Syowa
cles”, which were started with Reaction (R13), proposed by                 Station was located deeper inside the polar vortex on 5 July
Müller et al. (2018). This cycle is discussed later.                       in 2011 than on 24 June in 2007, and the remaining HCl was
   On 6 October (day 279), ClO enhancement has almost                      observed by MLS (see Fig. 5).
disappeared. Inside the polar vortex, O3 , NO2 , HNO3 , and                   On 19 August (day 231) and 21 August (day 233), the
ClONO2 showed very low values. Ozone was almost fully                      situations were similar to those of 2 September (day 245)
destroyed at this altitude in the polar vortex. However, the               and 6 September (day 249) in 2007, respectively. ClO and
amount of HCl increased deep inside the polar vortex. This                 ClONO2 correlations on these days are also indicated by cir-
might be due to the recovery of HCl by Reactions (R13)                     cles with crosses in Fig. 10b.
and/or (R14) deep inside the polar vortex, where there was                    On 9 October (day 282), the situation was similar to that of
no O3 or NO2 left and Reactions (R13) and/or (R14) were fa-                6 October (day 279) in 2007, but Syowa Station was located
vored compared with Reaction (R12). Syowa Station was lo-                  inside the polar vortex closer to the inner vortex edge than
cated deep inside the polar vortex, and the simulated and ob-              in 2007. The recovery of ClONO2 by Reaction (R12) was
served amounts of HCl were both more than 10 times greater                 simulated and observed at Syowa Station in addition to the
than those of ClONO2 on this day (see Fig. 4).                             recovery of HCl by Reaction (R13) (see Fig. 8b), because
   Figure 14 shows distributions of temperature from the                   there were some remaining O3 and NO2 air masses near the
model nudged toward the ERA-Interim data and simulated                     inner vortex edge (see Fig. 5). This shows the phenomena
mixing ratios of O3 , NO2 , HNO3 , ClO, HCl, and ClONO2 by                 described on the last paragraph in Sect. 4.2.
the MIROC3.2 CCM at 50 hPa for 5 July (day 186), 19 Au-

Atmos. Chem. Phys., 20, 1043–1074, 2020                                                        www.atmos-chem-phys.net/20/1043/2020/
H. Nakajima et al.: Chlorine partitioning near the polar vortex edge                                                                          1057

Figure 11. Daily time series of measured and modeled minor species over Syowa Station at 18 km. Black diamonds are data by FTIR, red
squares are by Aura MLS and Envisat MIPAS, blue triangles are data by MIROC3.2 CCM. Panel (a) is for ClO, (b) is for HCl, (c) is for
ClONO2 , (d) is for Cly , and (e) is for O3 in 2007. (f) is for ClO, (g) is for HCl, (h) is for ClONO2 , (i) is for Cly , and (j) is for O3 in 2011.

4.6   Time evolution of chlorine species from CCM and                       CCM at 68.4, 71.2, 76.7, and 87.9◦ S in 2007 are plotted in
      discussion                                                            Fig. 15. The dates on which the distribution of each species
                                                                            is shown in Fig. 13 are indicated by vertical dotted lines.
Three-hourly time series of zonal-mean active chlorine                      In Fig. 15, it is shown that HCl and ClONO2 rapidly de-
species, Cl2 O2 (b), Cl2 (c), ClO (d), and their sum (ClO +                 creased on around 10 May (day 130) at 87.9◦ S due to the
2 · Cl2 O2 + 2 · Cl2 ) (a), HOCl (e), and chlorine reservoir                heterogeneous Reaction (R1), when PSCs started to form in
species HCl (f) and ClONO2 (g) modeled by MIROC3.2                          the Antarctic polar vortex (Fig. 15f and g). Consequently,

www.atmos-chem-phys.net/20/1043/2020/                                                           Atmos. Chem. Phys., 20, 1043–1074, 2020
1058 H. Nakajima et al.: Chlorine partitioning near the polar vortex edge Figure 12. Same as Fig. 11 but for 22 km. Cl2 was formed (Fig. 15c). Similar chlorine activation was 30 May–9 June (day 150–160) (Fig. 15b and c) through Re- seen at 76.7◦ S about 5–10 d later than at 87.9◦ S. The de- actions (R5), (R8), and (R9). At 87.9◦ S, conversion from crease in HCl stopped when the counterpart of the hetero- Cl2 to Cl2 O2 was slow, due to the lack of sunlight, which geneous Reaction (R1) (ClONO2 ) was missing on around is needed for Reaction (R5). The increase in ClO occurred 20 May (day 140). The continuous loss of HCl occurred much later in winter (9 July; day 190 or later), because sun- from June to July (day 160–200). The possible cause of this light is needed to form ClO by Reactions (R5) and (R8) in loss will be discussed later. Gradual conversion from Cl2 the polar vortex (Fig. 15d). Nevertheless, there were some into Cl2 O2 (ClO dimer) was seen at all latitudes on around enhancements of ClO in early winter, on 24 June (day 175), Atmos. Chem. Phys., 20, 1043–1074, 2020 www.atmos-chem-phys.net/20/1043/2020/
H. Nakajima et al.: Chlorine partitioning near the polar vortex edge                                                              1059

Figure 13. Polar southern hemispheric plots for ERA-Interim tem-       Figure 14. Same as Fig. 13 but for 5 July (day 186), 19 August
perature and simulated mixing ratios of O3 , NO2 , HNO3 , ClO, HCl,    (day 231), 21 August (day 233), and 9 October (day 282), 2011.
and ClONO2 by a MIROC3.2 chemistry–climate model (CCM) at              The polar vortex edge on 5 July plotted by a dotted while outline
50 hPa for 24 June (day 175), 2 September (day 245), 6 September       indicates that the inner vortex edge was defined on this day.
(day 249), and 6 October (day 279), 2007. The polar vortex (outer)
edge defined as the method described in Appendix B at 450 K was
plotted by a white outline in each panel. The location of Syowa Sta-   The cause of the HOCl increase at 87.9◦ S from August is
tion was shown by a white star in each panel.                          not clear at the moment. In Fig. 15, the species which de-
                                                                       creased at 87.9◦ S from August was Cl2 (Fig. 15c). If sun-
                                                                       light was available, Cl2 was converted into HOCl through
                                                                       Reactions (R5) and (R8) as well as the following reaction:
simulated at the edge of the polar vortex (Fig. 13) where there
was some sunlight available due to the distortion of the shape         ClO + HO2 → HOCl + O2 .                                   (R20)
of the polar vortex. The increase in ClO occurred from a
lower latitude (68.4◦ S) on around 14 July (day 195) towards           Here, HO2 was needed to yield HOCl. One possibility to
a higher latitude (87.9◦ S) on around 12 September (day 255)           yield HO2 in August is either one of the HCl null cycles C1
(Fig. 15d). Diurnal variation of ClO was also seen at latitudes        or C2 (see Appendix C) or one of the HCl destruction cycles
between 68.4 and 76.7◦ S. When the stratospheric tempera-              C3 or C4 (see Appendix C), which was described in Müller
ture increased above NAT saturation temperature on around              et al. (2018). If the air mass at 87.9◦ S was located equator-
27 September (day 270) (Fig. 3b), chlorine activation ended,           ward due to the obliqueness of the polar vortex a few days
and ClO was mainly converted into HCl at all latitudes in-             earlier, then sunlight may have been available and such reac-
side the polar vortex (Fig. 15d and f). This is because Re-            tions could yield HOCl at 87.9◦ S.
actions (R13) and/or (R14) occur more frequently than Re-                 The continuous loss of HCl was seen at 87.9◦ S between
action (R12) inside the polar vortex due to the depleted O3            9 June (day 160) and 19 July (day 200) even after the
amount there, as was described in Sect. 1 (Douglass et al.,            disappearance of the counterpart of the heterogeneous Re-
1995). The increase in HOCl due to the heterogeneous Re-               action (R1) (Fig. 15f). The cause of this continuous loss
action (R2) on the surface of PSCs occurred gradually from             was unknown until recently, where a hypothesis was pro-
June at lower latitudes (68.4 and 71.2◦ S) (Fig. 15e). It also         posed that includes the effect of decomposition of particu-
occurred at 76.7◦ S from July and at 87.9◦ S from August.              late HNO3 by some processes like ionization of air molecules

www.atmos-chem-phys.net/20/1043/2020/                                                   Atmos. Chem. Phys., 20, 1043–1074, 2020
You can also read