Satellite telemetry reveals complex migratory movement patterns of two large macaw species in the western Amazon basin
←
→
Page content transcription
If your browser does not render page correctly, please read the page content below
VOLUME 16, ISSUE 1, ARTICLE 14
Brightsmith, D. J., J. D. Boyd, E. A. Hobson and C. J. Randel. 2021. Satellite telemetry reveals complex migratory movement patterns of two large
macaw species in the western Amazon basin. Avian Conservation and Ecology 16(1):14. https://doi.org/10.5751/ACE-01822-160114
Copyright © 2021 by the author(s). Published here under license by the Resilience Alliance.

Research Paper

Satellite telemetry reveals complex migratory movement patterns of
two large macaw species in the western Amazon basin
Donald J. Brightsmith 1, Janice D. Boyd 1, Elizabeth A. Hobson 2 and C J. Randel 3
1
  Schubot Avian Health Center, Department of Veterinary Pathobiology, College of Veterinary Medicine and Biomedical Science,
Texas A&M University, 2Department of Biological Sciences, University of Cincinnati, Cincinnati, Ohio, USA, 3Southwestern
Wildlife Survey, South Pasadena, California, USA

ABSTRACT. Understanding avian movement patterns is important to ensure that conservation decisions are made on a scale that is
relevant to the species. The family Psittacidae (macaws, parrots and allies) is one of the most endangered large bird families in the
world, but due to a variety of technical and logistical difficulties our knowledge of their movements is limited. The scant evidence that
exists suggests that parrot populations exhibit a complex mix of migratory and sedentary movement patterns. We obtained location
data from 14 Argos satellite transmitter deployments on six Scarlet Macaws (Ara macao) and four Blue-and-yellow Macaws (Ara
ararauna) from 2008 to 2016 in lowland tropical moist forest of southeast Peru. The collars provided data spanning 317 ± 61 days (N
= 14 deployments). The data allowed us to document spatial use during the end of the breeding season, the whole non-breeding season,
and into the subsequent breeding season. About 30% of individuals in the study, all marked in 2009, did not show large seasonal
changes in spatial use. However, the remaining birds moved up to 150 km from their nesting areas and averaged a 24-fold increase in
range size during the non-breeding season. During the non-breeding season most members of both species engaged in exploratory
flights of about 20 km perhaps to gather information on food availability at the landscape level. Surprisingly, range sizes, range shift
timing, and most other movement parameters did not differ between the two macaw species studied. In addition, most individuals of
both species moved outside the 1.36 million hectare protected area complex during the non-breeding season, highlighting the need for
large protected areas to conserve these macaws in the forests of the western Amazon basin.

La télémétrie par satellite révèle des schémas complexes de déplacements migratoires chez deux
espèces d'aras de grande taille dans l'ouest du bassin amazonien
RÉSUMÉ. Les spécialistes chargés de la conservation doivent comprendre les schémas de déplacements des oiseaux pour prendre des
décisions à une échelle pertinente pour les espèces. La famille des Psittacidae (aras, perroquets et autres espèces apparentées) est l'une
des familles de grands oiseaux les plus menacées au monde, mais notre connaissance de leurs déplacements est limitée en raison de
diverses difficultés techniques et logistiques. Les rares données existantes indiquent que les populations de perroquets présentent un
mélange complexe de déplacements migratoires et sédentaires. Des données de localisation ont été obtenues à partir de 14 émetteurs
satellites Argos déployés sur six Aras rouges (Ara macao) et quatre Aras bleus (Ara ararauna) de 2008 à 2016 dans la forêt tropicale
humide de basse altitude du sud-est du Pérou. Les colliers ont fourni des données s'étendant sur 317 ± 61 jours (N = 14). Ces données
nous ont permis de documenter l'utilisation spatiale à la fin de la saison de nidification, en dehors de la saison de reproduction et
pendant la saison de nidification suivante. Pour environ 30 % des individus suivis, tous marqués en 2009, il n'y a pas eu de grands
changements sur le plan de l'utilisation spatiale entre les saisons. Cependant, les autres oiseaux se sont déplacés jusqu'à 150 km de leur
aire de nidification et l'aire occupée en dehors de la saison de reproduction était 24 fois plus grande en moyenne que celle occupée en
nidification. En dehors de la saison de reproduction, la plupart des individus des deux espèces ont fait des vols exploratoires d'environ
20 km, peut-être pour sonder la disponibilité de nourriture dans le paysage environnant. Étonnamment, la taille des aires de répartition,
le moment du changement d'aires et la plupart des autres paramètres relatifs aux déplacements ne différaient pas entre les deux espèces
d'aras étudiées. De plus, la plupart des individus des deux espèces se sont déplacés à l'extérieur du complexe d'aires protégées de
1,36 million d'hectares en dehors de la saison de reproduction, ce qui souligne la nécessité de disposer de grandes aires protégées pour
conserver ces aras dans les forêts de l'ouest du bassin amazonien.
Key Words: Argos satellite telemetry; exploratory behavior; home range; protected areas; Psittacidae

INTRODUCTION                                                                animal movements is also vital for understanding how human
The movement of individual organisms is fundamental to nearly               impacts like habitat loss, habitat fragmentation, and climate
all ecological and evolutionary processes including seed dispersal,         change are impacting species (Møller et al. 2008, Kennedy and
metapopulation dynamics, geographic isolation, and more                     Marra 2010). Many conservation efforts are dependent on
(Nathan 2008, Holland et al. 2009). Knowledge of individual                 information about individual movements, especially of migratory

Address of Correspondent: Donald J Brightsmith, Department of Veterinary Pathobiology, TAMU 4467, Texas A&M University, College Station,
TX, USA, brightsmith1@tamu.edu
Avian Conservation and Ecology 16(1): 14
                                                                                                         http://www.ace-eco.org/vol16/iss1/art14/

animals, to ensure that conservation actions are undertaken in            2014). Due to their complex migration patterns and serious lack
key locations, in appropriate habitats, and at a scale relevant to        of unbiased movement information, studies of psittacine
the needs of the species (Haig et al. 1998, Wright et al. 1999, Allen     movement are key for better understanding and conserving this
and Singh 2016, Morellato et al. 2016, Bovo et al. 2018).                 highly endangered group.
The family Psittacidae (macaws, parrots and allies) is one of the         We use Argos satellite telemetry collars developed for large
most endangered large bird families in the world (Bennett and             macaws (Boyd and Brightsmith 2013) to determine the ranging
Owens 1997, Collar 1997, Olah et al. 2016). However, due to a             patterns of Scarlet (Ara macao) and Blue-and-yellow (Ara
variety of technical and logistical difficulties, our knowledge of        ararauna) Macaws during the breeding and non-breeding seasons
parrot movements is limited. They are difficult to capture, and           in the lowlands of the Tambopata region of southeastern Peru.
even when captured, the combination of the birds’ destructive             In this region, both species show large seasonal variation in
abilities and their relatively low body mass has made it difficult        abundance and soil consumption at clay licks (Renton 2002,
to create a transmitter that is light enough for the bird to carry,       Brightsmith et al. 2018). While neither species completely
tough enough to resist destruction, and with enough battery life          disappears from the area, both species drop greatly in abundance
to last through full seasonal migrations (Meyers 1994, Bjork and          shortly after chicks fledge in March, then abundance increases
Powell 1995, Boyd and Brightsmith 2013).                                  again during the middle of the dry season beginning in July
                                                                          (Brightsmith et al. 2018, and DJB unpublished data). These
Despite these challenges, we have gained some insight into the
                                                                          apparent fluctuations could be due to changes in detectability (as
seasonal movement patterns of parrots using two lines of
                                                                          suggested by Adamek 2011) or long distance movements. VHF
evidence: changes in seasonal abundances of parrot populations
                                                                          telemetry studies by Adamek (2011), based 80 km from our
and VHF (very high frequency) tracking of individual birds.
                                                                          research site, found that both species expanded their home ranges
Large drops in abundance post breeding are common at many
                                                                          greatly after breeding, using ranges of ~6,000 to 27,000 ha. Based
sites for many species and seasonal appearance of parrots that
                                                                          on these observations, we hypothesized that: 1) migratory macaws
depart without breeding are regularly recorded in observational
                                                                          will have home ranges of thousands of ha during the non-breeding
studies (Symes and Perrin 2003, Ragusa-Netto 2004, Ragusa-
                                                                          season and 2) both species will be partially migratory, with some
Netto 2006, McReynolds 2012, Carrara et al. 2019). VHF
                                                                          individuals remaining at the site year-round while others migrate
tracking studies have confirmed that within some species and even
                                                                          away from the breeding grounds.
within some populations, some individuals remain as sedentary
residents while others migrate, and these movements can change
from year to year for certain individuals (Snyder et al. 1994,            METHODS
Salinas-Melgoza 2003, Bjork 2004). Other parrot populations
show little or no seasonal fluctuation in abundance and radio
                                                                          Study area
                                                                          Our study site was the Tambopata Research Center (13° 08’ S, 69°
tracked members show no large-scale seasonal movements
                                                                          36’ W) in Madre de Dios Department in southeastern Peru. The
suggesting some populations are almost completely resident
                                                                          center is located in the Tambopata National Reserve (275,000 ha)
(Lindsey et al. 1991, Collar 1997, Berg et al. 2007, Lee and
                                                                          immediately adjacent to the Bahuaja-Sonene National Park
Marsden 2012). Often the same species shows marked seasonal
                                                                          (1,091,000 ha). The area is tropical moist forest near the boundary
fluctuations at some sites and little or no fluctuation at other sites,
                                                                          with subtropical wet forest (Tosi 1960) and both protected areas
suggesting highly variable intraspecific movement patterns
                                                                          remain almost completely covered with native vegetation. The
(Forshaw 1989, Bjork 2004, Karubian et al. 2005, Lee and
                                                                          elevation is 250 m asl with 3,200 mm of rain per year and a wet
Marsden 2012). As a whole, these studies suggest that parrots
                                                                          season from November to March (Brightsmith 2004). The area
show a complex mix of resident, partially migratory, and fully
                                                                          contains a mix of mature floodplain forest, successional
migratory behaviors and this varies greatly at the level of species
                                                                          floodplain forest, Mauritia flexuosa palm swamps, and upland
and population.
                                                                          forest (Foster et al. 1994). The site is adjacent to the large Colorado
VHF telemetry studies have shown that seasonal movements of               Clay Lick, where psittacines and other birds and mammals
10’s of kms (Myers and Vaughan 2004, Salinas-Melgoza and                  consume sodium-rich clay on a daily basis (Brightsmith 2004,
Renton 2007, Ortiz-Maciel et al. 2010) up to 100’s of kms (Bjork          Brightsmith and Villalobos 2011).
2004, Adamek 2011) are regular for medium to large parrots. Most
Neotropical parrots have broadly similar diets comprised mostly           Macaw capture and device attachment
of plant reproductive parts and landscape level movements are             We captured 14 separate individual macaws (Scarlet = 8, Blue-
often to exploit variably food supplies resulting from spatial            and-yellow = 6) and deployed on them 18 PTT collars over a total
variation in plant community composition and phenological                 of seven field seasons between 2008 and 2016. Four collars failed
patterns (Salinas-Melgoza and Renton 2007, Gilardi and Toft               shortly after deployment and did not give enough data to be
2012, Lee et al. 2014, Renton et al. 2015). However, detection            included in the study so we report data on 14 deployments across
distance of VHF collars is limited to just a few km, so tagged            10 total macaws (Scarlet = 6, Blue-and-yellow = 4). We obtained
birds can only be found in areas where researchers look for them          data from two Scarlet Macaws in more than one season: Angeles
(Enkerlin-Hoeflich 1995, Bridge et al. 2011). As a result, these          in four different seasons and Franz in two different seasons. All
studies likely underestimate movements, as they are biased against        other macaws were collared only once. All macaws trapped were
detecting birds at distant and unexpected locations (Enkerlin-            adults. Macaws were trapped in two different types of sites, the
Hoeflich 1995, Bjork 2004, Powell and Bjork 2004, Salinas-                Colorado Clay Lick (N = 9 individuals and 9 collar deployments
Melgoza and Renton 2005, Adamek 2011, Faegre and Berkunsky                on 6 Blue-and-yellow and 3 Scarlet Macaws during Jan - Feb 2008,
Avian Conservation and Ecology 16(1): 14
                                                                                                     http://www.ace-eco.org/vol16/iss1/art14/

Jan, Feb, and Dec 2009) or at active nests (N = 5 individuals all       calculate one location per overflight. This system normally
Scarlet Macaws, Jan - Feb 2011, 2012, 2013, 2016, some of which         produced < 4 locations per day. In 2008 and 2009 we programmed
were retrapped multiple times at the same nest or at nest sites         collars to broadcast for a single 8- or 11-hour block per broadcast
within 1 km, resulting in 11 different collar deployments). At the      day. In subsequent years, we used the Telonics Product
clay lick we used two different trapping methods: a modified bal-       Programmer to predict times of high satellite availability and
chatri trap where nylon loops were tied to perches adjacent to clay     programmed collars to broadcast in two blocks of about 4 hrs per
licks (N = 6 captured individuals) or mist nets adjacent to clay        broadcast day to overlap times of high satellite availability
licks (N = 3 individuals). The artificial nests used for trapping       (Telonics 2015). For all Blue-and-yellow Macaws and all but one
were hung as part of our macaw breeding ecology studies                 Scarlet Macaw, over 99.5% of all locations were obtained between
(Nycander et al. 1995, Vigo et al. 2011, Olah et al. 2014). We          06:00 and 18:00 (daylight hours). For one Scarlet Macaw
trapped macaws at active nests only after they had large chicks         (Wheezy) all locations were obtained between 13:00 and 22:00
(> 40 days old) which were able to thermoregulate on their own.         likely due to user error in programming or starting the transmitter.
Further details of the trapping methods are not presented here
to guard against others using them for poaching or other non-           Data processing
scientific purposes.                                                    Data were downloaded from Argos-Web and consolidated into
                                                                        Excel files for later analysis. Using the provided location codes,
In all nests we attempted to capture the males. Sex identification
                                                                        we selected location data with estimated lognormal mean error
of individuals at target nests was done during hundreds of hours
                                                                        of ~ 2 km or less for inclusion in our analyses (Boyd and
of observations during a companion study (Vigo Trauco 2020).
                                                                        Brightsmith 2013). We implemented quality control procedures
We identified the sex of all captured birds as male if they were
                                                                        to identify and remove duplicate locations and outliers. We
observed feeding females. (Vigo Trauco 2020). However, in one
                                                                        identified outliers as sequential points separated by a distance of
nest (Ceiba), the bird captured and radio collared was the female
                                                                        > 6 km where the distance and time between the locations
(Gabriela Vigo and DJB unpublished data). In an effort to
                                                                        suggested that the bird would have had to move at a speed of >
determine if movement patterns by individual birds were
                                                                        50 km per hour to arrive at the second point. We used 6 km as a
consistent among years, two birds were retrapped at nests in
                                                                        cutoff because mean errors for our points were near 2 km ± 1.5
subsequent years and given new collars: Angeles (N=4 seasons)
                                                                        km; we used the 50 km per hour cutoff based on GPS transmitter
and Franz (N=2 seasons).
                                                                        data from our site indicating macaws normally travel at about 40
We fitted macaws with either North Star Science and Technology          km per hour during long distance flights (DJB unpublished data).
(32 g, 2008-2009, custom built model) or Telonics (37 g model
TAV-2627, 2009-2016) low power (250 mW) Argos platform                  We parsed our location data into two categories: breeding season
terminal transmitters (PTTs; heretofore referred to as “collars”,       and non-breeding season. Because breeding seasonality of
Boyd and Brightsmith 2013). This satellite-based system uses            parrots is highly variable among species and within species across
Doppler shifts in pulsed radio frequencies to locate transmitters       the range (Roth 1984, Brightsmith 2005), and because there was
anywhere in the world, eliminating the spatial bias inherent in         no previous information on seasonal movements of our
many VHF studies (Bridge et al. 2011). Both collars were of             populations, we were unable to provide a priori definitions for
similar design, having PTT electronics canisters attached via a         these seasons. Instead we did a post hoc examination of the data
narrow metal band around the bird’s neck, allowing the                  and found that most of the birds showed major seasonal shifts in
electronics canister to hang below the beak roughly at crop level.      ranges in March or April. These major seasonal shifts in ranges
An approximately 21 cm long antenna extended from the canister          all began with a single movement of > 10 km away from the
along the metal neck band to the back of the collar. The total          breeding range. As a result, we used an absolute displacement
transmitter mass of both models was about 3-4% of the total body        method (first movement >10 km from the breeding range) to
mass of the bird, as most study birds weighed slightly over 1 kg        define the end of the breeding season and the onset of migration
(Dunning 2008 and Brightsmith unpublished data). The two                (see Soriano‐Redondo et al. 2020 for more on methods of
collars had similar location accuracy (Boyd and Brightsmith             determining timing of migrations). We defined the start of the
2013). In the Telonics collars, neckbands were attached by              non-breeding season as the first locations following the first
screwing them into the body of the electronics canister using a         movement away from the breeding range and the end of the non-
screw and rustable washer. Rustable materials were used in the          breeding range when the individual returned to the breeding range
hopes that the collar would fall off in a year or more. To facilitate   for the last time in anticipation of breeding (late August ± 1
rusting, galvanized washers were soaking in dilute hydrochloric         month). For individuals that did not show seasonal movements
acid to remove the zinc.                                                we used the average beginning and end dates for the non-breeding
                                                                        season for that species to define the breeding and non-breeding
The objective of the study was to obtain ranging patterns during
                                                                        season. This was done to allow us to create comparable seasonal
the non-breeding season. For this reason, we programmed our
                                                                        ranges for comparing between migratory and non-migratory
collars to broadcast for a total of 6-8 hours during daylight hours,
                                                                        individuals.
every 3-6 days to spread the manufacturer’s estimated 400
transmission hours across the January to October period of              Home range calculation
minimum macaw abundance at our site. During broadcast, collars          We calculated individual macaw home ranges using 100%
transmitted once every minute. These transmissions were only            minimum convex polygons (MCPs) and 70% isopleth fixed kernel
received and processed when a satellite was overhead, and               density estimators (KDE, Warton 1989, Kie et al. 2010). We
satellites used the information from multiple transmissions to          calculated 50% and 70% isopleths but found that the 50% were
Avian Conservation and Ecology 16(1): 14
                                                                                                     http://www.ace-eco.org/vol16/iss1/art14/

small and fragmented and did not coalesce in to reasonable core        non-breeding seasons within each deployment, we used a paired
areas. Macaw use of the landscape showed clear temporal                t-test for normally distributed data and a Wilcoxon signed-rank
autocorrelation as the birds spent a great deal of time around         test for data that were not normally distributed. To determine if
their nests on most days and often moved sequentially through          the sections of the non-breeding 70% KDE ranges closer to the
the core area sections of their non-breeding ranges (Figures A2.1      nest received more distinct visits than such areas further from the
to A2.14). A preliminary analysis which suggested that individual      nests during the non-breeding season, we conducted two least
sections of the non-breeding core areas used by macaws averaged        square regression tests, one with log10(number of visits) and the
around 212 ± 188 km² (28 core area sections among the 11 home          other with log10(number of dates recorded) as independent
ranges analyzed) and that sequential locations (regardless of time     variables, with distance from the nest as independent variable and
difference) averaged about 4 ± 8 km apart. Given that macaws at        individual as a random factor.
our site are known to fly at speeds of around 40 km per hour (DJB
                                                                       The number of locations we obtained per day was constrained by
unpublished data from GPS telemetry collars), this suggests that
                                                                       our need to broadcast only 6 to 8 hours per day to make the limited
macaws could reach most points within a core area section within
                                                                       battery life last from January to October. This precluded us from
about 30 minutes. To reduce the effect of temporally
                                                                       calculating total daily movements (see Results: Daily movements
autocorrelated location data and to better calculate the 70% KDE
                                                                       for details on locations per day). However, given that there is little
range estimate, we used these results to exclude some of the
                                                                       published information on minimum movements by these species,
locations in our dataset: we omitted all sequential points
                                                                       we used our data to provide a rough minimum estimate of daily
separated by < 30 minutes and < 4 km. This method eliminated
                                                                       movement. Here we report an “index of daily movement”
locations collected within a short time span if individuals were
                                                                       calculated as the sum of the distances between subsequent
not moving around very much and eliminated 13% of the
                                                                       locations on the same day for the same individual. These
locations for Scarlet Macaws and 12% for Blue-and-yellow
                                                                       movements could only be calculated on days when individual
Macaws. We used all locations for the MCP ranges as these are
                                                                       birds had two or more locations. To test for differences in the
not impacted by temporal autocorrelation.
                                                                       maximum index of daily movement for individuals between
We calculated both MCP and KDE ranges for the breeding                 species, we used a Wilcoxon rank-sum test as data were not
season, non-breeding season, and annual home ranges for all            normally distributed. To determine if our index of daily
individual deployments. For birds tracked in multiple years, home      movement differed between the breeding and non-breeding
ranges were calculated for each deployment (i.e., each year the        season within species, we ran a least squares regression with daily
bird was collared). Both MCP and KDE ranges were calculated            movement index as the dependent variable, season as the
in the Geospatial Modeling Environment (Beyer 2012) using the          independent variable, and number of locations per day and bird
'genmcp' and 'kde' tools, respectively. We used MCPs to provide        as random effects. To determine if daily movement differed
conservative estimates of the total area covered by each marked        between species, we ran a similar least squares regression with
bird and total area covered by each species during our study. We       species as the independent variable. Since total daily movement
selected the 70% KDE isopleth to quantify the core areas use           index is greater with larger numbers of locations, we tested for
intensity by individual macaws for both annual and seasonal            differences in the mean number of locations per day between
ranges. We refer to these 70% KDE as core areas for the remainder      species using a Wilcoxon rank-sum test as locations per day were
of the paper. All KDE ranges were estimated for analysis periods       not normally distributed for Blue-and-yellow Macaws.
(breeding or non-breeding) with ≥ 30 locations.
                                                                       To determine if the number of dates on which the birds returned
                                                                       to and were recorded inside the breeding range during the non-
Data analysis
                                                                       breeding season varied between species we used a Wilcoxon rank-
We successfully tracked a total of 10 individual birds: 4 Blue-and-
                                                                       sum as data were not normally distributed. To test if the non-
yellow Macaws and 6 Scarlet Macaws. Of these, two Scarlet
                                                                       breeding ranges of the two species lay in different directions from
Macaws were tracked in more than one season resulting in a total
                                                                       their breeding ranges we calculated the azimuth from the nest to
of 14 deployments over 10 birds. For between season
                                                                       the furthest point in the non-breeding MCP range for Scarlet
comparisons, we analyzed data paired by individual at the level
                                                                       Macaws and the azimuth from the center of the breeding range
of deployments for each macaw species. However, for home range
                                                                       to the furthest point in the non-breeding MCP range for Blue-
comparisons between the two species we ran statistical analyses
                                                                       and-yellow Macaws. We compared the resulting azimuths using
at the level of the individual. For these analyses we calculated the
                                                                       a Wilcoxon rank-sum test as data did not follow a normal
average value across years for each parameter for the two
                                                                       distribution.
individuals that received deployments in multiple years and used
these averages in the analyses. This was done because our data         To test the intra-individual variability for Scarlet Macaw spatial
included repeated deployments on two individual Scarlet Macaws         use among years, we calculated the percent annual overlap in the
but did not have repeat deployments for Blue-and-yellow Macaws.        MCP home ranges between years for the individuals that were
                                                                       tracked during more than one year. This was calculated at the
Data were checked for normality using normal quantile plots. To        percentage of year 1 MCP that overlapped all subsequent year
test for differences in home range sizes between species, we used      ranges, the percent of the year 2 range that overlapped year 1
Wilcoxon rank-sum test with p-values generated using the 1-way         range and all subsequent year ranges etc. This resulted in 14
χ² approximation for data that were not normally distributed and       overlap values for each of the home range types for the repeat
t-tests assuming equal variance for normally distributed data. To      collared birds: Angeles (N = 4 years, N = 12 overlap values) and
test for differences between ranges used during the breeding and       Frans (N = 2 years, N = 2 overlap value). The percent overlap of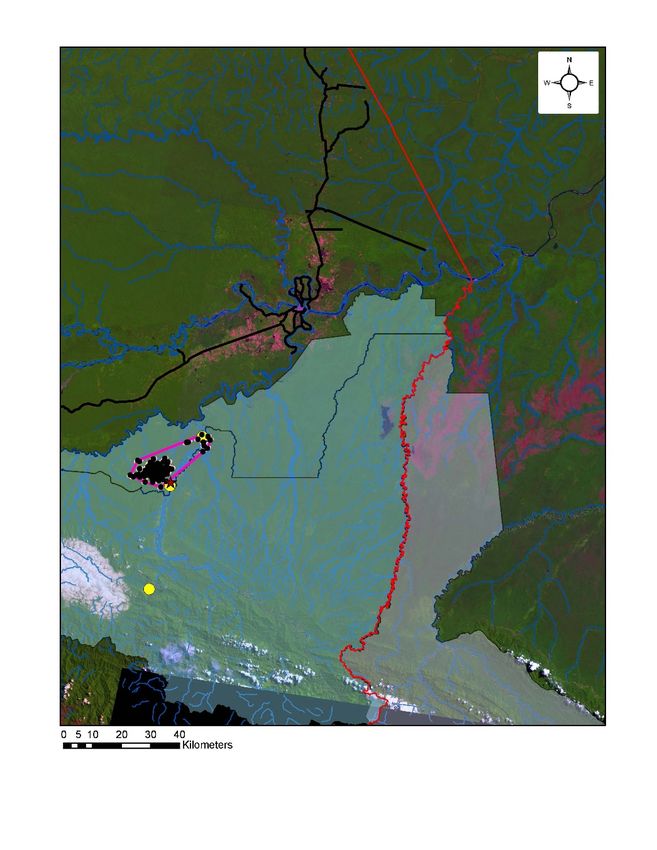
Avian Conservation and Ecology 16(1): 14
                                                                                                                  http://www.ace-eco.org/vol16/iss1/art14/

Table 1. Minimum convex polygon (MCP) home ranges for Scarlet Macaws (SCMA) and Blue-and-yellow Macaws (BYMA) in the
lowlands of southeastern Peru. “Year” shows the year in which the collar was deployed. Migratory = 1 denotes birds that showed a
major spatial shift between their breeding and non-breeding ranges. The “Annual” ranges span the entire time the collar was active
even though this was not always 12 months or more. All areas are given in km². The N for each is the number of locations included in
the calculations. The P values were calculated with a Wilcoxon rank-sum test between the two species. The average values for Angeles
and Franz were used in the calculation of individual based data for Scarlet Macaws.

                                                                Breeding                      Non-breeding                            Annual
Name          Year       Species       Migratory         Area              N               Area               N                Area                N
Angeles      2011       SCMA                1             158            180              3565               100              4953                280
Angeles      2012       SCMA                1             145             91              1968                76              2160                167
Angeles      2013       SCMA                1              94            180              5647               205              5647                385
Angeles      2016       SCMA                1              35            102               715               148               715                251
Ceiba        2012       SCMA                1              53             69              1576               150              1741                219
Franz        2012       SCMA                1             183            222               582               139               598                361
Franz        2013       SCMA                1              99             67              1761               143              1761                210
Hugo         2013       SCMA                1             181            170               703               182               729                359
DanyE        2009       SCMA                0             282            212               216               202               419                414
Wheezy       2009       SCMA                0             170             62                84               121               227                183
SCMA by deployment (Mean ± Stdev)                      140 ± 72     135 ± 63           1681 ± 1737         146 ± 41        1895 ± 1912          282 ± 90
SCMA by individual                                     156 ± 77       132 ± 58         1121 ± 1069         155 ± 31        1277 ± 1161          288 ± 86
Charming     2010       BYMA                1              37             71              2900               247              3143                318
Libertad     2008       BYMA                1             143            240              2377                97              2436                337
Tiny         2008       BYMA                1             134             40               453                47              1592                 87
Fuga         2009       BYMA                0             293             70               259                16               353                 86
BYMA (Mean ± Stdev)                                    151 ± 105    105 ± 90           1497 ± 1337        101 ± 102        1881 ± 1199         207 ± 139
Species comparison individuals (P value)                 0.9†            0.7‡             0.8‡               0.2‡             0.5‡                0.4‡
†
 P value calculated with t-test assuming equal variance for tests where values for both species followed normal distributions
 P value calculated with Wilcoxon rank-sum test with P values generated using the 1-way χ² approximation for data that were not normally distributed.
‡

all other pairs of home ranges for all other birds were also                     Home ranges and core areas
calculated (N = 5 birds, N = 20 overlap values). These percent                   MCP home ranges
overlap values were arcsine transformed to normalize the data
and tested using a two-sample t-test. No individual Blue-and-                    The entire area ranged over by our 10 macaws was 21,150 km²
yellow Macaws were tracked in multiple years so we could only                    (MCP home range for all 10 birds over 14 deployments). Scarlet
estimate intra-individual variability for Scarlet Macaws.                        Macaw annual MCP ranges were 1,227 ± 1161 km² (N = 6
                                                                                 individuals, Fig. 1). Blue-and-yellow Macaw annual MCP ranges
All statistical tests were conducted either in JMP pro v15.0.0 JMP               were 1,881 ± 1,199 km² (N = 4 individuals, Fig. 1). These average
(SAS Institute 2019) or in R using alpha = 0.05. Data are presented              annual range sizes for the two species did not differ significantly
as mean ± standard deviation unless otherwise noted.                             (Table 1).

RESULTS                                                                          In both the breeding and non-breeding seasons, the two macaw
We obtained 261 ± 106 locations per deployment on 70 ± 15                        species did not differ significantly in the size of the MCP home
distinct dates spanning 317 ± 61 days (N = 14 deployments) for                   ranges (Table 1). Breeding MCP home ranges for both species
a total of 3,657 usable locations and about 147 months of useful                 combined averaged 154 ± 84 km² (N = 10 individuals). During
data across six Scarlet and four Blue-and-yellow Macaws. (Table                  the non-breeding season, MCP home ranges for both species
A1.1).                                                                           combined averaged 1271 ± 1126 km² (N = 10 individuals).
                                                                                 Considering only migratory individuals, Scarlet Macaw non-
We identified two major movement patterns: birds that made large                 breeding MCP ranges (1606 ± 979 km², n = 4 individuals) did not
seasonal movements and those that did not. All three birds                       differ significantly in size from those of the Blue-and-yellow
captured at the clay lick and tracked in 2009 (two Scarlet Macaws                Macaw (1910 ± 1288 km², n = 3 individuals, Wilcoxon rank-sum:
and one Blue-and-yellow Macaw) had relatively small annual                       χ²= 0, df = 1, P = 1.0). For the birds of both species that migrated
MCP home ranges (227, 419 and 353 km² respectively, Table 1)                     during their deployments, the non-breeding ranges (2022 ± 1571
with little difference between breeding and non-breeding season                  km²) were almost 18 times larger than the breeding ranges (115
ranges (Table 1, Figures A2.1, A2.2). The remaining 7 birds of                   ± 55 km²) and this difference was highly significant (paired t-test:
both species (captured at nests and clay licks and tracked in all                t = 4.0, df = 10, P = 0.0025). The three birds from 2009 which did
other years) showed clear differences in size and location between               not migrate showed a different pattern: the breeding season ranges
their breeding and non-breeding season ranges. All of the Scarlet                (248 ± 68 km², N = 3) were slightly larger than the non-breeding
Macaws with known nests showed major range shifts but the                        ranges but the difference was not significant (186 ± 91 km², N =
breeding status of the Blue-and-yellow Macaws was unknown as                     3, Wilcoxon signed-rank: S = -3.0, P = 0.25).
they were all trapped at the clay lick.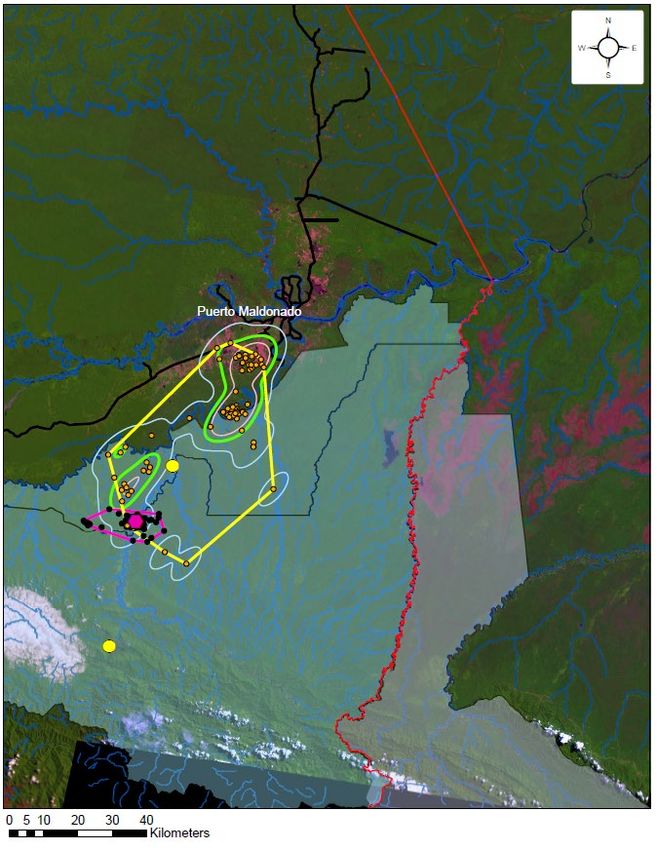
Avian Conservation and Ecology 16(1): 14
                                                                                                       http://www.ace-eco.org/vol16/iss1/art14/

                                                                        that did not migrate, the non-breeding core areas (107 ± 90 km²,
Fig. 1. Annual minimum convex polygon home ranges of                    N = 3) and the breeding season core areas (52 ± 47 km², N = 3)
Scarlet and Blue-and-yellow Macaws. Ranges are shown for 10             did not differ significantly (Paired t-test: t = 1.69, df = 2, P = 0.5).
Scarlet Macaw deployments (6 individuals) and 4 Blue-and-
yellow Macaws (1 deployment per individual). The protected              For five of the eight Scarlet Macaw deployments (3 individuals),
areas (Tambopata National Reserve, Bahuaja Sonene National              the non-breeding core areas (70% KDE) contained the nest but
Park, and Madidi National Park) are shown in light green.               for the other three deployments it did not (two individuals, Figures
Puerto Maldonado is the departmental capital and the largest            A2.3 to A2.10). For Angeles, the non-breeding core areas included
city in the area. All birds were trapped within a 1 km radius of        the nest in two deployments and did not include it in two
the Tambopata Research Center which is shown by the star.               deployments (Figures A2.3 to A2.4). Of the three Blue-and-
                                                                        yellow Macaws that showed seasonal movements, none had non-
                                                                        breeding cores area that included the center of the breeding range
                                                                        (Figures A2.12 to A2.14).
                                                                        Movements among core areas
                                                                        The non-breeding 70% KDE ranges for the Scarlet Macaws that
                                                                        migrated had 3.0 ± 0.5 disjunct sections (Figure A2.3 to A2.10),
                                                                        suggesting the birds used a variety of spatially distinct core areas
                                                                        during this season. Centers of the distinct core area sections
                                                                        averaged 44.5 ± 44.9 km from the nests (range = 3 to 151 km, N
                                                                        = 24 disjunct sections across 8 deployments on 4 birds).
                                                                        On average, core area sections further from the nest sites received
                                                                        less distinct visits than those that were closer to the nests (least
                                                                        squares regression on log10(number of visits): R² = 0.41, t ratio
                                                                        = -3.37, DF 21.3, P = 0.0028). For example, all core area sections
                                                                        over 70 km from the nest were visited only once, for an average
                                                                        of 23 ± 21 days (N = 6 distinct core areas). These results, along
                                                                        with the detailed movements of the individual birds (Figs. A2.1
                                                                        to A2.8), suggest that when Scarlet Macaws were far from the nest
                                                                        in the non-breeding season, they tended to remain in fairly small
                                                                        areas for a period of a few days to a few weeks. After leaving this
                                                                        small area, they would rarely return to it. Instead, they would
                                                                        move on to another relatively small area and stay there for a similar
                                                                        period of time. This pattern usually repeated until the birds
                                                                        returned to the breeding range.
                                                                        However, the total number of dates on which birds were recorded
                                                                        in different core area sections (an index of time spent in each
Core areas                                                              section) did not vary with distance from the nest (least squares
                                                                        regression on log10[number of dates in each core area]: R² = 0.01,
Breeding core areas (70% KDE ranges) for both species combined          t ratio = -1.51, DF 12.33, P = 0.16). This suggests that the total
averaged 111 ± 198 km² (N = 10 individuals, Table 2). Blue-and-         amount of time the birds spent in each core area was rather similar
yellow Macaw breeding core areas were almost five times larger          regardless of the distance from the nest. This pattern was
than those of Scarlet Macaws, but this difference was not               produced because, when macaws were near their nests during both
statistically significant (Table 2). When looking only at the Scarlet   the breeding and non-breeding season, they would repeatedly
Macaws which had active nests, the breeding season core areas           move among different areas visiting them frequently and visiting
averaged 54 ± 37 km² (N = 4 individuals).                               the same patch repeatedly on multiple different days.
During the non-breeding season, core areas for both species             These patterns of movement among core areas in the non-
combined averaged 334 ± 273 km² (N = 9 individuals, Table 2).           breeding season for Scarlet Macaws were not found for the three
Non-breeding core areas did not differ significantly between            migratory Blue-and-yellow Macaws, as all non-breeding core
species (Table 2). Considering only birds that migrated during          areas for Blue-and-yellow Macaws were visited only once or twice
their deployments, the difference between species for non-              regardless of distance from the breeding season range (Figure
breeding core areas was also not significant (Wilcoxon rank-sum:        A2.12 to A2.14).
χ² = 1.1, df = 1, P = 0.3).
For the birds that migrated during their deployments, the non-          Daily movements
breeding core areas (448 ± 264 km², N = 6 individuals) averaged         We recorded 3.6 ± 1.9 locations per day for each bird (N = 1008
three times larger than the breeding core areas (149 ± 256 km², N       days with ≥ 1 location), suggesting that our daily movement
= 6 individuals) and this difference was significant (Wilcoxon          indices captured only a fraction of total daily movement.
signed-rank: S = 10.5, P = 0.03). For the three birds from 2009         However, due to the paucity of movement data for these species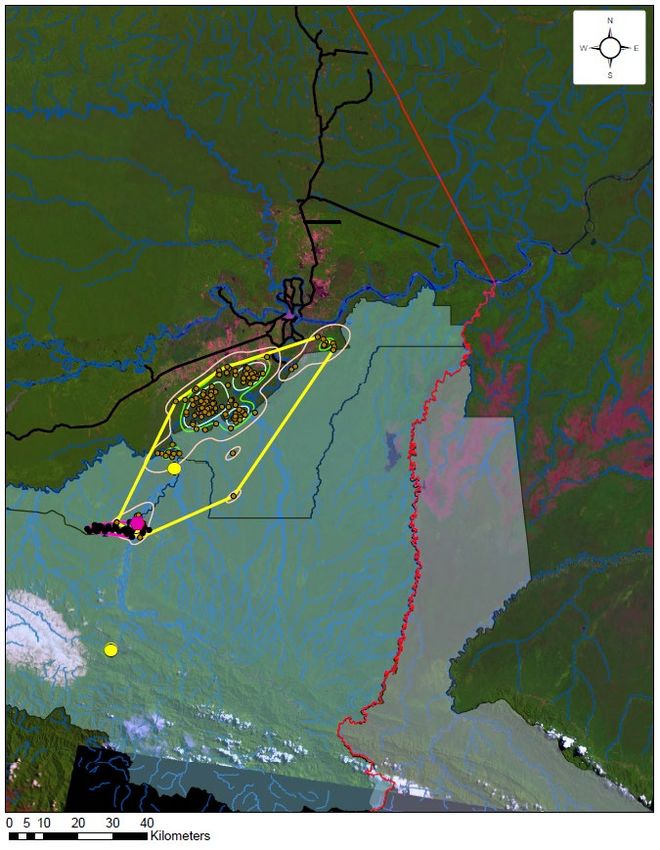
Avian Conservation and Ecology 16(1): 14
                                                                                                                      http://www.ace-eco.org/vol16/iss1/art14/

Table 2. Core area range sizes for Scarlet Macaws (SCMA) and Blue-and-yellow Macaws (BYMA) in the lowlands of southeastern
Peru. The ranges were calculated using 70% kernel density estimates. “Year” shows the year in which the collar was deployed. Migratory
= 1 denotes birds that showed a major spatial shift between their breeding and non-breeding ranges. All areas are given in km². The N
for each is the number of locations included in the calculations. This number is lower than the corresponding values for the MCP home
ranges (Table 1) because all locations within 30 minutes and 4 km were eliminated to reduce spatiotemporal autocorrelation (see
Methods for further discussion). The P values were calculated with a Wilcoxon rank-sum test comparing the two species. The average
values for Angeles and Franz were used in the calculation of individual based data for Scarlet Macaws.

                                                                                          Breeding                                  Non-breeding
Name                 Year            Species             Migratory              Area                    N                  Area                      N
Angeles           2011             SCMA                       1                    17                   160               1196                       82
Angeles           2012             SCMA                       1                   397                    84                506                       70
Angeles           2013             SCMA                       1                    14                   156               1311                      164
Angeles           2016             SCMA                       1                     7                    86                187                      117
Ceiba             2012             SCMA                       1                    36                    63                335                      134
Franz             2012             SCMA                       1                    55                   184                197                      123
Franz             2013             SCMA                       1                    28                    62                641                      122
Hugo              2013             SCMA                       1                    29                   150                258                      164
DanyE             2009             SCMA                       0                    17                   184                 95                      176
Wheezy            2009             SCMA                       0                    34                    50                 24                      105
SCMA by deployment (Mean ± Stdev)                                              63 ± 118              117 ± 53           475 ± 449                125 ± 35
SCMA by individual                                                              44 ± 33              115 ± 51           322 ± 277                135 ± 29
Charming          2010             BYMA                       1                    12                    66                143                      200
Libertad          2008             BYMA                       1                   668                   217                733                       85
                                                                                                                             †
Tiny              2008             BYMA                       1                    64                    37                                          44
Fuga              2009             BYMA                       0                   106                    68                202                       15
BYMA (Mean ± Stdev)                                                           212 ± 305               97 ± 81           359 ± 324                 86 ± 81
                                                                                      ‡                     ‡                  ‡                        ‡
Species comparison individuals (P value)                                          0.4                   0.7                1.0                      0.2
†
    Only 15 locations were logged for Tiny during the non-breeding season so this range was not calculated.
    P value calculated with Wilcoxon rank-sum test with P values generated using the 1-way χ² approximation as data were not normally distributed.
‡

we present a comparison of our daily movement indices between                      (N = 265 days with more than one location). Blue-and-yellow
seasons and species. The maximum daily movement indices we                         Macaws that migrated had an average daily movement index
recorded for individual Scarlet Macaws averaged 40.7 ± 22.1 km                     about half that of Scarlet Macaws during the non-breeding season
(range = 16.7 - 81.5 km, N = 6 individuals). The maximum daily                     (6.6 ± 4.0 km per day, N = 59 days with more than one location).
movement indices for Blue-and-yellow Macaws averaged 21.6                          This difference, while quite large, was not statistically significant
± 10.4 km (range = 13.8 - 36.7 km, N = 4 birds). Although the                      (least squares regression(with bird and number of locations as random effect), R²
maximum daily movements of the Scarlet Macaws was double                           = 0.21, F 1, 2 = 13.5, P = 0.1, N = 4 Scarlet individuals and N = 3
that of Blue-and-yellow, this difference was not statistically                     Blue-and-yellow individuals). The migratory individuals of both
significant (Wilcoxon rank-sum: χ² = 3, DF = 1, P = 0.13).                         species did not differ significantly in their daily movements during
However, the mean number of locations per day was significantly                    the breeding season (least squares regression, R² = 0.30, F 1, 5 =
greater for Scarlet Macaws (3.9 ± 1.8, N = 731 days with 2 ≥                       1.2, P = 0.58).
location) than for Blue-and-yellow Macaws (3.0 ± 1.9, N = 277
                                                                                   Exploratory flights
days with 1 ≥= location, Wilcoxon rank-sum: χ² = 91.8, DF = 1,
P < 0.0001).                                                                       On eleven different days, three different Scarlet Macaws and three
                                                                                   different Blue-and-yellow Macaws engaged in what appear to be
Our estimates of daily movements for Scarlet Macaws that
                                                                                   “exploratory flights” defined as days with movements > 5 km
migrated were significantly greater during the non-breeding
                                                                                   from the initial location, with the final location < 2 km from the
season (12.9 ± 10.0) than during the breeding season (8.9 ± 6.6)
                                                                                   initial location. On the days with exploratory flights, the birds
after accounting for the variation in number of locations per day
                                                                                   moved a total of 19 ± 8.7 km (N = 11, range 9.5 to 36.5 km).
and individual (Table 3). The two Scarlet Macaws from 2009 that
                                                                                   These flights were all during the non-breeding season. These
did not migrate during their deployments did not differ in their
                                                                                   flights could only be detected on days with at least three locations.
daily movements between seasons (Table 3). Unlike Scarlet
                                                                                   Of the 317 total days with at least three locations in the non-
Macaws, the estimates of daily movements for the three Blue-and-
                                                                                   breeding season, we recorded these presumed exploratory flights
yellow Macaws that migrated were not significantly greater during
                                                                                   on about 3.4% of these days. However, transmission covered only
the non-breeding season (Table 3). Surprisingly, the one Blue-and-
                                                                                   ~ 5 to 8 of the 12 hours of daylight each transmission day (< 65%
yellow Macaw from 2009 that did not migrate moved significantly
                                                                                   of the potential activity time). As a result, additional exploration
less during the non-breeding season than during the breeding
                                                                                   flights were likely missed and may have occurred on up to 5% of
season (Table 3).
                                                                                   days during the non-breeding season.
Scarlet Macaws that migrated had an average daily movement
index during the non-breeding season of 12.9 ± 9.9 km per day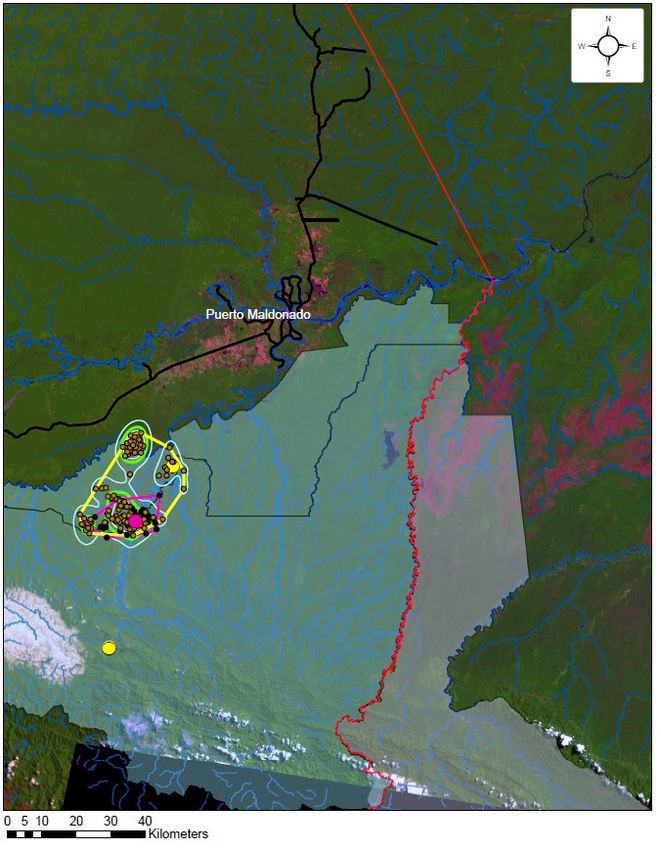
Avian Conservation and Ecology 16(1): 14
http://www.ace-eco.org/vol16/iss1/art14/
Table 3. Daily movement indices for Scarlet and Blue-and-yellow Macaws during the breeding and non-breeding seasons in southeastern
Peru. Data are presented separately for birds that migrated during their deployments and those from 2009 that did not migrate during
their deployments. Movement index (in km) is the distance moved between subsequent locations on the same day. Since we averaged
< 4 locations per day per bird, the movement index is not equivalent to total daily movement. As movements by individuals varied
greatly among deployments and we are analyzing for variations in movement within each year, data are analyzed at the level of
deployment. Statistical results in the final four columns were generated using a least squares regression with daily movement index as
the dependent variable, season as the dependent variable and deployment and number of locations as random effects. Data are presented
as mean ± standard deviation (N).
Breeding Non-breeding
2
Species Deployments Birds Daily Locations Daily Locations R F df (F) P
movement per day movement per day
index index
Scarlet Macaw
Migratory 6 4 8.9 ± 6.6 4.1 ± 1.8 12.9 ± 10 4.4 ± 1.6 0.19 18.7 2,412 0.4).
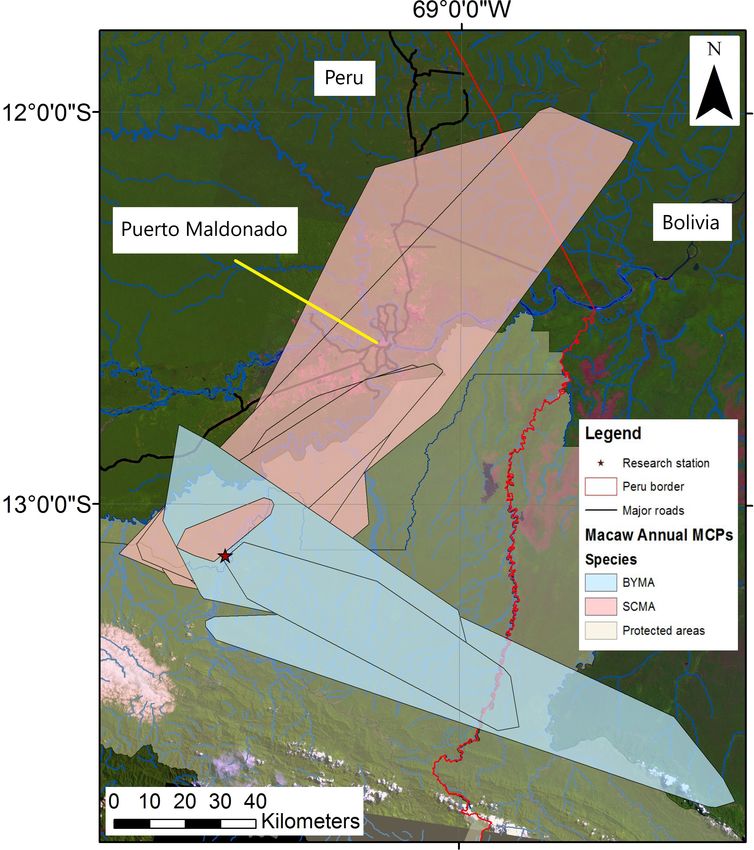
The Scarlet Macaws were first detected back in their breeding
ranges on 21 August ± 19 days (N = 8 deployments 4 individuals,
Fig. 2, Table A1.4). The Blue-and-yellow Macaws were first
detected in their breeding season ranges on average on the same The chicks of the breeding Scarlet Macaws fledged 8 March ± 11
date as the Scarlet Macaws (21 August ± 27 days, Table A1.4). days (N = 8 breeding attempts by 4 different individuals, Fig. 2,
The return to the breeding range was more temporally variable Table A1.2). The collared Scarlet Macaws departed their breeding
compared to the departures (Fig. 2). After returning to their ranges 25.3 ± 10.7 days after their chicks fledged (range 10 to 38
breeding season ranges, all remained in these ranges until their days, N = 8 deployments on 4 birds, Fig. 2, Table A1.2). All but
collars ceased functioning 98.9 ± 48.1 days later (range 28 to 165 one of the known breeding Scarlet Macaws (Ceiba, the only
days, N = 7 individuals, 11 deployments). known female collared) returned to our field site to breed again
in the year following deployment. On average the birds laid eggs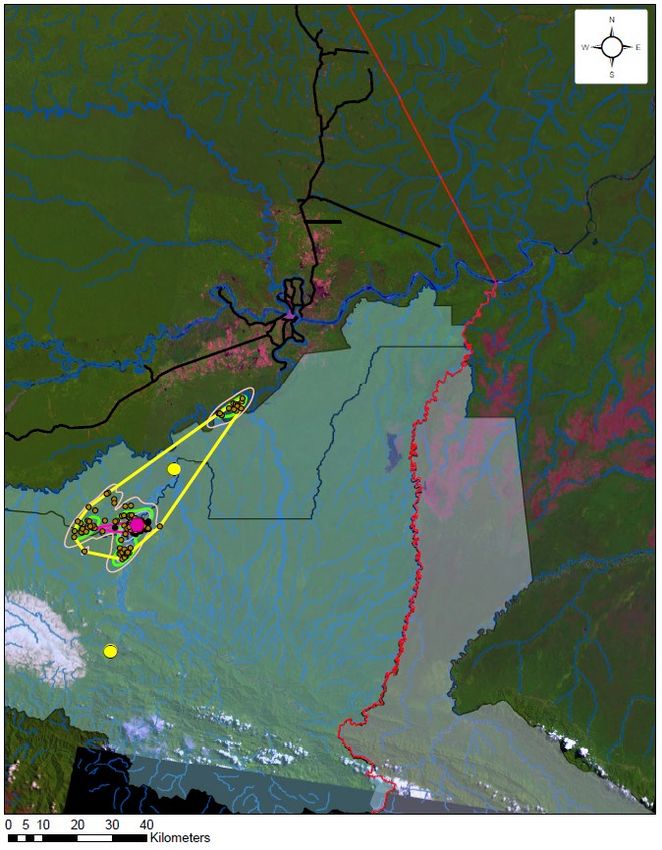
Avian Conservation and Ecology 16(1): 14
                                                                                                                    http://www.ace-eco.org/vol16/iss1/art14/

Table 4. Spatial use parameters in the breeding and non-breeding seasons for Scarlet and Blue-and-yellow Macaws marked with Argos
satellite transmitters in the lowlands of southeastern Peru from 2008 to 2016. Breeding season ended when the birds departed from
their breeding areas (First departure from breeding) and began again when birds returned to their breeding range for the last time. The
“Distance to first location outside breeding” is the distance from the nest (for Scarlet) or from the center of the breeding range (for
Blue-and-yellow) to the first location outside the breeding range. The Argos collars used did not broadcast every day or receive locations
on each broadcast day (see Table 1), so the “Days with locations” is the number of days where the system calculated usable locations
of the birds. During the non-breeding season, we present the number of dates on which birds were detected in the breeding area (Dates
detected back in breeding range). The “Distance from breeding range” was calculated as the distance of the bird from the nest (for
Scarlets) or from the center of the breeding season range (for Blue-and-yellows where nesting status was not known). The values for
the three non-migratory birds from 2009 are not included in this table, but their information is presented in Table A1.4. The “N” values
represent the total number of deployments used in calculations. The final three columns show the results of a Wilcoxon rank-sum test
(1-way χ² approximation) comparing the values for Scarlet and Blue-and-yellow macaws. Details of each individual bird are given in
Tables A1.2 and A1.4.

                                                                       Scarlet Macaw              Blue-and-yellow Macaw           Wilcoxon rank-sum tests
                                                                Mean        SD         N        Mean        SD          N          χ²        DF          P
Breeding season
 Duration in days                                                163        42         8         137       67           3         0.8       1           0.4
 Days with locations                                              32         9         8          27       14           3         0.3       1           0.6
 Last location in breeding range (date)                        29-Mar       5.4        8       27-Mar      40           3         0.7       1           0.4
 Distance to first location outside breeding (km)                 28        11         8          44       18           3         1.5       1           0.2
 Last return to breeding (date)                                21-Aug       18         8       21-Aug      26           3          0        1            1
                                                                                         ‡                      †                                †
 Last return (days before egg laying)                             88        27         7                Unknown                          Unknown
Non-breeding season
 First location                                                 2-Apr       5.2         8       2-Apr    42             3         0.67      1           0.4
                                                                                                              †                                  †
 First location non-breeding (days post fledge)                   25        11          8             Unknown                            Unknown
 Last location                                                 20-Aug       18          8      16-Aug    29             3         0.17      1           0.7
 Duration (days)                                                 140        22          8        136     72             3         0.2       1           0.9
 Days with locations                                              34        6.7         8         31     20             3         1.3       1          0.26
 Dates detected back in breeding range                            11        10          8        1.0     1.0            3         3.4       1          0.065
 Distance from breeding range
 Mean                                                            39         30          8         81         48         3          §         1,9         0.1
 Max                                                             79         53          8        112         51         3         1.8         1         0.18
†
 The breeding status of Blue-and-yellow Macaws was unknown.
‡
 One Scarlet Macaw did not return to nest the year after tracking but returned to breed the year after.
§
 The distance from the nesting range were tested with a least squares regression with the individual bird as a random effect. The resulting degrees of freedom
and P values are provided.

88 ± 27 days after returning to their breeding ranges (range 51 -                  Direction of seasonal movements
125 days, N = 7 deployments on 3 individual birds, Fig. 2, Table
                                                                                   The non-breeding ranges for all three Blue-and-yellow Macaws
A1.4).
                                                                                   were to the east-southeast of the breeding ranges (mean
Return visits to the breeding ranges                                               azimuthBlue-and-yellow = 114.8° ± 5.0°, range 110° to 120°, N = 3
                                                                                   birds, Figures 1, A2.12 to A2.14). This stood in stark contrast to
During the non-breeding season, the Scarlet Macaws with known
                                                                                   the Scarlet Macaws that expanded their ranges to the north-
nest sites returned to the area near the nest (within 7 km) on 9.8
                                                                                   northeast during the non-breeding season (mean azimuthScarlet =
± 6.3 days (range 3 to 18 days, N = 4 birds, Tables 4 and A1.2).
                                                                                   22.7° ± 31.0°, N = 4 individuals, Wilcoxon rank-sum: χ² = 4.50,
During the non-breeding season, only two of the three migrant
                                                                                   DF = 1, P = 0.03, Figures 1, A2.3 to A2.10).
Blue-and-yellow Macaws returned to within 7 km of the center
of the breeding range (Table A1.2) and overall they averaged only                  Intra-individual variation among years
1 ± 1 return during the non-breeding season (range 0 to 2, N=3
                                                                                   We obtained usable data for more than one season for two
birds, Tables 4 and A1.2). The difference in number of return visits
                                                                                   individual birds: Franz in 2012 and 2013 and Angeles in 2011,
between the species was significant (Wilcoxon rank-sum: χ² = 4.5,
                                                                                   2012, 2013, and 2016. Franz in 2013 used a total range (MCP)
DF = 1, P = 0.03). One of the returns to the breeding area by
                                                                                   and non-breeding core range three to five times larger than it did
Blue-and-yellow Macaws, was noteworthy due to the large
                                                                                   in 2012 (Tables 1 and 2). However, the 2013 breeding core area
distance traveled over the short time period: Charming was 146
                                                                                   was < 40% of the size of what it was in 2012. Angeles’ use of the
km from the center of its breeding area on 18 August, then
                                                                                   landscape was also very variable among years. The spatial overlap
recorded on 22 August within 3 km of the center of its breeding
                                                                                   in overall ranges among years (MCP) for Angeles was 55 ± 31%
home range, then recorded on 26 August in the same area where
                                                                                   (N =12 overlap values) which is very similar to the 57 ± 29% (N
it had been on 18 August, 146 km from the breeding range.
                                                                                   = 20) of overlap seen among different individuals (t-test on arcsine
                                                                                   transformed values, t = 0.23, df = 17.7, P = 0.8). Similarly, non-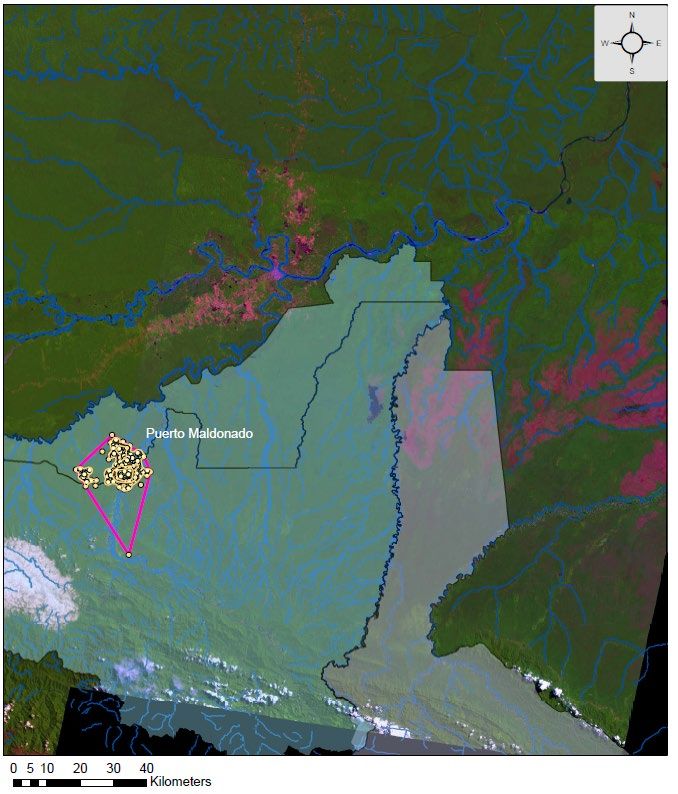
Avian Conservation and Ecology 16(1): 14
                                                                                                   http://www.ace-eco.org/vol16/iss1/art14/

breeding core area overlap among years for Angeles 21 ± 21% (N        of Blue-and-yellows lay to the east-southeast and 2) Scarlet
= 12) was similar to the 21 ± 23% (N = 20) from distinct birds (t-    Macaws returned to the breeding range more times during the
test on arcsine transformed values, t = 0.48, df = 23.5, P = 0.6).    non-breeding season. As a result of the similarity between these
Only the overlap of the breeding core areas (72 ± 28%, N = 12),       species, they are considered together throughout the majority of
which are concentrated around the nest, were greater for Angeles      the ensuing discussion.
among years than they were for distinct individuals (52 ± 29% N
= 20, t-test on arcsine transformed values, t = 1.76, df = 14.9, P    Home Ranges
= 0.05).                                                              As hypothesized, individuals of both species of macaws moved
                                                                      over areas of thousands of ha. In the only previous study of adult
Use of protected areas                                                Scarlet and Blue-and-yellow Macaws home ranges, Adamek’s
All birds were captured approximately 25 km from the edge of          (2011) non-breeding MCP ranges averaged 20 times larger for
the 1.36 million ha protected area complex that included the          Scarlet Macaws and over 45 times larger for Blue-and-yellow
Tambopata National Reserve and Bahuaja Sonene National Park           compared to breeding ranges. As in our study, Adamek found no
(SERNANP 2015). None of the macaws we collared of either              difference in range sizes between the two species. However, our
species left these protected areas during the breeding season.        satellite-derived ranges were about 6 times larger (breeding) and
Similarly, none of the macaws tracked in 2009 that did not migrate    1.6 to 4 times larger (non-breeding) than Adamek’s VHF-derived
(two Scarlet and one Blue-and-yellow) left the protected areas at     ranges. It is difficult to know how much of the difference was due
any time during their deployments.                                    to tracking methodology versus real biological differences, but
                                                                      Adamek (2011) states that birds were not always located, and
However, all of the remaining Scarlet Macaws and all but one of
                                                                      some crossed international boundaries, preventing her team from
the Blue-and-yellow Macaws that migrated, departed from the
                                                                      documenting the full range of movements.
protected areas during the non-breeding seasons. All Scarlet
Macaws that migrated had at least parts of their non-breeding         Other parrot home ranges
season core areas outside the protected areas (N = 4 birds, 8
                                                                      There have been relatively few telemetry-based home range
deployments). On average the migratory Scarlet Macaws spent 41
                                                                      studies of wild parrots, and those that exist have used a diversity
± 31% of the non-breeding season outside the protected areas
                                                                      of time periods and methods. This being said, the MCP home
(range 9 to 96%, N = 8 deployments, Figures A2.3 to A2.10). The
                                                                      ranges we found in our study (227 to 5,647 km²) are one or more
use of protected areas by Blue-and-yellow Macaws was slightly
                                                                      orders of magnitude larger than most parrot MCP ranges
more complex, as one bird (Tiny) crossed out of Peru and spent
                                                                      reported to date (Lindsey et al. 1991, Robinet et al. 2003, Salinas-
part of the breeding season in Madidi National Park in Bolivia
                                                                      Melgoza 2003, Stahala 2008, Meyer 2010, Adamek 2011, Salinas-
(total size 1.9 million ha) which abuts Bahuaja-Sonene National
                                                                      Melgoza et al. 2013). However our large range sizes are not
Park (Fig. A2.12). In total, two of three migratory Blue-and-
                                                                      unprecedented: Northern Mealy Parrots (Amazona guatemalae)
yellow Macaws had non-breeding season core areas outside of
                                                                      from Tikal, Guatemala covered about 10,000 km² including areas
protected areas. On average, these migratory Blue-and-yellows
                                                                      > 200 km from their nests (Bjork 2004). In addition, other tropical
spent 39 ± 50% of the non-breeding season outside of the
                                                                      frugivores annually move hundreds of kilometers across multiple
protected areas (range 0 to 96%, N = 3 birds, Figures A2.12 to
                                                                      life zones (Holbrook et al. 2002, Powell and Bjork 2004).
A2.14).
                                                                      Daily movements
DISCUSSION                                                            The small number of locations generated per day prevented us
As hypothesized, both macaw species had very large home ranges:       from effectively quantifying the macaws’ daily movements.
the maximum movements by individuals from the point of capture        However, we confirmed that these macaws were able to move at
ranged from 15 to 164 km and individuals covered areas of ~227        least 20 to 40 km per day. We also recorded one individual flying
to ~5600 km². Our results show that Scarlet Macaw and Blue-           back and forth from its nest during the non-breeding season,
and-yellow Macaw movement patterns were overall very similar.         covering nearly 300 km in 8 days or less. Given that large macaws
Home range sizes did not differ between these two similarly sized     can fly at speeds of 40 km per hour (DJB unpublished data) the
congeners. Maximum daily movements and daily movements                actual daily movement values for both species of macaws are likely
during the breeding season were also similar. For migratory           very much higher than what we report here.
individuals, both species showed abrupt transitions from the
breeding range to the non-breeding range with single movements        Exploratory flights
of over 10 km and both departed from the breeding range and           Long distance movements on single days are difficult to detect
returned to the breeding range on the same day on average. These      with traditional VHF telemetry. However, Argos and GIS
similarities in breeding home range size and movements may be         telemetry have provided new insights into daily movements of
because both species have relatively high dietary overlap during      many types of birds (García-Ripollés et al. 2011, Wheat et al.
the breeding season (Adamek 2011, Lee et al. 2014) and both may       2017, McDuie et al. 2019, Rakowski et al. 2019). We found that
respond in similar ways to the seasonal drop in food supplies at      our macaw species made long, looping, exploratory flights of 10
the end of breeding (Brightsmith et al. 2018, Carrara et al. 2019).   to 40 km that ended near the starting point on 3% to 5% of the
                                                                      days during the non-breeding season. These exploratory flights
Of all the parameters tested in this work, only two differed          differ from major migration movements because in exploratory
significantly between the species: 1) Scarlet non-breeding ranges     flights the birds fly long distances but return to areas near where
lay mostly to the north-northeast of the breeding ranges and those    they started. Exploratory flights have been recorded using GPS
You can also read