Airborne and ground-based measurements of aerosol optical depth of freshly emitted anthropogenic plumes in the Athabasca Oil Sands Region - Recent
←
→
Page content transcription
If your browser does not render page correctly, please read the page content below
Atmos. Chem. Phys., 21, 10671–10687, 2021
https://doi.org/10.5194/acp-21-10671-2021
© Author(s) 2021. This work is distributed under
the Creative Commons Attribution 4.0 License.

Airborne and ground-based measurements of aerosol optical depth
of freshly emitted anthropogenic plumes in the Athabasca
Oil Sands Region
Konstantin Baibakov1,a , Samuel LeBlanc2,3 , Keyvan Ranjbar4 , Norman T. O’Neill4 , Mengistu Wolde1 ,
Jens Redemann5 , Kristina Pistone2,3 , Shao-Meng Li6,7 , John Liggio6 , Katherine Hayden6 , Tak W. Chan8 ,
Michael J. Wheeler6 , Leonid Nichman1 , Connor Flynn5 , and Roy Johnson3
1 FlightResearch Laboratory, National Research Council Canada, Ottawa, Canada
2 Bay Area Environmental Research Institute, Moffett Field, CA, USA
3 NASA Ames Research Center, Moffett Field, CA, USA
4 Dépt. de géomatique appliquée, Centre d’Applications et de Recherches en Télédétection, Université de Sherbrooke,

Sherbrooke, QC, Canada
5 School of Meteorology, University of Oklahoma, Norman, OK, USA
6 Air Quality Process Research Section, Environment and Climate Change Canada, Toronto, ON, Canada
7 College of Environmental Science and Engineering, Peking University, Beijing, 100871 China
8 Climate Chemistry Measurement and Research, Climate Research Division, Environment and Climate Change Canada,

ON, Canada
a now at: Canadian Space Agency, Saint-Hubert, Canada

Correspondence: Konstantin Baibakov (konstantin.baibakov@canada.ca)

Received: 25 November 2020 – Discussion started: 21 December 2020
Revised: 30 April 2021 – Accepted: 7 June 2021 – Published: 14 July 2021

Abstract. In this work we report the airborne aerosol opti-       instrument. The average 4STAR out-of-plume (background)
cal depth (AOD) from measurements within freshly emitted          AODs deviated only marginally from AERONET daily aver-
anthropogenic plumes arising from mining and processing           aged values. While 4STAR AOD peaks were generally well
operations in the Athabasca Oil Sands Region (AOSR) in            correlated in time with peaks in the in situ-measured parti-
the context of ground-based AERONET climatological daily          cle concentrations, we show that differences in particle size
averaged AODs at Fort McMurray (Alberta, Canada). Dur-            are the dominant factor in determining the 4STAR-derived
ing two flights on 9 and 18 June 2018, the NASA airborne          AOD. During the two flights of 24 June and 5 July 2018 when
4STAR (Spectrometers for Sky-Scanning, Sun-Tracking At-           plumes likely travelled distances of 60 km or more, the aver-
mospheric Research) Sun photometer registered high fine-          age 4STAR FM AOD increased by 0.01–0.02 over ∼ 50 km
mode (FM, < 1 µm) in-plume AODs of up to 0.4 and 0.9, re-         of downwind particle evolution, which was supported by the
spectively, in the vicinity of the plume source (< 20 km). Par-   increases in layer AODs calculated from the in situ extinc-
ticle composition shows that the plumes were associated with      tion measurements. Based on these observations as well as
elevated concentrations of sulfates and ammonium. These           the increases in organic mass, we attribute the observed AOD
high AODs significantly exceed climatological averages for        increase, at least in part, to secondary organic aerosol forma-
June and were not captured by the nearby AERONET instru-          tion. The in-plume and out-of-plume AODs for this second
ment (mean daily AODs of 0.10±0.01 and 0.07±0.02, max-            pair of flights, in contrast to clear differences in in situ opti-
imum AOD of 0.12) due possibly to horizontal inhomogene-          cal and other measurements, were practically indistinguish-
ity of the plumes, plume dilution and winds which in certain      able and compared favourably to AERONET within 0.01–
cases were carrying the plume away from the ground-based          0.02 AOD. This means that AERONET was generally suc-

Published by Copernicus Publications on behalf of the European Geosciences Union.
10672                                          K. Baibakov et al.: Aerosol optical depth measurements of oil sands plumes

cessful in capturing the background AODs, but missed some           The estimation of aerosol radiative impact requires knowl-
of the spatially constrained high-AOD plumes with sources        edge of key aerosol properties. One of the most important
as close as 30–50 km, which is important to note since the       of these properties is the aerosol optical depth (AOD) (e.g.,
AERONET measurements are generally thought to be rep-            Kahn, 2012), defined as the total vertical column of aerosol
resentative of the regional AOD loading. The fact that in-       extinction (the combined capacity of aerosol particles to scat-
dustrial plumes can be associated with significantly higher      ter and absorb light). The mid-visible AOD (typically re-
AODs in the vicinity of the emission sources than previously     ported at wavelengths between 440 and 550 nm) can vary sig-
reported from AERONET can potentially have an effect on          nificantly from less than 0.1 for rural sites with background
estimating the AOSR radiative impact.                            aerosols to more than 3 for aerosol plumes from intense for-
                                                                 est fires, dust storms or volcanic eruptions. Model analysis
                                                                 suggests that 95 % of global AOD at 440 nm, however, is be-
                                                                 low 0.4 (Andrews et al., 2017). AOD measured from or near
1   Introduction
                                                                 ground level is commonly retrieved using passive Sun pho-
Atmospheric aerosols play an important role in the Earth’s       tometry. A Sun photometer measures AOD in several spec-
climate. Depending on their properties (such as size, com-       tral channels and can yield an estimation of particle abun-
position and concentration) and climatological factors (such     dance as well as aerosol size indicators (effective radius (reff )
as ambient radiative energy budget and surface albedo),          of submicron (“fine mode”, FM) and supermicron (“coarse
aerosols can either cool the surface by reflecting sunlight      mode”, CM) modes for example) from the spectral informa-
back to space or have a net warming effect by directly ab-       tion (O’Neill et al., 2003). There are currently two Cimel CE-
sorbing this shortwave radiation (e.g. Kaufman et al., 2002;     318 ground-based Sun photometers operating in the AOSR
Anderson et al., 2003a; Charlson et al., 2005). Aerosols         as part of the global AERONET Sun photometer network:
can also affect cloud properties by modifying droplet size,      one near Fort McMurray (56.8◦ N, 111.5◦ W, operating since
cloud lifetime and cloud burn-off rates (Ackerman et al.,        2005) and one near Fort McKay (57.2◦ N, 111.6◦ W, operat-
2000; Wilcox, 2010; McComiskey and Feingold, 2012). De-          ing since 2013).
spite recent progress, aerosols, together with clouds, re-          The analysis of local AOD climatologies, including that
main the greatest source of uncertainty in climate models        of AOSR, serves as a basis for a global aerosol climatology
(Boucher et al., 2013). This is in part due to the complexity    and is essential for validating satellite retrievals (Toledano
of aerosol-generating processes (natural and anthropogenic),     et al., 2007; Sioris et al., 2017b). Sioris et al. (2017a) an-
and aerosol transport mechanisms resulting in particles of       alyzed AOD data records for several Canadian AERONET
various size, concentration, chemical composition and mix-       stations, including Fort McMurray, in the context of ground-
ing state that ultimately determine aerosol radiative impact.    based particulate matter (PM2.5 ) concentrations and pre-
A recent work by Matus et al. (2019), based on the multi-        sented annual climatologies for both the FM and CM AODs.
sensor A-train observations, estimates that the global mean      They found that Fort McMurray FM AODs (at 500 nm) are
aerosol direct radiative effect is −2.40 W m−2 with anthro-      generally < 0.1 for September–April and < 0.2 for May–
pogenic direct radiative forcing accounting for 21 %.            August. The summer-time AOD increase was attributed to
   The Athabasca Oil Sands Region (AOSR) in Alberta,             forest fires plumes, and no significant trends in the long-
Canada, is home to the third-largest oil deposit in the world    term AOD record were observed. In addition to ground-based
(behind Venezuela and Saudi Arabia) with an estimated            measurements, Shinozuka et al. (2011) reported on AOD
164.1 billion barrels of recoverable crude oil (as of Decem-     measurements acquired on board the NASA P-3 aircraft us-
ber 2018; see NRCAN, 2020). In addition to the emissions of      ing the AATS-14 Sun photometer (AOD from 14 wavelength
anthropogenic pollutant and greenhouse gases (e.g., Charp-       bands in the 354–2139 nm range) in the vicinity of Fort Mc-
entier and Bergerson, 2009; Bytnerowicz et al., 2010; Baray      Murray in June and July 2008. While the AATS-14 mea-
et al., 2018; Liggio et al., 2019) the AOSR generates a sub-     sured AOD499 values that frequently exceeded 1 and at times
stantial amount of aerosols, either directly as sulfate, black   reached 4, the study was entirely focused on biomass burn-
carbon (BC), primary organic aerosol (POA) and dust (e.g.,       ing aerosols from local forest fires and did not include mea-
Landis et al., 2017; Cheng et al., 2018), or from secondary      surements of the oil sands industrial plumes. Indeed, most
atmospheric processes. In fact, Liggio et al. (2016) showed      airborne studies have predominantly focussed on either nat-
that the AOSR is a large source of secondary organic aerosol     urally produced aerosols (such as forest fires or dust events)
(SOA, formed through gas-to-particle conversion) with for-       and/or significantly aged plumes that have been transported
mation rates comparable to major metropolitan areas. Under-      for hundreds or thousands of kilometers (Heald et al., 2006;
standing the radiative impact of anthropogenically produced      Chin et al., 2007; Stone et al., 2010). While multiple stud-
aerosols in the AOSR through better characterization of their    ies have described cases of extreme pollution in China (e.g.,
radiative properties is therefore of significant importance.     Gu et al., 2018; Qin et al., 2018; Sun et al., 2018) signifi-
                                                                 cantly less attention has been given to AOD values from iso-
                                                                 lated industrialized sources outside of Asia. Given that the

Atmos. Chem. Phys., 21, 10671–10687, 2021                                         https://doi.org/10.5194/acp-21-10671-2021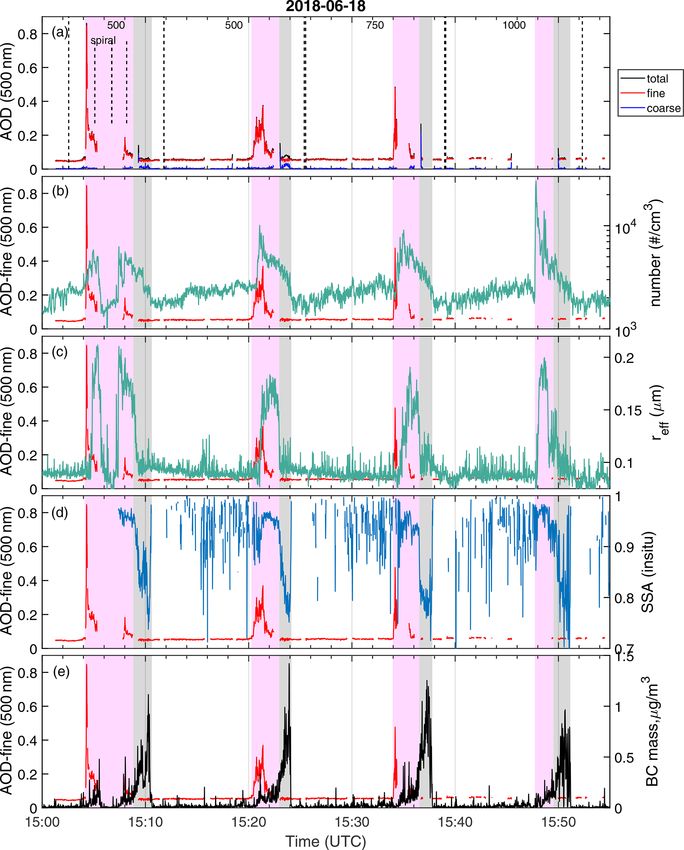
K. Baibakov et al.: Aerosol optical depth measurements of oil sands plumes 10673
anthropogenic plumes in the AOSR, far from large urban re- characterize pollution emissions from individual oil sands
gions, are nearly entirely attributed to a singular industry, the processing facilities, while screen flights were conducted to
obtained airborne AOD measurements can be used to eval- study the evolution of the pollutants transported away from
uate the representativeness of AERONET measurements in the source. Each box/screen started at 500 ft a.g.l. (∼ 152 m)
the context of industrial emissions. This is especially relevant or more, until reaching the top of the boundary layer typ-
to the AOSR, where secondary aerosol formation is likely ically resulting in 3–6 altitude levels. The transformation
to occur away from source areas and associated AERONET flights were conducted as a Lagrangian experiment designed
sites. to intercept the same plume at increasing distances from the
In the spring–summer of 2018, the NASA 4STAR Sun source perpendicular to the wind direction. The measure-
photometer (Spectrometers for Sky-Scanning, Sun-Tracking ments presented here were obtained during the second phase
Atmospheric Research; Dunagan et al., 2013; Shinozuka et of the campaign between 30 May and 5 July 2018.
al., 2013; Pistone et al., 2019; LeBlanc et al., 2020) was in-
tegrated on the National Research Council (NRC) Convair- 2.2 Sun photometry measurements
580 aircraft, as part of a state-of-the-art suite of in situ and
remote sensing instruments. The NASA 4STAR acquired air- 2.2.1 AERONET and CIMEL CE-318
borne hyperspectral AOD data during the Oil Sands Mea-
The Cimel CE-318 used at Fort McMurray and Fort McKay
surement Campaign of 2018 (OSMC) and represented the
are standard ground-based Sun photometers which are part
first airborne Sun photometer deployment to study industrial
of the global AERONET Sun photometer network (Holben
pollutant plumes from the Alberta oil sands mining and up-
et al., 1998). The CE-318 takes measurements of the direct
grading operations.
solar irradiance, at nominal sampling intervals of 3 min in
In the current work, based on four OSMC flights, we eval-
eight spectral bands (340, 380, 440, 500, 675, 870, 1020 and
uate whether the existing ground-based AERONET measure-
1670 nm) from which spectral AODs can be calculated. For
ments capture the full extent of AOD variations in the AOSR
more information about the AERONET and CIMEL CE318
by comparing the 4STAR AODs of anthropogenic plumes
the reader is referred to Giles et al. (2019). In this work we
from mining and processing operations with AERONET cli-
used AERONET Level 2 (cloud-screened and quality con-
matological and diurnal AODs. In addition, we investigate
trolled) Version 3 data.
how the AOD evolves as a function of distance downwind
of the plume source, in order to better understand the poten-
2.2.2 4STAR (Spectrometers for Sky-Scanning
tial effect of secondary aerosol production, i.e. whether the
Sun-Tracking Atmospheric Research)
AOD increases as new particles are being formed – a phe-
nomenon that would be missed by a fixed ground-based in- The NASA 4STAR instrument combines airborne Sun track-
strument located near the source. Finally, we consider how ing and sky scanning with diffraction spectroscopy. It is com-
the 4STAR FM and CM AODs relate to other in situ mea- prised of a movable optical head that protrudes through the
surements such as particle size, optical absorption and scat- top of the aircraft fuselage, an accompanying instrument
tering coefficients, and particle chemical composition. The rack inside the aircraft and optical cables that connect the
latter analysis provides additional insight into the observed two (Fig. S1 in the Supplement). The hyperspectral mea-
AOD variations and ensures that the 4STAR measurements surements are obtained with two Zeiss spectrometers result-
are physically consistent with other instruments. ing in a total of 1556 spectral channels between 210 and
1703 nm with sampling resolution of 0.2–1 nm below 1000
and 3–6 nm at longer wavelengths. The nominal calibration
2 Instrumentation and data processing accuracy of AOD measurements from 4STAR is dependent
on wavelength, time of day, tracking stability and various
2.1 Oil Sands Measurement Campaign (OSMC) corrections (such as removal of light absorption by trace
gases). This accuracy is typically near 1 % in transmittance,
The Oil Sands Measurement Campaign 2018 (OSMC2018, for wavelengths outside gas absorption bands between 355
hereafter referred to as OSMC) was a follow-up to the and 1650 nm, resulting in an AOD uncertainty of 0.01 when
OSMC2013 campaign, where the Convair-580 aircraft was the Sun is at zenith. A more detailed technical description of
deployed to the oil sands region for the first time (see for the 4STAR can be found in Dunagan et al. (2013) and Shi-
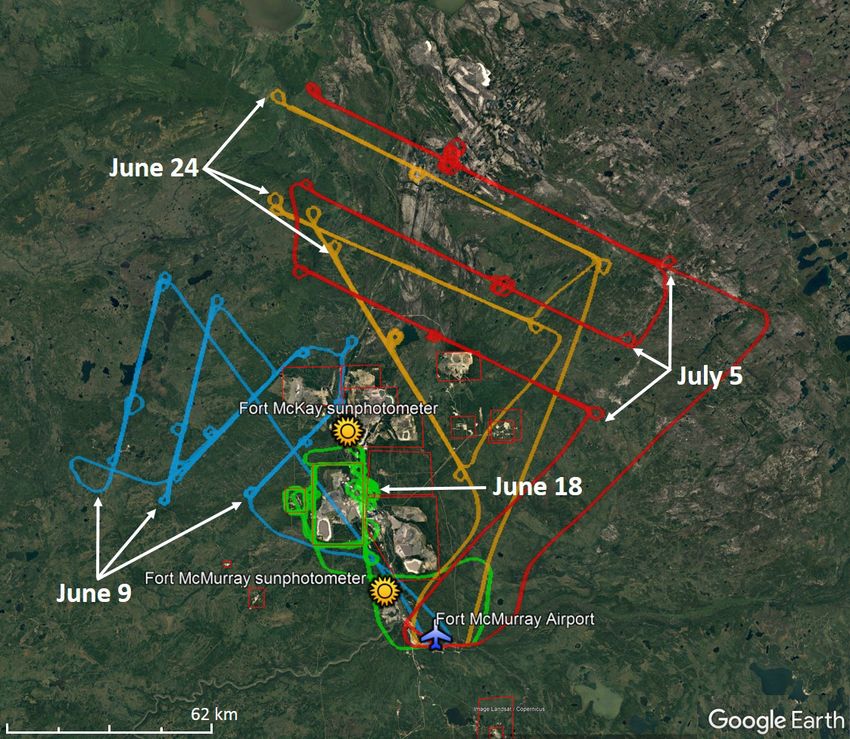
example Liggio et al., 2016; Li et al., 2017). Figure 1 shows nozuka et al. (2013).
the location of the AOSR facilities overlaid on recent satellite
imagery. Two types of flights performed during the OSMC 2.2.3 Spectral Deconvolution Algorithm
focused on (i) pollutant emissions and (ii) their transforma-
tion (i.e., chemical evolution/aging) using “box” (latitude– We applied the Spectral Deconvolution Algorithm (SDA;
longitude grid) and “screen” (vertical grid) flight patterns, O’Neill et al., 2003) in order to separate the total mea-
respectively. Box flights encompassed an entire facility to sured AOD into its fine- (submicron) and coarse-mode (su-
https://doi.org/10.5194/acp-21-10671-2021 Atmos. Chem. Phys., 21, 10671–10687, 2021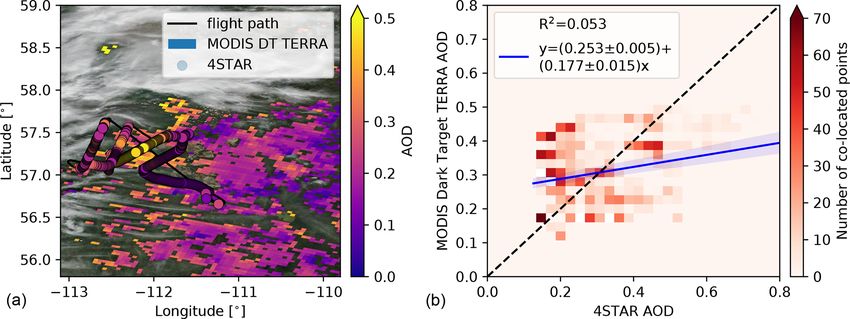
10674                                           K. Baibakov et al.: Aerosol optical depth measurements of oil sands plumes

Figure 1. Selected flight tracks during the Oil Sands Measurement Campaign. Also shown are locations of AOSR facilities (red outlined
boxes) and Fort McMurray and Fort McKay AERONET stations overlaid on satellite imagery (image source: Landsat/Copernicus as used by
© Google Earth).

permicron) components (τf and τc or FM and CM). While                2.2.4    4STAR data filtering and cloud screening
AERONET uses 380, 440, 500, 675 and 870 nm channels
as standard inputs to SDA, using the 380 nm channel in the           In this work we have eliminated all 4STAR measurements
4STAR analysis was not possible because of its unrealisti-           with a low (raw count) signal-to-noise ratio and ignored
cally high values (thought to be due to stray light at that          measurements when the aircraft was not in a straight-level
wavelength) aggravated by high relative humidity within the          track (i.e. when turning or engaged in a spiral). Moreover,
spectrometer enclosure. Reducing the number of channels to           in addition to eliminating improbable data (for AOSR) with
four is thought to produce results commensurate with the             AOD500 > 3, we have used the SDA as a spectral cloud-
standard AERONET wavelength set with RMS differences                 screening where the FM AOD is thought to be free of coarse-
in retrieved τf of less than 0.01 (O’Neill et al., 2008). We         mode contamination by either clouds or dust (e.g., O’Neill et
expect that, in most cases, the anthropogenically produced           al., 2016).
aerosols observed in the AOSR are submicron, since coarse-
mode aerosols are usually associated with natural sources            2.3     In situ measurements
(e.g., winds lifting up dust particles). Consequently, with the
exception of dust aerosols resulting from surface mining, the        Ambient air was drawn through a forward-facing, shrouded
coarse-mode dominant AODs in the AOSR will usually be                isokinetic particle inlet (Droplet Measurement Technolo-
associated with clouds. As will be shown below, the CM               gies, Boulder, CO, USA). The fine-mode particle size (ra-
AODs associated with dust in the AOSR are small (< 0.05)             dius ranging from 30 to 500 nm) was measured using a
and can easily be distinguished from cloud-dominated events          DMT Ultra-High-Sensitivity Aerosol Spectrometer (UH-
that are associated with significantly higher AODs and larger        SAS), which employs light scattering techniques to derive
variations over short periods of time.                               particle concentrations and size distributions (Cai et al.,
                                                                     2008; Kupc et al., 2018). The UHSAS sizing was calibrated
                                                                     using NIST traceable polystyrene latex (PSL) nanospheres.
                                                                     Sizing of the UHSAS is dependent on the refractive index
                                                                     and shape of the particles. Differences in refractive index

Atmos. Chem. Phys., 21, 10671–10687, 2021                                            https://doi.org/10.5194/acp-21-10671-2021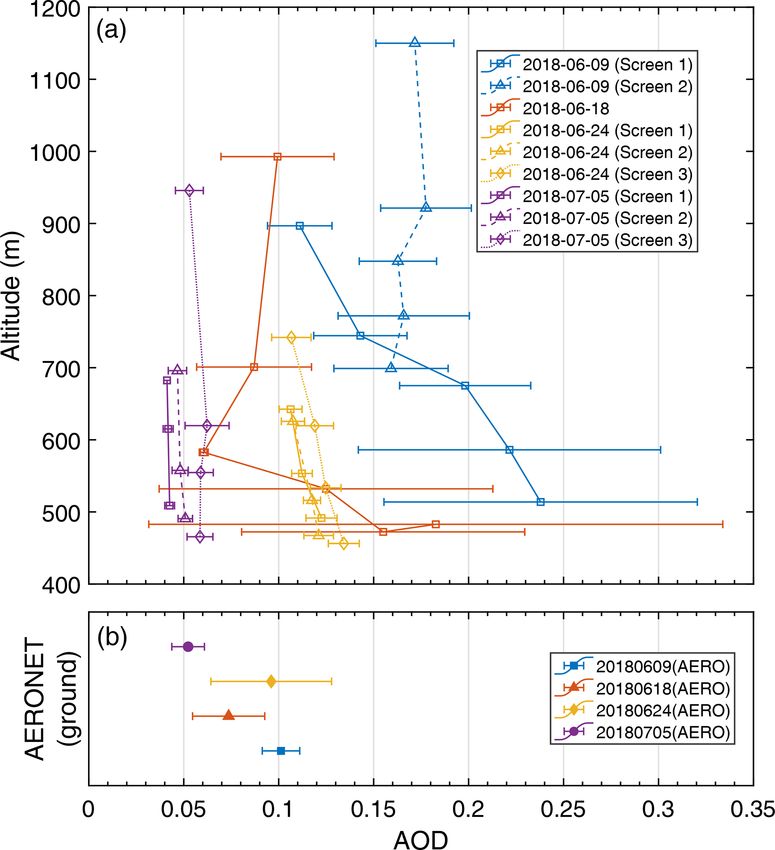
K. Baibakov et al.: Aerosol optical depth measurements of oil sands plumes                                                10675

have been estimated to result in a 10 % uncertainty in the          3     Results and discussion
sizing of the UHSAS (Kupc et al., 2018). For some flights
we noticed abnormally high particle counts in five bins be-         3.1    AERONET AOD climatology
tween the radius of 0.382 and 0.428 µm. This peak was not
supported by other particle spectrometers on the aircraft and       Understanding seasonal AOD variations from the ground-
is likely an instrument artefact. We removed the problematic        based Fort McMurray instrument is useful for the interpre-
data from further analysis and suspect that the issue is related    tation of the airborne measurements. While this analysis is
to the uncertainties in the UHSAS calibration curve consist-        required to evaluate whether the AERONET measurements
ing of several individually chosen gains. The UHSAS effec-          capture the full extent of AOD variations in the AOSR, un-
tive radius (reff ), defined as an area weighted mean radius of     derstanding climatological AODs also provides context for
the aerosol particles, was estimated using                          the 4STAR OSMC measurements acquired mostly during a
        R∞ 3                                                        single month of June 2018. Sioris et al. (2017a) discussed
           r n (r) dr                                               some of the Fort McMurray AOD statistics; however, their
reff = R0∞ 2            ,                                    (1)
         0 r n (r) dr
                                                                    analysis ends in 2015. We have extended the analysis to 2018
                                                                    in order to include the period leading up to and coincident
where r is the particle radius and n(r) is the particle size dis-   with the OSMC.
tribution (i.e., number of particles per cubic centimeter hav-         Figure 2 shows that the total AODs at Fort McMurray
ing a radius in the range r and r +dr µm). The particle in situ     are relatively low with values typically less than 0.1 except
scattering and absorption coefficients were measured using          for summer months (May–August) when monthly averaged
the TSI 3563 nephelometer and Continuous Light Absorp-              AODs can exceed 0.2. There are clear seasonal trends in
tion Photometer (CLAP), respectively. The TSI 3563 mea-             both the FM and CM AODs. The summer-time FM AOD
sures the light scattered by aerosols ultimately yielding the       increase is thought to be predominantly associated with for-
aerosol total scattering coefficient at 450, 550 and 700 nm         est fires that frequently occur in the region (Sioris et al.,
(Anderson et al., 1996; Bodhaine et al., 1991) while CLAP,          2017a). For example, the second highest monthly AOD on
developed by the National Oceanic and Atmospheric Admin-            record of 0.45 occurred during May 2016 when intense for-
istration (NOAA), measures light absorption of particles de-        est fires had a major impact on air quality and resulted in
posited on 47 mm diameter, glass-fiber filters at 467, 529 and      the evacuation of more than 80 000 people (Landis et al.,
653 nm (Ogren et al., 2017, and reference therein). Aerosol         2018). The highest hourly and daily averaged AODs dur-
single scattering albedo (SSA) values were estimated us-            ing that month were 2.10 and 1.80, respectively. Figure S2
ing the ratio of the light scattering coefficient to the sum of     in the Supplement shows monthly averaged AOD time se-
the light absorption and scattering coefficients. Black carbon      ries for 2005–2018 at Fort McMurray with daily averaged
(BC or soot) mass was measured using the DMT Single Par-            values shown in pink shading. Also, included for reference
ticle Soot Photometer (SP2) based on the laser-induced in-          is a fine-mode AOD time series for nearby Fort McKay;
candescence between approximately 100 and 600 nm (e.g.,             however, the present discussion focuses on Fort McMurray
Schwarz et al., 2006). Finally, non-refractory particle com-        because of its significantly longer measurement record and
position (ammonium, nitrate, sulfate and organics) was mea-         data availability during OSMC. In many cases, on days with
sured with a High-Resolution Time-of-Flight Aerosol Mass            persistently high AOD values (e.g., FM AOD > 0.5) forest
Spectrometer (HR-ToF-AMS; Aerodyne Research Inc., De-               fire smoke plumes were clearly discernable in the vicinity of
Carlo et al., 2006). The AMS was operated in V mode with            Fort McMurray from satellite imagery (not shown). In com-
10 s time resolution. Ionization efficiency calibrations were       parison, the highest FM monthly AOD average during the
performed using monodisperse ammonium nitrate particles             non-summer months (September–April) – considered to be
prior to, during and after the study with a resulting < 15 %        primarily impacted by industrial pollution plumes in the ab-
variation. The AMS collection efficiency, ranging from 0.5          sence of other major aerosol sources – was 0.13 with 96 % of
to 1.0, was derived by comparing the total AMS mass with            all hourly measurements being lower than that value.
the mass derived from the UHSAS size distributions assum-              With respect to the coarse mode, the peak monthly aver-
ing a density consistent with the AMS chemical composi-             aged AOD of 0.04 is associated with the month of April and
tion. Background measurements were taken from filtered              is thought to be due to dust particles. Landis et al. (2017)
ambient air approximately 4–5 times per flight. Detection           demonstrated through systematic chemical analysis of sum-
limits, taken from 3 times the standard deviation of the av-        mertime CM aerosol from ground-based measurements that
erage of filtered time periods, were determined to be 0.122,        a majority of dust is due to local surface mining activities
0.024, 0.021, and 0.260 µg m−3 for NH4 , SO4 , NO3 and or-          where heavy machinery (trucks and excavators) lift signifi-
ganics, respectively.                                               cant amounts of dust into the air, although long-range trans-
                                                                    port of Asian dust may be more prominent in the spring (e.g.,
                                                                    McKendry et al., 2007; AboEl-Fetouh et al., 2020). AboEl-
                                                                    Fetouh et al. (2020) argued, for example, that a springtime

https://doi.org/10.5194/acp-21-10671-2021                                          Atmos. Chem. Phys., 21, 10671–10687, 2021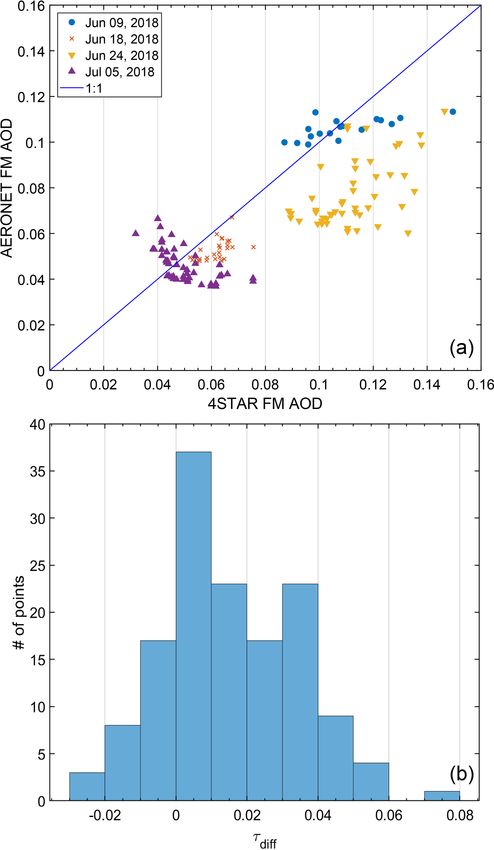
10676 K. Baibakov et al.: Aerosol optical depth measurements of oil sands plumes
Figure 2. Monthly fine- (red) and coarse-mode (blue) AOD averages for the Fort McMurray AERONET station. The dashed line shows
the June 2018 mean total AOD. The error bars represent standard deviations of the (total) monthly mean AODs. The bottom graph shows
the mean number of days associated with each monthly binned average. These statistics are for AERONET V3, level 2.0, extinction AODs
averaged over the data range from 2005 to 2018 inclusively.
coarse-mode event was continental in scale (including the of the emitted plumes and the associated secondary organic
North American and European Arctic) and that it was asso- aerosol production.
ciated with (relatively small) coarse-mode particles around
1.3 µm in radius. 3.2.1 Case study of 9 June 2018
Figure 2 also indicates that the mean total AOD during
June 2018 was 0.13 ± 0.05 suggesting that the aerosol load- On 9 June, the Convair-580 conducted a transformation flight
ing during the OSMC was generally representative of the cli- to the west of the oil sands facilities. The aircraft flew 4
matological AOD values for June (0.15 AOD). screens perpendicular to the wind direction intercepting the
emitted plumes from the majority of the largest surface min-
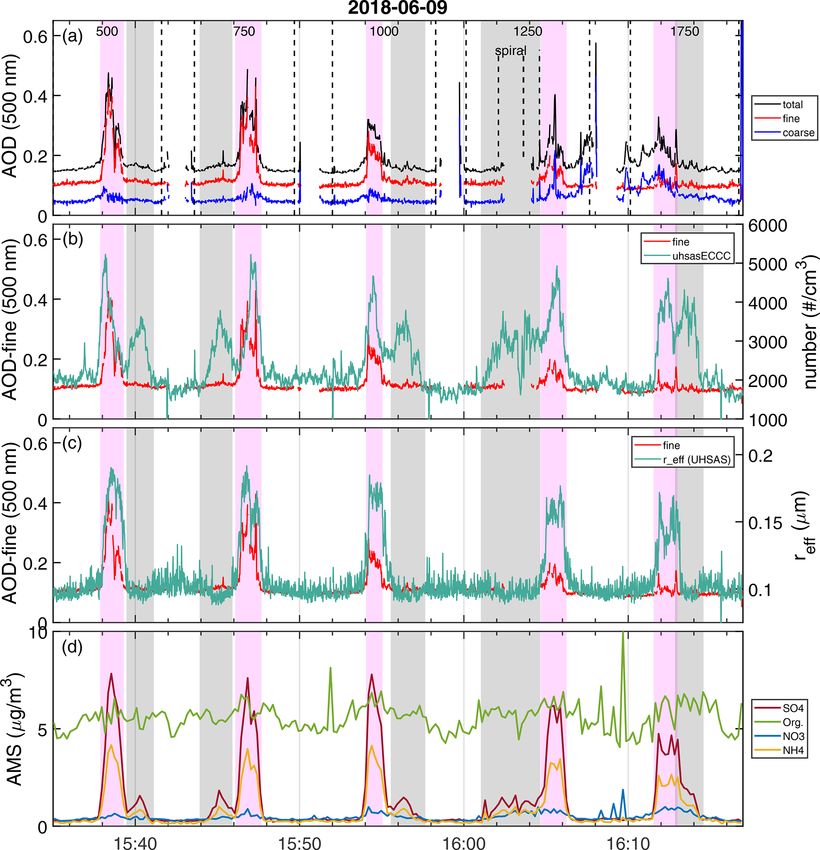
3.2 4STAR case studies during OSMC ing facilities (Fig. 1). Figure 3 shows the AOD time series
and corresponding in situ measurements for the relatively
cloud-free screen 1, with five nominal altitude levels and “in-
In this section, based on the OSMC flights of 9 and 18 June, plume” and “out-of-plume” periods separated based on ele-
we discuss how the 4STAR AOD variations associated with vated values relative to the upwind (background) measure-
the AOSR emitted plumes relate to the corresponding aircraft ments. While the average fine-mode AODs were ∼ 0.10 out-
in situ measurements. While direct comparisons between the side of the plume, the values were greater than 0.4 within
4STAR column-based AODs and flight-level in situ aerosol the plume. Moreover, the two consistent peaks at each al-
properties are not strictly possible, evaluating the AOD mea- titude level in the UHSAS total particle number concentra-
surements in the context of time-synchronous in situ mea- tion (Fig. 3b) suggest that the Convair-580 was intercepting
surements provides insight into the nature of the plume and two spatially separated plumes where only one is associated
the associated AOD variations (e.g., Stone et al., 2010; Shi- with a significant AOD response. Particle composition data
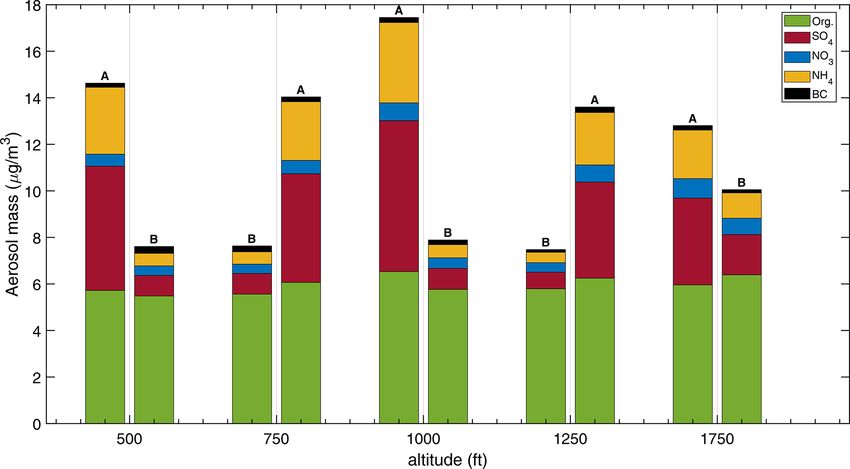
nozuka et al., 2013; Pistone et al., 2019). In particular, under- (Figs. 3d and 4) show that the first plume (plume “A”, de-
standing how changes in aerosol intensive properties such as tected by the 4STAR and shaded in pink) contained signif-
particle size and chemical composition might affect the AOD icantly more SO4 and NH4 than the second plume (plume
response is necessary to evaluate the radiative importance “B”, shaded in grey) indicating that the two plumes likely
Atmos. Chem. Phys., 21, 10671–10687, 2021 https://doi.org/10.5194/acp-21-10671-2021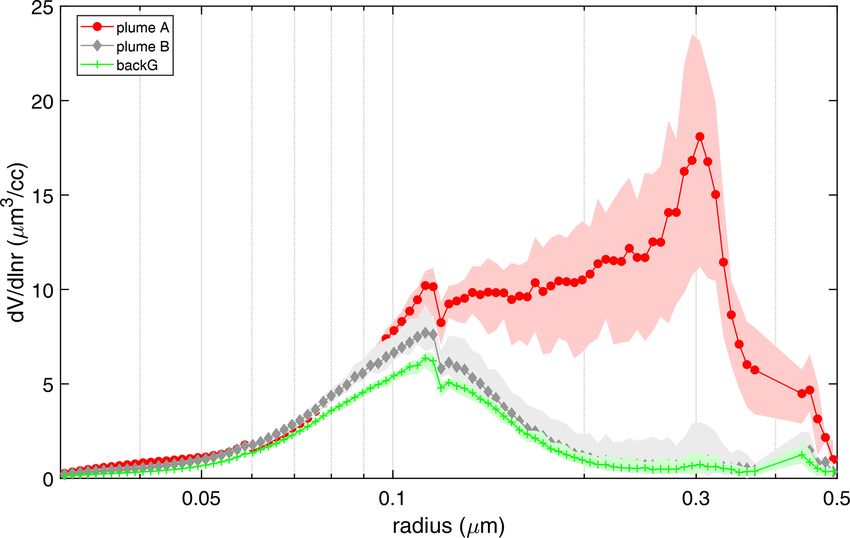
K. Baibakov et al.: Aerosol optical depth measurements of oil sands plumes                                                   10677

originated from different facilities. The organic aerosol mass,    crude Mildred Lake as a plume source). This evolved to a
however, was comparable between the two plumes and sim-            width of ∼ 31 km for the last screen, at a further distance of
ilar to the background level. Figures 3c and 5 show a clear        ∼ 70 km from emissions, although the plume boundaries are
distinction in particle effective radius and volume size dis-      harder to identify amid a smaller difference with background
tribution between plumes A and B in that the latter lacks          values. This is related to the dilution of aerosol over a broader
optically significant contribution from larger FM particles.       volume, potentially reducing AOD for any one column, but
The difference is especially pronounced, both in comparison        also to a (marginally) larger increase in AOD due to SOA for-
to plume B and out-of-plume (background) values, for par-          mation (the last screen was heavily contaminated by clouds
ticle radii (rp ) larger than ∼ 0.12 µm with the largest differ-   resulting in practically no useable AOD data). The AOD vari-
ences observed at rp = 0.3 µm. The relative differences be-        ations in this plume can be compared to previous observa-
tween plumes A and B continue to persist for screen two,           tions in the boreal region as reported by Shinozuka and Re-
approximately 20 km downwind (not shown), but the con-             demann (2011), which showed that for the Canadian local
centration of large FM particles larger than ∼ 0.12 µm for         emissions from forest fires, variations of near 20 % were ob-
plume A was significantly lower (by a factor of 2 or more          served at length scales of 20 to 35.2 km. The aerosol from
relative to screen one) as the plume disperses and some of the     long-range transport showed variation of less than 5 % (Shi-
larger particles settle out of the atmosphere. Based on wind       nozuka and Redemann, 2011). For the OSMC plumes ob-
patterns, the plumes on 9 June come mostly from the Syn-           served here, a relative change in AOD of about 20 % was ob-
crude Mildred Lake (SML) and/or Suncor Millenium facil-            served at distances on a distance scale of 50 km, but only for
ities which perform a number of different processes related        a subset of the flights (5 July and 24 and 18 June, example of
to bitumen extraction. The majority of emissions come ei-          which showing differences between AERONET and 4STAR
ther from upgrading the bitumen (and in the process emitting       AOD as a function of distance; Fig. S5 in the Supplement).
SO2 and SO4 ), mining processes including from big trucks          The differences in length scales of the aerosol plumes are
digging and transporting materials, and other unknown pro-         indicative of both the industrial processes and the meteoro-
cesses within the plant itself. The two plumes (A and B)           logical conditions and seem to be different than the plumes
mostly represent emissions and subsequent transformation of        from biomass burning in the boreal forest.
pollutants from the upgrading (high SO4 concentrations) but
can also contain contributions from mining and tailing ponds.      3.2.2   Case study of 18 June 2018
We expect that these two plumes may mix with each other at
times.                                                             During the 18 June emissions flight around the SML fa-
   The 9 June aerosol plume from the oil sands process-            cility, there was a significant and clearly visible industrial
ing could be observed in the MODIS satellite imagery, in           plume emanating from the SML stacks (Fig. S3 in the Sup-
between the often-prevalent cloud conditions (see Fig. 6a).        plement). Figure 7 shows the corresponding data for the first
The aerosol plume was being advected towards the north-            three altitude levels: 500, 750 and 1000 ft (∼ 152, ∼ 229 and
west, with the background aerosol loading in between clouds,       ∼ 305 m) with the 500 ft track repeated twice. The 4STAR
mostly with AODs below 0.1. The 4STAR-sampled aerosol              measurements show that for the duration of the Syncrude
plume was observable in the satellite imagery, with AOD500         box the total AOD at 500 nm was relatively low and stable
exceeding 0.5. For this case, there are only very limited col-     around 0.05–0.07, with AOD spikes of up to 0.86 associated
located AOD measurements simultaneously acquired with              with the plume on the eastern side of the box. As in the case
MODIS and 4STAR. In Fig. 6b all pixels that were mea-              of 9 June, the measurements show that the plume was het-
sured by MODIS (within 3 km of the flight track) and 4STAR         erogeneous with two distinct regions identified in Fig. 7 in
(within 3 h of Terra overpass) are compared. The differences       pink (plume “A”) and grey (“plume “B”). Plume A is charac-
between the 4STAR measurements (N = 2510) and the av-              terized by a significant response in fine-mode AOD and in-
erage nearest MODIS pixel show that much of the higher             creased (up to a factor of 2) UHSAS effective radius. Plume
AOD observed by 4STAR (above 0.5) in the middle of the             A is also associated with high values of SSA440 (up to 0.96,
plume is not captured by MODIS (with a maximum AOD of              Fig. 7d), indicating that the particles were mostly of a scat-
0.5), and that there is an overestimate at the lower end of the    tering nature. In contrast, the SSA values dip below 0.75 in
4STAR-observed AODs. When considering only the nearest             plume B suggesting a much stronger presence of absorbing
30 min of the MODIS overpass, the cloud-free observations          particles. This hypothesis is confirmed by the enhanced con-
by 4STAR (N = 327) are not centered on the optically thick-        centrations of highly absorptive BC particles (Fig. 7e), with
est part of the plume but show MODIS overestimating the            BC mass increasing during certain times by more than a fac-
AOD by an average of 0.1 (up to a maximum overestimate             tor of 10 relative to plume A. Similarly to 9 June, plume A
by 0.25) for the 4STAR AODs at 0.2.                                contains significantly higher concentrations of SO4 and NH4
   Based on the 4STAR and in situ data, the aerosol plume          than plume B (not shown). It should be noted that the AOD
was ∼ 19 km wide (spanning plumes A and B) for the first           peaks precede most of the plume A in situ peaks, which we
screen (at a distance of emissions of ∼ 20 km, assuming Syn-       attribute to the 4STAR viewing geometry in relation to the

https://doi.org/10.5194/acp-21-10671-2021                                        Atmos. Chem. Phys., 21, 10671–10687, 2021
10678                                                 K. Baibakov et al.: Aerosol optical depth measurements of oil sands plumes

Figure 3. Screen 1 time series on 9 June (UTC). (a) total, fine-mode and coarse-mode AODs at 500 nm derived from the SDA of the 4STAR
data; (b) UHSAS total particle number concentration (all sizes), number per cubic centimeter; (c) UHSAS effective radius, µm; (d) AMS
particle composition. In (a), the dashed vertical lines delineate each altitude level with nominal (planned) altitudes listed in ft a.g.l. at the top.
The fine-mode AOD is reproduced on several plots to facilitate the comparisons. The pink and grey rectangles represent periods associated
with plumes “A” and “B”, respectively.

vertical extent of the plume (i.e. the relative position of the              3.3    4STAR-AERONET comparisons
Sun, the plume and the aircraft carrying the 4STAR). Plume
B contains fewer of the larger FM particles and goes mostly                  The inherent assumption of using the AERONET data is that
undetected by 4STAR. At the same time, plume B contains                      it is representative of the regional AOD within a certain dis-
higher concentrations of CM particles from surface mining                    tance from the ground-based station. While this distance is
(not shown), but the resulting CM AOD (for example, around                   often taken as 100 km, the spatial representation will ulti-
15:22) is < 0.03, which is significantly smaller than the FM                 mately depend on the local context including proximity to
AODs (all times in this paper refer to UTC).                                 aerosol sources and meteorology (Anderson et al., 2003b;
   For both flights, 9 and 18 June, the analysis indicates that              Holben et al., 2018). Consequently, in this section we inves-
differences in particle size within plumes are the driving fac-              tigate the representativeness of Fort McMurray AERONET
tor responsible for the AOD response. As a consequence,                      measurements of AOSR AODs by studying how the in-
while certain sections of the plume (e.g., plume B) are clearly              flight AOD variations compare to climatological and diurnal
associated with elevated in situ particle and gas concentra-                 ground-based AODs.
tions, they have little effect on AOD when particulates are                      Figure 8 and Table 1 show AOD vertical profiles and AOD
small (in this case rp < 120 nm).                                            statistics for three transformation flights (9 and 24 June and
                                                                             5 July) and one emission flight (18 June) during the OSMC.
                                                                             For 9 June we only included data from screen 1 and 2, beyond
                                                                             which the measurements were judged to be contaminated by

Atmos. Chem. Phys., 21, 10671–10687, 2021                                                       https://doi.org/10.5194/acp-21-10671-2021
K. Baibakov et al.: Aerosol optical depth measurements of oil sands plumes 10679 Figure 4. Particle chemical composition for plumes A and B during screen 1 of the 9 June transformation flight. Figure 5. Averaged UHSAS volume PSDs during screen 1 on 9 June. Colour patches represent variations with altitude while solid lines show the screen-averaged PSDs for plumes A and B as well as the background (out-of-plume) signal. clouds. The in-plume data were selected based on significant ing forest fires plume with AODs > 0.4 in the later part of increases in the 4STAR, UHSAS, nephelometer and CLAP the day. Removing those data after 18:13 (∼ 27 % of points) signals relative to the background (out of plume) levels. The changes the daily average for 24 June from 0.13 ± 0.08 to examples of the defined “in-plume” time periods are shown 0.10 ± 0.03. in Figs. 3 and 7. While each screen was usually performed On 9 (screen 1) and 18 June (“high-AOD flights”) the at fixed nominal altitudes (e.g., 500, 750 ft a.g.l.), the terrain plumes were sampled in the direct vicinity of the source. variations result in slightly different altitudes above sea level Consequently, the 9 and 18 June cases were associated with when compared screen to screen. Figure 8b also shows fine- particularly high AODs and show relatively large variations mode AERONET daily means and standard deviations for in terms of the vertical distribution and AOD variability the corresponding dates. It should be noted that on 24 June within the plume. These large AODs and corresponding vari- the AERONET data were significantly affected by the incom- ations significantly exceed climatological AODs for June and https://doi.org/10.5194/acp-21-10671-2021 Atmos. Chem. Phys., 21, 10671–10687, 2021
10680                                                     K. Baibakov et al.: Aerosol optical depth measurements of oil sands plumes

Figure 6. Comparison of AOD measured by 4STAR and retrieved by MODIS Dark Target (DT, MOD04_3K; Levy et al., 2015) for 9 June
2018. (a) The aerosol scene is overlaid on the true-colour imagery from MODIS TERRA, with the colour bar showing the AOD sampled by
MODIS DT (in rectangular pixels) and 4STAR (circles put along the flight track of the NRC Convair-580). (b) The pixel-by-pixel comparison
of the MODIS DT AOD and 4STAR AOD, with a best fit line in blue, and 95 % confidence intervals of the fit line in blue shading.

Table 1. FM AOD statistics for selected flights during the OSMC (mean ± SD). 4STAR in-plume and out-of-plume statistics are reported for
the lowest flight level.

                      Date (flight no.)             4STAR           4STAR                  4STAR    AERONET          AERONET
                                                  in-plume        in-plume           out-of-plume   daily average    daily max
                                                    average      maximum                  average
                      9 June (F14)
                      Screen 1                0.24 ± 0.08                0.43         0.11 ± 0.00
                                                                                                    0.10 ± 0.01      0.12
                      Screen 2                0.16 ± 0.03                0.23         0.11 ± 0.01
                      18 June (F19)           0.18 ± 0.15                0.85         0.05 ± 0.00   0.07 ± 0.02      0.12
                      24 June (F24)
                      Screen 1                0.12 ± 0.01                0.15         0.13 ± 0.01
                                                                                                    0.13 ± 0.08      0.37
                      Screen 2                0.12 ± 0.01                0.14         0.11 ± 0.01
                                                                                                    0.10 ± 0.03∗     0.18∗
                      Screen 3                0.13 ± 0.01                0.15         0.12 ± 0.00
                      5 July (F30)
                      Screen 1                0.04 ± 0.00                0.05         0.04 ± 0.00
                      Screen 2                0.05 ± 0.00                0.06         0.05 ± 0.01   0.05 ± 0.01      0.08
                      Screen 3                0.06 ± 0.01                0.07         0.05 ± 0.01
                    ∗ With data from forest fire plumes excluded (∼ 27 % of data).

are clearly not captured by AERONET. However, the aver-                                constrained high-AOD plumes with sources as close as 30–
age 4STAR out-of-plume (background) AODs deviate only                                  50 km.
marginally from AERONET daily averaged values (Table 1).                                  It is not clear what kind of agreement would be consid-
During the 24 June and 5 July flights (“low-AOD flights”),                             ered as reasonable between 4STAR and AERONET given
the plumes in general travelled longer distances than during                           the differences in spatial sampling between the two plat-
the high-AOD flights before being measured by the Convair-                             forms. While several studies have reported agreements down
580 and hence had more time to mix and disperse. The in-                               to RMS differences of 0.01 for wavelengths between 500
plume and out-of-plume AODs for these dates were indis-                                and 1020 nm (Stone et al., 2010; Shinozuka et al., 2013;
tinguishable (in contrast to clear differences in in situ mea-                         LeBlanc et al., 2020), those comparisons often involve aged
surements, not shown) and the airborne and ground-based                                plumes that are likely to be more (horizontally) homoge-
averages compared favourably within 0.01–0.02 AOD. In                                  neous than newly emitted AOSR plumes. Furthermore, the
other words, the AERONET measurements capture the back-                                comparisons usually include only a few points closest in time
ground AODs relatively well, but miss some of the spatially                            to the aircraft overpass of an AERONET station. Factors such

Atmos. Chem. Phys., 21, 10671–10687, 2021                                                              https://doi.org/10.5194/acp-21-10671-2021
K. Baibakov et al.: Aerosol optical depth measurements of oil sands plumes 10681 Figure 7. Panels (a)–(c) as in Fig. 3. (d) SSA440 from nephelometer and CLAP, unitless; (e) black carbon mass, µg m−3 . The pink and grey rectangles represent plumes A and B respectively as discussed in the text. UTC time. as prevalent wind directions, local topography and distance AERONET station closer to specific facilities might yield a to emission sources can all bias comparisons between the air- better agreement in certain cases, but the AOD differences craft and ground-based platforms. In particular, during the will likely remain because of spatial inhomogeneity of the 9 and 18 June flights, the Fort McMurray AERONET station plumes and the inherent limitations of measurements from a was mostly located upwind of the Syncrude facilities and single fixed ground-based station. likely missed most of the plumes measured by the 4STAR. Figure 9a shows 4STAR-AERONET scatterplots for se- However, even when limiting the AERONET data to peri- lected flights. Only out-of-plume AODs acquired during a ods associated with northern winds (270 to 90◦ on a wind straight-level flight (i.e. excluding spirals) at an altitude of rose) likely carrying the industrial plumes (Fig. 1), the mean less than 1 km were considered for comparison. Each valid and median June 2018 AODs were both 0.09 with only 4 AERONET L2.0 direct-Sun measurement was matched in individual measurements exceeding 0.2 (maximum of 0.29). time with the nearest 4STAR measurement within a 10 min We attribute these disparities to dilution as the plumes are window (the 4STAR-AERONET distance varied between 21 being transported from their sources to where they are cap- and 154 km), and if no such measurements were found, the tured by the AERONET Sun photometer. Simply moving the AERONET point was excluded from analysis. Even though https://doi.org/10.5194/acp-21-10671-2021 Atmos. Chem. Phys., 21, 10671–10687, 2021
10682                                                K. Baibakov et al.: Aerosol optical depth measurements of oil sands plumes

Figure 8. (a) 4STAR in-plume mean fine-mode AODs for transfor-
mation flights of 9 and 24 June and 5 July and an emission flight of
18 June. (b) Fort McMurray ground-based AOD daily averages and
standard deviations for selected dates (staggered vertically to show
the error bars). In (a, b) the horizontal error bars indicate the AOD
standard deviation representing spatial variability of the plumes (per
altitude SD values for 4STAR and daily SD values for AERONET).
For 24 June the AERONET data after 18:13 was removed because
it was associated with forest fires.

the average out-of-plume AODs compared favourably to
AERONET, the actual linear correlation coefficient (R 2 ) val-
ues were relatively low (∼ 0.30) likely indicating spatial               Figure 9. (a) AOD fine-mode comparisons between 4STAR and
variations in the background aerosol loading and/or uncer-               AERONET for the selected flights of 9, 18 and 24 June and 5 July.
tainties in defining out-of-plume sections (there may well               (b) Corresponding histogram of fine-mode AOD differences be-
                                                                         tween the 4STAR and AERONET. AERONET data were matched
have been moderately higher AODs in the neighbourhood
                                                                         with 4STAR within 10 min. 4STAR data include only out-of-plume
of those plumes that escaped our plume rejection criteria).              AODs acquired during a straight-level flight (i.e. excluding spirals)
A notable exception (R 2 = 0.65) was 18 June when both                   at an altitude of less than 1 km. For 24 June the AERONET data
4STAR and AERONET showed a slight low-frequency AOD                      after 18:13 were removed because they were associated with forest
increase (from 0.05 to 0.06) during the flight time (Fig. S4 in          fires.
the Supplement, top panel). The bottom panel of that figure
also shows that the AERONET reff,f values agree particularly
well with UHSAS, but the 4STAR retrievals seem to be over-               principle, as the aircraft moves further away from sources
estimated. We suspect that the source of this latter inconsis-           the AOD should increasingly resemble the background, and
tency is due to the artificially high 4STAR irradiance signals           thus τdiff should decrease with distance. On the other hand,
at the shorter wavelengths. Figure 9b shows a histogram of               as the distance between the two instruments increases so do
τdiff values (defined as τdiff = τf,4STAR − τf,AERONET ) for all         the differences in sampled air masses. In fact, Sioris et al.
four flights combined. It is evident from this figure that de-           (2017a, their Fig. 4) showed that the two AERONET sta-
spite the slightly shorter atmospheric column, 4STAR AODs                tions become progressively dissimilar as a function of dis-
are marginally overestimated relative to AERONET with                    tance between them with the correlation coefficient dropping
|τdiff | mean, median and standard deviation being 0.02, 0.01            by ∼ 50 % in the first 500 km. This is consistent with Fig. S5,
and 0.02. The interpretation of this result is not obvious. In           which indicates that despite the significant variance in the

Atmos. Chem. Phys., 21, 10671–10687, 2021                                                 https://doi.org/10.5194/acp-21-10671-2021
K. Baibakov et al.: Aerosol optical depth measurements of oil sands plumes 10683
data, the average τdiff increases as a function of distance sepa- 4 Summary and conclusions
rating the 4STAR and the Fort McMurray AERONET station
(up to 160 km) based on the data from the four flights. This During the spring–summer 2018 Oil Sands Measurement
suggests that either the 4STAR was influenced by dispersed Campaign, the NASA 4STAR Sun photometer acquired air-
plumes with AODs higher than the AOSR background even borne hyperspectral AOD data in the Athabasca Oil Sands
at larger distances (i.e. not fully diluted plumes), or that the Region. In this work, we report on the airborne AOD mea-
AERONET AODs were influenced by cleaner air masses. surements of anthropogenic plumes from mining and pro-
Another potential explanation accounting for some of the cessing operations in AOSR in the context of AERONET
4STAR overestimation is secondary organic aerosol (SOA) climatological and diurnal AODs at Fort McMurray. The
production, which may increase with distance and time (e.g. monthly averaged AERONET AOD for June 2018, when
Liggio et al., 2016). This possibility was investigated by tar- most of the 4STAR Sun photometer data were acquired, was
geting the transformation flights of 24 June and 5 July, in 0.13 ± 0.05 (mean ± SD), which was in line with summer-
an attempt to observe any systematic screen-to-screen AOD time climatological averages, indicating that the observa-
changes that might be due to SOA production – a phe- tional conditions during OSMC were representative of the
nomenon that could be missed by AERONET. As shown in typical aerosol loading in the area for that month.
Table 1 between screen 1 to 3 only a modest increase of During the two flights of 9 and 18 June (high-AOD
0.01 and 0.02 was observed. While these AOD changes are flights), while flying into the visually opaque industrial
small and commensurate with the 4STAR measurement er- plumes, 4STAR registered high fine-mode in-plume AODs
ror, O’Neill et al. (2008) previously showed that changes on of up to 0.4 and 0.9, respectively, in the vicinity of the
this scale can be linked to real underlying changes in aerosol plume source (< 20 km). These high AODs significantly ex-
properties. We compared the in-plume vertical profiles ob- ceed climatological averages and were clearly not captured
tained during screens 2 and 3 of each of the two flights, ex- by the nearby AERONET instrument, which reported mean
cluding the data from screen 1 because on 24 June it was not daily AODs of 0.10 ± 0.01 and 0.07 ± 0.02 (mean ± SD) for
properly positioned relative to other screens and on 5 July those days. At the same time the average 4STAR out-of-
the profile data only covered a short vertical range, which we plume (background) AODs deviated only marginally from
judged to be inadequate for analysis. We found that for both AERONET daily averaged values. We attribute the dis-
dates the calculated in situ extinction coefficient at 500 nm parities principally to the horizontal inhomogeneity of the
was higher at practically each level for screen 3 (Fig. 10). plumes, the distance between the plume source and the
Integrating the extinction coefficient over the common ver- AERONET instrument as well as prevalent winds which,
tical range between the screens yielded (in situ) layer AOD in certain cases, were carrying the plume away from the
increases between 33 % and 67 %. Comparing these values ground-based instrument.
to 4STAR was not always possible in part because of the For both flights, the 4STAR AOD peaks were generally
missing Sun photometry data, and in part because the AOD well correlated in time with peaks in in situ-measured parti-
did not vary sufficiently (i.e. above the measurement uncer- cle and gas concentrations for the optically active sections of
tainty of 0.01) over these short vertical ranges of 200–500 m the plume (plume “A”, i.e. those sections that were associated
to be reliably measured. However, for the two longest profiles with significant increases in in situ extinction and/or AOD),
during screen 3 on 5 July spanning 800 m, the in situ layer while other sections, clearly associated with elevated in situ
AOD of 0.013 ± 0.002 compared favourably to 4STAR AOD concentrations (relative to out-of-plume measurements), pro-
of 0.01 (taking standard deviation within a 50 m altitude bin duced no significant 4STAR response (plume “B”). We at-
as a measurement error for extinction and assuming that the tribute this difference to the presence of larger FM particles
errors in altitude measurements are negligible). Therefore, within plume A (FM effective radius increasing from 0.10
the observed 4STAR AOD increases, while small, are con- to 0.18 µm) relative to the out-of-plume values and plume B.
sistent with layer AOD increases calculated from in situ ex- Particle composition analysis shows that plume A contained
tinction measurements. Particle composition data show that elevated levels (by up to a factor of 6) of sulfates and ammo-
the plumes were dominated by the organic content (> 78 %) nium while the organic mass remained largely comparable
with the organic mass increasing from screen to screen de- between the two plumes.
spite dilution (Fig. S6 in the Supplement). Using a Top-Down During the 24 June and 5 July flights (low-AOD flights),
Emissions Rate Retrieval Algorithm (TERRA; Gordon et al., the plumes likely travelled longer distances before being
2015) significant SOA formation rates were determined of measured by the Convair-580 onboard instruments (the Syn-
1003 ± 193 and 443 ± 45 kg h−1 for 9 June and 5 July, re- crude plume for example would have travelled ∼ 60 km, or
spectively. Consequently, while acknowledging the limited 3 times the distance than on 9 June, before being first mea-
scope of the two flights and the need for more case studies, sured) and hence had more time to mix and disperse. The in-
we believe that the observed AOD increase can be attributed, plume and out-of-plume 4STAR AODs for these dates were
at least in part, to the process of SOA formation. practically indistinguishable (average AODs of ∼ 0.12 and
0.05 for 24 June and 5 July, respectively), and the airborne
https://doi.org/10.5194/acp-21-10671-2021 Atmos. Chem. Phys., 21, 10671–10687, 202110684 K. Baibakov et al.: Aerosol optical depth measurements of oil sands plumes
Figure 10. In-plume binned profile data obtained on 5 July during screens 2 and 3. The error bars represent standard deviations within each
50 m bin. (a) 4STAR FM AOD, (b) calculated in situ extinction coefficient at 500 nm. The in situ layer AOD between 575 and 975 m has
increased by 0.002 (∼ 33 %) from screen 2 to screen 3.
and ground-based averages compared favourably to within radiative transfer code as part of LibRadtran; Emde et al.,
0.01–0.02 AOD. Comparing screen 1 to 3 AODs for these 2016). The aerosol within the industrial plume cooled the
flights shows a small increase of 0.01–0.02, which was sup- surface, through a decrease in the integrated net irradiance
ported in several cases by the increases in layer AOD cal- change (W m−2 ), by an average reduction of incident light
culated from the in situ extinction measurements. Based on by 25 %, as compared to the immediately surrounding back-
these observations and the screen 1 to 3 increases in organic ground aerosol. This shows the potential to effect estimations
content and organic fraction, we attribute the observed AOD of the aerosol’s regional radiative impact, particularly if only
increase, at least in part, to the process of SOA formation. using the AOD from the nearby AERONET site as sole indi-
Comparing out-of-plume 4STAR AODs to AERONET cator.
measurements shows that despite the slightly shorter atmo-
spheric column 4STAR, AODs are marginally overestimated
(|τdiff | = 0.02) with the difference increasing as a function Code availability. The 4STAR raw data have been analyzed to pro-
of distance from the AERONET station. This suggests that duce AOD in this dataset using the open-source software published
either the 4STAR was still influenced by plumes with AODs by the 4STAR Team (4STAR Team et al., 2018, https://doi.org/10.
higher than the AOSR background (presumably measured by 5281/zenodo.1492912). Other processing codes are available upon
request.
AERONET) even at larger distances or that the AERONET
AODs were generally underestimated during those flights
(due for example to being influenced by cleaner air masses).
Data availability. AERONET data are available at
Finally, it is noted that low AOD AERONET measure- https://aeronet.gsfc.nasa.gov/ (NASA, 2021). The OSMC 4STAR
ments should be interpreted with care when they are used data are available at https://doi.org/10.5281/zenodo.3517179
to represent the AOSR average. We showed that industrial (Baibakov et al., 2019). The OSMC in situ data are available at
plumes can be associated with significantly higher AODs https://www.canada.ca/en/environment-climate-change/services/
in the vicinity of the emission sources, and their full ex- oil-sands-monitoring/monitoring-air-quality-alberta-oil-sands.
tent is not captured by the ground-based instruments even html (Government of Canada, 2021).
with sources as close as 30–50 km. The impact of aerosol
in-plume to the instantaneous change in solar irradiance is
larger than the background aerosol for any other part of Supplement. The supplement related to this article is available on-
the screens and flight segments in the surrounding area, line at: https://doi.org/10.5194/acp-21-10671-2021-supplement.
with changes occurring at the kilometer scales. By using the
change in measured AOD and in situ aerosol optical proper-
ties (measured single scattering albedo and asymmetry pa- Author contributions. KB, MW, SL and JR conceived the study.
rameter derived from Mie calculations of the aerosol size MW, JL, JR and SL acquired the funding. MW and JR oversaw the
use of 4STAR in Canada. KB and MW collected the 4STAR data on
and refractive index), we calculated the change in instan-
board the NRC Convair-580. KB, SL and KP analyzed the 4STAR
taneous direct aerosol radiative effect (using the Fu–Liou
direct-Sun measurements. KR, NTON and KB performed the SDA
Atmos. Chem. Phys., 21, 10671–10687, 2021 https://doi.org/10.5194/acp-21-10671-2021K. Baibakov et al.: Aerosol optical depth measurements of oil sands plumes 10685
analysis. KP, SL and CF processed the sky scan data. TWC and Anderson, T. L., Covert, D. S., Marshall, S. F., Laucks, M. L.,
KB analyzed nephelometer and CLAP data. MJW, KB and LN ana- Charlson, R. L., Waggoner, A. P., Ogren, J. A., Caldow, R.,
lyzed UHSAS and SP2 data. KB analyzed the AERONET data with Holm, R. L., Quant, F. R., Sem, G. J., Wiedensohler, A.,
contributions from KR, NTON and SL. RJ and SL provided engi- Ahlquist, N. A., and Bates, T. S.: Performance characteristics of a
neering support for integrating and running the 4STAR on board high-sensitivity, three-wavelength total scatter/backscatter neph-
the NRC Convair-580. KB wrote the paper with contributions and elometer, J. Atmos. Ocean. Tech., 13, 967–986, 1996.
reviews from all authors. Anderson, T. L., Charlson, R. J., Schwartz, S. E., Knutti, R.,
Boucher, O., Rodhe, H., and Heintzenberg, J.: Climate forc-
ing by aerosols—A hazy picture, Science, 300, 1103–1104,
Competing interests. The authors declare that they have no conflict https://doi.org/10.1126/science.1084777, 2003a.
of interest. Anderson, T. L., Charlson, R. J., Winker, D. M., Ogren, J. A.,
and Holmén, K.: Mesoscale variations of tropospheric aerosols,
J. Atmos. Sci., 60, 119–136, https://doi.org/10.1175/1520-
Disclaimer. Publisher’s note: Copernicus Publications remains 0469(2003)0602.0.CO;2, 2003b.
neutral with regard to jurisdictional claims in published maps and Andrews, E., Ogren, J. A., Kinne, S., and Samset, B.: Compari-
institutional affiliations. son of AOD, AAOD and column single scattering albedo from
AERONET retrievals and in situ profiling measurements, At-
mos. Chem. Phys., 17, 6041–6072, https://doi.org/10.5194/acp-
17-6041-2017, 2017.
Acknowledgements. We would like to acknowledge the NRC and
Baibakov, K., LeBlanc, S., Wolde, M., Molani, K., Flynn,
ECCC project crew that supported the field project. We also ac-
C., Redemann, J., and Johnson, R.: 4STAR datasets (Oil
knowledge Warren Gore (retired) from NASA Ames Research Cen-
Sands Measurement Campaign 2018), Zenodo [data set],
ter for his efforts in bringing the 4STAR to Canada for the dura-
https://doi.org/10.5281/zenodo.3517179, 2019.
tion of the project. We thank Ihab Abboud and Vitali Fioletov for
Baray, S., Darlington, A., Gordon, M., Hayden, K. L., Leithead,
establishing and maintaining the Fort McMurray and Fort McKay
A., Li, S.-M., Liu, P. S. K., Mittermeier, R. L., Moussa, S. G.,
AERONET sites used in this investigation.
O’Brien, J., Staebler, R., Wolde, M., Worthy, D., and McLaren,
R.: Quantification of methane sources in the Athabasca Oil
Sands Region of Alberta by aircraft mass balance, Atmos.
Financial support. Funding for the NRC Convair-580 participation Chem. Phys., 18, 7361–7378, https://doi.org/10.5194/acp-18-
in the Oil Sands 2018 field project was provided by ECCC and 7361-2018, 2018.
NRC. This work was partially funded under the Oil Sands Moni- Bodhaine, B. A., Ahlquist, N. C., and Schnell, R. C.: Three-
toring (OSM) program but it is independent of any position of the wavelength nephelometer suitable for aircraft measurement of
OSM program. The US authors were supported in part by NASA background aerosol scattering coefficient, Atmos. Environ., 25A,
Radiation Science Program, under the direction of Hal Maring. 2267–2276, 1991.
Boucher, O., Randall, D., Artaxo, P., Bretherton, C., Feingold, G.,
Forster, P., Kerminen, V.-M., Kondo, Y., Liao, H., Lohmann,
Review statement. This paper was edited by Barbara Ervens and U., Rasch, P., Satheesh, S. K., Sherwood, S., Stevens, B., and
reviewed by two anonymous referees. Zhang, X. Y.: Clouds and Aerosols, in: Climate Change 2013:
The Physical Science Basis. Contribution of Working Group I to
the Fifth Assessment Report of the Intergovernmental Panel on
Climate Change, edited by: Stocker, T. F., Qin, D., Plattner, G.-
K., Tignor, M., Allen, S. K., Boschung, J., Nauels, A., Xia, Y.,
References Bex, V., and Midgley, P. M., Cambridge University Press, Cam-
bridge, United Kingdom and New York, NY, USA, 571–658,
4STAR Team, LeBlanc, S., Flynn, C. J., Shinozuka, Y., Segal- https://doi.org/10.1017/CBO9781107415324.016, 2013.
Rozenhaimer, M., Pistone, K., Kacenelenbogen, M., Rede- Bytnerowicz, A., Fraczek, W., Schilling, S., and Alexander, D.: Spa-
mann, J., Schmid, B., Russell, P., Livingston, J., and Zhang, tial and temporal distribution of ambient nitric acid and ammonia
Q.: 4STAR_codes: 4STAR processing codes (Version v1.0.1), in the Athabasca Oil Sands Region, Alberta, J. Limnol., 69, 11–
Zenodo [model code], https://doi.org/10.5281/zenodo.1492912, 21, 2010.
2018. Cai, Y., Montague, D., Mooiweer-Bryan, W., and Deshler, T.: Per-
AboEl-Fetouh, Y., O’Neill, N. T., Ranjbar, K., Hesaraki, S., Ab- formance characteristics of the ultra high sensitivity aerosol
boud, I., and Sobolewski, P. S.: Climatological-scale analysis spectrometer for particles between 55 and 800 nm: Laboratory
of intensive and semi-intensive aerosol parameters derived from and field studies, J. Aerosol Sci., 39, 759–769, 2008.
AERONET retrievals over the Arctic, J. Geophys. Res.-Atmos., Charlson, R. J., Valero, F. P. J., and Seinfeld, J.
125, e2019JD031569, https://doi.org/10.1029/2019JD031569, H.: In search of balance, Science, 308, 806–807,
2020. https://doi.org/10.1126/science.1108162, 2005.
Ackerman, A., Toon, O., Stevens, D., Heymsfield, A., Charpentier, A. and Bergerson, J. M.: Understanding the Cana-
Ramanathan, V., and Welton, E.: Reduction of trop- dian oil sands industry’s greenhouse gas emissions, Environ. Res.
ical cloudiness by soot, Science, 288, 1042–1047,
https://doi.org/10.1126/science.288.5468.1042, 2000.
https://doi.org/10.5194/acp-21-10671-2021 Atmos. Chem. Phys., 21, 10671–10687, 2021You can also read


