AIRBORNE MEASUREMENT OF PEROXY RADICALS USING CHEMICAL AMPLIFICATION COUPLED WITH CAVITY RING-DOWN SPECTROSCOPY: THE PERCEAS INSTRUMENT - ATMOS ...
←
→
Page content transcription
If your browser does not render page correctly, please read the page content below
Atmos. Meas. Tech., 13, 2577–2600, 2020
https://doi.org/10.5194/amt-13-2577-2020
© Author(s) 2020. This work is distributed under
the Creative Commons Attribution 4.0 License.

Airborne measurement of peroxy radicals using chemical
amplification coupled with cavity ring-down spectroscopy:
the PeRCEAS instrument
Midhun George1 , Maria Dolores Andrés Hernández1 , Vladyslav Nenakhov1,a , Yangzhuoran Liu1 , and
John Philip Burrows1
1 Institute  of Environmental Physics, University of Bremen, Bremen, Germany
a now   at: Flight Experiments, DLR Oberpfaffenhofen, Weßling, Germany

Correspondence: Midhun George (midhun@iup.physik.uni-bremen.de) and Maria Dolores Andrés Hernández
(lola@iup.physik.uni-bremen.de)

Received: 25 September 2019 – Discussion started: 14 October 2019
Revised: 17 March 2020 – Accepted: 26 March 2020 – Published: 20 May 2020

Abstract. Hydroperoxyl (HO2 ) and organic peroxy (RO2 )           and transformation of pollutants on the Regional and Global
radicals have an unpaired spin and are highly reactive free       scales) missions in different airborne campaigns aboard the
radicals. Measurements of the sum of HO2 and RO2 provide          High Altitude LOng range research aircraft (HALO) for the
unique information about the chemical processing in an air        study of the composition of the free troposphere.
mass. This paper describes the experimental features and ca-
pabilities of the Peroxy Radical Chemical Enhancement and
Absorption Spectrometer (PeRCEAS). This is an instrument
                                                                  1   Introduction
designed to make measurements on aircraft from the bound-
ary layer to the lower stratosphere. PeRCEAS combines the         Hydroperoxyl (HO2 ) and organic peroxy (RO2 ) radicals that
amplified conversion of peroxy radicals to nitrogen dioxide       have an unpaired spin are highly reactive free radicals. They
(NO2 ) with the sensitive detection of NO2 using cavity ring-     play important roles in the tropospheric chemistry. During
down spectroscopy (CRDS) at 408 nm. PeRCEAS is a dual-            the day, they are formed in the atmosphere following the
channel instrument, with two identical reactor–detector lines     oxidation of carbon monoxide (CO), methane (CH4 ) and
working out of phase with one another at a constant and           many volatile organic compounds (VOCs). They partici-
defined pressure lower than ambient at the aircraft altitude.     pate in catalytic cycles, which produce and destroy ozone
The suitability of PeRCEAS for airborne measurements in           (O3 ). Their temperature-dependent reactions form temporary
the free troposphere was evaluated by extensive characteri-       reservoirs, e.g. peroxynitrates such as peroxyacetyl nitrate
sation and calibration under atmospherically representative       (PAN; CH3 COO2 NO2 ), which are transported in the tropo-
conditions in the laboratory. The use of alternating modes        sphere. In the presence of sufficient NOx (nitrogen monox-
of the two instrumental channels successfully captures short-     ide, NO, plus nitrogen dioxide, NO2 ), the reaction of HO2
term variationsPin the sum of peroxy  radicals, defined as RO∗2   with NO forms NO2 and the hydroxyl radical (OH) which is
     ∗                          P
(RO2 =HO2 + RO2 +OH+ RO, with R being an organic                  the most important tropospheric oxidising agent. The organic
chain) in ambient air. For a 60 s measurement, the RO∗2 de-       oxy-radicals (RO), which contain hydrogen atoms, often re-
tection limit is < 2 pptv for a minimum (2σ ) NO2 detectable      act with molecular oxygen (O2 ) to form HO2 and oxygenated
mixing ratio < 60 pptv, under laboratory conditions in the        volatile organic compounds (OVOCs), such as aldehydes and
range of atmospheric pressures and temperatures expected          ketones. The latter are oxidised by OH and photolysed to ul-
in the free troposphere. PeRCEAS has been successfully de-        timately produce HO2 and RO2 .
ployed within the OMO (Oxidation Mechanism Observa-
tions) and EMeRGe (Effect of Megacities on the transport

Published by Copernicus Publications on behalf of the European Geosciences Union.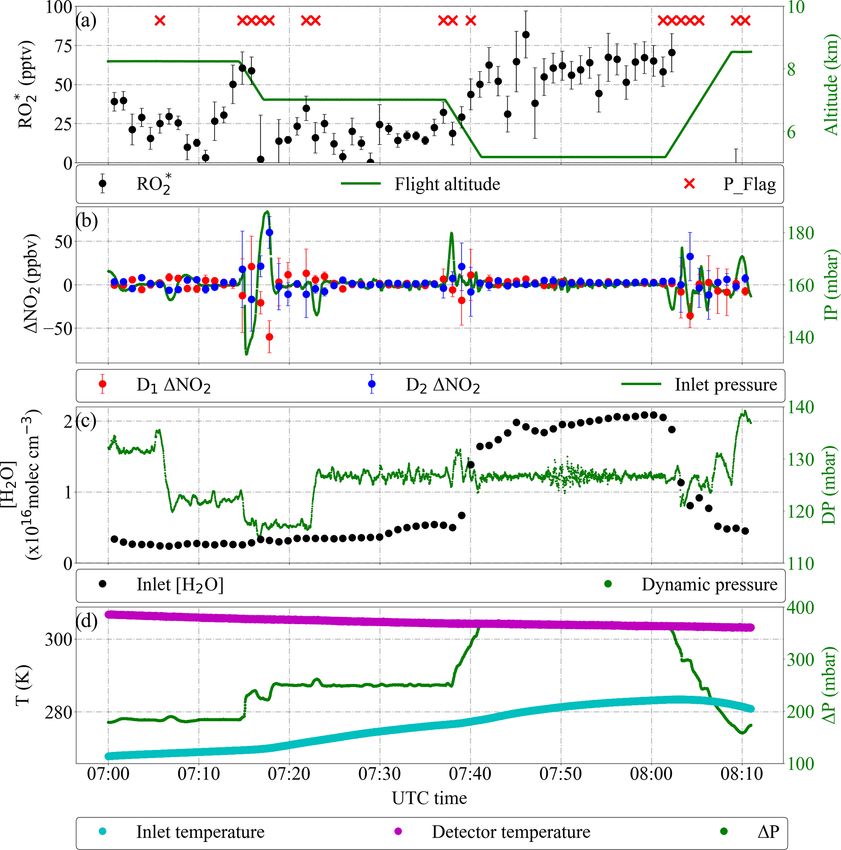
2578                                                              M. George et al.: Airborne measurement of peroxy radicals

   Overall, HO2 and RO2 influence the amounts and distri-           fluorescence (LIF). The technique, also known as fluores-
butions of OH and O3 and thus the oxidising capacity of the         cence assay by gas expansion (FAGE), was pioneered by
troposphere. Consequently, knowledge about the spatial dis-         Hard et al. (1984) and further modified by several scientific
tribution and concentration of HO2 and RO2 is essential to          groups (Creasy et al., 1997; Kanaya et al., 1999; Holland et
test the present understanding of the tropospheric chemistry.       al., 2003; Faloona et al., 2004). Potential spectral and chem-
   The HO2 and RO2 concentrations and mixing ratios are             ical interferences have been investigated in detail (Ren et al.,
small because of their high reactivity. Consequently, their         2004). The interference by some RO2 radicals into the HO2
measurement requires sensitive and accurate techniques.             signal reported by Fuchs et al. (2009, 2010, 2011) is min-
With the exception of the freezing of air and subsequent            imised by controlling the NO concentration added for con-
use of the matrix isolation electron spin resonance technique       version into OH (Whalley et al., 2013; Lew et al., 2018).
(MIESR; Mihelcic et al., 1985), there are no direct spectro-           In the last decades, ground-based measurements of RO∗2
scopic measurements of HO2 or RO2 , which have been ap-             and HO2 have been successfully made in a variety of envi-
plied successfully in ambient air. Alternatively, indirect mea-     ronments (Monks et al., 1998, 2009 and references herein;
surement techniques have been developed. The chemical am-           Burkert et al., 2001a, b; Carslaw et al., 2002; Fleming et al.,
plification technique (Cantrell and Stedman, 1982; Hastie et        2006a, b; Emmerson et al., 2007; Qui et al., 2007; Kanaya
al., 1991) has been used to measure the sum of peroxy rad-          et al., 2007, 2012; Hofzumahaus et al., 2009; Andrés-
icals. Peroxy radical chemical amplification (PeRCA) con-           Hernández et al., 2009, 2010; Mao et al., 2010; Kukui et al.,
verts by addition of NO and CO, HO2 and most atmospher-             2014; Lelieveld et al., 2018; Tan et al., 2017). The majority
ically significant RO2 to NO2 . The OH formed in the reac-          of measurements of RO∗2 or HO2 were made in field cam-
tion cell reacts with CO to reform HO2 in a chain reaction.         paigns which studied different aspects of the chemistry in
Hydroxyl,
        P alkoxyl, hydroperoxyl
                       P              and alkylperoxyl radicals     the lower troposphere. These case studies have considerably
(OH+ RO+HO2 + RO2 ) are converted into NO2 . As the                 improved the knowledge of the role of HO2 and RO2 in tro-
RO and OH abundances in the troposphere are much lower              pospheric boundary layer chemistry. In contrast, the number
than those of HO2 and RO2 , PeRCA measures to a good ap-            of unequivocal measurements of peroxy radicals in the free
proximation the sum of peroxy radicals collectively known as        troposphere is still quite limited.
RO∗2 (RO∗2 =HO2 +6RO2 ; R being any organic chain), which              Airborne measurements offer a unique opportunity to
convert NO to NO2 . The rate coefficients of the HO2 and RO2        measure HO2 and RO2 in the free troposphere. However,
reactions with NO are very similar (Lightfoot et al., 1992).        the temporal and spatial variability in the chemical compo-
Large RO2 which do not react with NO to form NO2 are not            sition of the air masses make the measurement from airborne
detected and are assumed
                     P       to be negligibly small compared to     platforms challenging. High instrumental accuracy, sensitiv-
the sum of HO2 + RO2 concentrations. HO2 and CH3 O2                 ity and specificity are required to unequivocally identify and
are the dominant peroxy radicals present in an air mass in          quantify potential spectral and chemical interferences (Green
most conditions.                                                    et al., 2002, 2006; Zanis et al., 2003; Clemitshaw, 2004 and
   A variant on the CO chemical amplification is used in the        references herein; Heard 2006, and references herein; Stone
Ethane Chemical AMPlifier (ECHAMP). As its name im-                 et al., 2012 and references herein; Ren et al., 2012). In ad-
plies, this uses ethane (C2 H6 ) rather than CO for the ampli-      dition, each particular airborne platform has unique capa-
fication of atmospheric peroxy radicals (Wood et al., 2017).        bilities but also limitations (e.g. mechanical, electrical and
Although the amplification is lower than for CO, the chain          safety constraints) compared to ground-based or ship-board
length appears to be less sensitive to humidity effects (Dun-       platforms. As a result of the above, instruments to measure
cianu et al., 2020). Chemical amplification using a CO and          airborne HO2 and RO∗2 are usually designed and optimised
SO2 chain conversion in combination with chemical ionisa-           for use on a specific aircraft platform.
tion mass spectrometry (CIMS) has been used for the mea-               The Peroxy Radical Chemical Enhancement and Absorp-
surement of RO∗2 (Reiner et al., 1997; Hanke et al., 2002).         tion Spectrometer (PeRCEAS) was designed by the Institute
In a further development, Edwards et al. (2003) and Horn-           of Environmental Physics of the University of Bremen (IUP-
brook et al. (2011) described a PerCIMS instrument with             UB) for the airborne measurement of RO∗2 in the free tropo-
two measurement modes (HO2 and 6RO2 ). The separation is            sphere and lower stratosphere and for its deployment aboard
achieved by varying NO, SO2 and O2 concentrations, which            the High Altitude LOng range research aircraft (HALO;
changes the relative sensitivities to HO2 and RO2 . Recently,       http://www.halo.dlr.de, last access: 7 April 2020). PeRCEAS
the use of iodide and bromide as primary ions in CIMS for           combines the PeRCA and the cavity ring-down spectroscopy
the measurement of HO2 has been reported (Sanchez et al.,           (CRDS) techniques in a dual-channel instrument for the de-
2016; Albrecht et al., 2019). Further investigation on the in-      termination of RO∗2 . The principle of these well-known tech-
strumental background signal is required before deploying           niques and their application to the RO∗2 measurement have
this technique in the field.                                        been described in detail in a previous publication (Hortsjann
   HO2 has also been successfully measured by the conver-           et al., 2014).
sion of HO2 to OH, which is then measured by laser-induced

Atmos. Meas. Tech., 13, 2577–2600, 2020                                              https://doi.org/10.5194/amt-13-2577-2020
M. George et al.: Airborne measurement of peroxy radicals                                                                      2579

Figure 1. Schematic diagram of the PeRCEAS instrument. SA: synthetic air; NO/N2 : mixture of NO in N2 .

   In an instrument using the PeRCA technique, the probed            surement technique, a monochromatic electromagnetic ra-
RO∗2 radicals are converted into an amplified amount of NO2          diation pulse is trapped inside a high-finesse optical cavity
by adding NO and CO in excess to the sampled air in the              and the time decay of the intensity is measured. The con-
inlet. A modulated NO2 signal is obtained by alternating the         centration of an absorber of interest is calculated from the
position of the CO addition between the so-called amplified          decay times of the electromagnetic radiation pulse to 1/eth
or amplification and non-amplified or background modes.              of its initial value, the so-called ring-down time, for a res-
These modes respectively facilitate or suppress the conver-          onator containing (τ ) or not containing (τ0 ) the absorber. In
sion of radicals into NO2 . Sampled O3 is converted to NO2 in        PeRCEAS, the absorber of interest is NO2 , which is formed
the reactor. The background signal comprises the sum of am-          in both the amplification and the background modes.
bient NO2 , O3 and any NO2 produced within the system (e.g.             The ambient RO∗2 concentrations measured by PeRCEAS
from the thermal decomposition of peroxyacyl nitrates like           are then retrieved from the difference in the ring-down times
PAN). The instrumental amplification factor, the so-called           of the background and amplification modes of operation, pro-
effective chain length (eCL = RO∗2 /1NO2 , where 1NO2 is             vided that τ0 and the total scattering do not change substan-
the NO2 formed by the chemical amplification), depends on            tially during two consecutive sampling modes:
loss of peroxy radicals during the sample passage through
the instrument to the detector by physical processes or chem-
                                                                                     n 1   1

ical reactions resulting in non-radical products. As a result,       1α = α2 − α1 =      −     = σNO2 1[NO2 ]
                                                                                    c0 τ2 τ1
the specific instrumental characteristics and the measurement
                                                                        = σNO2 RO∗2 × eCL,

conditions determine the eCL (Cantrell and Stedman, 1982;                                                                        (1)
Cantrell et al., 1984, 1996; Hastie et al., 1991; Clemitshaw et
al., 1997; Kartal et al., 2010).                                     where α1, τ1 and α2 , τ2 are, respectively, the absorption co-
   In CRDS (O’Keefe and Deacon, 1988; Atkinson, 2003;                efficients and ring-down times for the background and am-
Brown, 2003; Berden and Engel, 2010 and references                   plification modes in the inlet, n is the refractive index of the
herein), which is now a well-established spectroscopic mea-          medium, c0 is the speed of light in vacuum, σNO2 is the ab-

https://doi.org/10.5194/amt-13-2577-2020                                               Atmos. Meas. Tech., 13, 2577–2600, 2020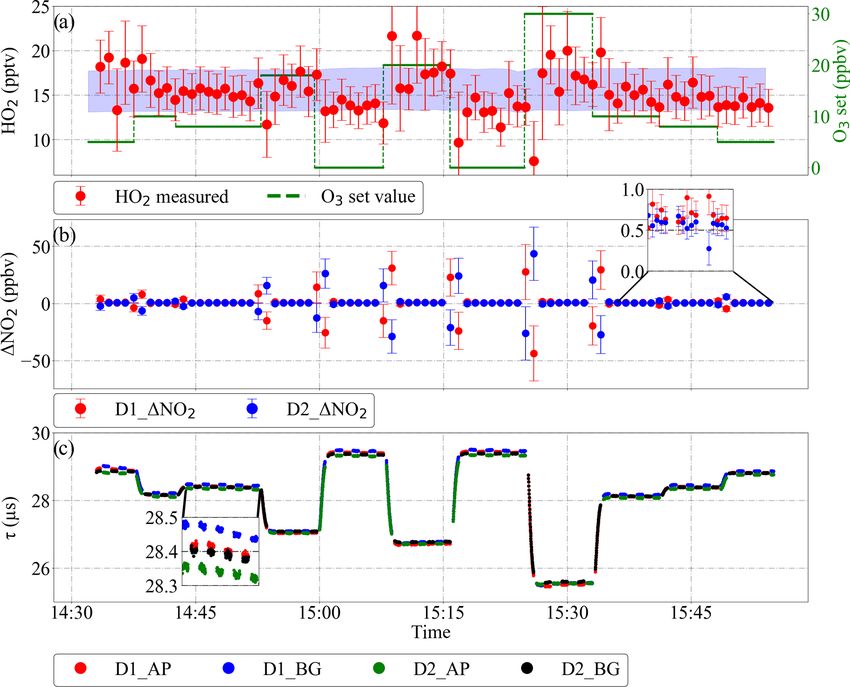
2580                                                              M. George et al.: Airborne measurement of peroxy radicals

sorption cross section of NO2 , and eCL is characteristic for
each particular setup.
   PeRCA and absorption spectroscopy using high-finesse
optical cavities have been recently used for ground-based
measurements of RO∗2 radicals (Liu et al., 2009; Wood and
Charest, 2014; Chen et al., 2016). PeRCEAS addresses the
particular constrains related to airborne measurement by op-
timising the conversion of probed radicals in the reactor and
the accuracy of the NO2 measurement.
   In this study, the specifications and airborne performance
of PeRCEAS are described, based on thorough and extensive
laboratory characterisations and calibrations. The present
study builds on the experience gained from the PeRCEAS
deployment in three airborne measurement campaigns in
the framework of the Oxidation Mechanism Observations               Figure 2. Graphical 3D representation of the upper part of the
(OMO; see https://www.mpic.de/3599603/OMO, last access:             DUALER I and DUALER II inlets. Pre-chamber volume DUALER
                                                                    I is 75.25 cm3 ; reactor volume DUALER I is 112 cm3 ; pre-chamber
9 May 2020) mission in 2015 and Effect of Megacities
                                                                    volume DUALER II is 119.57 cm3 ; reactor volume DUALER II is
on the transport and transformation of pollutants on the            130.5 cm3 .
Regional and Global scales (EMeRGe; see http://www.iup.
uni-bremen.de/emerge/, last access: 7 April 2020) missions
in 2017 and 2018 aboard the HALO platform.
                                                                    pass line are scrubbed for CO and NOx and exhausted by the
                                                                    pump.
2   PeRCEAS general description: mechanical and                        The DUALER inlet comprises two PeRCA chemical reac-
    electrical setup                                                tors having alternating measurement modes, which are out of
                                                                    phase with one another. During the first part of the measure-
The PeRCEAS airborne instrument, shown schematically in             ment cycle, the first reactor and detector are in amplification
Fig. 1, comprises essentially the DUALER (DUal channel              mode, while simultaneously the second reactor and detec-
Airborne peroxy radical Chemical AmplifiER) inlet installed         tor are in background mode. In the second part of the cycle,
inside a pylon located on the outside of the HALO fuse-             the CO addition point in both reactors is switched. Conse-
lage and two CRDS NO2 detectors mounted in a rack inside            quently, the first reactor and detector are then in background
the HALO cabin. The first laboratory prototype reported by          mode while the second reactor and detector are in amplifi-
Hortsjann et al. (2014) has been significantly improved using       cation mode. In the analysis of the measurements, the am-
the experience gained from the deployments in HALO mis-             plification and background signals from both detectors are
sions. The following description of the instrument focuses on       combined appropriately. This improves accuracy and tempo-
the modified and optimised features of PeRCEAS.                     ral resolution of the resultant RO∗2 data set (see Sect. 3.1).
   Briefly, sample air enters PeRCEAS through the DUALER               In the DUALER, a stable pressure in the pre-chamber is
pre-chamber, which is at a lower pressure than that outside         achieved by a pressure regulator, which controls the flow
of the HALO, through an orifice in a truncated cone, i.e. a         through the bypass line. The flow rate through the reactors
nozzle. From this pre-chamber, the air is pumped simulta-           is held constant during measurements. Consequently, when
neously through the two flow reactors and a bypass line. At         the outside air pressure varies, the bypass flow rate from the
the upper addition point, a mixture of CO or N2 and NO en-          pre-chamber changes. The outer dimensions, shape, form and
ters each reactor. At the lower addition point, a flow of N2        weight of the DUALER are constrained by the inlet pylon
or CO enters each reactor. This enables the CO and N2 flows         in use with the research aircraft HALO. After the first ver-
in the two reactors within the DUALER to be switched si-            sion of the DUALER (from now on called DUALER I) was
multaneously but to be out of phase with one another from           flown, the inner dimensions of the pre-chamber were further
the upper to the lower addition point. At the addition points,      optimised to reduce wall losses and turbulence in the pre-
the reagent gases enter the reactor through eight circular dis-     chamber. For this, in DUALER II, the volume of the pre-
tributed 1 mm holes to facilitate the rapid mixing with the         chamber was increased by extending its vertical extent, the
sampled air. During measurements, the pressure in the pre-          length of the truncated cone on top of the reactors was re-
chamber and both reactors is held constant. However, there          duced by 3 mm, and the volume of the reactors was increased
is a small pressure fluctuation during the switching of flows       to 130.5 mL from the 112 mL in DUALER I. These changes
between the upper and lower mixing point. The flow pass-            resulted in a higher eCL and improved pressure stability in
ing through each reactor enters a CRDS NO2 detector. Af-            DUALER II as compared to DUALER I. Figure 2 shows the
terwards, the sample flows together with the air from the by-       upper part of both DUALER I and DUALER II.

Atmos. Meas. Tech., 13, 2577–2600, 2020                                              https://doi.org/10.5194/amt-13-2577-2020
M. George et al.: Airborne measurement of peroxy radicals                                                                   2581

Figure 3. Schematic diagram of a CRDS NO2 detector in PeRCEAS.

   The improvements of the PeRCEAS CRDS detectors for                 Concerning the data acquisition and processing, the sys-
NO2 targeted the signal stability and the in-flight adjustment     tem is equipped with the current National Instruments PXI-
of the optical alignment. The optical cavity remains similar       8840 computer with two PXI-6132 DAQ cards working with
to that described in Horstjann et al. (2014); i.e. a V resonator   1 M sample s−1 to measure the ring-down signal from both
of approximately 100 cm3 volume formed between glued               detectors. Other sensor data such as pressure, flow, tempera-
highly reflective mirrors (reflectivity, R, of 99.995 %; diam-     ture and humidity are measured with a PXI-6129 DAQ card
eter, d, of 0.5”(1.27 cm); radius of curvature, roc, of 100 cm,    at a rate of 1 sample s−1 .
AT Films, USA) on the side of a Teflon-coated aluminium               Three identical interchangeable detectors, hereafter named
cuboid. As shown in Fig. 3, the current NO2 detector houses        Abbé (AB), Fraunhofer (FH) and Fresnel (FR), have been
a 100 mW continuous wave multimode diode laser (Stradus            constructed and characterised at the IUP-UB, of which two
405, wavelength approximately 408 nm, max 100 mW out-              are always simultaneously deployed in measurement cam-
put power, Vortran Laser Technology Inc.). With this, the          paigns.
fine adjustment of the laser is simplified and improved, and          Additional components used to operate PeRCEAS such
the piezoelectric stack used to achieve mode matching be-          as mass flow and pressure sensors/controllers, gas cylinders
tween the single-mode laser and the optical cavity in Horts-       and electronics are mounted in the main rack, as described
jann et al. (2014) becomes unnecessary and is removed. The         in Hortsjann et al. (2014). The instrument rack in the aircraft
laser is aligned to the V resonator using two motorised align-     cabin is connected to the DUALER through an aperture plate.
ment mirrors (0.5” aluminium mirrors mounted on Newport            Other ancillary parts of the PeRCEAS, such as the vacuum
8885 Picomotor actuated pint-sized centre mounts). These           pump, a secondary containment for dangerous gases (CO), a
enable the correction of any misalignment arising from me-         scrubber unit for NOx /CO and the rest of gas cylinders, are
chanical displacement of the optical elements with respect to      also installed in the aircraft cabin.
the V resonator due to vibration or mechanical shocks dur-
ing transport, installation or in-flight measurement. During
alignment procedures and for test purposes, a beam camera
(BM-USB-SP907-OSI, Ophir Spiricon Europe GmbH) mon-
itors the beam profile and simplifies the identification of mis-
alignments or loss of performance of the optical system.

https://doi.org/10.5194/amt-13-2577-2020                                            Atmos. Meas. Tech., 13, 2577–2600, 2020
2582                                                               M. George et al.: Airborne measurement of peroxy radicals

3     PeRCEAS mode of operation                                      seen, the optimal averaging time for the three PeRCEAS
                                                                     detectors is in the range between 20 and 50 s. The corre-
The mode of operation of PeRCEAS is optimised by system-             sponding minimum (2σ ) detectable mixing ratio is < 60 pptv
atically investigating the short- and long-term stability of the     (3.15×10⁸ molec. cm−3 for these P and T conditions). Slow
detector signal and the effect of potential interferences. Fac-      temperature drifts over longer averaging times impact both
tors affecting the overall performance of PeRCEAS for air-           the laser and the resonator characteristics. This behaviour is
borne measurements are discussed in the following sections.          observed for averaging times longer than 60 s.
                                                                        In addition to random noise, systematic noise in the mea-
3.1    Measurement modes: integration time                           surement arises from instability of the laser and or that of the
                                                                     detector response over the modulation time. This is decisive
The mode time is defined as the time selected for the mea-
                                                                     for the overall accuracy of the RO∗2 determination. As men-
surement in either amplification or background mode. The
                                                                     tioned in the introduction, the ambient RO∗2 concentrations
modulation time is the time taken for a complete measure-
                                                                     are calculated from the CRDS detector signals using Eq. (1).
ment cycle, which comprises the sum of one amplification
                                                                     This assumes that the variation of τ0 has a negligible impact
and one background mode. The PeRCEAS measurement cy-
                                                                     over two consecutive modulation periods.
cle is illustrated in Fig. 4. The 1NO2 for each detector is cal-
                                                                        Temperature changes of the detector affect (i) the diode
culated from the ring-down time of two consecutive modes
                                                                     laser emission, both its amplitude and wavelength, and
using Eq. (1). If the mode time is adequately selected, the
                                                                     (ii) the mode matching between laser and detector, and con-
RO∗2 retrieved per measurement cycle is identical in both
                                                                     sequently the τ0 . The effect of the variations in τ , resulting
measurement lines, as the two reactors are operated out of
                                                                     from changes in room or HALO cabin air temperatures, on
phase with one another. The final RO∗2 data are calculated
                                                                     the accuracy and precision of the 1NO2 determination was
as the mean of the RO∗2 determined from the 1NO2 and the
                                                                     investigated by a series of laboratory experiments. For this,
eCL of both detectors for a given measurement cycle. The
                                                                     modulated concentrations of NO2 in the flow were gener-
time resolution of the RO∗2 measurement is then equal to the
                                                                     ated by alternating between two selected NO2 concentrations
mode time. After switching modes, a small pressure pulse
                                                                     once per minute. The temperature of the CRDS detector (T )
leads to an oscillation of the NO2 signal. Consequently, the
                                                                     and τ were then measured. Detector temperature gradients
first 20 s of each mode are not used in data analysis. The time
                                                                     over a time t, i.e. 1T /1t, determined by the temperature
lag arising from the time taken for the sample flow between
                                                                     within the detector housing close to the photodiode, were in-
the CRDS detector and the point of switching is typically less
                                                                     duced by controlled changes in the room temperature.
than 8 s.
                                                                        Figure 6 shows the effect of introducing temperature per-
   Typically, 650 to 800 ring-down times of the NO2 absorp-
                                                                     turbations in a modulated NO2 signal between 11.5 and
tion are averaged per second and the measurement of NO2
                                                                     12.1 ppbv measured at 200 mbar and 23 ◦ C. As can be seen in
is made at 1 Hz. Individual ring-down times are occasionally
                                                                     the figure, a temperature perturbation affects both precision
saved for sensitivity studies. Modulation and mode times are
                                                                     and accuracy of the retrieved 1NO2 . For temperature gra-
selected empirically. The optimised values are a compromise
                                                                     dients up to 1T /1t ≈ 7 ◦ C h−1 , the experimental precision
between the time taken for the detector signal to stabilise af-
                                                                     of the 1NO2 determination (2σ ) remains within 150 pptv
ter the CO/N2 flow is switched between the addition points
                                                                     (= 7.3 × 10⁸ molec. cm−3 at 200 mbar and 23 ◦ C).
and the temporal variability of the chemical composition of
                                                                        Using the results from the sensitivity and calibration stud-
the air probed.
                                                                     ies above, a 60 s mode time and a 120 s modulation time
   To optimise the mode time and the modulation cycle, the
                                                                     is selected as providing the optimal signal to noise ratio
Allan variance (Allan, 1966; Werle et al., 1993) was analysed
                                                                     of the 1NO2 at a significance level for 2σ error < 3.15 ×
for PeRCEAS. Given a time series of N elements and a to-
                                                                     108 molec. cm−3 .
tal measurement time tacq , tacq = facq · N, where facq is the
frequency of acquisition, the Allan variance is defined as
                                                                     3.2   Sample flows and residence times
          1
σx2 (τ ) = h(xi+1 − xi )iτ ,                                (2)      Sample and reagent gas flows have different and related im-
          2
                                                                     pacts on the sensitivity of the PeRCEAS measurements. The
where xi is the mean over a time interval of a length τ , be-        rate of the sample flows determines the residence time in dif-
ing τ = facq · m; and m the number of elements in a selected         ferent parts of the flow system, which in turn determines the
interval. The use of h. . .i denotes the arithmetic mean. The        reaction time for the conversion of RO∗2 to NO2 , the titration
square root of the Allan variance is the Allan deviation. For        of the O3 in the sampled ambient air and the thermal decom-
random noise, the Allan deviation at any given integration           position of peroxynitrates, and peroxynitric acid (HO2 NO2 ),
time determines the detection limit of the measurement.              which can produce an NO2 interfering signal. Interferences
   The Allan variance plot for measurements of 5.6 ppbv              are minimised by a short residence time, facilitated by a
NO2 at 200 mbar and 23 ◦ C is shown in Fig. 5. As can be             rapid flow. Conversely, the RO∗2 to NO2 conversion rate in

Atmos. Meas. Tech., 13, 2577–2600, 2020                                               https://doi.org/10.5194/amt-13-2577-2020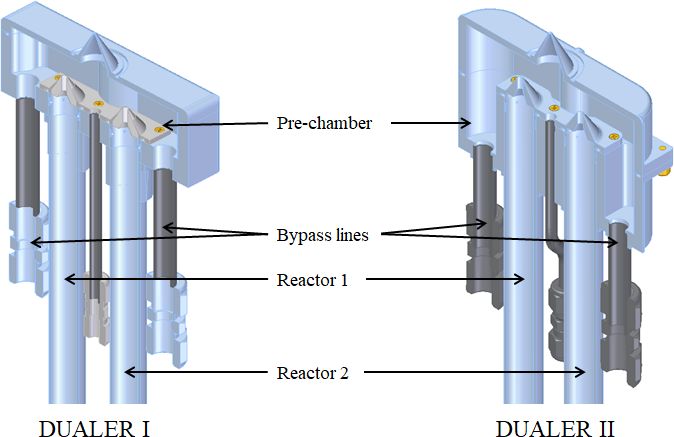
M. George et al.: Airborne measurement of peroxy radicals                                                                               2583

Figure 4. PeRCEAS measurement cycle during the laboratory measurement of 15 pptv of HO2 ; panels (a) and (b) show the ring-down time
of detectors 1 (D1) and 2 (D2) in both amplification (AP) and background (BG) modes, and the retrieved 1NO2 . The 1NO2 and the eCL
of the respective reactors are used to retrieve the HO2 mixing ratio in panel (c). The blue shading in panel (c) corresponds to the calculated
HO2 mixing ratio produced in the source (2σ uncertainty).

the DUALER is determined by the concentration of the CO                  cals but remains < 20 % (Lightfoot et al., 1992; Tyndall et al.,
and NO reagent gases added. The eCL increases with the                   2001).
increase in CO added to the sample (Reichert et al., 2003).                 The rate of titration of the sampled O3 by NO to form NO2
Laboratory tests comparing the performance of PeRCEAS                    also depends on the concentration of NO added to the sample
using alternative gases showed that CO is the most suitable              flow and the time for reaction before reaching the detector.
gas to convert OH back to HO2 in the chain reaction used                    As a result of the above, the flows of the sampled ambient
in the chemical amplification. However, CO is a toxic and                air, NO and CO and the pressure in the DUALER are se-
flammable gas with a lower explosive limit (LEL) in air of               lected for each deployment of PeRCEAS. The selections are
12.5 % v/v at room temperature and atmospheric pressure.                 a compromise between safety requirements, which limit the
This LEL is the minimum concentration necessary to sup-                  amount and concentration of gases aboard HALO, and the
port the gas combustion along with an ignition source such               values of eCL achieved for a particular residence time.
as a spark or flame (Zabetakis, 1965). Consequently, safety
considerations limit the maximum flow of CO.                             3.2.1    Effective chain length
   NO participates in both the chain carrier and chain termi-
nation reactions as explained in detail elsewhere (e.g. Hastie           The eCL of the DUALER reactors is determined in the
et al., 1991; Mihele et al., 1999). For a constant CO concen-            laboratory by using a calibrated source of peroxy radicals.
tration, these reactions of NO determine the eCL at different            The latter uses the photolysis of water vapour at 184.9 nm
pressures. Increasing NO in the reactor changes the sensi-               (Schultz et al., 1995). Briefly, a known water vapour–air mix-
tivity of the amplification to different peroxy radicals due to          ture is photolysed by a low-pressure mercury (Hg) lamp. A
the termolecular reaction of RO with NO forming RONO2 .                  nitrous oxide (N2 O) absorption filter attenuates the inten-
Also, the termolecular reaction of RO2 with NO leading to                sity of 184.9 nm radiation. This is achieved by varying the
RONO2 increases with increasing size for alkylperoxy radi-               N2 O/N2 ratio in the filter absorption zone. The photolysis of

https://doi.org/10.5194/amt-13-2577-2020                                                     Atmos. Meas. Tech., 13, 2577–2600, 2020
2584                                                                   M. George et al.: Airborne measurement of peroxy radicals

                                                                         The value for the absorption cross section of H2 O at
                                                                         184.9 nm, σH184.9
                                                                                        2O
                                                                                            nm
                                                                                               = (7.14 ± 0.2) × 10−20 cm2 molec.−1 , is
                                                                         taken from Cantrell et al. (1997) and Hofzumahaus et
                                                                         al. (1997), while the O2 effective cross section σO184.9
                                                                                                                                2 eff
                                                                                                                                      nm
                                                                                                                                         is
                                                                         determined experimentally for the particular Hg lamp used
                                                                         for calibration and the measurement conditions (Creasey et
                                                                         al., 2000; Hofzumahaus et al., 1997; Kartal et al., 2010).
                                                                            HO2 and 1 : 1 HO2 : CH3 O2 mixtures are generated at
                                                                         controlled pressures within expected airborne concentration
                                                                         ranges by adding 0.35 % of CO or CH4 , respectively, to
                                                                         the humidified air in the calibration flow tube. Radical mix-
                                                                         ing ratios are changed every 10 min and stepwise from 8 to
                                                                         150 pptv. The PeRCEAS eCL is determined as the slope of
                                                                         the measured NO2 versus the calculated radical mixing ratios
                                                                         in the calibration flow tube. The O3 generated by the radical
                                                                         source is converted in the DUALER to NO2 by its reaction
                                                                         with NO, which is in excess. Therefore, the O3 entering the
                                                                         reactor during the radical calibration is detected as NO2 in
                                                                         the background and amplified signals.
Figure 5. Analysis of the Allan variance of PeRCEAS measure-                Figure 7 depicts the PeRCEAS eCL versus the NO con-
ments made in the laboratory: (a) 40 min of data from detector           centration obtained experimentally for inlet pressures be-
FH used for the calculations, (b) Allan variance for a mixture of        tween 200 and 350 mbar. As expected, the eCL decreases
5.6 ppbv of NO2 in air at 200 mbar and 23 ◦ C sampled by the AB,
                                                                         with increasing NO concentration. This is attributed to the in-
FH and FR PeRCEAS detectors. The solid and dashed lines show,
respectively, the theoretical behaviour of random noise (i.e. photon
                                                                         crease in the rate of the termination reactions forming HONO
shot noise) and the noise attributed to longer timescale drifts.         and CH3 ONO. The latter also causes the eCL to be lower
                                                                         for the 1 : 1 HO2 : CH3 O2 radical mixture. The experimen-
                                                                         tally determined eCL is higher for DUALER II, as expected
                                                                         from the reduction of radical losses in the pre-chamber re-
H2 O makes OH and H. In air, the H reacts with O2 in a ter-              spect to DUALER I. For a constant NO number concentra-
molecular reaction to make HO2 . The photolysis of oxygen                tion, eCL values increase with increasing pressure. The over-
molecules yield oxygen atoms (O), which react with O2 in a               all observed behaviour of eCL versus [NO] in these experi-
termolecular reaction to make O3 (Reichert et al., 2003). CO             ments is in good agreement with the results reported by Kar-
is added to the gas mixture in the source to convert the OH              tal et al. (2010).
into HO2 radicals. As a result, each absorbed photon by a                   A simple chemical box model was developed using the
water vapour molecule generates two HO2 molecules. Alter-                Kintecus software (Ianni, 2013, 2017; http://www.kintecus.
natively, the addition of a hydrocarbon (RH) leads to the con-           com, last access: 7 April 2020) to simulate the peroxy rad-
version of OH to a RO2 and consequently to a 1 : 1 mixture               ical amplification in the DUALER inlets. The model com-
of HO2 and RO2 for calibration. The concentration of HO2                 prises two consecutive modules to simulate the pre-chamber
or RO2 , and O3 is thus proportional to the intensity of the             and the reactors separately. The first module takes into ac-
184.9 nm electromagnetic radiation. As the absorption coef-              count radical terminating reactions prior to the addition of
ficient of N2 O (Cantrell et al., 1997) does not change signif-          reagent gases. The second module includes the relevant am-
icantly around 185 nm (σN2 O = 14.05 × 10⁻²⁰ cm2 molec.−1                plification and terminating reactions taking place in the reac-
at 25 ◦ C with a 0.02 × 10⁻²⁰ cm2 molec.−1 K−1 , temperature             tor, as listed in Table 1. The rate coefficients used are taken
dependency), different HO2 and RO2 radical amounts can be                from Burkholder et al. (2015). The first module is initialised
produced for a constant H2 O concentration. A flow reactor               with 50 pptv HO2 (6.07 × 10⁸ molec. cm−3 at 500 mbar) or a
providing a known amount of HO2 or RO∗2 in a laminar flow                50 pptv HO2 plus 50 pptv CH3 O2 mixture. The second mod-
is placed inside a pressure chamber, having a vacuum-sealed              ule is initialised with the radical output of the first module
connection to the DUALER inlet. This setup is described in               and calculates the eCL at different pressures for the condi-
detail elsewhere (Kartal et al., 2009; Horstjann et al., 2014).          tions used in the calibration setup at 500 mbar (9 % CO and
For the HO2 calibration configuration, the HO2 concentra-                3 ppbv O3 ) and a series of NO concentrations. According to
tions are calculated using                                               sensitivity studies, the amount of O3 used for initialising the
                                                                         model does not affect the eCL value calculated.
                                                                            As in previous work (Kartal, 2009; Chrobry, 2013), the
           σH184.9
              2O
                   nm
                            [H2 O]                                       radical wall loss rates (kw ) in the DUALER reactors are es-
[HO2 ] =                ×          × [O3 ].                     (3)
           σO184.9
              2
                   nm        [O2 ]                                       timated by using the expression from Murphy et al. (1987)

Atmos. Meas. Tech., 13, 2577–2600, 2020                                                    https://doi.org/10.5194/amt-13-2577-2020
M. George et al.: Airborne measurement of peroxy radicals 2585
Figure 6. Effect of varying room temperature on the ring-down time τ and the 1NO2 accuracy: (a) detector temperature, (b) τ for a
modulated NO2 flow and the corresponding NO2 mixing ratios, and (c) ratio of the measured to the set 1NO2 . The error bars in panel (c) are
estimates of the total uncertainty of the retrieved 1NO2 . The inset in panel (b) is a magnification of three modulation cycles. The first 20 s
of each signal after a change in the NO2 mixing ratio are not used in the analysis (see text).
and Hayman (1997) for a cylindrical reactor: ing ratios in the reactor at 300 mbar. Up to 10 ppmv NO
1/3 2/3 ([NO] 7.29 × 10¹³ molec. cm−3 ) the difference in sensitiv-
v D S ity remains within the PeRCEAS uncertainty. The ratio of
kw = 1.85 1/3 1/3
, (4)
d L V the eCLCH3 O2 /eCLHO2 is defined as α. Estimated values
of α from modelling and measurements are given in Ta-
where S is the surface area in cm2 , V the volume in cm3 , ble 2. For the assessment of air masses, the measurements of
L the length and d the diameter of the flow tube in cm, v HO2 + αRO2 , where αRO2 ≈ αCH3 O2 , are compared with
the velocity of the gas in cm s−1 , and D is the diffusion co- atmospheric model values of HO2 + α · RO2 .
efficient, calculated to be DHO2 = 0.21 and DCH3 O2 = 0.14 The present results confirm that the determination of the
in cm2 s−1 . eCL in the laboratory for each particular setup and measure-
Using Eq. (4) values for kwHO2 and kwCH3 O2 are estimated ment condition is essential.
to be, respectively, 0.97 and 0.74 s−1 for the DUALER reac-
tors at a pressure of 300 mbar. The kw for the pre-chamber 3.2.2 Conversion of ambient O3 into NO2
cannot be calculated by Eq. (4) due to its complex geome-
try and flow dynamics. Consequently, different values of kw As explained in Sect. 3.1, the simultaneous use of two de-
are used in module 1 to account for radical losses in the pre- tectors measuring out of phase results in the temporal res-
chamber matching the eCL obtained experimentally. olution of the RO∗2 data being 60 s. In this way, the hori-
Figure 8 shows the eCL obtained experimentally for the zontal resolution of the PeRCEAS airborne measurements,
DUALER II at 300 mbar inlet pressure, 500 mL min−1 sam- which depends on the speed and altitude of HALO, is typ-
ple flow and different NO mixing ratios added to the inlet. ically between 7 and 15 km. Modulation cycles longer than
The best agreement between modelled and experimental data 120 s result in noisy and unrepresentative averages for am-
is obtained for the calculated kw in the reactor, and 64 % bient measurements in air masses having significant short-
HO2 and 54 % CH3 O2 radical losses in the pre-chamber. This term variability of O3 and NO2 . To keep the temporal res-
is in agreement with previous results reported by Kartal et olution of the RO∗2 data equal to the mode time, a rapid
al. (2010) for a similar configuration. and complete conversion of ambient O3 into NO2 within
Table 2 summarises the simulated PeRCEAS sensitivity the PeRCEAS is required. For this, the NO concentration
for the HO2 and CH3 O2 detection for different NO mix- added at the inlet has to be sufficient for a complete titra-
https://doi.org/10.5194/amt-13-2577-2020 Atmos. Meas. Tech., 13, 2577–2600, 20202586 M. George et al.: Airborne measurement of peroxy radicals
Figure 7. eCL versus [NO] measured for (a) DUALER I and (b) DUALER II at inlet pressures between 200 and 350 mbar. The radical
source flow tube is held at a pressure of 500 mbar. The results from Horstjann et al. (2014) are also depicted for comparison.
tion of the sampled O3 before reaching the detector. Fig- thermal decomposition occurs at shorter timescales than the
ure 9 depicts the O3 decay simulated for 100 and 200 ppbv modulation time, they can be a significant interfering source
sampled O3 , i.e. 5 × 10¹¹ − 1.7 × 10¹² molec. cm−3 at 200 of radicals which are chemically amplified and lead to addi-
and 300 mbar, respectively, assuming the titration to be com- tional NO2 . In a rapidly changing background, the RO∗2 de-
pleted for a rest of [O3 ] = 5 × 10⁷ molec. cm−3 . The O3 termination might be affected depending on the temperatures
absorption at 408 nm is assumed to be a negligible source and sample residence times between the gas addition points
of systematic error. These results are in agreement with a in the DUALER (Table 3).
series of laboratory measurements made at 300 mbar for To evaluate this effect, the production of peroxy radicals
DUALER II with a total flow of 500 mL min−1 , as shown from the thermal decomposition of 1 ppbv PAN at different
in Fig. 10. After 8 s in PeRCEAS, the O3 is titrated for mix- temperatures and pressures has been simulated. The results
ing ratios above 10 ppmv at the conditions investigated (i.e. obtained with a box model (Ianini, 2003), including the reac-
4.83 × 10¹³ − 7.29 × 10¹³ molec. cm−3 at 200 and 300 mbar, tions
respectively). The sample residence times for both DUALER
CH3 COO2 NO2 → CH3 COO2 + NO2 (R1)
inlets are summarised in Table 3.
CH3 COO2 + NO → CH3 + CO2 + NO2 (R2)
3.2.3 Peroxyacyl nitrates thermal decomposition CH3 + O2 + M → CH3 O2 , (R3)
are depicted in Fig. 11. The rate coefficients used are taken
Peroxyacyl nitrates (RC(O)OONO2 ) such as PAN and from Burkholder et al. (2015).
peroxypropionyl nitrate can decompose thermally inside For the same temperature, the [CH3 O2 ] produced does not
PeRCEAS. The extent of the decomposition to peroxy rad- vary significantly at the pressures investigated. As the tem-
icals and NO2 depends on time and temperature. If the perature of the PeRCEAS reactors during flight generally re-
Atmos. Meas. Tech., 13, 2577–2600, 2020 https://doi.org/10.5194/amt-13-2577-2020M. George et al.: Airborne measurement of peroxy radicals 2587
Table 1. Reactions used in a box model for the eCL simulation in the DUALER inlet.
Amplification reactions k k0 n k∞ m
(cm3 molec.−1 s−1 ) (cm6 molec.−2 s−1 ) (cm3 molec.−1 s−1 )
HO2 + NO → NO2 + OH 8.0 × 10⁻¹²
CO + OH + M → HOCO + M 5.9 × 10⁻³³ 1.0 1.1 × 10⁻¹² −1.3
HOCO + O2 → HO2 + CO2 2.0 × 10⁻¹²
CO + OH → H + CO2 1.5 × 10⁻¹³
H + O2 + M → HO2 + M 4.4 × 10⁻³² 1.3 7.5 × 10⁻¹¹ −0.2
CH3 O2 + NO → CH3 O + NO2 7.7 × 10⁻¹²
CH3 O + O2 → CH2 O + HO2 1.9 × 10⁻¹⁵
Termination reactions k k k0 n k∞ m
(s−1 ) (cm3 molec.−1 s−1 ) (cm6 molec.−2 s−1 ) (cm3 molec.−1 s−1 )
OH + NO + M → HONO + M 7.0 × 10⁻³¹ 2.6 3.6 × 10⁻¹¹ 0.1
OH + NO2 + M → HNO3 + M 1.8 × 10⁻³⁰ 3.2 2.8 × 10⁻¹¹ 0.0
OH + NO2 + M → HOONO + M 1.0 × 10⁻³² 3.9 4.2 × 10⁻¹¹ 0.5
CH3 O + NO + M → CH3 ONO + M 2.3 × 10⁻²⁹ 2.8 3.8 × 10⁻¹¹ 0.6
OH + HO2 → H2 O + O2 1.1 × 10⁻¹⁰
HO2 + CH3 O2 → CH3 OOH + O2 5.2 × 10⁻¹²
OH + OH + M → H2 O2 + M 6.9 × 10⁻³¹ 1.0 2.6 × 10⁻¹¹ 0.0
OH + HONO → H2 O + NO2 4.5 × 10⁻¹²
CH3 O2 + CH3 O2 → CH3 O + CH3 O + O2 3.5 × 10⁻¹³
HO2 + HO2 → H2 O2 + O2 1.4 × 10⁻¹²
HO2 + NO2 + M → HO2 NO2 + M 1.9 × 10⁻³¹ 3.4 4.0 × 10⁻¹² 0.3
HO2 (g) → HO2 (s) 0.97
CH3 O2 (g) → CH3 O2 (s) 0.74
Other reactions k k0 n k∞ m
(cm3 molec.−1 s−1 ) (cm6 molec.−2 s−1 ) (cm3 molec.−1 s−1 )
O3 + NO → O2 + NO2 1.9 × 10⁻¹⁴
CH3 COO2 NO2 → CH3 COO2 + NO2 2.52 × 10¹⁶ exp(−1353/T )
CH3 COO2 + NO2 + M → CH3 COO2 NO2 9.7 × 10⁻²⁹ 5.6 9.3 × 10⁻¹² 1.5
CH3 COO2 + NO → CH3 + CO2 + NO2 2.0 × 10⁻¹¹
CH3 + O2 + M → CH3 O2 + M 4.0 × 10⁻³¹ 3.6 1.2 × 10⁻¹² −1.1
Table 2. PeRCEAS eCL simulated at 300 mbar for HO2 , CH3 O2 and a 1 : 1 radical mixture (eCLmix ).
NO [NO] eCLCH3 O2 eCLmix /eCLHO2 eCLmix /eCLHO2 α = eCLCH3 O2 /eCLHO2
(ppmv) molec. cm−3 modelled measured modelled
6 4.37 × 10¹³ 93.5 0.89 0.97 1.04
10 7.29 × 10¹³ 85.3 0.76 0.90 0.89
20 1.46 × 10¹⁴ 46.8 0.73 0.79 0.65
30 2.19 × 10¹⁴ 27.3 0.84 0.74 0.52
40 2.91 × 10¹⁴ 17.7 0.77 0.70 0.43
45 3.28 × 10¹⁴ 14.7 0.76 0.68 0.40
mains under 290 K, this source of radicals is considered to be 3.3 Operating pressure: radical losses and absolute
negligible for most operating conditions. The thermal stabil- humidity in DUALER
ity of the PAN analogues is similar to that of PAN but they
are usually at much lower concentrations than PAN in the at-
mosphere. They are therefore also assumed to be a negligible As explained in Sect. 2, the PeRCEAS operating pressure is
source of error. held constant and below ambient pressure to have a constant
radical chemical conversion in the DUALER reactors during
the flight. However, the 1P = Pambient − Pinlet is different at
different flight altitudes and leads to changes in the physical
losses and the humidity in the pre-chamber. These potentially
https://doi.org/10.5194/amt-13-2577-2020 Atmos. Meas. Tech., 13, 2577–2600, 20202588 M. George et al.: Airborne measurement of peroxy radicals
Table 3. Sample residence times in PeRCEAS for different operating total flows and pressures. Reactor residence time: residence time
between the first and the second addition points in each reactor; total residence time: residence time between the first addition point in each
reactor and the corresponding detector. The inner volumes up to the detector are 132 cm3 in DUALER I and 220 cm3 in DUALER II.
DUALER I
Inlet pressure (mbar) Reactor residence time (s) Total residence time (s)
300 mL min−1 500 mL min−1 1000 mL min−1 300 mL min−1 500 mL min−1 1000 mL min−1
300 6.55 3.93 1.96 7.82 4.69 2.35
200 4.36 2.62 1.31 5.21 3.13 1.56
160 3.49 2.10 1.05 4.17 2.50 1.25
100 2.18 1.31 0.65 2.61 1.56 0.78
80 1.75 1.05 0.52 2.09 1.25 0.63
50 1.09 0.65 0.33 1.30 0.78 0.39
DUALER II
Inlet pressure (mbar) Reactor residence time (s) Total residence time (s)
300 mL min−1 500 mL min−1 1000 mL min−1 300 mL min−1 500 mL min−1 1000 mL min−1
300 7.73 4.64 2.32 13.18 7.91 3.95
200 5.15 3.09 1.55 8.79 5.27 2.64
160 4.12 2.47 1.24 7.03 4.22 2.11
100 2.58 1.55 0.77 4.39 2.64 1.32
80 2.06 1.24 0.62 3.51 2.11 1.05
50 1.29 0.77 0.39 2.20 1.32 0.66
Figure 8. PeRCEAS eCL values retrieved experimentally at Figure 9. Time evolution of the O3 decay for different NO mixing
300 mbar for HO2 (red circles) and a 1 : 1 HO2 : CH3 O2 radical ratios added at the PeRCEAS reactors as simulated by a box model
mixture (blue circles) for different NO mixing ratios in DUALER for 200 and 300 mbar. OC1: 100 ppbv O3 at 200 mbar inlet pressure;
II. Modelled eCL values obtained for the same conditions are also OC2: 200 ppbv O3 at 200 mbar inlet pressure; OC3: 100 ppbv O3 at
depicted for comparison. The simulations use calculated values of 300 mbar inlet pressure; OC4: 200 ppbv O3 at 300 mbar inlet pres-
kwHO2 = 0.97 and kwCH3 O2 = 0.74 s−1 , and assume 64 % HO2 and sure. The sample residence times for 500 mL min−1 sample flow in
54 % CH3 O2 radical losses in the pre-chamber. the DUALER I and II are also depicted for reference.
may have a significant effect in the eCL, as reported by Kartal N2 ), sampling gas velocity (flow) and relative humidity in-
et al. (2010). variable.
To evaluate this effect for PeRCEAS, different 1P val- Figure 12 shows the variation of the eCL for 10 and
ues were experimentally generated by changing the pressure 45 ppmv NO within a pressure range of 50 mbar ≤ 1P ≤
in the pressure chamber while keeping inlet conditions like 600 mbar. As can be seen in the figure, the eCL remains
pressure, mixing ratios of the reagent gases (NO, CO and within 10 % of the mean value except for the values at
Atmos. Meas. Tech., 13, 2577–2600, 2020 https://doi.org/10.5194/amt-13-2577-2020M. George et al.: Airborne measurement of peroxy radicals 2589
mental error and confirmed the dependency of eCL on the
relative humidity. All these measurements were performed at
1 atm and for 3.3 ppmv NO ([NO] 8.12 × 10¹³ molec. cm−3 ).
In this work, radical mixtures were sampled at 25 ◦ C
for relative humidity between 2 % and 25 %. This leads
to approximately a factor of 20 increase in the absolute
[H2 O]. These conditions cover the [H2 O] expected for a
larger T range (−20 to 30 ◦ C) during airborne measure-
ments in the free troposphere at 200 and 300 mbar inlet pres-
sures. Figure 13 shows the [H2 O] in the air probed ver-
Figure 10. PeRCEAS measurement of O3 mixing ratios up to sus the [H2 O] in the inlet for real measurements aboard the
100 ppbv for different [NO] in the addition gas using DUALER II. HALO aircraft. The results in Fig. 14 for 45 ppmv ([NO]
NO is scaled in ppmv and molec. cm−3 . The O3 conversion is com- 3.28 × 10¹⁴ molec. cm−3 at 300 mbar) indicate that varia-
pleted when the NO2 measured /O3set ratio at the calibrator reaches tions in the sample humidity do not lead to additional un-
unity. R1: PeRCEAS reactor 1 (blue squares); R2: PeRCEAS reac- certainty in the RO∗2 retrieval, as the PeRCEAS eCL re-
tor 2 (red circles). mains invariable within the experimental error up to [H2 O] ∼
1.4 × 10¹⁷ molec. cm−3 . In contrast, for 10 and 30 ppmv NO
in the reactor ([NO] 7.29×10¹³ and 2.19×10¹⁴ molec. cm−3
at 300 mbar), the eCL shows a clear dependence on the ambi-
ent [H2 O]. The comparison with the eCL values obtained by
Reichert et al. (2003) at 1 atm indicates a eCL dependency
on [H2 O], temperature and pressure having a different pat-
tern for 45 ppmv NO in the reactor. This is explained by
invoking the competition in the amplification chain length
(CL) between HO2 and OH removal rates, as explained in
Hastie et al. (1991) and Reichert et al. (2003). At [NO]
∼ 3.28 × 10¹⁴ molec. cm−3 , the CL begins to be dominated
by the rate of the termination termolecular reaction of OH
with NO, which is independent of water vapour. This eCL
dependency has to be taken into account in the analysis of
ambient air RO∗2 measurements.
Figure 11. CH3 O2 radical production from the thermal decompo-
sition of 1 ppbv PAN as simulated by a box model between 288
and 298 K at 200 and 300 mbar. OC1: 288 K and 300 mbar; OC2:
288 K and 200 mbar; OC3: 293 K and 300 mbar; OC4: 293 K and 4 PeRCEAS RO∗2 determination: error calculation,
200 mbar; OC5: 298 K and 300 mbar; OC6: 298 K and 200 mbar. detection limit and accuracy
The sample residence times for 500 mL min−1 sample flow in the
DUALER I and II are also depicted for reference. The determination of RO∗2 concentrations from PeRCEAS
measurements is subject to two types of errors which either
(a) are intrinsic to the CRDS and PeRCA techniques and can
1P < 100 mbar. This might be the result of variations in the be characterised under controlled conditions in the laboratory
relative importance of terminating processes (e.g. wall losses or (b) result from the in-flight variability in the temperature,
versus chemical reactions) with the sample velocity through velocity and pressure conditions and cannot be readily repro-
the pre-chamber (Kartal et al., 2010), as indicated by the dif- duced in the laboratory.
ferences in the eCL pattern for NO 10 ppmv and 45 ppmv
below 100 mbar. Consequently 1P = 100 mbar is defined 4.1 Errors related to the CRDS technique
as the minimum operating pressure for PeRCEAS airborne
measurements. With this limitation, measurements of RO∗2 at Provided that the NO2 absorption is the dominant process
flight altitudes up to 12 km can be successfully made. leading to the extinction of light at ∼ 408 nm in the optical
The effect of changes in the sampled air humidity on cavity of each detector, the absorption coefficient can be cal-
the eCL has been reported and studied by Mihele and culated from Eq. (1) by considering τ1 and τ2 as the cav-
Hastie (1998) and Mihele et al. (1999). Reichert et al. (2003) ity ring-down times with and without a sample, respectively.
investigated the dependency of the eCL for ground-based However, the effective σNO2 , τ and τ0 can differ from one
measurements at 20 and 30 ◦ C, i.e. keeping the relative hu- detector to another.
midity but almost doubling the absolute water concentration. The effective σNO2 for each PeRCEAS NO2 detector has
The obtained eCL values did not differ within the experi- been determined by using the convolution of the NO2 absorp-
https://doi.org/10.5194/amt-13-2577-2020 Atmos. Meas. Tech., 13, 2577–2600, 20202590 M. George et al.: Airborne measurement of peroxy radicals
Figure 12. Dependency of eCL on 1P (1P = Pambient − Pinlet ) as determined for PeRCEAS under controlled laboratory conditions for
10 ppmv (squares) and 45 ppmv (circles) NO at 300 mbar inlet pressure. The error bars are 1σ deviation of eCL values obtained by identical
calibrations at each 1P .
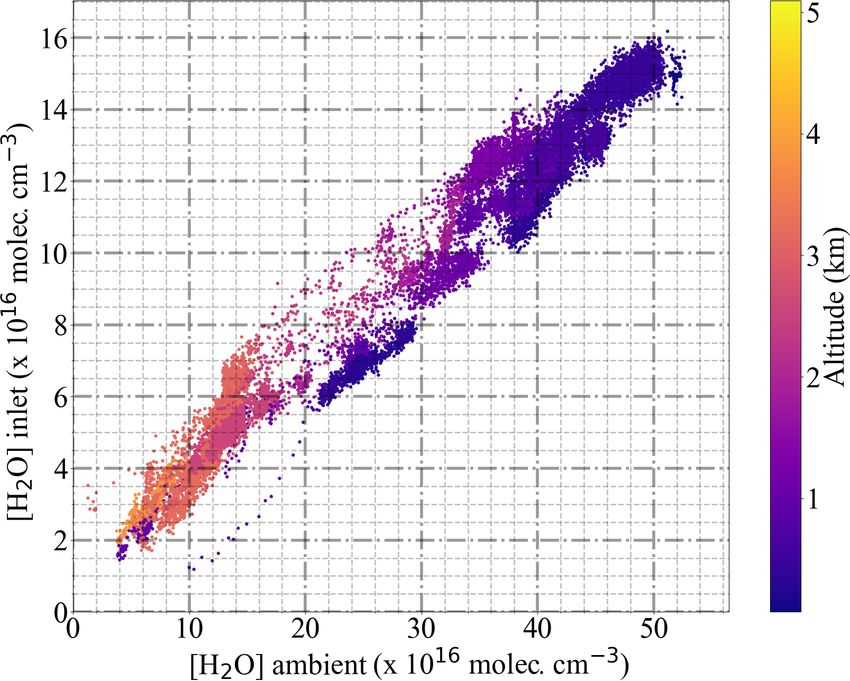
Figure 13. Comparison of the [H2 O] measured by the BAsic HALO
Measurement And Sensor system (BAHAMAS) instrument aboard
HALO and inside the DUALER inlet on 17 March 2018 during the
EMeRGe campaign in Asia. The colour scale indicates the altitude
of the aircraft during the measurement.
Figure 14. Dependency of PeRCEAS eCL (a) on inlet humidity
and (b) on [H2 O], at constant sampling flow, inlet pressure, 1P ,
tion cross section from Vandaele et al. (2002) with the nor- [CO] and [N2 ], measured at 300 mbar and for 10 ppmv (magenta),
malised laser spectra from the corresponding detector. The 30 ppmv (blue) and 45 ppmv (red) NO (respectively, 7.29 × 10¹³ ,
values obtained have been verified by regular sampling of 2.19 × 10¹⁴ and 3.28 × 10¹⁴ molec. cm−3 [NO]). The values from
Reichert et al. (2003) obtained for 3.3 ppmv NO at 1 atm (8.12 ×
NO2 mixtures of known concentration in synthetic air.
1013 molec. cm−3 [NO]) are also plotted for comparison.
The PeRCEAS lasers are operated at the maximum
100 mW power to achieve the best Gaussian profile for
the emission and are digitally modulated during operation.
The laser emission spectrum is measured periodically in of spectra obtained for the three PeRCEAS detectors is in-
the laboratory by using a calibrated spectrometer (AvaSpec- cluded in the Supplement (Fig. S1).
ULS2048x64; 295–535 nm grating; 0.132 nm resolution) to By integrating σNO2 under the normalised laser spectrum,
verify the long-term spectral stability. A sample comparison the effective σNO2 are calculated to be 6.0±0.3×10⁻¹⁹ , 6.3±
Atmos. Meas. Tech., 13, 2577–2600, 2020 https://doi.org/10.5194/amt-13-2577-2020M. George et al.: Airborne measurement of peroxy radicals 2591
Figure 15. Determination of the effective absorption cross section Figure 16. Experimental eCL determination of the DUALER II
(σNO2 ) from the measurement of mixtures of known concentration (a) reactor 1 and (b) reactor 2 from a series of six calibrations with
of NO2 in synthetic air. Values obtained for the PeRCEAS detec- generated mixing ratios of HO2 (blue) and a (1 : 1) HO2 : CH3 O2
tors: AB (red), FH (blue) and FR (green) at 200 mbar are indicated radical mixture (red) at 200 mbar inlet pressure, 300 mbar 1P and
in the plot. Linear fits are also shown by dashed lines. NO 30 ppmv within the inlet.
0.3 × 10⁻¹⁹ and 6.4 ± 0.3 × 10⁻¹⁹ cm2 molec.−1 for the AB,
FH and FR detectors, respectively. The errors are calculated The main sources of uncertainty in the eCL determination
from the 2σ variation in the 1 h average of 10 samples s−1 are the radical generation and the NO2 determination from
laser emission spectrum measured and the error reported for CRDS due to the accuracy of the σNO2 , which is estimated
the high-resolution NO2 spectra. to be 5 % (2σ ) (see Sect. 4.1). In the current setup, the gen-
According to Eq. (5), the effective NO2 absorption cross eration of peroxy radicals (Eq. 3) has a precision < 3 pptv
section is 1/c0 times the slope of the inverse of the measured (2σ ). Based on the experimental reproducibility of radical
τ versus the NO2 number concentration: calibrations the eCL precision is within 3 % under all condi-
tions investigated. In addition to this, the experimental de-
1 1 termination of eCL has a 15 % uncertainty, dominated by
= c0 σNO2 [NO2 ]x + . (5)
τx τ0 the 10 % uncertainty of both [O3 ] and σO184.9
2 eff
nm
determina-
The result of applying Eq. (5) to the PeRCEAS detectors is tions using the calibration setup (Creasy et al., 2000; Kartal
depicted in Fig. 15. The detectors sampled known mixtures et al., 2009). Other errors associated with the determination
of NO2 from commercial gas cylinders in synthetic air at of [H2 O] (0.05 %), [O2 ] (0.5 %) and the σH184.9
2O
nm
literature
200 mbar, as shown in the Supplement (Fig. S2). The effec- value (1.4 %) are significantly lower.
tive σNO2 obtained agrees within 5 % with the values derived Figure 16 shows the calculated eCL from six radical
by integrating σNO2 under the normalised laser spectrum as calibrations carried out over 6 months for 300 mbar pres-
described above. sure, 1P = 200 mbar and 1 % relative humidity, adding
The y intercept in Fig. 15 corresponds to 1/τ0 , which is reagent gases to achieve 9 % CO and 30 ppmv NO within
different for each detector. This is attributed to slight differ- the DUALER II inlet. For HO2 , the obtained eCL values are
ences in the mirror reflectivity and in the overall alignment 60±9 and 61±9 for reactor 1 and reactor 2, respectively. The
of the optical cavities. The value of τ0 for a particular de- eCL values for radical mixtures are 46±7 and 44±7, respec-
tector is not expected to vary significantly under laboratory tively. The errors refer to the experimental precision (2σ ) of
conditions. the measurements.
4.2 Errors related to the PeRCA technique 4.3 Errors related to in-flight variability of air
composition: DUALER approach and RO∗2
The determination of RO∗2 mixing ratios from the 1NO2 retrieval
measurement requires accurate knowledge of the eCL which
depends upon physical parameters, such as temperature, The in-flight dynamical stability of PeRCEAS is influenced
pressure, wall losses, residence time in the reactor and the by the stability of the sampling flows and pressures. This sta-
operating conditions, as discussed in Sect. 3. Generally, in- bility depends on pressure variations experienced by the in-
flight variations in the HALO cabin temperature minimally strument when the aircraft is turning, ascending or descend-
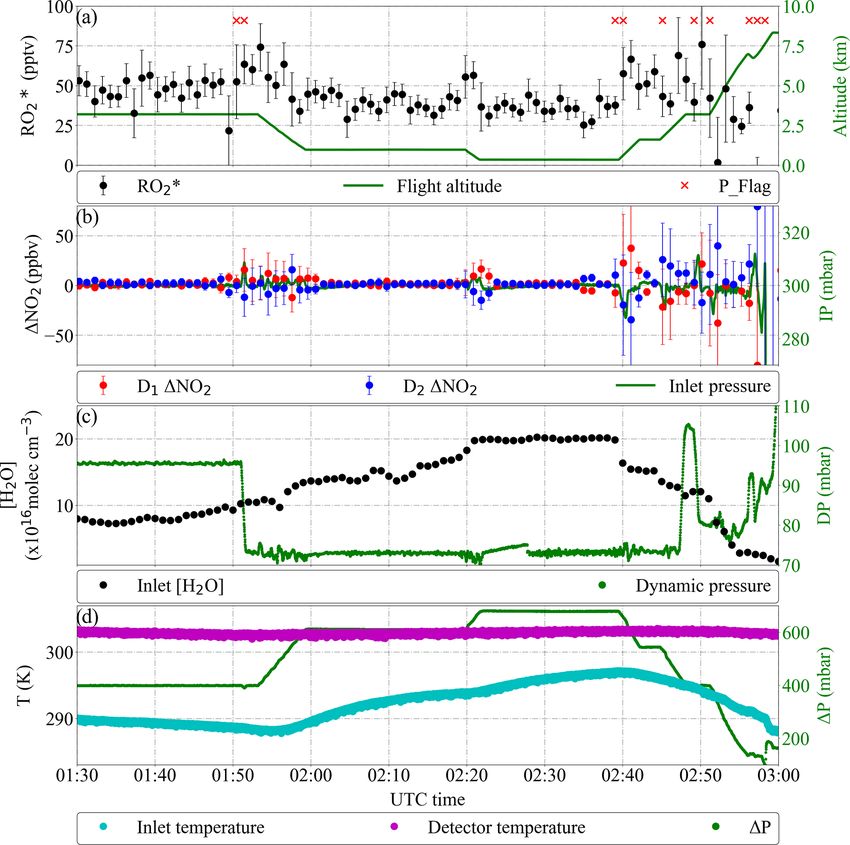
affect the accuracy of the RO∗2 determination. ing, as well as in the presence of turbulence. The noise in
https://doi.org/10.5194/amt-13-2577-2020 Atmos. Meas. Tech., 13, 2577–2600, 2020You can also read