Framework for collecting and processing georeferencing data
←
→
Page content transcription
If your browser does not render page correctly, please read the page content below
FACULDADE DE E NGENHARIA DA U NIVERSIDADE DO P ORTO

   Framework for collecting and
   processing georeferencing data

               Diogo Sampaio Duarte Cardoso

                      W ORKING VERSION

      Integrated Masters in Electrical and Computers Engineering

                Supervisor: Dr. Prof. Luís Paulo Reis
                    Second Supervisor: Artur Dias

                            March 3, 2020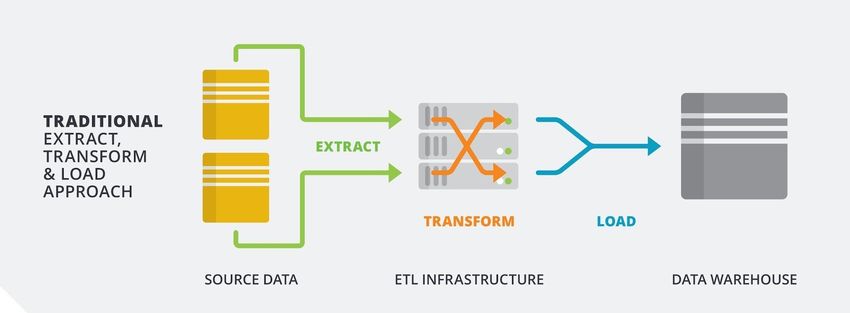
c Diogo Cardoso, 2019
Abstract

Unprecedented amounts of data are constantly being generated by all kind of sources, from the
connected digital ecosystem to the internet of things. The ability to take advantage of this amount
of data plays an important role in achieving successful business strategies. In order to do this,
ingesting large amounts of data into a central repository and processing it is the first step, before
any analytics, predictive modeling or reporting can be done.
    A use case for real-time data streams and processing is geolocation data. This facilitates the
tracking of a set of devices, from smartphones to GPS modules, which can be used to create an
overview of all the connected assets, in order to provide an easier and improved management
system. This can be combined with analytics and prediction models to provide extra data which
can backup and create new opportunities and improvements to the current workflows and
processes.
    In this dissertation, a framework for real-time data ingestion and consumption is designed
and implemented. The data ingestion infrastructure is reponsible for ingesting geolocation data
which is generated by GPS modules installed in a fleet of vehicles and smartphones, cleaning and
transforming such data to match the desired output data schema, and storing it in a database for
real-time and on-demand use cases.
    In order to present the geolocation data in real-time, a map-centered web application was
developed. This web application uses the real-time location of a fleet of vehicles to display markers
on a map, together with business data, which allows a operations team to extract more insights and
improve the scheduling and routing processes.
    To provide more control over costs and aid internal auditing processes that are connected with
vehicle metrics such as distances and durations, an automated report was created using a business
inteligence software. This report is generated daily and uses business data to calculate estimated
trips durations and distances, which are then compared with the actual trips durations and distances
that are stored through the ingestion framework.
    In summary, the geolocation data ingestion framework is the foundation for multiple
applications and use-cases. Some of these uses cases are described and implemented in this
dissertation, though there are many others. The goal is to provide a solid and scalable solution for
an infrastructure that is future-proof.

                                                  i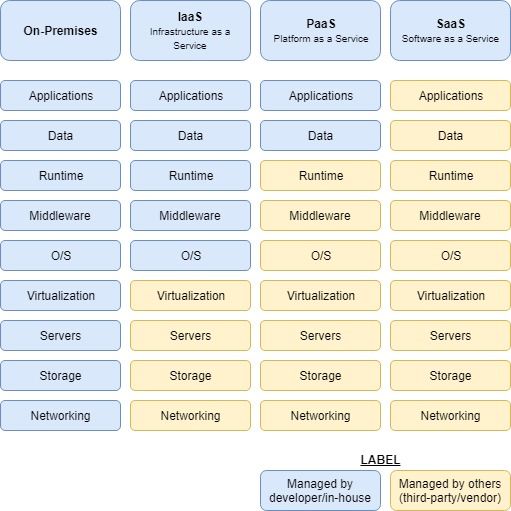
ii
Resumo

Hoje em dia, verifica-se uma quantidades de dados sem precedentes a ser constantemente gerada
por todos os tipos de fontes, desde o ecossistema digital à internet das coisas. A capacidade de tirar
proveito dessa quantidade de dados desempenha um papel importante na obtenção de estratégias
de negócios bem-sucedidas. Para isso, a ingestão de grandes quantidades de dados num repositório
central e o seu processamento são a primeira etapa, antes de qualquer análise, modelagem preditiva
ou relatório possa ser produzido.
    Um caso de uso para fluxos de dados em tempo real e processamento são dados de
geolocalização. Isto permite, por exemplo, o rastreamento de um conjunto de dispositivos, desde
smartphones a módulos de GPS, que podem ser usados, posteriormente, para criar uma visão
geral de todos os ativos conectados, a fim de fornecer um sistema de gestão melhorado e mais
avançado. Este tipo de sistemas podem ser combinados com modelos de análise e previsão para
fornecer mais dados que podem ajudar a justificar ou criar novas oportunidades, e aprimorar os
processos existentes.
    Nesta dissertação, é projetada e implementada uma framework para ingestão e consumo de
dados em tempo real. A infraestrutura de ingestão de dados é responsável pela ingestão de dados
de geolocalização gerados por módulos GPS instalados numa frota de veículos e smartphones,
pela transformação desses dados para fazer corresponder a estrutura de dados ao pretendido, e
pelo armazenamento em base de dados, para uso em tempo-real ou on-demand.
    Para apresentar os dados de geolocalização em tempo real, foi desenvolvida uma aplicação
web. A aplicação usa a localização em tempo real de uma frota de veículos para pintar marcadores
num mapa, juntamente com dados de negócio, o que permite que uma equipa de operações extraia
mais informações e melhore os processos de agendamento e cálculo de rotas.
    Foi também criado um relatório automatizado usando um software de business inteligence
que fornece métricas relacionadas com os veículos, como as distancias percorridas e durações das
viagens. Isto resulta num maior controlo sobre os custos do negócio e assiste em processos de
auditoria interna. Este relatório é gerado diariamente e usa dados do negócio para calcular as
durações e distâncias estimadas das viagens, que são comparadas com as durações e distâncias
reais das viagens.
    Em resumo, a framework de ingestão de dados de geolocalização é a base para várias
aplicações e pode ser usada para diversos fins. Alguns desses casos de uso são descritos e
implementados nesta dissertação, embora existam muitos outros. O objetivo é fornecer uma
solução sólida e escalável para uma infraestrutura preparada para o futuro.

                                                 iii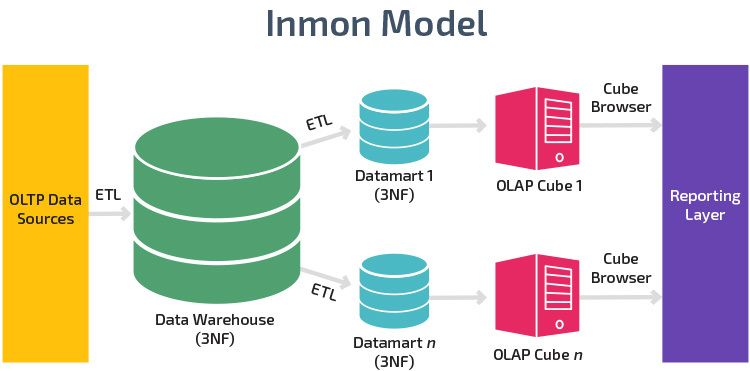
iv
Acknowledgments

To my parents, my brother and my grandparents for the support throughout the journey of
becoming an engineer, and life in general.
    To Wegho, the company where I worked the last 6 months, for providing the means to do my
dissertation and an healthy and enjoyable environment to work in. In particular, I’d like to thank
my co-supervisor Artur Dias, for his input on the numerous discussions we had, and support in
general.
    To my supervisor, Dr. Professor Luís Paulo Reis, for taking this dissertation and providing
support, feedback and ideas which allowed me to improve a lot.
    To all my friends, for accepting nothing less than excellence from me.
    To each and every one of you - Thank you.

Diogo Cardoso

                                                v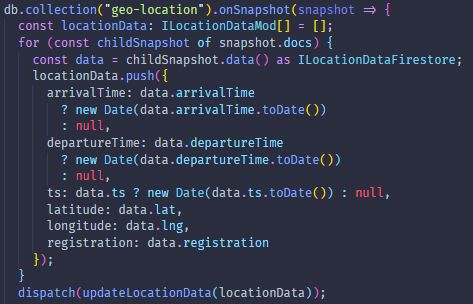
vi
“Luck is where opportunity meets preparation.”

                                         Seneca

vii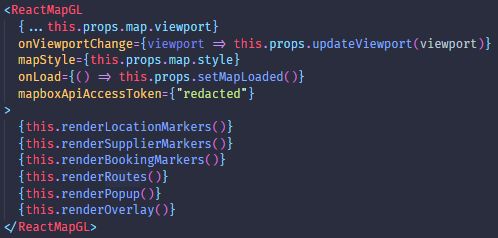
viii
Contents

1   Introduction                                                                                                                                                             1
    1.1 Context .    .   .   .   .   .   .   .   .   .   .   .   .   .   .   .   .   .   .   .   .   .   .   .   .   .   .   .   .   .   .   .   .   .   .   .   .   .   .   1
    1.2 Motivation   .   .   .   .   .   .   .   .   .   .   .   .   .   .   .   .   .   .   .   .   .   .   .   .   .   .   .   .   .   .   .   .   .   .   .   .   .   .   2
    1.3 Wegho . .    .   .   .   .   .   .   .   .   .   .   .   .   .   .   .   .   .   .   .   .   .   .   .   .   .   .   .   .   .   .   .   .   .   .   .   .   .   .   2
    1.4 Goals . .    .   .   .   .   .   .   .   .   .   .   .   .   .   .   .   .   .   .   .   .   .   .   .   .   .   .   .   .   .   .   .   .   .   .   .   .   .   .   2

2   State of the art                                                                                                                                                          5
    2.1 Big Data . . . . . . . . . . . . . . . . . . . . . . . .                                                 .   .   .   .   .   .   .   .   .   .   .   .   .   .   .    5
          2.1.1 Concept . . . . . . . . . . . . . . . . . . . .                                                  .   .   .   .   .   .   .   .   .   .   .   .   .   .   .    5
          2.1.2 Applications . . . . . . . . . . . . . . . . .                                                   .   .   .   .   .   .   .   .   .   .   .   .   .   .   .    6
    2.2 Cloud Service Models . . . . . . . . . . . . . . . . .                                                   .   .   .   .   .   .   .   .   .   .   .   .   .   .   .    7
          2.2.1 Introduction . . . . . . . . . . . . . . . . . .                                                 .   .   .   .   .   .   .   .   .   .   .   .   .   .   .    7
          2.2.2 SaaS: Software as a Service . . . . . . . . .                                                    .   .   .   .   .   .   .   .   .   .   .   .   .   .   .    8
          2.2.3 PaaS: Platform as a Service . . . . . . . . .                                                    .   .   .   .   .   .   .   .   .   .   .   .   .   .   .    9
          2.2.4 IaaS: infrastructure as a Service . . . . . . .                                                  .   .   .   .   .   .   .   .   .   .   .   .   .   .   .   10
          2.2.5 On-premise . . . . . . . . . . . . . . . . . .                                                   .   .   .   .   .   .   .   .   .   .   .   .   .   .   .   11
          2.2.6 Conclusion . . . . . . . . . . . . . . . . . .                                                   .   .   .   .   .   .   .   .   .   .   .   .   .   .   .   11
    2.3 Data Warehouse . . . . . . . . . . . . . . . . . . . .                                                   .   .   .   .   .   .   .   .   .   .   .   .   .   .   .   11
          2.3.1 Concept . . . . . . . . . . . . . . . . . . . .                                                  .   .   .   .   .   .   .   .   .   .   .   .   .   .   .   11
          2.3.2 Architecture . . . . . . . . . . . . . . . . . .                                                 .   .   .   .   .   .   .   .   .   .   .   .   .   .   .   12
          2.3.3 Design . . . . . . . . . . . . . . . . . . . .                                                   .   .   .   .   .   .   .   .   .   .   .   .   .   .   .   12
    2.4 Data Ingestion . . . . . . . . . . . . . . . . . . . . .                                                 .   .   .   .   .   .   .   .   .   .   .   .   .   .   .   14
          2.4.1 Data Ingestion Paradigms . . . . . . . . . .                                                     .   .   .   .   .   .   .   .   .   .   .   .   .   .   .   14
          2.4.2 Challenges . . . . . . . . . . . . . . . . . .                                                   .   .   .   .   .   .   .   .   .   .   .   .   .   .   .   15
          2.4.3 Evolution of distributed streaming platforms                                                     .   .   .   .   .   .   .   .   .   .   .   .   .   .   .   15
          2.4.4 Data processing . . . . . . . . . . . . . . . .                                                  .   .   .   .   .   .   .   .   .   .   .   .   .   .   .   16
                  2.4.4.1 Batch processing . . . . . . . . . .                                                   .   .   .   .   .   .   .   .   .   .   .   .   .   .   .   16
                  2.4.4.2 Stream processing . . . . . . . . .                                                    .   .   .   .   .   .   .   .   .   .   .   .   .   .   .   16
                  2.4.4.3 Micro-batching processing . . . .                                                      .   .   .   .   .   .   .   .   .   .   .   .   .   .   .   17
          2.4.5 Message brokers . . . . . . . . . . . . . . .                                                    .   .   .   .   .   .   .   .   .   .   .   .   .   .   .   17
    2.5 Data visualization . . . . . . . . . . . . . . . . . . .                                                 .   .   .   .   .   .   .   .   .   .   .   .   .   .   .   18
          2.5.1 Concept . . . . . . . . . . . . . . . . . . . .                                                  .   .   .   .   .   .   .   .   .   .   .   .   .   .   .   18
          2.5.2 Implementation . . . . . . . . . . . . . . . .                                                   .   .   .   .   .   .   .   .   .   .   .   .   .   .   .   18
                  2.5.2.1 Requirements . . . . . . . . . . .                                                     .   .   .   .   .   .   .   .   .   .   .   .   .   .   .   18
                  2.5.2.2 Techniques . . . . . . . . . . . . .                                                   .   .   .   .   .   .   .   .   .   .   .   .   .   .   .   19
          2.5.3 Challenges . . . . . . . . . . . . . . . . . .                                                   .   .   .   .   .   .   .   .   .   .   .   .   .   .   .   19
          2.5.4 Fleet tracking . . . . . . . . . . . . . . . . .                                                 .   .   .   .   .   .   .   .   .   .   .   .   .   .   .   19
                  2.5.4.1 Concept . . . . . . . . . . . . . .                                                    .   .   .   .   .   .   .   .   .   .   .   .   .   .   .   19

                                                                             ix
x CONTENTS
2.5.5 Tools . . . . . . . . . . . . . . . . . . . . . . . . . . . . . . . . . . . . 20
3 Development 23
3.1 Real Time Location . . . . . . . . . . . . . . . . . . . . . . . . . . . . . . . . . 23
3.1.1 Data Ingestion . . . . . . . . . . . . . . . . . . . . . . . . . . . . . . . 23
3.1.2 Data Transformation . . . . . . . . . . . . . . . . . . . . . . . . . . . . 27
3.1.3 Data Storage . . . . . . . . . . . . . . . . . . . . . . . . . . . . . . . . 27
3.2 Trips . . . . . . . . . . . . . . . . . . . . . . . . . . . . . . . . . . . . . . . . . 28
3.2.1 Data Ingestion . . . . . . . . . . . . . . . . . . . . . . . . . . . . . . . 28
3.2.2 Data Transformation . . . . . . . . . . . . . . . . . . . . . . . . . . . . 29
3.2.3 Data Storage . . . . . . . . . . . . . . . . . . . . . . . . . . . . . . . . 31
3.2.4 Report . . . . . . . . . . . . . . . . . . . . . . . . . . . . . . . . . . . . 32
3.3 Web Application . . . . . . . . . . . . . . . . . . . . . . . . . . . . . . . . . . 33
3.3.1 Technologies . . . . . . . . . . . . . . . . . . . . . . . . . . . . . . . . 33
3.3.1.1 Languages . . . . . . . . . . . . . . . . . . . . . . . . . . . . 33
3.3.1.2 Libraries and Frameworks . . . . . . . . . . . . . . . . . . . . 35
3.3.2 User Interface . . . . . . . . . . . . . . . . . . . . . . . . . . . . . . . . 38
3.3.3 Implementation . . . . . . . . . . . . . . . . . . . . . . . . . . . . . . . 39
3.3.3.1 Map . . . . . . . . . . . . . . . . . . . . . . . . . . . . . . . 39
3.3.3.2 Location . . . . . . . . . . . . . . . . . . . . . . . . . . . . . 40
3.3.3.3 Suppliers . . . . . . . . . . . . . . . . . . . . . . . . . . . . . 42
3.3.3.4 Bookings . . . . . . . . . . . . . . . . . . . . . . . . . . . . . 43
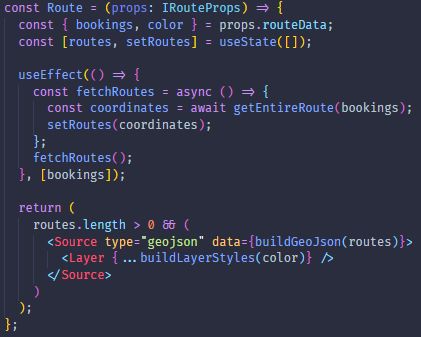
3.3.3.5 Routes . . . . . . . . . . . . . . . . . . . . . . . . . . . . . . 45
3.3.3.6 Timeline . . . . . . . . . . . . . . . . . . . . . . . . . . . . . 46
4 Tests and Results 49
4.1 Data Ingestion Framework . . . . . . . . . . . . . . . . . . . . . . . . . . . . . 49
4.2 Web Application . . . . . . . . . . . . . . . . . . . . . . . . . . . . . . . . . . 50
4.2.1 UI/UX . . . . . . . . . . . . . . . . . . . . . . . . . . . . . . . . . . . 50
4.3 Trips . . . . . . . . . . . . . . . . . . . . . . . . . . . . . . . . . . . . . . . . . 50
5 Conclusion 53
5.1 Main Contributions . . . . . . . . . . . . . . . . . . . . . . . . . . . . . . . . . 53
5.2 Future Work . . . . . . . . . . . . . . . . . . . . . . . . . . . . . . . . . . . . . 53
References 55List of Figures
2.1 Cloud Service Models . . . . . . . . . . . . . . . . . . . . . . . . . . . . . . . . 8
2.2 Data Warehouse architecture [1] . . . . . . . . . . . . . . . . . . . . . . . . . . 12
2.3 Inmon’s (top-down) design approach [2] . . . . . . . . . . . . . . . . . . . . . . 13
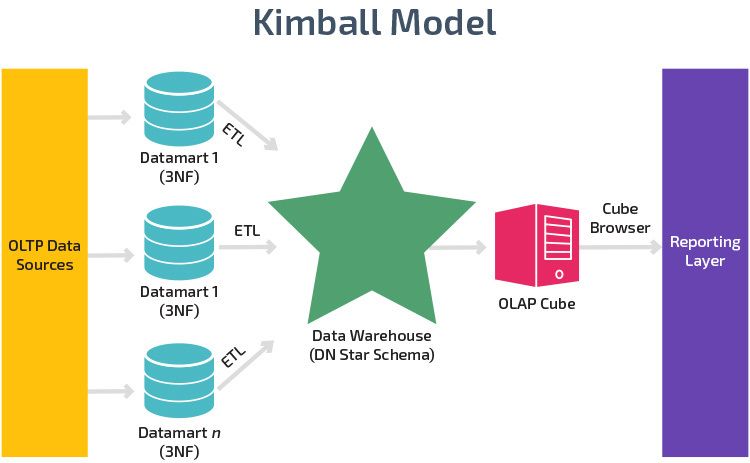
2.4 Kimball’s (bottom-up) design approach [2] . . . . . . . . . . . . . . . . . . . . 13
2.5 ETL paradigm . . . . . . . . . . . . . . . . . . . . . . . . . . . . . . . . . . . . 14
2.6 ELT paradigm . . . . . . . . . . . . . . . . . . . . . . . . . . . . . . . . . . . . 15
3.1 Google Cloud Functions overview [3] . . . . . . . . . . . . . . . . . . . . . . . 25
3.2 Using Pub/Sub as a bridge between Cloud Scheduler and Cloud Functions . . . . 25
3.3 Location function sequence diagram . . . . . . . . . . . . . . . . . . . . . . . . 26
3.4 Trips function sequence diagram . . . . . . . . . . . . . . . . . . . . . . . . . . 29
3.5 Sub-trip contained in a trip . . . . . . . . . . . . . . . . . . . . . . . . . . . . . 30
3.6 Sub-trip with different start timestamp . . . . . . . . . . . . . . . . . . . . . . . 30
3.7 Sub-trip with different end timestamp . . . . . . . . . . . . . . . . . . . . . . . 31
3.8 Trips Cloud Function . . . . . . . . . . . . . . . . . . . . . . . . . . . . . . . . 32
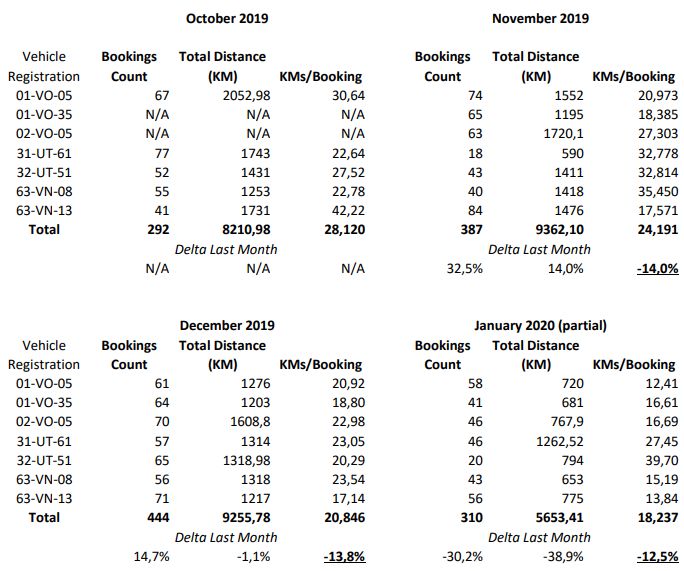
3.9 Trips Report (Power BI) . . . . . . . . . . . . . . . . . . . . . . . . . . . . . . 33
3.10 npm download stats for React, Angular, AngularJS and Vue[4] . . . . . . . . . . 36
3.11 React Virtual DOM [5] . . . . . . . . . . . . . . . . . . . . . . . . . . . . . . . 37
3.12 React one way data binding [6] . . . . . . . . . . . . . . . . . . . . . . . . . . . 38
3.13 UI prototype . . . . . . . . . . . . . . . . . . . . . . . . . . . . . . . . . . . . . 39
3.14 Map Component . . . . . . . . . . . . . . . . . . . . . . . . . . . . . . . . . . 40
3.15 subscribeToLocationData function . . . . . . . . . . . . . . . . . . . . . . . . . 41
3.16 Location feature . . . . . . . . . . . . . . . . . . . . . . . . . . . . . . . . . . . 41
3.17 Suppliers feature . . . . . . . . . . . . . . . . . . . . . . . . . . . . . . . . . . 43
3.18 Bookings feature . . . . . . . . . . . . . . . . . . . . . . . . . . . . . . . . . . 44
3.19 Route component . . . . . . . . . . . . . . . . . . . . . . . . . . . . . . . . . . 45
3.20 Routes feature . . . . . . . . . . . . . . . . . . . . . . . . . . . . . . . . . . . . 46
3.21 Timeline feature . . . . . . . . . . . . . . . . . . . . . . . . . . . . . . . . . . . 46
3.22 Unassigned bookings . . . . . . . . . . . . . . . . . . . . . . . . . . . . . . . . 47
3.23 Add Booking feature . . . . . . . . . . . . . . . . . . . . . . . . . . . . . . . . 48
4.1 Trips Results . . . . . . . . . . . . . . . . . . . . . . . . . . . . . . . . . . . . 51
xixii LIST OF FIGURES
List of Tables

 3.1    Request schema for get_vehicle_detailed_events endpoint . . . . .     .   .   .   .   .   .   .   .   23
 3.2    Response schema for get_vehicle_detailed_events endpoint . . . .      .   .   .   .   .   .   .   .   24
 3.3    CAN Bus events provided by get_vehicle_detailed_events . . . .        .   .   .   .   .   .   .   .   24
 3.4    Filtered response schema for get_vehicle_detailed_events endpoint     .   .   .   .   .   .   .   .   27
 3.5    Request schema for get_all_trips endpoint . . . . . . . . . . . . .   .   .   .   .   .   .   .   .   28
 3.6    Response schema for get_all_trips endpoint . . . . . . . . . . . .    .   .   .   .   .   .   .   .   28
 3.7    Filtered response schema for get_all_trips endpoint . . . . . . . .   .   .   .   .   .   .   .   .   29
 3.8    Request schema for GetSuppliers . . . . . . . . . . . . . . . . . .   .   .   .   .   .   .   .   .   42
 3.9    Response schema for GetSuppliers . . . . . . . . . . . . . . . . .    .   .   .   .   .   .   .   .   42
 3.10   Request schema for GetBookings . . . . . . . . . . . . . . . . . .    .   .   .   .   .   .   .   .   43
 3.11   Response schema for GetBookings . . . . . . . . . . . . . . . . .     .   .   .   .   .   .   .   .   44

                                             xiii
xiv LIST OF TABLES
Abbreviations

API    Application Programming Interface
BI     Business Inteligence
GPS    Global Positioning System
REST   Representational State Transfer
SOAP   Simple Object Access Protocol
UI     User Interface
UML    Unified Modeling Language
UX     User Experience

                                           xv
Chapter 1
Introduction
1.1 Context
The 21st century is being marked by the disruption of a large number of markets. The possibility
to change how things have always been done, go outside of the traditional ways and offer services
that the costumers have always dreamed of, is now becoming possible due to the available
technologies. New product development, more targeted marketing and better decision-making are
happening thanks to Big Data and cross-referencing information across multiple data sources.
Unprecedented amounts of data are constantly being generated by all kind of sources, from
the connected digital ecosystem to the internet of things. Since the 1980s, the capacity to store
information per-capita has nearly doubled every 40 months. In 2012, there were 2.5 exabytes of
data being generated every day. By 2025, this number is expected to be around 163 zettabytes.[7]
To make sense of this amount of data is not an easy task.
The ability to take advantage of this amount of data plays an important role in achieving
successful business strategies. In order to do this, ingesting large amounts of data into a central
repository and processing it is the first step, before any analytics, predictive modeling or reporting
can be done. A large part of data-driven applications rely on real-time data processing, mostly due
to the use of many connected resources such as internet of things, mobile devices, social networks
and sensors, which adds new challenges. Real-time processing requires continuous and sequential
transactions of limitless streams of input data, which is why it is critical that the Big Data streams
are processed with very short latency.
A use case for real-time data streams and processing is geolocation data. This facilitates the
tracking of a set of devices, from smartphones to GPS modules, which can be used to create an
overview of all the connected assets, in order to provide an easier and improved management
system. This can be combined with analytics and prediction models to provide extra data which
can backup and create new opportunities and improvements to the current workflows and
processes.
12 Introduction
1.2 Motivation
Wegho provides services to homes and offices, each having a team of 2 or 3 suppliers, that travel
using Wegho’s vehicle fleet. Most of the vehicles are equiped with GPS modules, provided by
CarTrack - a company specialized in vehicle location systems. The GPS modules transmit location
data and CAN events to a CarTrack server, which is accessible through a web application and a
SOAP API.
Until now, neither solution was actively being used by Wegho, due to several factors:
• The web application was developed several years ago, runs on Adobe Flash which is being
deprecated in 2020 [8], is extremelly slow and has a poor user experience. Its current use is
limited to alerts, in particular, for emergency scenarios such as theft.
• The lack of business data means that business insights and metrics are not easily obtained.
The web application doesn’t offer integration with external data sources so a real-time
overview of both the vehicles and services, and relevant metrics related to efficiency and
scheduling are not possible.
As Wegho’s focus shifts towards improving operational processes around its fleet and service
scheduling, the lack of a suitable tool was a big bottleneck.
Besides technical and logistic improvements, a fleet management system allows more control
over costs, opens the possibility of adopting a benefit program for suppliers which relies on
efficiency metrics, and integration with consumer products such as the mobile application.
1.3 Wegho
Wegho is a platform that provides services and connects services providers to costumers. Wegho
currently offers services in different areas such as cleaning, painting, plumbing, electrical and
fitness, though they are constantly adding new services. Wegho currently targets both B2C and
B2B channels and its services are available in Porto and Lisboa, Portugal.
1.4 Goals
In order to gain advantage over the competition through the analysis of data that originates from
their operations, Wegho is looking for a infrastructure to ingest and process data, which will feed
analytical models and generate analytics and reports. This data is mostly geolocation and
generated by GPS modules and smartphones.
The goal is to develop such infrastructure which is able to:
• Ingest data from multiple sources, such as GPS modules and smartphones, in real-time The
GPS modules equipped in every vehicle and the smartphones used by the service providers
generate geolocation data which should be ingested in real-time.1.4 Goals 3
• Process data in real-time All ingested data must be transformed and processed in real-time,
for different reasons. The ingested data schema may require cleaning in case of duplicates
or invalid data, transformation in case the output data schema does not match the input data
schema, or even to merge the geolocation data with Wegho’s operational data.
• Store data in a database In order to be able to do further data analysis, all data must be saved
in a database or data-warehouse.
• Design and implement an analytical model for vehicle/driver gas consumption Given the
geolocation data from the vehicles and the services, an analytical model should be able to
predict gas consumption per vehicle/driver.
This infrastructure will provide the foundation for multiple applications and tools - one of
which to replace CarTrack’s web application. This application will join the ingested geolocation
data with Wegho’s reference data. The main features of this web applications are:
• Real-time map with fleet, employees and services location
• Trips history
• Schedule services
Besides the web applications, there are other use cases such as:
• Real-time map with the location of the service provider, in the costumer’s app In order to
enhance the costumer’s experience and improve transparency, the location of the service
provider can be displayed in real-time in the costumer’s app, providing a more precise time
of arrival and enable notifications in case of unexpected delays.
• Update service location The service location can lack precision due to the use of reverse
geocoding [9] in the booking process. In order to update the location for future services,
the service provider’s mobile application can be used to access the phone’s GPS and get its
exact location.4 Introduction
Chapter 2

State of the art

In order to make the best decisions on the design and implementation of the system proposed in
this thesis, it is required to acquire knowledge of its related concepts, technologies, and previous
work and research. In this chapter, the goal is to describe the highest level of general development,
and the evolution of such level of development.

2.1      Big Data

2.1.1     Concept

Big Data refers to the large, diverse collection of data that grows at ever-increasing rates. While
the act of ingesting and storing large amounts of information is not new, the concept of Big Data
gained momentum in the early 2000s when industry analyst Doug Laney defined Big Data as the
“three V’s” [10]:

   • Volume: refers to the amount of generated and stored data. Organizations collect huge
        amounts of data from a variety of sources, which range from terabytes to petabytes of data.
        Data size determines the potential value of the data, and whether it can be considered Big
        Data or not.

   • Variety: refers to the different types and nature of the data. Data comes in all types of
        formats from a wide range of sources - from structured, numerical data in traditional
        databases to unstructured text documents, emails, photos, videos, etc. This variety of
        unstructured data adds new challenges to storage, mining and data analysis processes.

   • Velocity: refers to the speed at which new data is generated and ingested. Data streams are
        coming in at unprecedented speeds and must be dealt with in a timely manner. How fast the
        data is generated and processed determines the real potential in the data.

    With the growing adoption of Big Data in recent years, two concepts were added to what is
now refered as the “five V’s” of Big Data [11].

                                                  5
6 State of the art
• Veracity: refers to the trustworthiness of the data. With huge amounts of unstructured data
being generated, the quality and accuracy of such data is less controllable, though usually
volume makes up for the lack of quality or accuracy.
• Value: refers to the real value provided to the business. Extracting value from Big Data is
not an easy task, but it is important to measure the impact of the results and insights gathered
from all the data.
2.1.2 Applications
The primary goal of Big Data applications is to help businesses in decision making by relying
on data analysis which can be in the form of logs, activity reports, statistics or analytical models.
More and more organizations are leveraging the benefits provided by Big Data applications such
as enhancing customer experience, cost reductions, better targeted marketing or making existing
processes more efficient. Examples of industry domains that use Big Data include healthcare,
government and media. Below is a description of how Big Data is used in these industries and the
challenges they face in the adoption of Big Data applications.
• Healthcare
The healthcare sector has access to huge amounts of data but has been lagged in using
Big Data, because of limited ability of standardize and consolidate data. Other challenges
include the use of data from different readily available sensors. Some of the ways in which
Big Data has contributed to healthcare include:
– Reduction on costs of treatment since there is less chances of having to perform
unnecessary diagnosis
– Epidemic outbreaks prediction and setting up preventive measures
– Detection of preventable diseases in early stages which prevents them from getting
worse which in turn makes their treatment easier and more effective.
– Identification of drug’s side-effects
• Government
In governments, the adoption and use of Big Data creates opportunities to reduce costs and
increase productivity and innovation. Since governments act on a variety of different
domains, Big Data has a wide range of applications, namely energy exploration, financial
market analysis, cyber security, transportation management and homeland security. The
biggest challenges is the integration and interoperability of Big Data across different
government departments and affiliated organizations, since the same data sets are often
used between them.
• Media and Entertainment2.2 Cloud Service Models 7
In the media and entertainment industry, the generation of large amounts of data is
inevitable. Internet connect devices and social media platforms are widely used and
continue to grow. Their goal is to serve content and messages that are in line with the
consumer’s mindset which is achieved by simultaneously analyzing costumer data along
with behavioral data. Some of the benefits extracted from Big Data include:
– Predicting the interests of audiences
– Getting insights from customer reviews
– Measure content performance
2.2 Cloud Service Models
2.2.1 Introduction
Thanks to the cloud, companies are now able to not only distribute developments remotely, but also
deploy them online. It also allowed users to access a wide variety of applications on-demand. In
cloud computing, these are known as "as-a-service" and are commonly identified with an acronym
ending in "aaS". Before these services were made available, the only option was to use an "on-
premises" solution, which takes a lot of time and resources.
Considering that all systems involved in this project require some sort of infrastructures, it is
important to understand the differences and advantages of the various deployment models.
There are three main "as-a-service" models:
• Software as a Service (SaaS)
• Platform as a Service (PaaS)
• Infrastructure as a Service (IaaS)
A summary of the key differences between these models and the legacy on-premise model is
shown below.8 State of the art
Figure 2.1: Cloud Service Models
2.2.2 SaaS: Software as a Service
Also known as cloud application services, this model represents the most used option for
businesses in the cloud market. SaaS relies on the internet to deliver applications, which are
managed by a third-party. Most of these applications run directly on a web browser and usually
don’t require any downloads or installation on the client side.
• Delivery
SaaS usually eliminates the need to download, install and manage applications on every
computer, which would require extra IT staff. Vendors manage all of the potential technical
issues, such as data, middleware, servers, and storage, allowing business to streamline their
maintenance and support.
• Advantages2.2 Cloud Service Models 9
Due to its delivery model, SaaS allows business to reduce the time and money spent on
IT staff to do the tedious tasks of download, install and upgrade applications. This allows
the company to focus on more pressing matters and issues. Most SaaS providers operate
a subscription model with a fixed, inclusive monthly fee, which makes it easier to budget
accordingly.
• Characteristics
– Centralized management
– Hosted on a remote server by a third-party provider
– Available over the internet
– Users are not responsible for hardware or software updates
• Use cases
– Startups and small companies and don’t want to allocate time and money for server
issues or software
– Short-time projects
– Low usage applications
– Applications that require both web and mobile access
• Examples
– Google Suite [12], Dropbox [13], Salesforce [14], GoToMeeting [15]
2.2.3 PaaS: Platform as a Service
PaaS or cloud platform services, provide a wide range of cloud components and are mainly
consumed by applications. By using PaaS, developers rely on frameworks supplied by the
provider to build and create customized applications. The servers, storage and networking can be
managed in-house or by a third-party while developers can maintain control of the applications.
• Delivery
While similar to the previous model, PaaS provides a platform for software development
instead of the software itself. This platform is delivered over the internet and allows
developers to focus on building the software while not having to worry about operating
systems, software updates, storage or infrastructure.
• Advantages
– Makes the development and deployment of applications a simple and cost-effective
process.
– Scalable10 State of the art
– Highly available
– Greatly reduces the amount of coding, saving a lot of time and money
• Characteristics
– Resources can be easily scaled up or down as your business changes
– Provides a set of services which assist with the development, testing and deployment
of applications
– Easy to run without extensive system administration knowledge
• Examples
– AWS Elastic Beanstalk [16], Heroku [17], Google App Engine [18], OpenShift [19]
2.2.4 IaaS: infrastructure as a Service
IaaS or cloud infrastructure services, consist in highly scalable pay-as-you-go services such as
storage, networking, and storage, via virtualization. It’s a self-service model in the sense that
allows businesses to access and monitor things like servers, networking, storage, and other
services, and it allows them to purchase resources on-demand instead of having to invest in
expensive on-premise resources.
• Delivery
The infrastructure provided by these services usually include servers, network, operating
systems, and storage, through virtualization technology. These cloud servers are usually
accessible through a dashboard or an API, which provide full-access to the infrastructure.
IaaS offers the same capabilities as a traditional data center without having to manage or
maintain all of it, which is costly and labor-intensive.
• Advantages
– Flexible and highly scalable
– On-demand resources
– Complete control over the infrastructure
– Accessible by multiple users
– Cost-effective
• Characteristics
– Resources are available as a service
– Services are highly scalable
– Offers complete control over the infrastructure
– Flexible and dynamic, as they can be replaced at any time2.3 Data Warehouse 11
• Examples
– Digital Ocean [20], Linode [21], AWS EC2 [22], Google Compute Engine [23]
2.2.5 On-premise
Before cloud computing solutions were made available, companies had to rely on on-premise
solutions which can be costly in terms of hardware and maintenance. This model is usually not as
scalable as cloud services, since it requires hardware updates, and in a situation of downgrade, it
results in resource wasting. Although this type of hosting is not used in most situations nowadays,
there are still certain companies that benefit from it. Industries and services like healthcare and
financial services companies are usually required to have their infrastructure hosted locally or on
an authorized local third-party provider as they are required to collect, store, and process private
data. Public and government institutions also usually require on-premise infrastructures as a matter
of national security.
2.2.6 Conclusion
The increasing popularity of IaaS, PaaS, and SaaS is reducing the need for on-premise hosting. Its
crucial for a business to understand the differences between each model and choose accordingly.
Each model offers different features and functionalities and different levels of control over the
entire system which on-premise hosting cannot provide.
• IaaS provides the most flexibility, specially when building custom applications, as well as
providing a general data center for storage.
• PaaS is built on top of an IaaS platform in order to reduce the need for system administration.
It allows developers to focus on the development of the application instead of infrastructure
management.
• SaaS offers ready-to-use, out-of-the-box solutions that meet a particular business need.
Usually built on top of IaaS or PaaS platforms.
2.3 Data Warehouse
2.3.1 Concept
A data warehouse (DW), also known as enterprise data warehouse (EDW), is a core component of
business intelligence, which enables data consolidation, analysis and reporting. It integrates data
from multiple sources, usually on a regular frequency, in a central repository. In a data-centric
age, data and analytics provide a lot of value to businesses in order to stay competitive. The
use of reports, dashboards, and analytics tools to extract insights from their data, allows them to
monitor business performance and support decision making. These resources are powered by data12 State of the art
warehouses, which store data efficiently and deliver query results at fast speeds, to multiple users
concurrently.
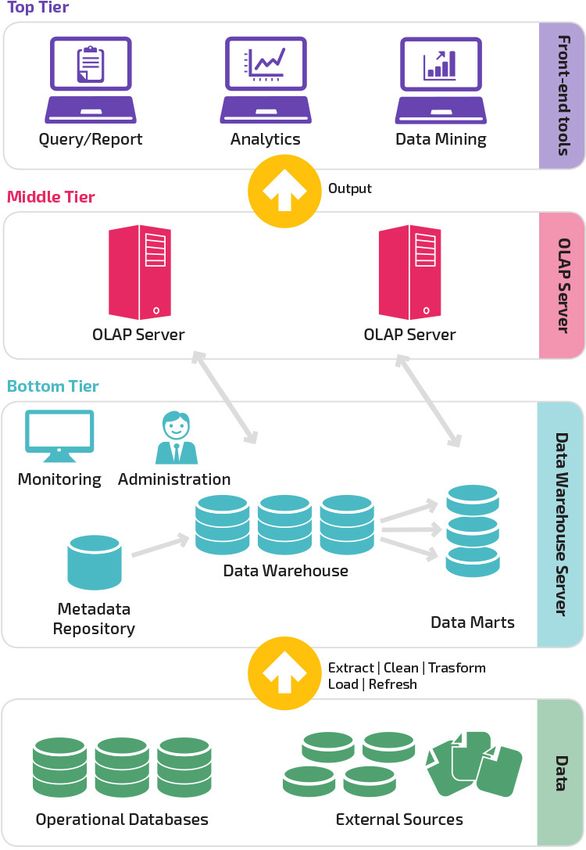
2.3.2 Architecture
Traditional data warehouses are typically structured in three tiers:
• Bottom tier: a database server, usually a RDBMS, that stores extracted data from different
sources
• Middle tier: an OLAP or OLTP server that implements the operations, transforming the data
• Top tier: query and reporting tools for analysis and business intelligence
Figure 2.2: Data Warehouse architecture [1]
2.3.3 Design
When designing a DW, there are three approaches worth considering:2.3 Data Warehouse 13
• Top-down: also known as the Inmon approach [2], its where the data warehouse is built
first and is seen as the core component of the analytical environment. Data is extracted,
summarized and distributed from the centralized warehouse to one or more data marts.
Figure 2.3: Inmon’s (top-down) design approach [2]
• Bottom-up: also know as the Kimball approach [2], its where data marts are created first.
Each data mart focuses on a specific business process, and are later integrated using a data
warehouse bus architecture.
Figure 2.4: Kimball’s (bottom-up) design approach [2]
• Hybrid: this approach includes aspects from both the top-down and bottom-up methods. It
seeks to combine the speed of the bottom-up approach with the integration achieved in a
top-down design.14 State of the art
2.4 Data Ingestion
Data ingestion is a process by which data is moved from one or more sources to a destination,
whether for immediate use or stored for further analysis. Sources may be in-house applications,
databases, SaaS, or anything capable of generating data. The destination is typically a data
warehouse, data mart, database, or a document store. Incoming data may be in different formats
and usually requires cleaning and transformation in order to be analyzed together with data from
other sources. Data can be ingested in batches or streamed in real-time. When data is ingested in
batches, data items are imported regularly in scheduled intervals, which is useful to generate logs
or reports. When data is ingested in real time, each item is imported as it is emitted by the source,
which is useful when the information is time-sensitive such as in monitoring critical systems. An
efficient data ingestion process starts by prioritizing data sources, validating individual files and
routing data items to the correct destination.
2.4.1 Data Ingestion Paradigms
For a long time, data ingestion paradigms would rely on an extract, transform and load (ETL)
procedure, in which data is taken from the source, manipulated to fit the schema of the destination
system or the needs of the business, then added to that system.
Figure 2.5: ETL paradigm
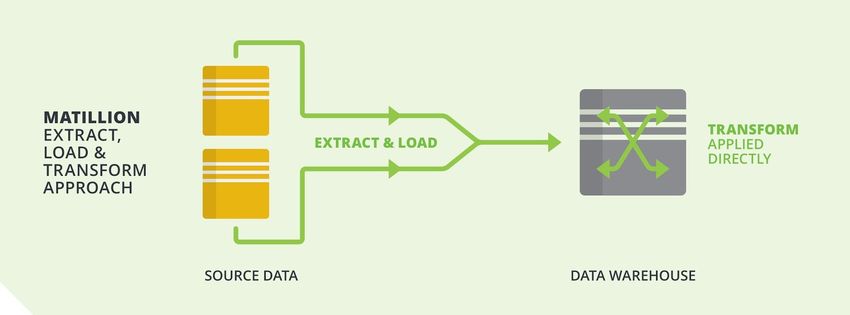
Today, cloud data warehouses like Amazon Redshift [24], Google BigQuery [25] and
Microsoft Azure SQL Data Warehouse [26] can scale compute and storage resources in a matter
of seconds or minutes in a cost-effective way. This allows data engineers to skip the
transformations step and load all the raw data into the storage system. This raw data can then be
transformed by using SQL at query time. This new approach has changed ETL into ELT, which
is an efficient way to replicate data in a cloud infrastructure.2.4 Data Ingestion 15
Figure 2.6: ELT paradigm
ETL is not only used to replicate data to a cloud platform, but it removes the need to write
complex transformations as part of the data pipeline. Most importantly, ETL gives different teams
the freedom to develop ad-hoc transformations according to their particular needs.
2.4.2 Challenges
One of the main aspects of delivering value though the use of BI tools, analytics or any insights
powered by data pipelines, is to ensure data is being ingested efficiently. A faulty ingestion pipe
can emit incomplete and inaccurate data, which will result in errors. It’s important to know the
limitations and properly design the ingestion platform before the actual implementation. Some of
the main challenges are described below:
• Multiple source ingestion
In order to draw better insights from combined data, it’s important to define what data is
needed and how it can be transformed and ingested into different systems. This also includes
the definition of the best data store and format to store the data in.
• Scaling
Heavy-data applications can have a very fast growth in terms of velocity and volume of data.
To mitigate this, it’s important that companies realize the need to scale up before choosing
the solution they are planning to adopt, for example, between on-promises or a managed
service.
• Moving data
Data must be transported and processed between the sources and the destination. There are
primarily two approaches to this: batch jobs and streams. The choice between these
approaches depends mainly on the necessity of real-time analysis. A more in-depth
explanation is presented on the next section.
2.4.3 Evolution of distributed streaming platforms
Due to the rapidly expanding data scale, distributed streaming platforms have been under
research for over a decade. Most of the early research focused on single-node systems such as16 State of the art
Aurora [27], which are currently outdated due to their inefficiency. The introduction of
MapReduce [28] has revolutionized modern distributed streaming platforms given its scalability
and fault-tolerance features. MapReduce has become the core of multiple data stream processing
frameworks such as S4 from Yahoo [29], Apache Storm [30], Apache Samza [31], Apache Spark
[32] and TimeStream from Microsoft [33]. Although most of these solutions are widely used,
they are built for batch-processing applications. Due to the requirements of low-latency
high-update frequency data streams, stream-processing platforms, such as Apache Kafka
Streams [34], Apache Spark and Apache Druid [35], have been developed to better fit this need.
2.4.4 Data processing
2.4.4.1 Batch processing
The analysis of large sets of data, which are collected over past time periods, is done with batch
processing. This is the most common approach to data ingestion. In this approach, the ingestion
layer collects and groups source data periodically and sends it to the destination system. The
groups of data can be defined in multiple ways: any logical ordering, conditional, scheduled or by
size. Batch processing is used when data is not time-sensitive and there’s no need for real-time
analysis, which usually results in an easier and more affordable solution than streaming ingestion.
2.4.4.1.1 MapReduce
MapReduce is a programming paradigm that enables processing and generating Big Data with a
parallel, distributed algorithm on a cluster. The term "MapReduce" refers to two different and
separate tasks. The first is the map job, which processes tuples by running a user-defined mapping
function, usually filtering and sorting, and generates a new, intermediate tuple for the reduce job.
This reduce job performs a summary operation, usually merging intermediate values associated
with the same key.
The "MapReduce Framework" orchestrates the processing of data by automatically running
tasks in parallel, managing all communications and data transfers between multiple sources and
destinations, between multiple distributed servers, and also providing redundancy and fault
tolerance features.
Though multiple libraries have been written in many programming languages, with different
levels of optimization, the most popular implementation of this model is the open-source
software Apache Hadoop [36]. Most cloud providers offer PaaS solutions based on Hadoop:
AWS EMR [37], Google Cloud Dataproc [38] and Microsoft Azure HDInsight [39].
2.4.4.2 Stream processing
A stream-based application needs to be able to ingest, process and analyze data in real-time, and,
in many cases, combine multiple streams, both live (unbounded streams) and archived (bounded
streams), in order to provider better insights. To this end, Big Data processing runtimes (eg:2.4 Data Ingestion 17
Apache Spark, Apache Kafka Streams and Apache Druid) designed for both batch and stream
processing are being widely adopted and replacing more traditional batch-oriented processing
models (eg: MapReduce, Hadoop) that are unable to fulfil the requirements of low-latency high-
update frequency data streams. Some PaaS solutions include Amazon MSK [40], Confluent Cloud
on GCP [41] and Microsoft Azure HDInsight.
2.4.4.3 Micro-batching processing
Some streaming platforms (such as Apache Spark Streaming) also use batch processing. The
difference is that ingested groups of data are smaller or prepared at shorter intervals, though not
processed individually like in pure streaming platforms. This type of processing is often called
micro-batching.
2.4.5 Message brokers
To make the process of data exchange simple and reliable, communication between sources and
data processing platforms usually rely on message brokers. These message brokers can act as a
buffer for messages, to ensure a logical order between incoming messages, and route the messages
to multiple applications or users. It effectively creates a centralized store for data which becomes
the source of truth.
For a distributed architecture, there are four typical message patterns that are widely used [42]:
• PAIR: communication is established strictly within one-to-one peers
• Client/Server: server distributes messages according to client’s requests
• Push/Pull: messages are distributed to multiple processors, arranged in pipeline
• Pub/Sub: connects a set of publishers to a set of subscribers
In a context of data ingestion, not all four patterns are suitable for stream processing, which
needs to handle high velocity and large volume of data. The PAIR message pattern clearly limits
the distribution of large volume of messages since it distributes messages on an one-to-one basis,
which makes it not suitable for a processing node due to unpredictable nature of data content and
format. The above mentioned problem also affects the Client/Server pattern. The remaining two
patterns - Push/Pull and Pub/Sub - are the common choice for stream processing systems. The
Push/Pull pattern is a one-way stream processing pattern, where the upstream nodes invoke the
downstream nodes when they are finished processing tasks. This means that streams can go
through several processing stages, depending on the number of consumers, and no messages are
sent upstream. Pub/Sub is the most popular messaging pattern. Systems that implement this
pattern have a broker that manages the distribution of messages, by matching the topics
subscribed by receivers to the topics published by producers. Any application can be a subscriber
or a publisher, and the broker will always transmit the topics from the publisher’s end to the
subscribers’ end.18 State of the art
There are various message brokers available, being the most popular Apache Kafka and
RabbitMQ [43]. There are also PaaS solutions namely Amazon Kinesis [44], Google Cloud
PubSub [45] and Microsoft Azure Event Hub [46].
2.5 Data visualization
2.5.1 Concept
As seen in the section Big Data 2.1, the amount of data being created is growing every year, and
shows no sign of slowing down. Even if the data pipeline is properly designed and implemented,
this data is only useful if valuable insights can be extracted from it and acted upon. Data
visualization is the representation of data in a graphical format. Its purpose it to make it easier to
understand data values and communicate important concepts and ideas. Although this is not the
only way to analyze data, data visualization offers a fast and effective way to:
• Interpret information quickly: using a graphical representation allows businesses to interpret
large amounts of data in clear, cohesive ways and draw conclusions from that data. Given
the way the human brain works, the analysis of data in graphical form is usually easier and
faster than looking at spreadsheets or reports with hundreds of lines.
• Spot trends: spotting trends in large amounts of data is usually hard, specially when there
are multiple sources. Big Data visualization techniques can make it easy to spot these trends
and give businesses an edge over the competition.
• Identify correlations: a data visualization tool allows businesses to not only get answers to
their questions, but also to discover what unexpected insights the data can reveal. Identifying
relationships and unexpected patterns in data can provide huge value to businesses.
• Present the data to others: When new insights are uncovered, usually the next step is to
present those insights to others. The use of a graphical representation provides an effective
and easy way to understand and gets the message across quickly.
2.5.2 Implementation
2.5.2.1 Requirements
Before adopting any data visualization tools, it’s necessary to have a solid grasp on the data,
and define the goals, needs and audience of such tools. In order to prepare a business for data
visualization technologies, some requirements should be met.
• Understand the data, including its size and cardinality (the uniqueness of data values)
• Determine what metrics and information should be visualized
• Know the target audience and how it processes visual information
• Use visuals that get the message across quickly, in an effective and easy way2.5 Data visualization 19
2.5.2.2 Techniques
One of the biggest challenges with data visualization is choosing the most effective way to
visualize the data to surface any insights it may contain. In some cases, simple BI tools such as
pie charts or histograms may show the whole picture, but with large and diverse data sets, more
advanced and complex visualization techniques may be more appropriate. Some examples of
data visualization techniques include:
• Linear: Lists of items.
• 2D/Planar/geospatial: Cartograms, dot distribution maps, symbol maps, contour maps.
• 3D/Volumetric: 3D computer models/simulations.
• Temporal: Timelines, time series charts, scatter plots.
• Multidimensional: Pie charts, histograms, tag clouds, bar charts, tree maps, heat maps.
• Tree/hierarchical: Dendrograms, radial tree charts, hyperbolic tree charts.
2.5.3 Challenges
Big Data visualization can provide a lot of value to businesses, but before being able to take
advantage of it, some issues need to be addressed. These include:
• Data quality: The insights provided by Big Data visualization are only as accurate as the
data that is being visualized. If the data is inaccurate or out of date, then any insights that
result from it are not reliable.
• Hardware resources: Big Data visualization is essentially a computing task, which can be
more or less demanding depending on the type of analysis required. This may demand the
use of powerful expensive hardware, fast storage systems, or even move to a cloud service.
Other challenges include perceptual and interactive scalability. The first usually happens when
visualizing large data sets where every data point is represented, leading to over-plotting and
consequently overwhelming users’ perceptual and cognitive capacities. The solution is to reduce
the data through sampling or filtering. The scalability issues arise when querying large data stores
which leads to high latency, disrupting the user experience.
2.5.4 Fleet tracking
2.5.4.1 Concept
Fleet tracking is a management system that uses vehicle tracking devices, usually equipped with a
GPS or GLONNASS module, and software to monitor and manage a fleet of vehicles. The typical
architecture of these systems includes:20 State of the art
• GPS tracking: A device is installed in the vehicle and captures GPS information, apart from
other vehicle information such as CAN data, at regular intervals, and sends it to a remote
server. The CAN data can include fuel capacity, engine temperature, altitude, door status,
tire pressure, ignition status, battery status, odometer, engine RPM, throttle position, among
others. Some of these systems will also include connection ports to remotely control the
vehicle, through its ECU.
• Remote server: The server is responsible to receive, process and store data. Usually, it also
serves the data through an API.
• User Interface: The user interface provides a way for users to access fleet information in
real-time, past data and generate reports.
These systems can be used for several purposes, such as: fleet tracking, routing, dispatching
and security. More advanced use-cases include monitoring schedule adherence and automation
jobs based on vehicle location or routes. In early 2009, the American Public Transportation
Association estimated that around half of all transit buses in the United States were already using
a GPS-based tracking system to trigger automated stop announcements. [47] By gathering
location data in real-time as a transit vehicle follows its route, a computer is able to assert its
location relative to the next stop and trigger the announcement at the right time. The schedules
are also updated in real-time by comparing the current location and time with the programmed
schedule. Some transit agencies also provide online maps with real-time location of their vehicles
to provide information regarding waiting times, so the costumers can base their schedule on real
data instead of the schedulled time of arrival.
Other scenarios where this technology is used include:
• Vehicle recovery: The tracking devices, usually equipped with GPS modules, provide real-
time infomation which allow police to track and recover the vehicle. Some devices include
remote control, which can shut down the vehicle when necessary.
• Field service management: Companies that have a field service workforce for services such
as maintenance, cleaning and repairs, are able to plan field worker’s schedules efficiently or
site arrival information to costumers.
• Fuel Monitoring: Monitor the fuel through the tracking device in combination with a fuel
sensor.
• Asset tracking: Allows companies to track valuable assets for insurance purposes on to
closely monitor movement and operating status.
2.5.5 Tools
There are a lot of Big Data solutions in the market, including big names such as Microsoft
(Microsoft Power BI [48]), SAP (SAP Lumira [49]), SAS (SAS Visual Analytics [50]) and IBM2.5 Data visualization 21 (Watson Analytics [51]). Other specialist software vendors include Tableau Software [52], Qlik [53] and TIBCO [54]. Libraries like D3 [55] and Fusion Chart XT [56] enable the development of web-based custom data visualization solutions.
22 State of the art
Chapter 3

Development

3.1     Real Time Location

3.1.1   Data Ingestion

The location data is generated by CarTrack’s GPS modules installed in Wegho’s vehicles. To
access this data, the CarTrack’s API provides an endpoint get_vehicle_detailed_event which
returns, among other data, the GPS coordinates of the vehicle. The request and response data
schemas are detailed below.

   Request

                        Field          Type     Description

                        registration   string   The vehicle’s registration
                        start_ts       date     Start date
                        end_ts         date     End date
                        username       string   CarTrack credentials
              Table 3.1: Request schema for get_vehicle_detailed_events endpoint

   Response

                                                23
24 Development
Field Type Description
id number
registration string Vehicle’s registration
event_ts date Event timestamp
event_description string Event description
longitude decimal GPS longitude
latitude decimal GPS latitude
odometer number Vehicle’s odometer value in km
bearing number Vehicle’s bearing in degrees
ignition boolean Engine ignition status
speed number Speed in kmh
mapzone
temp1 decimal Sensor 1 temperature in Co
temp2 decimal Sensor 2 temperature in Co
temp3 decimal Sensor 3 temperature in Co
temp4 decimal Sensor 4 temperature in Co
door1_status boolean Driver door status
door2_status boolean Passenger door status
received_ts date Event received timestamp
Table 3.2: Response schema for get_vehicle_detailed_events endpoint
Its important to note that this endpoint doesn’t always return data; it requires a CAN Bus event
to be triggered in order to generate data regarding that event. This results in no data being returned
when the vehicle is off.
If the car is moving, an event is generated every 10 seconds - the maximum update frequency
of the location data. Otherwise, the response will be either empty or contain information about an
event generated by the CAN Bus. Although these events are not documented in the API, it was
possible to extract a list of events from several requests.
Name Type/Values Description
ign boolean Ignition status
dHDG Unknown Unknown
dODO number Odometer
reverse boolean Reverse status
motion start/end Vehicle starts/stops moving
Table 3.3: CAN Bus events provided by get_vehicle_detailed_events
Now that the maximum frequency of location data updates is known, it is necessary to develop3.1 Real Time Location 25
a solution to fetch it periodically, in an automated way. To achieve this, a script was developed
to make requests to the API. This script relies on a time-based job scheduler, also known as cron
job, to automate its execution. cron is a Linux utility which schedules a command or script to run
automatically at a specified time and date. A cron job is the scheduled task itself.
The script was deployed in Google Cloud Platform using Cloud Functions. A Cloud Function
is a "serverless execution environment for building and connecting cloud services" [3], in which
the user writes a single-purpose event-driven function that is executed in a managed environment.
Figure 3.1: Google Cloud Functions overview [3]
Unlike the traditional way of running a function (or script) which involves setting up and
managing an infrastructure, Cloud Functions provide an easy way to run the code in the cloud in
a fully-managed, highly available and fault tolerant environment. Other advantages include the
billing structure - the user is only billed when the function runs - and easy integration with other
cloud services, such as Google Firebase. For this particular use-case, given the maximum update
frequency of 10 seconds of the location data (ie: the function doesn’t need to run constantly) and
the connection to Google’s Firebase results in a great fit for using Google Cloud Functions.
A Cloud Function is event-driven, so it requires an event to trigger its execution. There are
multiple supported event types: Cloud Pub/Sub, Cloud Storage, HTTP, Stackdriver Logging and
Firebase. As previously established, the function needs to be executed periodically which requires
a time-based trigger. Although it’s not possible to use a job scheduller as an event source directly,
Google Cloud Platform provides a work-around [57] for this use-case. The solution is to use
Cloud Pub/Sub - a messaging queue service that allows sending and receiving messages between
applications - which acts as a bridge between the Cloud Sheduler job and the Cloud Function.
Figure 3.2: Using Pub/Sub as a bridge between Cloud Scheduler and Cloud Functions
In order to setup this workflow, it’s required to:
• Create a topic in Pub/Sub26 Development
• Create a job in Cloud Scheduler that runs every 10 seconds and sends a message to a Pub/Sub
topic when the job is executed
• Create a script for the Cloud Function, and set its execution trigger to the Pub/Sub topic
created
The script was developed in JavaScript, and uses the strong-soap library [58] to make the
requests to the CarTrack’s SOAP API. In order to manage the API credentials, Google Key
Management System [59] was used. This system allows the credentials to be encrypted in the
script and only decrypted on run-time. It also requires execution previleges which are granted by
the Function owner, which limits the exposure if someone tries to decrypt the credentials outside
a particular environment. In order to store the location data, Google’s Firestore SDK [60]
provides an easy way to access the database from the Function environment.
Figure 3.3: Location function sequence diagram
The script starts by decrypting the API credentials using KMS. Then, it makes a request to
get_vehicle_details to fetch all vehicle registrations. This request is necessary in order to make
the function future proof, in case a new vehicle is added to Wegho’s fleet or an exiting vehicle
is removed, the only action required is to restart the function. Both the API credentials and all
vehicle registrations are served from cache [61] in subsequent calls, so it only runs on the first
execution. This saves execution time which results in faster data updates.
The next step is to make a request to get_vehicle_detailed_events in order to fetch the location
data. This request is executed for each registration. To mitigate a negative impact on performance,You can also read