D1.1 Industry Requirements with benchmark metrics and KPIs - DataBench
←
→
Page content transcription
If your browser does not render page correctly, please read the page content below
Deliverable D1.1 Industry Requirements with benchmark metrics and KPIs

Evidence Based Big Data Benchmarking to Improve Business Performance

D1.1 Industry Requirements with benchmark metrics and KPIs

Abstract
The DataBench project aims to bridge the gap between technical and business
benchmarking of Big Data and Analytics applications. The requirements discussed in this
report are the result of the first analysis performed in the project on existing Big Data
Benchmarking tools, from the interaction with BDVA (BIG Data Value Association) and
participation in the development and analysis of results of a first questionnaire developed
within BDVA, and from analysis of Big Data technology and benchmarking developed in
other work packages of the project.
As a result of this analysis, an integrated set of benchmark metrics and KPIs is proposed, as
an ecosystem of indicators covering Business features, Big data application features,
Platform and architecture features, and Benchmark-specific features.
The deliverable discusses the use of these features in an integrated way, as a basis for a
methodological integration, for the development of the DataBench Toolbox, and for relating
indicators and building a KPI knowledge graph.

                         DataBench Grant Agreement No 780966
                                                                                           1
Deliverable D1.1 Industry Requirements with benchmark metrics and KPIs

 Deliverable D1.1          Industry Requirements with benchmark metrics and KPIs

 Work package              WP1

 Task                      1.1

 Due date                  31/12/2018

 Submission date           22/11/2019

 Deliverable lead          POLIMI

 Version                   2.0

 Authors                   POLIMI (Barbara Pernici, Chiara Francalanci, Angela Geronazzo,
                           Lucia Polidori)
                           IDC (Gabriella Cattaneo and Helena Schwenk)
                           JSI (Marko Grobelnik)
                           ATOS (Tomás Pariente, Iván Martínez)
                           GUF (Todor Ivanov)
                           SINTEF (Arne Berre, Bushra Nazir)

 Reviewer                  IDC (Mike Glennon)

Keywords
Benchmarking, KPIs, indicators, modelling framework
Disclaimer
This document reflects the authors view only. The European Commission is not responsible
for any use that may be made of the information this document contains.
Copyright Notice
Copyright belongs to the authors of this document. Use of any materials from this document
should be referenced and is at the user's own risk.

                          DataBench Grant Agreement No 780966
                                                                                        2
Deliverable D1.1 Industry Requirements with benchmark metrics and KPIs

Table of Contents
Executive Summary ................................................................................................................................................... 5
1.       Introduction and Objectives ........................................................................................................................ 6
     1.1 Objectives of the Deliverable .................................................................................................................... 6
     1.2 Research Approach ....................................................................................................................................... 7
2. Overview on Big Data Benchmarking ........................................................................................................10
     2.1 Benchmarks under Evaluation for the DataBench Toolbox ...................................................10
         2.1.1 Micro-Benchmarks .............................................................................................................................12
         2.1.2 Application Level Benchmarks .....................................................................................................18
     2.2 BDVA Framework and Benchmarks ...................................................................................................22
     2.3 BDVA SG on Benchmarks .........................................................................................................................25
3.       DataBench Ecosystem of Key Performance Indicators Classifications .................................28
     3.1.1 The DataBench Ecosystem of Indicators ...................................................................................28
     3.2          Business Features .................................................................................................................................30
     3.2.1 Approach...................................................................................................................................................30
     3.2.2 The survey ................................................................................................................................................31
     3.2.3 Business Indicators..............................................................................................................................33
     3.2.4 Business KPIs Measurement ...........................................................................................................34
     3.2.4 Scope of BDA: the Data-driven Company ..................................................................................39
     3.3 Big Data Application Features ...............................................................................................................39
     3.4 Platform and Architecture Features ...................................................................................................40
     3.5 Benchmark-specific Features .................................................................................................................41
4. Towards an Integrated Framework............................................................................................................42
     4.1 Methodological Integration Framework...........................................................................................42
     4.2 Relating Indicators ......................................................................................................................................45
     4.3 Features Selection for Profiling by Industry Sector ....................................................................50
     4.4 DataBench Ontology and Knowledge Graph ...................................................................................52
5. Concluding Remarks ..........................................................................................................................................54
References ....................................................................................................................................................................55
Annex 1 – BDVA Questionnaire SG Benchmarking (Spring 2018) ...................................................56
Annex 2 – Features in WP2 survey (October 2018) ................................................................................61

                                                 DataBench Grant Agreement No 780966
                                                                                                                                                                              3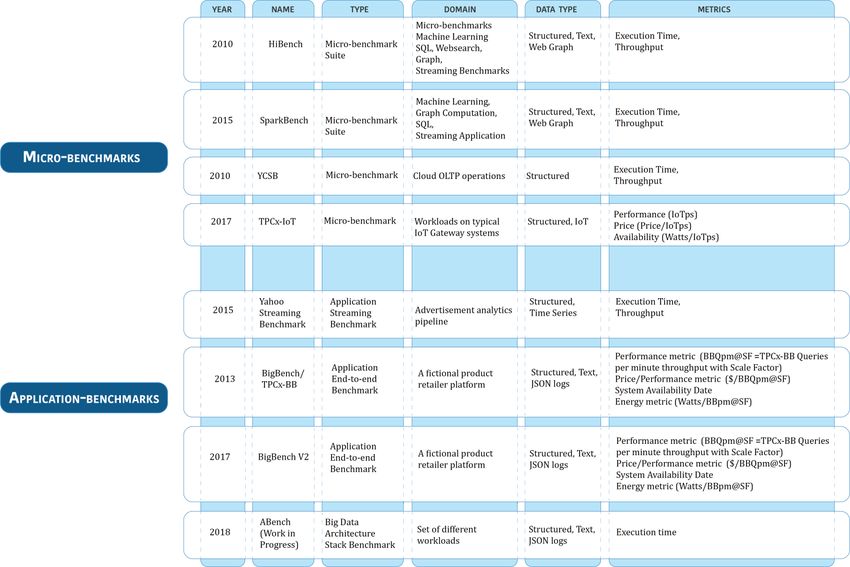
Deliverable D1.1 Industry Requirements with benchmark metrics and KPIs

Table of Figures
Figure 1 - Methodological Approach for integrating Technical and Business Indicators ....... 6
Figure 2 - Benchmarks under Evaluation .....................................................................................................11
Figure 3 - BDV Reference Model from SRIA 4.0 (January 2018) .......................................................23
Figure 5 - Big Data Benchmarks BDV Reference Model........................................................................25
Figure 6 - BDA Technical and Business Benchmarking Framework ...............................................30
Figure 7 - Composition of the Survey Sample by size and country ..................................................32
Figure 8 - Composition of the Survey Sample by industry ...................................................................33
Figure 9 - Business Parameters .........................................................................................................................35
Figure 10 - Business Parameters ......................................................................................................................36
Figure 11 - DataBench Methodological Framework and Workflow ................................................42
Figure 12 - DataBench Mock-up of the start of the Registration of a new Benchmark ..........44
Figure 13 - DataBench Mock-up of the adding Automation (Interpretation Rules) ................45
Figure 14 - KPI that contribute most to Business Goals ........................................................................47
Figure 15 - Contribution to current KPI improvement made by each technical measure ....47
Figure 16 - Contribution to future KPI improvements made by each technical measure.....48
Figure 17 - Quantitative Analysis of the Desk Analysis Use Cases....................................................49
Figure 18 - Example of profiling KPIs in the Manufacturing domain ..............................................51

Table of Tables
Table 1 - DataBench Indicators Ecosystem ..................................................................................................28
Table 2 - Definition and Metrics of Business KPIs - I ..............................................................................36
Table 3 - Definition and Metrics of Business KPIs - II .............................................................................37
Table 4 - Classification of BDA Cross-industry Use Cases .....................................................................38
Table 5 - Classification of Industry-Specific BDA Use Cases ...............................................................38
Table 6 - Big Data Application Features ........................................................................................................39
Table 7 – Platform and Architecture Features ...........................................................................................40
Table 8 - Benchmark-specific Features..........................................................................................................41
Table 9 – Comparing Indicators contained in the WP2 .........................................................................46

                                          DataBench Grant Agreement No 780966
                                                                                                                                                       4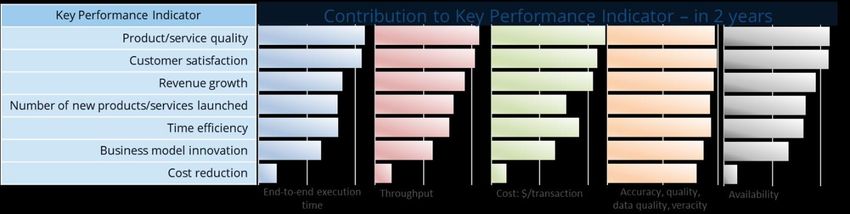
Deliverable D1.1 Industry Requirements with benchmark metrics and KPIs

Executive Summary

D1.1 Industry Requirements with benchmark metrics and KPIs documents the collected
industrial requirements of European significance with mappings to related vertical and
horizontal benchmark metrics and KPIs.
In Task 1.1 we initiated the contacts with representatives of various industry sectors and
started establishing industrial requirements based on interviews and interactions for
priorities and metrics related to analysis of different use cases from industrial sectors and
from the existing ICT14 and ICT15 projects. The objective is to establish an industrial user
community that can provide the foundation for holistic end-to-end benchmarks that will go
across all the different layers of the Big Data technology stack, according to the BDVA
reference model. Existing Big Data benchmarks have primarily focused on the
commercial/retail domain related to transaction processing (TPC benchmarks and
BigBench) or to applications suitable for graph processing (Hobbit and LDBC – Linked Data
Benchmark Council). The analysis of different sectors in the BDVA has concluded that they
all use different mixes of the different Big Data Types (Structured data, Time series/IoT,
Spatial, Media, Text and Graph). Industrial sector specific benchmarks will thus relate to a
selection of important data types, and their corresponding vertical benchmarks, adapted for
this sector. The existing holistic industry/application benchmarks have primarily been
focusing on structured data and Graph data types and DataBench will in addition be focusing
on the industry requirements for time series/IoT, spatial and media and text, from the
requirements of different industrial sectors such as manufacturing, transport, bio
economies, earth observation, health, energy and many others.
 The requirements discussed in this report are the result of the first analysis performed in
the project on existing Big Data Benchmarking tools, from the interaction with BDVA (BIG
Data Value Association) and participation in the development and analysis of results of a
first questionnaire developed within BDVA, and from analysis of Big Data technology and
benchmarking developed in other work packages of the project.
As a result of this analysis, an integrated set of benchmark metrics and KPIs is proposed, as
an ecosystem of indicators covering Business features, Big Data application features,
Platform and architecture features, and Benchmark-specific features. While the actual
metrics and KPIs adopted in different contests is a moving target and ever increasing, the
goal of the deliverable is to create a classification of existing metrics and KPIs derived from
several industry and research sources, in order to be able to put them in relation to each
other and use them for as a basis for classifying industry needs and providing a support for
identifying and using existing Big Data Technology Benchmarks. Definitions have been
introduced to make the descriptions of the lists of indicators self-contained.
The second part of the deliverable discusses the use of these features in an integrated way,
as a basis for a methodological integration, for the development of the DataBench Toolbox,
and for relating indicators and building a KPI Knowledge Graph.
The updated version 2.0 of the deliverable illustrates in detail the research process followed
to derive the proposed classification and the research directions for using the classification
as a basis for the construction of a knowledge graph to relate existing indicators. Figures
have been updated to make the document both readable online and printable. Some
technical details on the DataBench Framework have been moved to Deliverable D1.2.

                          DataBench Grant Agreement No 780966
                                                                                             5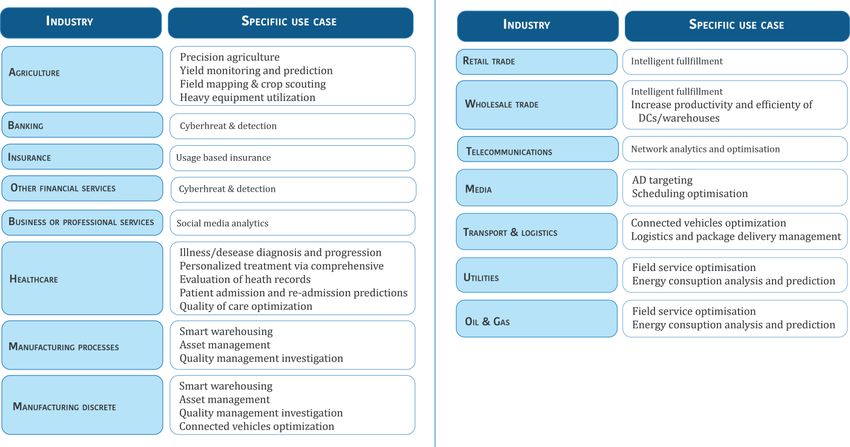
Deliverable D1.1 Industry Requirements with benchmark metrics and KPIs

1. Introduction and Objectives
     1.1 Objectives of the Deliverable
The research work conducted in WP1 has the goal to provide a reference framework for
understanding the relationship between business KPIs and technical benchmarks, following
the objectives for this work package defined in the DoA:
Objective 1. Provide the BDT Stakeholder communities with a comprehensive framework to
integrate Business and Technical benchmarking approaches for Big Data Technologies.
Objective 4. Liaise closely with the BDVA, ICT 14, 15 to build consensus and to reach out to key
industrial communities, to ensure that benchmarking responds to real needs and problems.
The work presented in this deliverable has been developed during the first year of the
project, taking as input also the work in other WPs, and in particular, WP2, WP3, and WP4.
WP2 and WP4 are both responsible for identifying and assessing business impacts of
benchmarks, both from technical and from organizational points of view. As a basis for this
report, the work in WP2 has contributed a framework to investigate the main Big Data use
cases implemented by industry; WP4 (D4.1), developing an in-depth case study research,
has paved the way to show how the relationships between business KPIs and technical
benchmarks is materialized in real cases. WP3 in D3.1 has provided a general description of
the DataBench Toolbox and also discussed the role of the business and technical metrics. As
shown in D3.1, WP3 has also the role of the connecting the work developed in all work
packages, based on the DataBench Framework developed in WP1.
As shown in Figure 1, the classification of indicators presented in this deliverable has
developed an integrated ecosystem of indicators starting from the work in the top-down
analysis of Big Data Technology adoption developed in WP2, the bottom-up analysis
performed in the desk analysis and interviews started in WP4 and from the analysis of the
functionalities needed to retrieve and deploy benchmarks which are being studied in WP3.

           Figure 1 - Methodological Approach for integrating Technical and Business Indicators

                            DataBench Grant Agreement No 780966
                                                                                                  6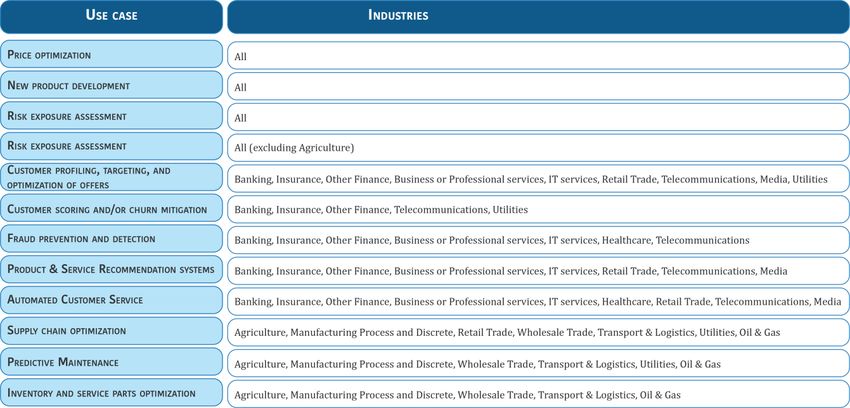
Deliverable D1.1 Industry Requirements with benchmark metrics and KPIs

The present report has the main goal of presenting the results of T1.1 to create the basis for
a holistic end-to-end benchmarking system for different industry sectors.
This document presents the state of the art analysis performed in T1.1:
   -   We considered the existing benchmarks, identifying the main analysis dimensions.
   -   We collaborated first with BDVA with a preliminary analysis of relevant indicators,
       developing an initial questionnaire for ICT14 and ICT15 Big Data Projects (see
       Section 2.4), and then with WP2 towards the creation of an ecosystem of indicators.
This deliverable contributes to the state of the art presenting the results of the analysis and
harmonization of the different indicators in an ecosystem of indicators able to capture the
different characteristics, from a business perspective to a technical view. The indicators will
be the basis for further analyses and for the toolbox development.
While the structure of the DataBench ecosystem of indicators is being defined in this
deliverable, we still expect possible modifications and refinements in the following phases
of the project, as the detailed analyses phases continue in WP2 and WP3, and benchmarks
analysis and metrics evaluation is performed in WP4 and WP5.
The document is structured as follows:
   •   Section 1 provides the introduction to the objectives of the deliverable.
   •   Section 2 contains an overview of the examined benchmarks and their principal
       characteristics.
   •   Section 3 dives into a detailed description of the indicators ecosystem for the
       different perspectives.
   •   Section 4 presents an integrated framework for using the indicators in the DataBench
       toolbox.
   •   Finally, Section 5 provides the conclusions of the document and outlines the future
       work on the DataBench metrics.

   1.2 Research Approach
As illustrated above, in Task 1.1 the DataBench research team has the goal of providing an
integrated framework for describing business and technical indicators.
In this report we do not summarize the work done in WP2, WP3, and WP4, which is
summarized in the following already available deliverable and in the deliverables being
developed in parallel (D2.1, D2.2, D3.1, D4.1), rather we present the main issues which
emerged in the first year of the project and how the integration work evolved to the
contributions presented in this deliverable.
In Task 1.1, we started to analyse existing technical benchmarks for Big Data Technologies
in a systematic way. Eight of the most popular benchmarks have been analysed in this
report as a basis of identifying a classification framework for all benchmarks, In Deliverable
D1.2 a complete analysis of existing benchmarks is going to be provided. Two main issues
emerged in the analysis of possible indicators for technology benchmarks:
1) The description of benchmarks is usually provided by their authors and providers in
different formats, and the performance metrics can be different even if the goals are similar
(for instance throughput is measured in a variety of ways as illustrated in Section 2).
Attempts to classify benchmarks for big data systems in the literature, such as Han 2018,
illustrate that benchmarks can be of different types, such as micro and macrobenchmarks,

                          DataBench Grant Agreement No 780966
                                                                                             7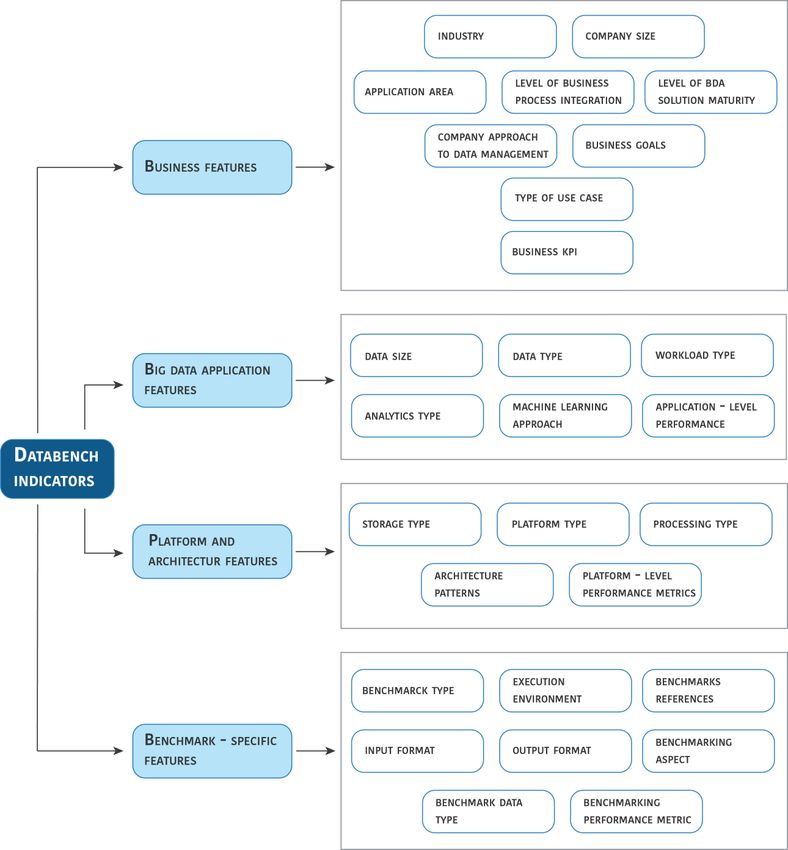
Deliverable D1.1 Industry Requirements with benchmark metrics and KPIs

or can be specialized to specific types of data or specific data analysis techniques. So, in
order to be able to classify all benchmarks in a uniform way, we developed a common
template for their description, presented in Section 2.
2) An aspect that emerged during the analysis of existing benchmarks was the importance
of the adopted technology stack and of system configuration aspects.
As a consequence, in our proposed classification of indicators, we separate aspects directly
related to the benchmark metrics from aspects related to the platforms on which they are
deployed.
A second starting point has been the study of existing reference architectures for Big data
technologies. We examined existing approaches, such as the ones developed by the NIST Big
Data Public Working Group and the Big Data Value Association (BDVA). In particular, BDVA
is developing a reference framework which is considering the different aspects of the
technological stacks and of application characteristics of big data analysis. The following
issues were identified:
1) the BDVA framework can be a basis for classifying the different aspects (horizontally and
vertically, as detailed later in Section 2); however a more refined classification is needed to
provide details about technologies and applications.
2) A need for further analysing benchmarking needs was identified, and together with
DataBench members, a working group of benchmarking was established in BDVA and a first
survey was run with BDVA members (as illustrated in Section 2). From this survey, based
also on a previous survey from the Hobbit project, some requirements were investigated
and further requirements emerged (as detailed in Section 4)
A third starting point was the investigation of business KPIs in DataBench from the WP2
survey and the WP4 bottom up analysis. A set of requirements emerged and the need to
define a common set of indicators for all aspects considered in the project, in order to related
business and technical needs. The results from this analysis resulted on the classification of
business and application indicators, as illustrated in Section 3, as some initial analyses were
started to test the system of indicators as illustrated in Section 4, and will further developed
in next deliverables of WP2 and WP4.
From the previous analyses, the general approach which emerged was to define three main
abstraction levels for classifying indicators:
   1) Points of view: we defined features the perspectives considered from each subset of
      indicators, focusing on business aspects, application aspects, platform aspects and
      benchmarking tools.
   2) Features: features are used to defined categories of indicators for each point of view.
      It has to be noted that some features may have similar names from different points
      of view, however, specific indicators can be defined from each point of view. One
      notable example is performance, which can be view a general system property a
      business level, an end-to-end property of an application, or may have more specific
      aspects when considering the performance of a platform or technology stack, or
      measuring the performance in a specific benchmark, in particular when
      microbenchmarks are considered.
   3) Indicators: for each feature, in this report we present a list of indicators derived
      from the previous analyses, i.e. measurable properties for a system or subsystem. It
      has to be noted that some of the lists of indicators presented in this report should be

                          DataBench Grant Agreement No 780966
                                                                                              8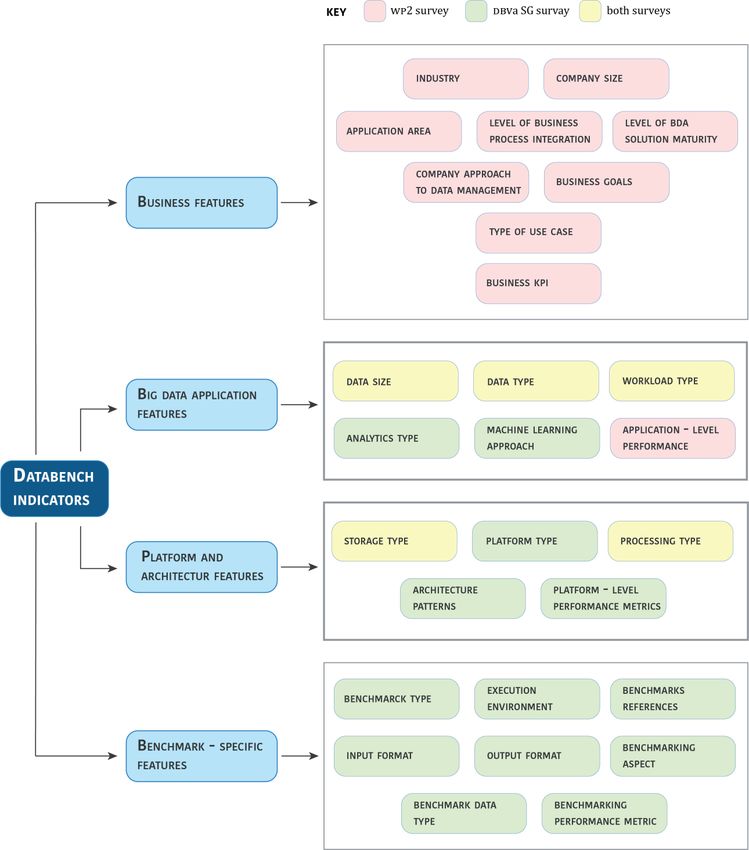
Deliverable D1.1 Industry Requirements with benchmark metrics and KPIs

      considered as a starting point and open ended. In fact, new metrics are developed
      continuously and in the DataBench Toolbox it will be possible to add new indicators
      as they emerge from the business and benchmark analyses.
   4) Metrics: for each listed indicator a list of possible values is defined. Indicators can
      be categorical, in this case values indicate the belonging to a category or numerical,
      in this case the units of measure are provided for each indicator. Categorical
      indicators include indicators for which numerical values have been divided in ranges.
Further details about indicators are provided in Section 3 of the deliverable.

                         DataBench Grant Agreement No 780966
                                                                                           9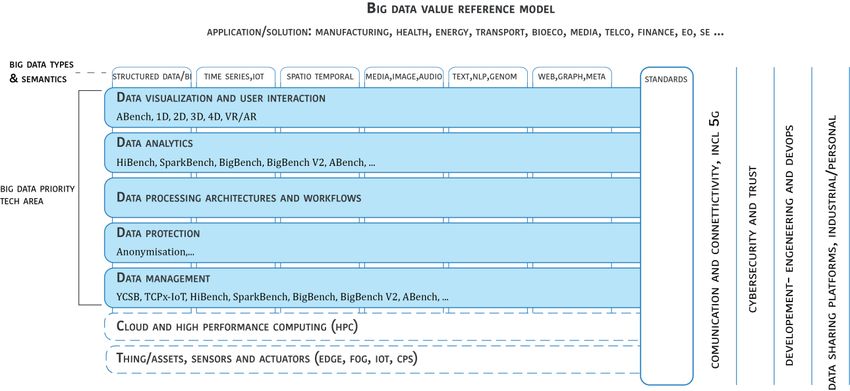
Deliverable D1.1 Industry Requirements with benchmark metrics and KPIs

2. Overview on Big Data Benchmarking
In this chapter we present the state of the art on Big Data benchmarking from three different
perspectives: an analysis of benchmarking tools (Sections 2.1), the reference models being
developed within BDVA and their use for situating benchmarks (Section 2.2), and a first
analysis of BDT (Big Data Technology) and benchmarking developed by the project within
BDVA (Section 2.3).

       2.1 Benchmarks under Evaluation for the DataBench Toolbox
As already described in D3.1, in WP1 in the first year the DataBench project performed a
first survey of big data benchmarking tools. As a result, a set of benchmarks was selected for
further in depth analysis, which is ongoing and will be reported within WP3 deliverables,
and a number of dimensions for analysing each benchmark was identified and discussed,
considering also the recent paper by Han et al., 2018, which discusses benchmarking for Big
Data.
In particular, as illustrated in Figure 2, benchmarks are classified according to benchmark
categories (Micro- and Application benchmarks), their Year of publication, name, Type and
domain, and Data type. Figure 2 provides a summary of the main characteristics of each
selected benchmark. In the following sections, each one is described more in detail,
according to the following dimensions: Description, Benchmark type and Domain,
Workload, Data type and generation, Metrics, Implementation and technology stack,
Reported results and usage, Reference papers.
While the work of describing more in detail all the selected benchmarks is ongoing, it is
useful to present a summary illustration of each selected benchmark in this deliverable, as
the analysis work was the basis for identifying the features and indicators that are proposed
in Chapter 3 and the integrated framework discussed in Chapter 4 towards providing a
description of benchmarking tools in both a business- and technology-related framework.
In the following, the selected benchmarks are described in detail: in Section 2.1 Micro-
benchmarks are presented, while Section 2.2. presents Application benchmarks.
In this section in the descriptions the original terms and definitions from the benchmarks
are reported.

                          DataBench Grant Agreement No 780966
                                                                                           10
Deliverable D1.1 Industry Requirements with benchmark metrics and KPIs
Figure 2 - Benchmarks under Evaluation
Figure 2 provides an overview of the benchmarks shortly described in the following, including also the metrics that is being used in
these benchmarks.
DataBench Grant Agreement No 780966
11Deliverable D1.1 Industry Requirements with benchmark metrics and KPIs
2.1.1 Micro-Benchmarks
HiBench
1. Description
HiBench [Huang, S] is a comprehensive big data benchmark suite for evaluating different
big data frameworks. It consists of 19 workloads including both synthetic micro-
benchmarks and real-world applications from 6 categories which are: micro, ml (machine
learning), sql, graph, websearch and streaming.
2. Benchmark type and domain
Micro-benchmark suite including 6 categories which are micro, ml (machine learning), sql,
graph, websearch and streaming.
3. Workload
• Micro Benchmarks: Sort (sort), WordCount (wordcount), TeraSort (terasort),
Sleep (sleep), enhanced DFSIO (dfsioe)
• Machine Learning: Bayesian Classification (Bayes), K-means clustering
(Kmeans), Logistic Regression (LR), Alternating Least Squares (ALS), Gradient
Boosting Trees (GBT), Linear Regression (Linear), Latent Dirichlet Allocation
(LDA), Principal Components Analysis (PCA), Random Forest (RF), Support
Vector Machine (SVM), Singular Value Decomposition (SVD)
• SQL: Scan (scan), Join(join), Aggregate(aggregation)
• Websearch Benchmarks: PageRank (pagerank), Nutch indexing (nutchindexing)
• Graph Benchmark: NWeight (nweight)
• Streaming Benchmarks: Identity (identity), Repartition (repartition), Stateful
Wordcount (wordcount), Fixwindow (fixwindow)
4. Data type and generation
Most workloads use synthetic data generated from real data samples. The workloads use
structured and semi-structured data.
5. Metrics
The measured metrics are execution time (latency), throughput and system resource
utilizations (CPU, Memory, etc.).
6. Implementation and technology stack
HiBench can be executed in Docker containers. It is implemented using the following
technologies:
• Hadoop: Apache Hadoop 2.x, CDH5, HDP
• Spark: Spark 1.6.x, Spark 2.0.x, Spark 2.1.x, Spark 2.2.x
• Flink: 1.0.3
• Storm: 1.0.1
• Gearpump: 0.8.1
• Kafka: 0.8.2.2
DataBench Grant Agreement No 780966
12Deliverable D1.1 Industry Requirements with benchmark metrics and KPIs
7. Reported results and usage:
• Yi, L., & Dai, J. (2013, July). Experience from hadoop benchmarking with HiBench:
from micro-benchmarks toward end-to-end pipelines. In Workshop on Big Data
Benchmarks(pp. 43-48). Springer, Cham.
• Ivanov, T., Niemann, R., Izberovic, S., Rosselli, M., Tolle, K., & Zicari, R. V..
(2014). Benchmarking DataStax Enterprise/Cassandra with HiBench. Frankfurt Big
Data Laboratory Technical
Paper.(http://arxiv.org/ftp/arxiv/papers/1411/1411.4044.pdf
• Ivanov, T., Zicari, R. V., Izberovic, S., & Tolle, K.. (2014). Performance Evaluation of
Virtualized Hadoop Clusters. Frankfurt Big Data Laboratory Technical
Paper. (http://arxiv.org/ftp/arxiv/papers/1411/1411.3811.pdf )
• Alzuru, I., Long, K., Gowda, B., Zimmerman, D., & Li, T. (2015, August). Hadoop
Characterization. In Trustcom/BigDataSE/ISPA, 2015 IEEE (Vol. 2, pp. 96-103).
IEEE.
• Samadi, Y., Zbakh, M., & Tadonki, C. (2016, May). Comparative study between
Hadoop and Spark based on Hibench benchmarks. In Cloud Computing
Technologies and Applications (CloudTech), 2016 2nd International Conference
on (pp. 267-275). IEEE.
• Ahmed, H., Ismail, M. A., Hyder, M. F., Sheraz, S. M., & Fouq, N. (2016). Performance
Comparison of Spark Clusters Configured Conventionally and a Cloud
Service. Procedia Computer Science, 82, 99-106.
8. Reference papers:
• Huang, S., Huang, J., Dai, J., Xie, T., Huang, B.: The HiBench benchmark suite:
Characterization of the mapreduce-based data analysis. In: Workshops Proceedings
of the 26th International Conference on Data Engineering, ICDE 2010, March 1-6,
2010, Long Beach, California, USA. pp. 41–51 (2010)
• Intel: HiBench Suite, https://github.com/intel-hadoop/HiBench
SparkBench
1. Description
Spark-Bench is a flexible system for benchmarking and simulating Spark jobs. It
consists of multiple workloads organized in 4 categories.
2. Benchmark type and domain
Spark-Bench is a Spark specific benchmarking suite to help developers and
researchers to evaluate and analyze the performance of their systems in order to
optimize the configurations. It consists of 10 workloads organized in 4 different
categories.
3. Workload
The atomic unit of organization in Spark-Bench is the workload. Workloads are
standalone Spark jobs that read their input data, if any, from disk, and write their
output, if the user wants it, out to disk. Workload suites are collections of one or more
DataBench Grant Agreement No 780966
13Deliverable D1.1 Industry Requirements with benchmark metrics and KPIs
workloads. The workloads in a suite can be run serially or in parallel. The 4
categories of workloads are:
• Machine Learning: logistic regression (LogRes), support vector machine
(SVM) and matrix factorization (MF).
• Graph Computation: PageRank, collaborative filtering model (SVD++) and a
fundamental graph analytics algorithm (TriangleCount (TC)).
• SQL Query: select, aggregate and join in HiveQL and RDDRelation.
• Streaming Application: Twitter popular tag and PageView
4. Data type and generation
The data type and generation is depending on the different workload. The LogRes
and SVM use the Wikipedia data set. The MF, SVD++ and TriangleCount use the
Amazon Movie Review data set. The PageRank uses Google Web Graph data and
respectively Twitter uses Twitter data. The SQL Queries workloads use E-commerce
data. Finally, the PageView uses PageView DataGen to generate synthetic data.
5. Metrics
SparkBench defines a number of metrics facilitating users to compare between
various Spark optimizations, configurations and cluster provisioning options:
• Job Execution Time(s) of each workload
• Data Process Rate (MB/seconds)
• Shuffle Data Size
6. Implementation and technology stack
Spark-Bench is currently compiled against the Spark 2.1.1 jars and should work with
Spark 2.x. It is written using Scala 2.11.8.
7. Reported results and usage
• Hema, N., Srinivasa, K. G., Chidambaram, S., Saraswat, S., Saraswati, S., Ramachandra,
R., & Huttanagoudar, J. B. (2016, August). Performance Analysis of Java Virtual
Machine for Machine Learning Workloads using Apache Spark. In Proceedings of the
International Conference on Informatics and Analytics (p. 125). ACM.
• Liang, Y., Chang, S., & Su, C. (2017, December). A Workload-Specific Memory Capacity
Configuration Approach for In-Memory Data Analytic Platforms. In Ubiquitous
Computing and Communications (ISPA/IUCC), 2017 IEEE International Symposium
on Parallel and Distributed Processing with Applications and 2017 IEEE
International Conference on (pp. 486-490). IEEE.
8. Reference papers:
• Min Li, Jian Tan, Yandong Wang, Li Zhang, Valentina Salapura:
SparkBench: a spark benchmarking suite characterizing large-scale in-memory data
analytics. Cluster Computing 20(3): 2575-2589 (2017)
• Dakshi Agrawal, Ali Raza Butt, Kshitij Doshi, Josep-Lluís Larriba-Pey, Min
Li, Frederick R. Reiss, Francois Raab, Berni Schiefer, Toyotaro Suzumura, Yinglong
Xia:
SparkBench - A Spark Performance Testing Suite. TPCTC 2015: 26-44
DataBench Grant Agreement No 780966
14Deliverable D1.1 Industry Requirements with benchmark metrics and KPIs
• SparkBench, https://github.com/CODAIT/spark-bench
Yahoo! Cloud Serving Benchmark (YCSB)
1. Description
The YCSB framework is designed to evaluate the performance of different “key-value” and
“cloud” serving systems, which do not support the ACID properties. The benchmark is open
source and available on GitHub. The YCSB++ , an extension of the YCSB framework, includes
many additions such as multi-tester coordination for increased load and eventual
consistency measurement, multi-phase workloads to quantify the consequences of work
deferment and the benefits of anticipatory configuration optimization such as B-tree pre-
splitting or bulk loading, and abstract APIs for explicit incorporation of advanced features
in benchmark tests.
2. Benchmark type and domain
The framework is a collection of cloud OLTP related workloads representing a particular
mix of read/write operations, data sizes, request distributions, and similar that can be used
to evaluate systems at one particular point in the performance space.
3. Workload
YCSB provides a core package of 6 pre-defined workloads A-F, which simulate cloud OLTP
applications. The workloads are a variation of the same basic application type and using a
table of records with predefined size and type of the fields. Each operation against the data
store is randomly chosen to be one of:
• Insert: insert a new record.
• Update: update a record by replacing the value of one field.
• Read: read a record, either one randomly chosen field or all fields.
• Scan: scan records in order, starting at a randomly chosen record key. The number
of records to scan is randomly chosen.
The YCSB workload consists of random operations defined by one of the several built-in
distributions:
• Uniform: choose an item uniformly at random.
• Zipfian: choose an item according to the Zipfian distribution.
• Latest: like the Zipfian distribution, except that the most recently inserted records
are in the head of the distribution.
• Multinomial: probabilities for each item can be specified.
4. Data type and generation
The benchmark consists of a workload generator and a generic database interface, which
can be easily extended to support other relational or NoSQL databases.
5. Metrics
The benchmark measures the latency and achieved throughput of the executed operations.
At the end of the experiment, it reports total execution time, the average throughput, 95th
and 99th percentile latencies, and either a histogram or time series of the latencies.
DataBench Grant Agreement No 780966
15Deliverable D1.1 Industry Requirements with benchmark metrics and KPIs
6. Implementation and technology stack
Currently, YCSB is implemented and can be run with more than 14 different engines like
Cassandra, HBase, MongoDB, Riak, Couchbase, Redis, Memcached, etc. The YCSB Client is a
Java program for generating the data to be loaded to the database, and generating the
operations which make up the workload.
7. Reported results and usage:
• Abubakar, Y., Adeyi, T. S., & Auta, I. G. (2014). Performance evaluation of NoSQL
systems using YCSB in a resource austere environment. Performance
Evaluation, 7(8), 23-27.
• Kumar, S. P., Lefebvre, S., Chiky, R., & Soudan, E. G. (2014, November). Evaluating
consistency on the fly using YCSB. In Computational Intelligence for Multimedia
Understanding (IWCIM), 2014 International Workshop on (pp. 1-6). IEEE.
• Rosselli, M., Niemann, R., Ivanov, T., Tolle, K., & Zicari, R. V.. (2015). Benchmarking
the Availability and Fault Tolerance of Cassandra. Paper presented at the Big Data
Benchmarking – 6th International Workshop, WBDB 2015, Toronto, ON, Canada,
June 16-17, 2015
• Fan, H., Ramaraju, A., McKenzie, M., Golab, W., & Wong, B. (2015). Understanding
the causes of consistency anomalies in Apache Cassandra. Proceedings of the VLDB
Endowment, 8(7), 810-813.
8. Reference papers:
• Brian F. Cooper, Adam Silberstein, Erwin Tam, Raghu Ramakrishnan, Russell Sears:
Benchmarking cloud serving systems with YCSB. Proceedings of the 1st ACM
Symposium on Cloud Computing, SoCC 2010, Indianapolis, Indiana, USA, June 10-
11, 2010
• Swapnil Patil, Milo Polte, Kai Ren, Wittawat Tantisiriroj, Lin Xiao, Julio López, Garth
Gibson, Adam Fuchs, Billie Rinaldi:
YCSB++: benchmarking and performance debugging advanced features in scalable
table stores. ACM Symposium on Cloud Computing in conjunction with SOSP 2011,
SOCC '11, Cascais, Portugal, October 26-28, 2011
• YCSB, https://github.com/brianfrankcooper/YCSB
TPCx-IoT
1. Description
The TPC Benchmark IoT (TPCx-IoT) benchmark workload is designed based on Yahoo Cloud
Serving Benchmark (YCSB). It is not comparable to YCSB due to significant changes. The
TPCx-IoT workloads consists of data ingestion and concurrent queries simulating
workloads on typical IoT Gateway systems. The dataset represents data from sensors from
electric power station(s).
DataBench Grant Agreement No 780966
16Deliverable D1.1 Industry Requirements with benchmark metrics and KPIs
2. Benchmark type and domain
TPCx-IoT was developed to provide the industry with an objective measure of the hardware,
operating system, data storage and data management systems for IoT Gateway systems. The
TPCx-IoT benchmark models a continuous system availability of 24 hours a day, 7 days a
week.
3. Workload
The System Under Test (SUT) must run a data management platform that is commercially
available and data must be persisted in a non-volatile durable media with a minimum of
two-way replication. The workload represents data inject into the SUT with analytics
queries in the background. The analytic queries retrieve the readings of a randomly selected
sensor for two 30 second time intervals, TI1 and TI2. The first time interval TI 1 is defined
between the timestamp the query was started T s and the timestamp 5 seconds prior to TS ,
i.e. TI1 =[TS -5,TS]. The second time interval is a randomly selected 5 seconds time interval
TI2 within the 1800 seconds time interval prior to the start of the first query, T S -5. If TSDeliverable D1.1 Industry Requirements with benchmark metrics and KPIs
2.1.2 Application Level Benchmarks
Yahoo Streaming Benchmark (YSB)
1. Description
The YSB benchmark is a simple advertisement application. There are a number of
advertising campaigns, and a number of advertisements for each campaign. The benchmark
reads the events in JSON format, processes and stores them into a key-value store. These
steps attempt to probe some common operations performed on data streams.
2. Benchmark type and domain
The Yahoo Streaming Benchmark is a streaming application benchmark simulating an
advertisement analytics pipeline.
3. Workload
The analytics pipeline processes a number of advertising campaigns, and a number of
advertisements for each campaign. The job of the benchmark is to read various JSON events
from Kafka, identify the relevant events, and store a windowed count of relevant events per
campaign into Redis. The benchmark simulates common operations performed on data
streams:
1. Read an event from Kafka.
2. Deserialize the JSON string.
3. Filter out irrelevant events (based on event_type field)
4. Take a projection of the relevant fields (ad_id and event_time)
5. Join each event by ad_id with its associated campaign_id. This information is stored
in Redis.
6. Take a windowed count of events per campaign and store each window in Redis
along with a timestamp of the time the window was last updated in Redis. This step
must be able to handle late events.
4. Data type and generation
The data schema consists of seven attributes and is stored in JSON format:
• user_id: UUID
• page_id: UUID
• ad_id: UUID
• ad_type: String in {banner, modal, sponsored-search, mail, mobile}
• event_type: String in {view, click, purchase}
• event_time: Timestamp
• ip_address: String
5. Metrics
The reported metrics by the benchmark are:
• Latency as window.final_event_latency = (window.last_updated_at –
window.timestamp) – window.duration
DataBench Grant Agreement No 780966
18Deliverable D1.1 Industry Requirements with benchmark metrics and KPIs
• Aggregate System Throughput
6. Implementation and technology stack
The YSB benchmark is implemented using Apache Storm, Spark, Flink, Apex, Kafka and
Redis.
7. Reported results and usage (reference papers)
• Perera, S., Perera, A., & Hakimzadeh, K. (2016). Reproducible experiments for
comparing apache flink and apache spark on public clouds. arXiv preprint
arXiv:1610.04493.
• Venkataraman, S., Panda, A., Ousterhout, K., Armbrust, M., Ghodsi, A., Franklin, M. J.,
& Stoica, I. (2017, October). Drizzle: Fast and adaptable stream processing at scale.
In Proceedings of the 26th Symposium on Operating Systems Principles (pp. 374-
389). ACM.
8. Reference papers:
• Sanket Chintapalli, Derek Dagit, Bobby Evans, Reza Farivar, Thomas Graves, Mark
Holderbaugh, Zhuo Liu, Kyle Nusbaum, Kishorkumar Patil, Boyang Peng, Paul
Poulosky:
Benchmarking Streaming Computation Engines: Storm, Flink and Spark
Streaming. IPDPS Workshops2016: 1789-1792
• YSB, https://github.com/yahoo/streaming-benchmarks
• YSB Blog description,
https://yahooeng.tumblr.com/post/135321837876/benchmarking-streaming-
computation-engines-at
BigBench/TPCx-BB
1. Description
BigBench is an end-to-end big data benchmark that represents a data model simulating the
volume, velocity and variety characteristics of a big data system, together with a synthetic
data generator for structured, semi-structured and unstructured data. The structured part
of the retail data model is adopted from the TPC-DS benchmark and further extended with
semi-structured (registered and guest user clicks) and unstructured data (product reviews).
In 2016, BigBench was standardized as TPCx-BB by the Transaction Processing
Performance Council (TPC).
2. Benchmark type and domain
BigBench is an end-to-end, technology agnostic, application-level benchmark that tests the
analytical capabilities of a Big Data platform. It is based on a fictional product retailer
business model.
DataBench Grant Agreement No 780966
19Deliverable D1.1 Industry Requirements with benchmark metrics and KPIs
3. Workload
The business model and a large portion of the data model's structured part is derived from
the TPC-DS benchmark. The structured part was extended with a table for the prices of the
retailer's competitors, the semi-structured part was added represented by a table with
website logs and the unstructured part was added by a table showing product reviews. The
simulated workload is based on a set of 30 queries covering the different aspects of big data
analytics proposed by McKinsey.
4. Data type and generation
The data generator can scale the amount of data based on a scale factor. Due to parallel
processing of the data generator, it runs efficiently for large scale factors. The benchmark
consists of four key steps: (i) System setup; (ii) Data generation; (iii) Data load; and (iv)
Execute application workload.
5. Metrics
TPCx-BB defines the following primary metrics:
• BBQpm@SF, the performance metric, reflecting the TPCx-BB Queries per minute
throughput; where SF is the Scale Factor.
• $/BBQpm@SF, the price/performance metric
• System Availability Date as defined by the TPC Pricing Specification
6. Implementation and technology stack
Since the BigBench specification is general and technology agnostic, it should be
implemented specifically for each Big Data system. The initial implementation of BigBench
was made for the Teradata Aster platform. It was done in the Aster’s SQL-MR syntax served
- additionally to a description in the English language - as an initial specification of
BigBench's workloads. Meanwhile, BigBench is implemented for Hadoop, using the
MapReduce engine and other components like Hive, Mahout, Spark SQL, Spakr MLlib and
OpenNLP from the Hadoop Ecosystem.
7. Reported results and usage (reference papers)
• Todor Ivanov, Max-Georg Beer: Evaluating Hive and Spark SQL with
BigBench.Frankfurt Big Data Laboratory Technical
Paper. (http://arxiv.org/ftp/arxiv/papers/1512/1512.08417.pdf)
• Alzuru, I., Long, K., Gowda, B., Zimmerman, D., & Li, T. (2015, August). Hadoop
Characterization. In Trustcom/BigDataSE/ISPA, 2015 IEEE (Vol. 2, pp. 96-103).
IEEE.
• Singh, S. (2016, September). Benchmarking Spark Machine Learning Using
BigBench. In Technology Conference on Performance Evaluation and
Benchmarking (pp. 45-60). Springer, Cham.
• Nicolás Poggi, Alejandro Montero, David Carrera: Characterizing BigBench Queries,
Hive, and Spark in Multi-cloud Environments. TPCTC 2017: 55-74
DataBench Grant Agreement No 780966
20Deliverable D1.1 Industry Requirements with benchmark metrics and KPIs
• Nguyen, V. Q., & Kim, K. (2017). Performance Evaluation between Hive on
MapKeduce and Spark SQL with BigBench and PAT. In Proceedings of KISM Spring
Conference April (pp. 28-29).
• Richins, D., Ahmed, T., Clapp, R., & Reddi, V. J. (2018, February). Amdahl's Law in Big
Data Analytics: Alive and Kicking in TPCx-BB (BigBench). In 2018 IEEE
International Symposium on High Performance Computer Architecture (HPCA) (pp.
630-642). IEEE.
8. Reference papers:
• Ahmad Ghazal, Tilmann Rabl, Minqing Hu, Francois Raab, Meikel Poess, Alain
Crolotte, Hans-Arno Jacobsen: BigBench: towards an industry standard benchmark
for big data analytics. SIGMOD Conference 2013: 1197-1208
• Chaitanya K. Baru, Milind A. Bhandarkar, Carlo Curino, Manuel Danisch, Michael
Frank, Bhaskar Gowda, Hans-Arno Jacobsen, Huang Jie, Dileep Kumar, Raghunath
Othayoth Nambiar, Meikel Poess, Francois Raab, Tilmann Rabl, Nishkam Ravi, Kai
Sachs, Saptak Sen, Lan Yi, Choonhan Youn: Discussion of BigBench: A Proposed
Industry Standard Performance Benchmark for Big Data. TPCTC 2014: 44-63
• BigBench, https://github.com/intel-hadoop/Big-Data-Benchmark-for-Big-Bench
• TPCx-BB, http://www.tpc.org/tpc_documents_current_versions/pdf/tpcx-
bb_v1.2.0.pdf
BigBench V2
1. Description
The BigBench V2 benchmark addresses some of the limitation of the BigBench (TPCx-BB)
benchmark. BigBench V2 separates from TPC-DS with a simple data model. The new data
model still has the variety of structured, semi-structured, and unstructured data as the
original BigBench data model. The difference is that the structured part has only six tables
that capture necessary information about users (customers), products, web pages, stores,
online sales and store sales. BigBench V2 mandates late binding by requiring query
processing to be done directly on key-value web-logs rather than a pre-parsed form of it.
2. Benchmark type and domain
Similar to BigBench, BigBench V2 is an end-to-end, technology agnostic, application-level
benchmark that tests the analytical capabilities of a Big Data platform.
3. Workload
All 11 TPC-DS queries on the complex structured part are removed and replaced by simpler
queries mostly against the key-value web-logs. The new BigBench V2 queries have only 5
queries on the structured part versus 18 in BigBench. This change has no impact on the
coverage of the different business categories done in BigBench. In addition to the removal
of TPC-DS queries, BigBench V2 mandates late binding, but it does not impose a specific
DataBench Grant Agreement No 780966
21Deliverable D1.1 Industry Requirements with benchmark metrics and KPIs
implementation of it. This requirement means that a system using BigBench V2 can extract
the keys and their corresponding values per query at run-time.
4. Data type and generation
A new scale factor-based data generator for the new data model was developed. The web-
logs are produced as key-value pairs with two sets of keys. The first set is a small set of keys
that represent fields from the structured tables like IDs of users, products, and web pages.
The other set of keys is larger and is produced randomly. This set is used to simulate the
real life cases of large keys in web-logs that may not be used in actual queries. Product
reviews are produced and linked to users and products as in BigBench but the review text
is produced synthetically contrary to the Markov chain model used in BigBench. Product
reviews are generated in this way because the Markov chain model requires real data sets
which limits our options for products and makes the generator hard to scale.
5. Metrics
BigBench V2 uses the same metric definition and computation as BigBench:
• BBQpm@SF, the performance metric, reflecting the TPCx-BB Queries per minute
throughput; where SF is the Scale Factor.
• $/BBQpm@SF, the price/performance metric
• System Availability Date as defined by the TPC Pricing Specification
6. Implementation and technology stack
Similar to BigBench, BigBench V2 is technology agnostic and can be implemented for any
system. Query implementations on Hive, Mahout, Spark SQL, Spark MLlib and OpenNLP
from the Hadoop Ecosystem were reported in the paper.
7. Reported results and usage (reference papers)
8. Reference papers:
• Ahmad Ghazal, Todor Ivanov, Pekka Kostamaa, Alain Crolotte, Ryan
Voong, Mohammed Al-Kateb, Waleed Ghazal, Roberto V. Zicari: BigBench V2: The
New and Improved BigBench. ICDE 2017: 1225-1236
2.2 BDVA Framework and Benchmarks
The Big Data Value Reference Model developed by BDVA (under the leadership of SINTEF
and BDVA TF6) is being used as a foundation for the identification of different relevant areas
in the context of benchmarking. The BDVA Reference Model from BDVA SRIA 4.0 is shown
first, then we present and describe the extended version including domains and the
placement of AI and data platforms that has been worked on during 2018.
DataBench Grant Agreement No 780966
22Deliverable D1.1 Industry Requirements with benchmark metrics and KPIs
Figure 3 - BDV Reference Model from SRIA 4.0 (January 2018)
The BDV Reference Model illustrated different technical areas that are relevant for technical
solutions, standards and potentially benchmarks (Figure 3).
The BDV Reference Model has been developed by the BDVA, taking into account input from
technical experts and stakeholders along the whole Big Data Value chain, as well as
interactions with other related PPPs. The BDV Reference Model may serve as common
reference framework to locate Big Data technologies on the overall IT stack. It addresses the
main concerns and aspects to be considered for Big Data Value systems.
The BDV Reference Model distinguishes between two different elements. On the one hand,
it describes the elements that are at the core of the BDVA; on the other, it outlines the
features that are developed in strong collaboration with related European activities.
The BDV Reference Model shows on the top a number of relevant application
domains. It also shows a logical placement of the areas of AI platforms and Data platforms.
The BDV Reference Model is structured into horizontal and vertical concerns.
• Horizontal concerns cover specific aspects along the data processing chain, starting
with data collection and ingestion, and extending to data visualisation. It should be noted
that the horizontal concerns do not imply a layered architecture. As an example, data
visualisation may be applied directly to collected data (the data management aspect)
without the need for data processing and analytics.
• Vertical concerns address cross-cutting issues, which may affect all the horizontal
concerns, and also relates to how different big data types cuts across the horizontal areas.
In addition, vertical concerns may also involve non-technical aspects.
It should be noted that the BDV Reference Model has no ambition to serve as a technical
reference structure. However, the BDV Reference Model is compatible with such reference
architectures, most notably the emerging ISO JTC1 SC42 AI and Big Data Reference
Architecture.
The following elements as expressed in the BDV Reference Model are elaborated in the
remainder of this section:
DataBench Grant Agreement No 780966
23Deliverable D1.1 Industry Requirements with benchmark metrics and KPIs
Horizontal concerns
• Data Visualisation and User Interaction: Advanced visualisation approaches for
improved user experience.
• Data Analytics: Data analytics to improve data understanding, deep learning and the
meaningfulness of data.
• Data Processing Architectures: Optimised and scalable architectures for analytics of
both data-at-rest and data-in-motion, with low latency delivering real-time analytics.
• Data Protection: Privacy and anonymisation mechanisms to facilitate data
protection. This is shown related to data management and processing as there is a
strong link here, but it can also be associated with the area of cybersecurity.
• Data Management: Principles and techniques for data management.
• The Cloud and High Performance Computing (HPC): Effective Big Data processing
and data management might imply the effective usage of Cloud and High
Performance Computing infrastructures.
• IoT, CPS, Edge and Fog Computing: A main source of Big Data is sensor data from an
IoT context and actuator interaction in Cyber Physical Systems. In order to meet real-
time needs it will often be necessary to handle Big Data aspects at the edge of the
system. This area is separately elaborated further in collaboration with the IoT
(Alliance for Internet of Things Innovation (AIOTI)) and CPS communities.
Vertical concerns
• Big Data Types and Semantics: The following 6 Big Data types have been identified,
based on the fact that they often lead to the use of different techniques and
mechanisms in the horizontal concerns, which should be considered, for instance, for
data analytics and data storage: (1) Structured data; (2) Time series data; (3)
Geospatial data; (4) Media, Image, Video and Audio data; (5) Text data, including
Natural Language Processing data and Genomics representations; and (6) Graph
data, Network/Web data and Metadata. In addition, it is important to support both
the syntactical and semantic aspects of data for all Big Data types.
• Standards: Standardisation of Big Data technology areas to facilitate data integration,
sharing and interoperability.
• Communication and Connectivity: Effective communication and connectivity
mechanisms are necessary in providing support for Big Data. This area is separately
further elaborated, along with various communication communities, such as the 5G
community.
• Cybersecurity: Big Data often need support to maintain security and trust beyond
privacy and anonymisation. The aspect of trust frequently has links to trust
mechanisms such as blockchain technologies, smart contracts and various forms of
encryption. Data protection has been identified as a focused area by BDVA and has
thus received its own horizontal area – with an associated set of ongoing research
topics and projects. It could have been grouped also under Cybersecurity, but this
has been kept as a separate area also because of the independent European research
areas of trust and security and the separate ECSO – European Cyber Security
Organisation.
• Engineering and DevOps for building Big Data Value systems: This topic will be
elaborated in greater detail along with the NESSI Software and Service community.
DataBench Grant Agreement No 780966
24You can also read