Worldwide application of IFRS 3, IAS 38 and IAS 36, related disclosures, and determinants of non-compliance - Research report 134
←
→
Page content transcription
If your browser does not render page correctly, please read the page content below
Research report 134

Worldwide application of IFRS 3, IAS 38
and IAS 36, related disclosures, and
determinants of non-compliance
Worldwide application of IFRS 3, IAS 38
and IAS 36, related disclosures, and
determinants of non-compliance
ACCA RESEARCH REPORT 134

Ioannis Tsalavoutas,
Lecturer in Accounting, The University of Stirling

Paul André
Professor of Accounting, ESSEC Business School, Paris
Director ESSEC Financial Reporting Centre

Dionysia Dionysiou,
Lecturer in Finance, The University of Stirling

Certified Accountants Educational Trust (London), 2014
ACCA’s international research programme generates high-profile, high-quality, cutting-edge research. All research reports
from this programme are subject to a rigorous peer-review process, and are independently reviewed by two experts of
international standing, one academic and one professional in practice.

The Council of the Association of Chartered Certified Accountants consider this study to be a worthwhile contribution to
discussion but do not necessarily share the views expressed, which are those of the authors alone. No responsibility for loss
occasioned to any person acting or refraining from acting as a result of any material in this publication can be accepted by the
authors or publisher. Published by Certified Accountants Educational Trust for the Association of Chartered Certified
Accountants, 29 Lincoln’s Inn Fields, London WC2A 3EE.

ACKNOWLEDGEMENTS

This report is the result of a research effort spanning a period of 18 months. The authors are grateful to many people for their
support. The project would not have been possible without the financial support and encouragement of ACCA. Yin Wang
(Company Reporting Practices Ltd) has contributed greatly during the development of the coding scheme and the data
collection process. Michael Mavromatis (Axios Systems) contributed in the early stages of the project in the development of
the structure of the database in which the data collected was stored. Richard Martin (ACCA), Barbara Davidson (IASB), Michael
Stewart (IASB) and an anonymous referee have provided helpful comments on earlier versions of the present report. Ioannis
Tsalavoutas and Dionysia Dionysiou thank the Accounting and Finance Division at the University of Stirling, and Paul André
thanks the ESSEC KPMG Financial Reporting Centre for additional financial support.

ISBN: 978-1-85908-489-2

© The Association of Chartered Certified Accountants, May 2014
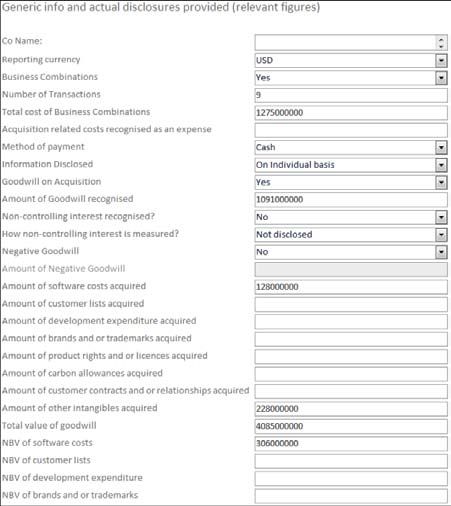
Contents

Executive summary                                                                                 5

1. Introduction                                                                                   10

2. IFRS 3 Business Combinations                                                                   15

3. IAS 38 Intangible Assets                                                                   25

4. IAS 36 Impairment of Assets                                                                32

5. Determinants of compliance levels with disclosures mandated by IFRS 3, IAS 38 and IAS 36       41

6. Conclusions                                                                                62

Appendix: Screen-shot of the database developed and used for the data collection              65

References                                                                                    66

  WORLDWIDE APPLICATION OF IFRS 3, IAS 36 AND IAS 38,                                        3
  RELATED DISCLOSURES, AND DETERMINANTS OF NON-COMPLIANCE
Abbreviations

ANC		     Autorité des Normes Comptables

CAS		     Chinese Accounting Standards for Business Enterprises

EC		      European Commission

EFRAG     European Financial Reporting Advisory Group

ESMA		    European Securities and Markets Authority

FASB		    Financial Accounting Standards Board

FRC		     Financial Reporting Council

FRRP		    Financial Reporting Review Panel

GAAP		    Generally Accepted Accounting Principles

IAS		     International Accounting Standards

IASB		    International Accounting Standards Board

IASC		    International Accounting Standards Committee

ICB		     Industry classification benchmark

ICAEW     Institute of Chartered Accountants in England and Wales

ICAS		    Institute of Chartered Accountants of Scotland

IFRS		    International Financial Reporting Standards

MASB		    Malaysian Accounting Standards Board

NZICA		   New Zealand Institute of Chartered Accountants

PRC		     People’s Republic of China

SEC		     Securities and Exchange Commission

4
Executive summary

This report investigates the accounting for, and information disclosed
under, IFRS 3 Business Combinations, IAS 36 Impairment of Assets, and
IAS 38 Intangible Assets, and examines compliance levels with the
mandated disclosures and their determinants.

The uniform application of IFRS across different jurisdictions     on the accounting policies introduced with IFRS 3. Second,
has been heavily questioned, since the implementation of           this report documents the significance and prevalence of, and
high-quality accounting standards (which IFRS claim to ensure)     accounting for, intangible assets across countries and
may not necessarily lead to high-quality reporting because of      industries. Third, the report discusses the frequency and
the influences of different socio-economic environments on         magnitude of the impairments recognised across countries
financial reporting practices (Larson and Street 2004; Ball        and industries, while capturing information about the
2006; Nobes 2006; Soderstrom and Sun 2007; Weetman 2006;           assumptions companies use for impairment testing. Fourth, it
Zeff 2007). This means that equal levels of compliance with        shows the level of compliance with the mandated disclosures
mandatory disclosure requirements and/or consistent                across countries and industries. Fifth, it identifies the firm-
measurement and display of similar transactions between            and country-level determinants of these compliance levels.
different companies may not be achieved. This concern is
investigated here, first, by examining the accounting for, and     Overall, the report highlights areas on which preparers,
the information disclosed under, IAS 36 Impairment of Assets,      regulators and enforcement bodies need to focus to improve
IAS 38 Intangible Assets and IFRS 3 Business Combinations.         the level of disclosure by companies. This should result in
Secondly, levels of compliance with these three standards’         more complete provision of information to the users of the
mandated disclosures and their determinants are considered.        financial reports. Furthermore, it highlights areas that
These investigations involved a large sample of companies          standard setters may need to improve in order to eliminate
from different countries around the world.                         ambiguity in the interpretation of the standards. This should
                                                                   result in greater comparability of the information provided by
Focusing on these three standards is important for users and       companies.
standard setters. First, several studies, including those from
the Financial Reporting Review Panel (FRRP 2006), the              SAMPLE SELECTION
European Commission (EC 2008), the Institute of Chartered
Accountants in England and Wales (ICAEW 2007), the                 Most EU listed companies adopted IFRS in 2005 for their
Securities and Exchange Commission (SEC) (2007) and                consolidated financial statements, while a significant number
Company Reporting Ltd (2007; 2008) consistently indicate           of other countries have now also adopted IFRS or claim
that there is an underlying issue of compliance with these         significant convergence of their national accounting
standards and that certain areas within the standards              standards with IFRS. Nonetheless, very little is known about
themselves pose problems in terms of comparability. Second,        the accounting for, and related disclosures under IAS 36, IAS
given the requirements in IFRS 3 that intangible assets be         38 and IFRS 3, not only among companies within the EU but
recognised separately on acquisition (FRRP 2006: 4), mergers       also those outside it that have recently adopted/converged
and acquisitions significantly increase the importance of          with IFRS. This report, therefore, draws on a large sample of
intangibles in firms’ financial statements. Third, the recently    companies in and outside the EU.
revised IFRS 3 (effective for financial periods starting on or
after 1 July 2009), together with the result of a desired          In order to examine the accounting for, and related
convergence on the topic of business combinations between          disclosures under, the three standards for the first year of
the IASB and FASB, introduces a number of significant              implementation of IFRS 3 (financial year 2010/11), a sample of
changes, the implications of which have yet to be investigated.    544 non-financial companies was selected from the EU,
                                                                   Australia, China, Hong Kong, New Zealand, Brazil, South
Major contributions arise from the present research. First, this   Africa and Malaysia. The companies were constituents of their
report documents the level of mergers and acquisitions             countries’ premier stock market indices as at 1 June 2011. For
(M&A) activity and its impact on financial statements,             the EU, constituents of the S&P Europe 350 index as at 1 June
including the types of asset acquired and their significance,      2011 are also used. This allows a focus on the companies that
the treatment of non-controlling interests and the level of        are the most likely to be followed by a significant number of
acquisition-related costs expensed. This leads to a reflection     investors (foreign and domestic).

  WORLDWIDE APPLICATION OF IFRS 3, IAS 36 AND IAS 38,                EXECUTIVE SUMMARY                                        5
  RELATED DISCLOSURES, AND DETERMINANTS OF NON-COMPLIANCE
SUMMARY OF FINDINGS offers two potential ways of measuring non-controlling
interest. Additionally, only 11 companies (14.4%) explicitly
Reflecting on the findings, overall, this report documents state that they measure their non-controlling interest at
significant disparities in the mandated information provided fair value (full goodwill approach), indicating that the
by different companies about business combinations, newly introduced alternative method is not popular
intangible assets and impairment testing. among firms.
Disclosures about business combinations (IFRS 3) • On average, 38.9% of the total purchase price is allocated
• For 280 companies (ie 51.5% of the sample) there is an to ‘Other intangible assets’. Companies are not explicit on
indication that at least one business combination took what is recognised in this ‘class’ of assets so there is a
place. Of these, 51 (or 18.2%) indicate that they had one or need for supportive disclosures on what these assets
more business combinations by disclosing some constitute.
information, such as number of businesses acquired,
consideration transferred, related costs expensed or • A large number of the sample companies do not disclose
method of payment, but do not disclose any further pro forma information about the business combinations.
information. It is assumed that these business Does this mean that it is too costly or ‘impracticable’to do
combinations are considered immaterial (individually and so in all these cases?
collectively) and hence that detailed information is not
merited. Nevertheless, the question that arises is why do Reflecting on the above findings, it becomes apparent that,
some firms disclose only selected information? without specific guidance on when and how items should be
disclosed, companies provide significantly disparate
• Similarly, 240 out of the 280 firms report the actual price/ information about business combinations, resulting in a lack
consideration transferred for completing the of comparability. From a user’s perspective, it is difficult to
combinations conducted and an identical number of firms determine whether this disparity is because firms do not view
disclose the method of payment for their combinations. their acquisitions as material, do not understand the
As above, it is not clear why some companies do disclose mandated requirements and/or simply do not follow the
and some do not. standard to the letter.
• Only 101 companies disclose the acquisition-related Application of IAS 38 and related disclosures
expenses incurred and expensed in the income • The research showed that ‘other intangibles’ feature as a
statement. In an attempt to identify the relative separate class of intangible assets in the statement of
importance of such disclosure, the research found that the financial position of 453 of the 517 companies (ie 87.6%)
mean (median) ratio of acquisition-related costs over that have at least one type of intangible asset other than
profit before tax for the firms disclosing such information goodwill. Additionally, this type of asset represents, on
separately is 2% (1%). Two conclusions arise from this. average, 5.28% of companies’ total assets. This would
First, the associated acquisitions costs expensed are very make one to expect that companies supply readers with
modest relative to the size of the companies in the sample more details about these assets. However, this is not the
and the volume of the business combinations conducted. case.
As a result, the change introduced by IFRS 3, ie expensing
all acquisition-related costs, does not lead to a significant • In countries such as the UK, Belgium, Hong Kong, France,
change in companies’ financial performance. Second, why Denmark, the Netherlands and Australia, almost 30% of
do other firms not disclose such information or clearly companies’ total assets relate to intangible assets
state that it is immaterial? (including goodwill). Additionally, constituents of the
consumer services and healthcare industries appear to
• Although 258 companies disclose that they recognise make higher investments in intangible assets, including
goodwill, only 61 disclose a qualitative description of the goodwill (respectively 36% and 40% of total assets of
factors that make up this goodwill. This leads to the these two industries). Thus, intangible assets are one of
conclusion that a large number of companies fall short of the most material asset types in a large number of
the IFRS 3 requirement for such information. In most companies in the larger stock markets worldwide.
cases, even the 61 companies that do provide a
description give nothing more than a brief statement • A large proportion of the sample companies do not
referring to synergies expected to arise from the disclose whether the useful lives of intangible assets
combinations. There appears to be a lack of guidance on (either acquired or internally generated) are indefinite or
what is expected from this requirement. Note that the finite and, if finite, the useful lives or the amortisation rates
ICAS and NZICA study (2011) recommends deletion of this used. Similarly, a large proportion of the sample firms do
requirement. not disclose the line item(s) of the income statement in
which any amortisation of intangible assets is included.
• Out of the 76 companies for which acquisitions involve Companies in the consumer goods and consumer services
between 50% and 99% of the acquiree’s assets, 33 remain industries provide this information more frequently than
silent on how the non-controlling interest is measured. firms in the utilities and basic materials industries.
Hence, users do not receive full information as IFRS 3 now
6• There are 151 companies that give an indication of having • IAS 36 requires companies to disclose the growth rate
at least one intangible asset with indefinite useful life. used to extrapolate cash flow projections beyond the
Only 58% (ie 88) of these companies, however, disclose period covered by the most recent budgets/forecasts. In
the reasons supporting the assessment of an indefinite practice, 21% of the 485 companies that disclose some
useful life and/or the factor(s) that played a significant role information about the cash flow estimations do not
in determining that the asset has an indefinite useful life. disclose this information.
• The majority of firms that should disclose a reconciliation • IAS 36 has recently introduced a requirement for
of movement of the carrying amount of intangible assets companies to disclose (i) the period over which
at the beginning and end of the period, do so (about management has projected cash flows; (ii) the growth rate
94%). used to extrapolate cash flow projections; and (iii) the
discount rate(s) applied to the cash flow projections, if fair
• No company was identified that measures intangible value less costs of disposal has been used and fair value
assets at fair value (this is consistent with earlier studies, less costs of disposal is determined using discounted cash
eg Glaum et al. 2007). As a result, there are no effects on flow projections. Of the surveyed companies, 22 fall into
the comparability of accounting information with this category and 21 of these do provide the newly
companies from China (or the US) where the revaluation introduced mandated disclosures.
model is not permitted. The IASB could consider the
usefulness of permitting this practice. Given the complexity of the standard and the depth of
information it requires, the analysis illustrates the disparities
Overall, intangible assets account for a large proportion of between companies in the amounts and types of information
companies’ assets and yet relevant mandatory disclosures are actually provided. This reinforces the need for a review of the
not provided in full. For the IASB, ensuring that there is disclosures mandated by IAS 36 along with provision of
sufficient and comprehensive guidance to promote the best specific guidance on when this information is expected.
possible communication of relevant information should be Arguably, this report’s recommendation for specific guidance
considered a key priority. on the application of the materiality principle across different
disclosure requirements seems pertinent, especially in IAS 36.
Application of IAS 36 and related disclosures
• Almost all companies reporting recognition of an Additionally, beyond the need for promoting better guidance
impairment disclose the amount of the impairment about the disclosures mandated by the standard in general,
separately (334 out of 339 companies), as required by the there are two areas related to recognition and measurement
standard. The most frequent type of asset to be impaired that also appear to need improvement. The first relates to the
is plant and machinery, with land and buildings to follow. It use of post-tax discount rates in the impairment testing
is more frequent for companies to recognise an calculations. Although in principle the standard seems to
impairment on an intangible asset with finite useful life require pre-tax discount rates, it is worded in a way that
than on goodwill. This may not be that surprising if one allows companies to use post-tax rates instead. This
considers the standard’s requirement to test these for apparently results in great variation in practice, which hinders
impairment at an individual level, whereas goodwill is comparability of the information reported. Further, while one
tested against the recoverable amount of an entire would expect companies to use pre- or post-tax cash flows
cash-generating unit. when using pre- or post-tax discount rates, respectively, this
is not necessarily verifiable given the relevant disclosure
• The large majority of companies reporting recognition of requirements in the standard.
a reversal of an impairment disclose separately the
amount of the reversal (93 out of 101 companies), as is The second area relates to the option companies have in
required by IAS 36. Even so, only 37 companies disclose a reversing impairment losses recognised. IAS 36 requires a
required justification for the reversal recognised. company to disclose the main events and circumstances that
led to recognition of reversals of impairment losses (providing
• Of the 495 companies for which paragraphs 134 and 135 that these reversals are material). Only 37% of companies do
are potentially relevant, 35 (7.1%) remain silent as to the so while the mean (median) percentage of reversal of
methods adopted for measuring the recoverable amounts impairments over operating profit is a non-trivial 7% (1%).
of the assets, even though this is required. On a more Given that these reversals appear to be significant and that
positive note, although 75 companies disclose that the this practice is not permitted under US GAAP and CAS, it is
period of cash flows used in the impairment testing surprising that companies fall short of the standards’
process exceeds five years (which is not recommended by requirements. This is another example where guidance with
the standard), they do give a justification for why cash regards to materiality would be useful.
flows beyond a five-year period have been used.
• Although IAS 36 recommends that the discount rates
used during the impairment-testing process be calculated
on a pre-tax basis, a large number of the sample
companies (92) use post-tax discount rates.
WORLDWIDE APPLICATION OF IFRS 3, IAS 36 AND IAS 38, EXECUTIVE SUMMARY 7
RELATED DISCLOSURES, AND DETERMINANTS OF NON-COMPLIANCELevels of compliance with mandated disclosures1 CONCLUSION AND RECOMMENDATIONS
• The mean (median) overall compliance score is 83% (84%).
Interestingly, 75% of the sample firms have at least 75% This report documents a high level of disparity of information
compliance levels. Firms with the lowest compliance and what appears to be non-compliance, across a broad
scores (ie the bottom quartile) report minimum international set of firms, with the mandatory disclosure
compliance levels of 33%. At the other end of the requirements in IFRS 3, IAS 36 and IAS 38. Although
spectrum, those in the top quartile (25%) of highly materiality thresholds have been imposed by the researchers,
compliant firms comply with at least 93% with the access to inside information would be necessary to determine
requirements of the three standards. whether 1) companies consider certain transactions (eg a
business combination) or items (eg an intangible asset or an
• Mean (median) compliance levels of just above 80% are impairment loss) not to be material enough, 2) the standards
valid not only for total compliance scores, but also for are misunderstood/not clear enough, or 3) companies
individual compliance levels with IFRS 3, IAS 36 and IAS 38. deliberately fail to follow the mandatory disclosure
requirements.
• For the 23 countries examined, this report documents
average compliance scores from 77% to 90%. Specifically, This research is very timely in that it reflects on the current
New Zealand is the country with the highest average debate about the need for or usefulness of mandatory
compliance of 97%. Ireland is the country with the second disclosures within IFRS. In January 2013, the IASB hosted a
highest average disclosure score of 91%. UK follows with public Disclosure Forum to consider the challenging area of
90%. In contrast, some countries report much lower disclosure overload. Participants included some of the
compliance levels. Greece is the country with the lowest organisations that have undertaken work in the area of
compliance score, at only 67%. Brazil has a disclosure disclosure in financial reporting (see EFRAG 2012; ICAS and
score of 75%. Austria, Spain, China, South Africa and NZICA 2011)). In May 2013, the IASB issued a Feedback
Portugal are at 76%. Statement about this event and, in July 2013, the chairman of
the IASB, Hans Hoogervorst, gave a speech entitled ‘Breaking
• Less variability on average compliance levels is seen at the the boilerplate’ outlining ‘10 good proposals to make
industry level. Compliance scores by industry ranges from disclosures more effective’. Furthermore, FASB and EFRAG,
80% to 88%. The oil and gas industry is weaker in its among others, have expressed concerns about the potentially
overall compliance scores (80%), while the technology excessive quantity of mandated disclosures and the need for
sector has the highest compliance score, 87%. a disclosure framework. Finally, in July 2013, the IASB started
its post-implementation review of IFRS 3 (2008), part of which
Determinants of compliance with mandatory disclosures is the identification of areas in which ‘implementation
• Firms reporting impairments comply less with mandatory problems or unexpected costs with IFRS 3 were encountered’
disclosure requirements of IFRS 3, IAS 36 and IAS 38 than (IFRS Foundation 2013b). The recommendations below aim to
do firms without impairments. further this debate and discussion.
• Cross-listing in the US increases compliance levels, which To facilitate easier application of IFRS by preparers and
is consistent with the bonding and signalling hypotheses. enhance clarity and comparability of accounting information
for users, this report recommends that the IASB consider
• The strongest the enforcement mechanisms in a country, revisiting the disclosure requirements at a standards level.
the higher the compliance levels. In fact, it is the auditing Such a review should reflect on the need for and provision of
component of the enforcement environment that drives specific materiality thresholds that would trigger the
this result. disclosure of particular information. Additionally, in the
absence of disclosure, IFRS should require companies to
• Compliance levels are lower when a company is from a provide an explicit statement explaining when disclosure is
country with a legal system of French origin. not merited or explaining where providing certain disclosures
is impractical, which would reduce information asymmetry
Earlier evidence indicates that companies did not fully comply and improve comparability across companies. This will
with previous national mandatory disclosure requirements. require a broad consultation with preparers, users, auditing
The present results indicate that companies continue not to firms, enforcement bodies and academics.
do so even after adopting IFRS. Hence, the research findings
in this report are in line with concerns that adoption of IFRS
does not necessarily lead to high-quality reporting across
different jurisdictions. Beyond the quality of the standards,
different firm and country-level factors (eg enforcement, audit
environment, listings) influence financial reporting practices.
1. Compliance scores are summarised where each item is of equal importance
(CK method). Chapter 5 also presents results using a method of measuring
compliance where each standard is of equal importance (PC method). Results
are qualitatively similar.
8Moreover, the report highlights a few individual items with which a majority of the sample firms, irrespective of country or industry, fail to comply. This can be interpreted as a signal that the relevant standards may not be clear about what is expected. Interestingly, some of these items are included in the list of proposed items for deletion from the relevant standards in the recommendations of the ICAS/NZICA (2011) report. Given that the IASB is taking a view that each disclosure item should be judged separately (Hoogervorst’s third proposal in ‘Breaking the boilerplate’ July 2013), these particular items need to be revisited and potentially re- worded. The items from specific paragraphs identified as those with lower compliance (see Table 5.5, page 51) could be a good starting point for the IASB. This would reduce the possible misinterpretation of mandatory disclosure requirements. The study is also timely given enforcement initiatives. ESMA (2013) has recently announced the ‘European common enforcement priorities for 2013 financial statements’. It refers to specific aspects of the IFRS application in relation to, among others, impairment of non-financial assets (including a focus on information about cash-flow projections, key assumptions and sensitivity analysis) and disclosure of significant accounting policies. This follows the 2012 enforcement priorities, which discussed valuation of goodwill and intangible assets with indefinite life and related disclosures (including a call for more granular disclosures). As studies from professional bodies and academics indicate, non-compliance with mandated disclosures is an issue that was observed long before the mandatory implementation of IFRS. As a result, transparency depends not only on standards mandating high-quality accounting but also on rigorous enforcement of these standards. Enforcement is a significant determinant of compliance and more specifically the auditing environment. Consistent and full application of the mandated disclosures depends on both the enforcement bodies and the auditing function in each country. WORLDWIDE APPLICATION OF IFRS 3, IAS 36 AND IAS 38, EXECUTIVE SUMMARY 9 RELATED DISCLOSURES, AND DETERMINANTS OF NON-COMPLIANCE
1. Introduction

1.1 AIMS AND OBJECTIVES                                                     •   To investigate international compliance with the
                                                                                mandatory disclosure requirements for these three
Most EU listed companies adopted IFRS in 2005 for their                         standards, namely IFRS 3, IAS 36 and IAS 38.
consolidated financial statements and many other countries
have done the same, while still others claim significant                    •   To investigate firm- and country-level determinants of
convergence of their national accounting standards with IFRS.                   company compliance levels.
Nonetheless, the uniform cross-jurisdictional application of
IFRS (or convergence of national standards with IFRS) has                   For the first objective, no threshold of materiality was set and
been heavily questioned since the implementation of high-                   the research simply captured and reported all the information
quality accounting standards (which IFRS claim to ensure) may               provided by companies about each topic. More specifically,
not necessarily lead to high-quality reporting (Larson and                  following the steps of Fasshauer et al. (2008), a database was
Street 2004; Ball 2006; Nobes 2006; Weetman 2006;                           developed to facilitate a systematic collection of different
Soderstrom and Sun 2007; Zeff 2007). This means that equal                  types of disclosures required by the three standards studied.
levels of compliance with mandatory disclosure requirements                 In this way, the frequency and size of business combinations
and/or consistent measurement and display of similar                        reported were identified, as were the amounts of acquisition-
transactions between different companies may not                            related costs incurred and recognised as expenses, and the
necessarily be achieved. The research investigated this                     measurement methods of any non-controlling interests.
concern by examining a large sample of companies from                       Subsequently, the research identified the magnitude of
different countries with a focus on mandated disclosures of                 intangible assets on companies’ financial statements and the
IAS 36 Impairment of Assets, IAS 38 Intangible Assets, and                  methods used to recognise these intangibles. Additionally,
IFRS 3 Business Combinations.                                               the most common types of intangible assets recognised and
                                                                            how many companies recognise intangible assets with
Studies conducted by several institutions, such as the FRRP                 indefinite useful lives, other than goodwill, were identified.
(2006), ICAEW (2007), SEC (2007), Company Reporting Ltd                     The research also looked at the methods used for testing for
(2007; 2008), and European Commission (2008), consistently                  impairment (where relevant), the assumptions used for
indicate that there is an underlying issue of non-compliance                measuring the recoverable amount of a cash-generating unit
with these standards, and that there are particular areas that              (eg discount rates; horizon of management budgets; growth
pose special problems in terms of comparability of                          rates used to extrapolate management projections of future
information disclosed. In addition, mergers and acquisitions                cash flows), and determine their frequencies. Finally, the
waves in the last decade have significantly increased the                   research considered the types of asset impaired and the
importance of intangibles in firms’ financial statements, as a              reasons that give rise to an impairment loss (or a reversal);
result of the requirements of IFRS 3 to recognise separately                and the effect that intangible asset impairments (or reversals)
intangible assets on acquisition (FRRP 2006).2 Nonetheless,                 have on companies’ operating profit as reported in the
little was known about whether companies from the EU have                   financial statements. The Appendix provides an extract of the
improved in relation to the level of information they disclose              list of the items captured directly from companies’ financial
with regard to the three standards or about the disclosure                  statements.
behaviour of companies from countries outside the EU that
have recently adopted IFRS. Evidence indicating whether                     To address the second objective, in line with earlier research,
non-EU companies that apply IFRS produce financial                          specific benchmarks were set for assuming materiality of
statements with disclosure compliance levels comparable to                  information and a disclosure checklist was developed with
those of EU companies was sparse. Accordingly, as well as                   the items mandated by the three standards. Then, following
identifying the companies’ financial reporting choices with                 two disclosure index methods, aggregate compliance scores
regards to IFRS 3, IAS 38 and IAS 36, investigations into                   were computed as well as compliance scores for each
whether companies comply with the disclosure requirements                   standard separately. Findings are reported on an aggregate,
and into possible reasons for non-compliance are pertinent.                 on a country and on an industry basis.

On that basis, the research reported here had the following                 To address the third research objective, the findings about
objectives.                                                                 the second research objective (ie compliance scores) were
                                                                            used to conduct univariate as well as OLS cross-sectional
•    To hand-collect information directly from the companies’               multivariate regression analyses. These analyses indicate the
     financial statements and identify the accounting for and               firm- and country-level factors associated with higher or lower
     related information disclosed under IAS 36 Impairment of               compliance levels.
     Assets, IAS 38 Intangible Assets, and IFRS 3 Business
     Combinations across countries and industries.

2. For example, an Ernst & Young (2009) study of over 700 deals that took
place in 2007 indicates that 23% of the deal values were allocated to
identifiable assets, while close to 50% were allocated to goodwill.

10
1.2 RELEVANCE OF THE RESEARCH TO REGULATORS, This study complements and extends earlier studies (FRRP
ENFORCEMENT BODIES AND STANDARD SETTERS 2006; ICAEW 2007; Glaum et al. 2007; EC 2008) by providing
an in-depth analysis and evaluating the disclosures provided
This research is relevant to practice, with an appeal to by a large worldwide sample of companies that reported
standard setters, regulators and academics. This is because under IFRS (or converged national standards) during the first
there is currently heated debate among all stakeholders year of adoption of IFRS 3 as revised in 2008. By identifying
about the role and necessary extent of mandatory the levels and types of corporate disclosure, this report also
disclosures. Additionally, there have been some studies complements recent research by ICAS and NZICA (2011) that
(mostly from professional bodies and regulators) about the proposes reductions in and changes to the disclosures
disclosures mandated by these standards, but the results of mandated by the standards under examination.
these studies can now be considered as outdated and more
recent evidence is needed for informing the current debate. Overall, the present research makes two major contributions.
This research contributes to this end. First, it highlights areas on which preparers, regulators and
enforcement bodies need to focus to improve the level of
More specifically, one of the main objectives of the IASB, as disclosure by companies. This should result in the provision of
stated in the second paragraph of the IFRS constitution, is to more complete information to the users of the financial
produce enforceable standards (IFRS 2013a). Additionally, one reports. Second, it highlights areas that standard setters may
of the main improvements expected from IFRS adoption was need to improve in order to reduce ambiguity in the
that of comparability. This means that ‘users must be able to standards. This should result in greater comparability of the
compare the financial statements of different entities in order information provided by companies.
to evaluate their relative financial position, performance and
changes in financial position. Hence, the measurement and 1.3 SAMPLE COMPOSITION
display of the financial effect of like transactions and other
events must be carried out in a consistent way for different Choice of countries and period
entities (emphasis added)’ (IFRS Framework 2009, 29: 85). In To examine worldwide convergence of disclosures under
fact, it is well documented that companies do not always IFRS 3, IAS 36, IAS 38, a broad range of countries with
comply with mandatory disclosure requirements in adopted different institutional and regulatory regimes that have made
standards (see Chapter 5). The evidence shows that the IFRS mandatory or that indicate convergence with IFRS are
existence of legislation and enforcing bodies does not needed. Second, it is also necessary to have a mix of
guarantee full compliance (Yeoh 2005). countries with developed and emerging stock markets.
In view of this background, in January 2013 the IASB hosted a Using the above criteria, companies were selected from the
public disclosure forum to consider the challenging area of following 23 countries: Australia, Austria, Belgium, Brazil,
disclosure overload. Some of the organisations that have China, Denmark, Finland, France, Germany, Greece, Hong
worked on disclosure in financial reporting (eg ANC, EFRAG, Kong, Ireland, Italy, Malaysia, the Netherlands, New Zealand,
FASB, FRC, ICAS, NZICA, and ESMA) were invited to present Norway, Portugal, South Africa, Spain, Sweden, Switzerland
their findings at this meeting. In May 2013, the IASB issued a and the UK for the financial year 2010. The year 2010 was
Feedback Statement about this event and, in June 2013, the chosen to ensure that all firms were applying the revised
chairman of the IASB Hans Hoogervorst, in his speech standards, following adopted changes in 2008 (the 2011
entitled ‘Breaking the Boilerplate’, outlined ‘10 good annual report was used for firms with their financial year end
proposals to make disclosures more effective’ (Hoogervorst, between January and June 2010).
2013). In addition, as part of the discussion paper on the
forthcoming revisions in the IASB Conceptual Framework, a Although countries in the EU imposed the mandatory
lot of attention is given to whether more guidance and implementation of IFRS in 2005, non-EU countries either
‘communication principles’ should be provided in the revised adopted IFRS or converged their national standards to IFRS in
Framework. In line with this, in October 2013 the IASB subsequent years. For example, in China ‘The new Chinese
announced the formation of a new staff group to focus on the Accounting Standards for Business Enterprises (CAS)’ were
‘Disclosure Initiative’ (IASB 2013a). Moreover, the FASB is published by the Ministry of Finance (MoF) in 2006 and
involved in the ‘Disclosure Framework’ project, with the became effective on 1 January 2007. These standards are
intention of improving effectiveness of disclosures in notes to substantially converged with IFRS, except for certain
financial statements while establishing disclosure modifications (eg to disallow the reversal of impairment
requirements in various standards. Finally, in July 2013, the losses on long-term assets), which allegedly reflect China’s
IASB started its post-implementation review of IFRS 3 (2008), unique circumstances and environment (iasplus.com 2014).
part of which is the identification of areas in which Chinese companies are required to disclose similar
‘implementation problems or unexpected costs with IFRS 3 information to that of other companies that publish their
were encountered’ (IASB 2013b). accounts in accordance with IFRS. Whether, and to what
WORLDWIDE APPLICATION OF IFRS 3, IAS 36 AND IAS 38, 1. INTRODUCTION 11
RELATED DISCLOSURES, AND DETERMINANTS OF NON-COMPLIANCEextent, these requirements are followed is an interesting to increase sample sizes at the country level (see Table 1.1).
question to investigate.3
The largest non-European companies were identified from
Additionally, the Malaysian Accounting Standards Board various country indices, on the basis of their market value.
(MASB) announced in August 2008 that Malaysia would Following this, the sample included the 50 largest non-
achieve full convergence with IFRS by 1 January 2012 (MASB financial companies in the ASFA Index (Australia) and the
2008). The plan for convergence has been implemented in non-financial firms of the IBRX 50 index (Brazil), the non-
several phases. The first step began on 1January 2005 when financial firms of Shanghai SSE 50 Index (China), the non-
the MASB standards were renamed Financial Reporting financial firms of the 50 largest firms in the Hang Seng Index
Standards (FRS) and their numbering changed to correspond (Hong Kong), the non-financial firms of the FTSE Bursa
to those of the IFRS (MIA 2005). The FRS comprised 38 Malaysia KLCI (Malaysia), the non-financial firms of the NZX 15
standards, of which 21 are new standards and 17 revised (New Zealand) and the non-financial firms of FTSE/JSE RAFI
reporting standards. The new and revised FRSs became 40 (South Africa).
effective on 1 January 2006. These included FRS 3, FRS 136,
and FRS 138 (ie IFRS 3, IAS 36 and IAS 38).4 Table 1.1 describes the sample composition process,
providing information about each step overall and at the
Further, Australia, Brazil, Hong Kong, New Zealand and South country level. From the 843 firms in total comprising the
Africa were chosen as they have also either adopted IFRS or above indices, the firms participating in the general financial
converged their national standards to IFRS. The rationale for sectors (195 in total) are excluded. To avoid multiple uses of
focusing on the chosen countries is that, although they all the same firm, firms cross-listed in another country of
have adopted IFRS or have converged their national investigation are included only for the country of primary
accounting standards to IFRS, they do not share many listing. There are 26 firms excluded owing to this type of
common features in socio-economic context, legal cross-listing. Firms with dual shares (10 firms) are also
background, familiarity with IFRS or level of stock-market excluded. Subsequently, after identifying the financial year
development. In this way, this report explores whether IFRS end (FYE) for each firm, the annual report that corresponds to
are applied consistently across different countries and the first IFRS 3 implementation year was collected from the
whether de facto comparability is achieved. Focusing on such company’s webpage or Thomson One Banker database.
a diverse sample of companies provides recent evidence on Firms following US GAAP (13) and Canadian GAAP (1) were
what the European listed companies report in these areas (ie also excluded. Firms that do not report financial statements in
it extends the studies conducted by FRRP (2006), ICAEW English (22) and firms for which financial or other necessary
(2007), and EC (2008)) and sheds light on non-EU companies’ data (from various sources) are not available (13) were also
disclosures, for which earlier evidence is limited. excluded.
Choice of firms Finally, as the research investigated levels of compliance with
Consistent with the approach followed by Kvaal and Nobes the three standards, firms for which none of the three
(2010) and Fasshauer et al. (2008), the sample represents the standards (IFRS 3, IAS 36 or IAS 38) apply were removed from
‘blue chip’ companies in these geographical areas (excluding the sample (19). As Table 1.1 shows, following the application
financial institutions). The sample selection process follows of these criteria, 544 companies were left in the sample.
three steps. First, the largest listed firms in the 23 countries
were identified. For the European countries, the constituency Table 1.2 provides information on the sample composition by
of the European S&P 350 was used, which includes the largest country and industry. The latter classification is based on the
and more liquid EU companies that are the most followed and 10 industries specified by the Industry Classification
analysed. Beyond the European S&P 350 companies, Benchmark (ICB). Approximately 17% of the sample consists
individual European firms included in large-cap country- of UK firms (91 firms), 8% of French firms (45) and 7% of
specific indices were added to the potential sample in order Australian firms (38). The weight of the remaining countries is
much smaller.
3. IAS 38 allows both the cost model and the revaluation model for the
measurement of intangible assets. ASBE 6 (Accounting Standards for Business
Enterprises) only allows the cost model. Additionally, ASBE 8 prohibits the
reversal of all impairment losses but IAS 36 only prohibits the reversal of
impairment loss for goodwill. Furthermore, business combinations involving
entities under common control are outside the scope of IFRS 3 but addressed
in ASBE 20. Finally, reverse acquisitions are covered in IFRS 3 but are not
addressed in ASBE 20. All these differences were taken into account in the
capturing of the data and reporting of the findings.
4. FRS 3 was updated to incorporate the amendments in IFRS 3 (2008). These
amendments were effective for annual periods beginning on or after 1 July
2010, resulting in their being relevant for Malaysian companies a year later
than for the remaining companies in the sample. Given the differences in
recognition and measurement of goodwill and non-controlling interests
between the two standards, this report’s analyses of Malaysian disclosures
focus on the disclosures mandated by the old version of IFRS 3.
12Table 1.1: Sample selection process
Final
Suggested sample Companies excluded sample
Additional
EU firms Accounts IFRS3,
not not Accounts/ IAS38 and
Criterion for constituent Initial no of Excluding Cross Dual US Canadian available data not IAS36 not
Country inclusion of S&P 350 companies financials N listed shares GAAP GAAP in English available applicable Total
Australia 50 largest 50 0 50 3 1 3 0 0 3 2 38
non-financial
Austria S&P 350* ATX 20 3 17 0 0 0 0 0 0 2 15
Belgium S&P 350* BEL 20 19 8 11 0 0 0 0 0 0 0 11
Brazil IBRX 50 50 13 37 0 3 1 0 4 3 1 25
China Shanghai SSE 50 50 22 28 0 0 0 0 18 1 0 9
Denmark S&P 350* OMXC 20 20 5 15 1 0 0 0 0 0 1 13
Finland S&P 350* OMXH 25 25 3 22 1 0 0 0 0 0 0 21
France S&P 350* CAC 40 52 6 46 1 0 0 0 0 0 0 45
Germany S&P 350* DAX 30 37 5 32 0 2 1 0 0 0 0 29
Greece S&P 350* ASE 20 20 9 11 0 0 0 0 0 0 2 9
Hong kong 50 Largest Hang 50 22 28 3 0 0 0 0 0 1 24
Seng Index
Ireland S&P 350* ISEQ 20 21 1 20 1 0 0 0 0 0 1 18
Italy S&P 350* S&P/MIP 32 11 21 0 0 0 0 0 1 0 20
Malaysia FTSE BURSA 30 7 23 1 0 0 0 0 1 2 19
Malaysia KLCI
Netherlands S&P 350* AEX 26 5 21 2 0 0 0 0 2 0 17
New Zealand NZX 15 15 3 12 0 0 0 0 0 0 1 11
Norway S&P 350* OBX 24 3 21 1 0 2 1 0 0 0 17
Portugal S&P 350* PSI-20 20 3 17 0 0 0 0 0 0 0 17
South Africa FTSE/JSE RAFI 40 40 13 27 4 0 0 0 0 0 2 21
Spain S&P 350* IBEX 35 35 8 27 1 0 0 0 0 0 1 25
Sweden S&P 350* OMXS 30 33 5 28 5 1 0 0 0 0 1 21
Switzerland S&P 350* SMI 47 13 34 1 1 4 0 0 0 0 28
UK S&P 350* FTSE 100 127 27 100 1 2 2 0 0 2 2 91
Total 843 195 648 26 10 13 1 22 13 19 544
Table 1.2: Sample composition by country and industry
Basic Consumer Consumer Oil and Telecomm-
Country materials goods services Healthcare Industrials gas Technology unications Utilities Total
Australia 10 2 8 3 8 4 0 1 2 38
Austria 1 0 0 1 8 2 0 1 2 15
Belgium 2 1 3 2 1 0 0 2 0 11
Brazil 5 7 4 0 4 1 0 2 2 25
China 5 0 1 0 2 1 0 0 0 9
Denmark 0 3 0 5 4 1 0 0 0 13
Finland 5 1 2 1 7 1 2 1 1 21
France 1 10 11 2 11 2 3 1 4 45
Germany 5 7 3 3 6 0 2 1 2 29
Greece 1 0 1 0 3 2 0 1 1 9
Hong Kong 0 5 6 0 5 1 1 2 4 24
Ireland 1 4 5 2 5 1 0 0 0 18
Italy 1 5 1 0 3 2 1 1 6 20
Malaysia 0 4 2 0 4 2 0 4 3 19
Netherlands 3 3 2 0 4 2 2 1 0 17
New Zealand 1 0 2 2 3 0 0 1 2 11
Norway 2 1 1 0 2 10 0 1 0 17
Portugal 4 0 3 0 4 1 0 2 3 17
South Africa 9 2 4 1 2 1 0 2 0 21
Spain 1 1 2 1 9 3 1 1 6 25
Sweden 3 3 2 1 9 0 1 2 0 21
Switzerland 3 5 1 6 10 1 1 1 0 28
UK 11 11 23 3 18 8 6 4 7 91
Total 74 75 87 33 132 46 20 32 45 544
WORLDWIDE APPLICATION OF IFRS 3, IAS 36 AND IAS 38, 1. INTRODUCTION 13
RELATED DISCLOSURES, AND DETERMINANTS OF NON-COMPLIANCE1.4 STRUCTURE OF THE REPORT The rest of this report is organised as follows. Chapter 2 provides an overview of IFRS 3 Business Combinations and discusses its applicability in the sample. The chapter continues by presenting pertinent findings from the current research and discusses their implications. Chapters 3 and 4 replicate the analysis for IAS 38 Intangible Assets and IAS 36 Impairment of Assets, respectively. The information presented in these three chapters does not explicitly measure compliance with the standards. Rather, it captures any relevant information disclosed by each firm and presents relevant descriptive statistics. Chapter 5 provides detailed evidence on compliance. It examines whether firms comply with the disclosures mandated by IFRS 3, IAS 38 and IAS 36. It reports disclosure scores and investigates factors that are associated with compliance, while considering earlier relevant evidence after controlling for firm-, industry- and country- specific factors. Finally, Chapter 6 summarises the findings and conclusions while reflecting on the objectives. 14
2. IFRS 3 Business Combinations

2.1 INTRODUCTION                                                    2.2 ACQUISITIONS REPORTED AND RELATED
                                                                    DISCLOSURES
Paragraph 59(a) of IFRS 3 requires companies to disclose
detailed information on business combinations that occur            How information on business combinations is provided
during a reporting period. The standard prompts the                 As a first step, the research identified firms that undertook at
preparer of the financial statements to follow the disclosures      least one business combination in the period under
mandated in the application guidance (ie Appendix B of the          examination. There were 280 companies (51.5% of the 544
standard) and those specified in paragraph B64 in particular.       sample firms) that indicated that at least one business
The information required by paragraph B64 is to be                  combination took place in the period under examination. It is
presented for ‘individually’ material transactions. Companies       generally accepted that mergers and acquisitions are
are required to report this information only in aggregate           positively correlated with economic growth conditions (eg
(paragraph B65) for individually immaterial transactions. This      DePamphilis 2011). Considering the 2007–8 financial crisis
chapter draws on the disclosures mandated by paragraphs             (which was having widespread effects at the time of the
B64 and B65. It presents evidence of the information                corporate financial statements analysed), it is plausible that
disclosed by the sample firms and discusses the level of            business combinations would be fewer and smaller than when
variation in the disclosures provided.                              economies worldwide were growing.5

When companies’ financial statements and accompanying               Figure 2.1 indicates how the 280 companies for which there is
notes are examined, it becomes apparent that when a firm            an indication of a business combination disclose the
provides some information relating to business combinations,        information on combinations. Of these, 42.5% (119 companies)
it does not necessarily imply that all IFRS 3 requirements are      disclose some information about business combinations on
applicable to that firm. A company may provide some                 an aggregate basis and 26.8% (75 companies) on an individual
information about business combinations that took place             basis. Additionally, 12.5% (35 companies) disclose some
during the year but it may not consider these transactions to       information both on an individual and on an aggregate basis.
be sufficiently material (either individually or collectively) to   Interestingly, a relatively large number of companies (51, or
necessitate producing all the information required by the           18.2% of this sub-sample) indicate that they had one or more
standard. Where companies apply this type of discretion it          business combinations by disclosing some information such
can result in significant disparity in the information provided     as number of businesses acquired, consideration transferred,
to financial statement users. The researchers did not impose a      related costs expensed or method of payment, but do not
materiality threshold here and simply captured relevant             disclose any further information. It must be assumed that
disclosures as found. Instead, to judge the extent of               these business combinations are considered immaterial
companies’ compliance with the disclosures mandated by the          (individually and collectively) by the companies concerned.
standard, a compliance score was developed for the analysis
discussed in Chapter 5 of this report.                              Not all the 280 companies disclose the exact number of
                                                                    business combinations made during the year, indicating the
                                                                    variation in the level of the information provided across
                                                                    companies. Only 208 (74.3%) companies provide this
Figure 2.1: Companies indicating having had at least one            information. For these latter firms, the mean (median) number
business combination, analysed by level of detail of                of business combinations made per company is 3.6 (2.0).
corresponding information disclosed.                                Figure 2.2 shows that, from these 208 companies, 86 (41.3%)
                                                                    conducted only one business combination and four
                                                                    companies (1.9%) conducted more than 20 business
                                                                    combinations in the first year of the application of IFRS 3 (2008).
   No details disclosed
                 (18.2%)
                                              On individual basis   Of the 75 companies that disclose some information on an
                                              (26.8%)
                                                                    individual basis (see Figure 2.1), only 48 firms disclose the
                                                                    exact number of transactions completed. For this sub-set of
                                                                    firms, the mean (median) number of business combinations
                                                                    made per company is 4.9 (3). Of the 119 companies disclosing
        Both                                                        some information about business combinations on an
      (12.5%)
                                                                    aggregate basis, 112 disclose the exact number of
                                                                    transactions completed. For this sub-set of firms, the mean
                                                                    (median) number of business combinations made per
                                                                    company is 2.6 (1.0). Of the 35 companies that disclose some
                                              On aggregate basis    information about business combinations both on an
                                              (42.5%)               individual and on an aggregate basis (see Figure 2.1), only 20

                                                                    5. As an example, Glaum et al. (2007) report that of the 357 European
                                                                    companies with financial years ending between 31 December 2005 and 31 March
                                                                    2006 making up their sample, 241 (68%) reported acquisitions during 2005.

  WORLDWIDE APPLICATION OF IFRS 3, IAS 36 AND IAS 38,                 2. IFRS 3 BUSINESS COMBINATIONS                                     15
  RELATED DISCLOSURES, AND DETERMINANTS OF NON-COMPLIANCE
disclose the exact number of transactions completed. For this Fair values of assets acquired
sub-set of firms, the mean (median) number of business The revised paragraph B64(f) of IFRS 3 requires the acquirer
combinations made per company was 6.5 (5.5). For the to disclose the acquisition-date fair value of the total
remaining 28 companies that disclose the number of business consideration transferred.6 Out of the 280 firms that indicate
combinations conducted during the year, the mean (median) at least one business combination, 240 (85.7%) disclose the
number is 3.0 (1.5). Nonetheless, these firms remain silent on actual price/consideration. Many companies provide relevant
other information (eg value of goodwill recognised, method information on an aggregate basis making it impossible for
of payment, acquisition-related costs, and so on) and, as a users of financial statements to determine the consideration
result, they are classified within the 51 non-disclosing transferred for every single combination conducted. It is,
companies in Figure 2.1. however, possible to determine the consideration transferred
for total business combinations per company, for which the
The exact number of business combinations incurred during mean (median) is 484.4 (79.8) million euros. Of the 75
the year can give useful insights to the users of financial companies that disclose some information about business
statements about a company’s approach to future growth. combinations on an individual basis (see Figure 2.1), 74
Moreover, such information could assist financial statement disclose the related consideration paid. For these companies,
users to evaluate the importance a company places on the mean (median) cost is €557.1m (€51.5m).
acquisitions. Thus, as a first observation, the data presented
in Figures 2.1 and 2.2 and subsequent analysis indicate a These values could be taken as an indication of what the
significant variation in disclosure across companies, which also companies perceive to be individually material transactions
makes comparison of the information provided a difficult task. and they disclose other relevant information on an individual
basis.
Of the 119 companies that disclose some information about
business combinations on an aggregate basis, 112 disclose
the related costs. For these companies, the mean (median)
Figure 2.2: Distribution of the number of business cost is €427.52m (€86.46m). Of the 35 companies that disclose
combinations reported some information both on an individual and on an aggregate
basis about business combinations, 33 disclose the related
considerations. For these companies, the mean (median) cost
is €690.40m (€277.66m). It becomes apparent that 21 of the 240
100
companies that disclose the cost of business combinations
conducted during the year remain silent on other information
90 (eg value of goodwill recognised, method of payment,
86
acquisition-related costs and so on). These firms are classified
within the 51 companies in Figure 2.1 above that indicate having
80 made a business combination but disclose no relevant
information.
70
Overall, if the information on the consideration paid or
transferred, as required by the standard, is disclosed, it can
60 provide financial statements users with a good indication of
the significance of business combinations incurred during the
year. This would assist users to evaluate whether the
48
50
information on business combinations mandated by the
standard merits being provided or not.
40
Regarding the latter point, to determine the relative
significance of the aggregate level of business combinations
30 carried out by the 240 firms that disclose the consideration
transferred, Figure 2.3 shows the mean ratio of the firm’s
aggregate business combination purchase price to its previous
19
20
year’s market capitalisation, averaged out by industry.
16
12
10
8
6
4
4
3
3
3
0
1
3
4
5
6
7
8
9
10
11–20
20 +
2
6. Paragraph 67(d) of the old IFRS 3 explicitly required a firm to disclose ‘the
cost of the combination and a description of the components of that cost,
including any costs directly attributable to the combination’.
16You can also read