Sizing Up Corporate Restructuring in the COVID crisis
←
→
Page content transcription
If your browser does not render page correctly, please read the page content below
BPEA Conference Drafts, September 24, 2020

Sizing Up Corporate Restructuring in the COVID
crisis

Robin Greenwood, Harvard University
Ben Iverson, Brigham Young University
David Thesmar, Massachusetts Institute of Technology

    DO NOT DISTRIBUTE – ALL PAPERS ARE EMBARGOED UNTIL 9:00PM ET 9/23/2020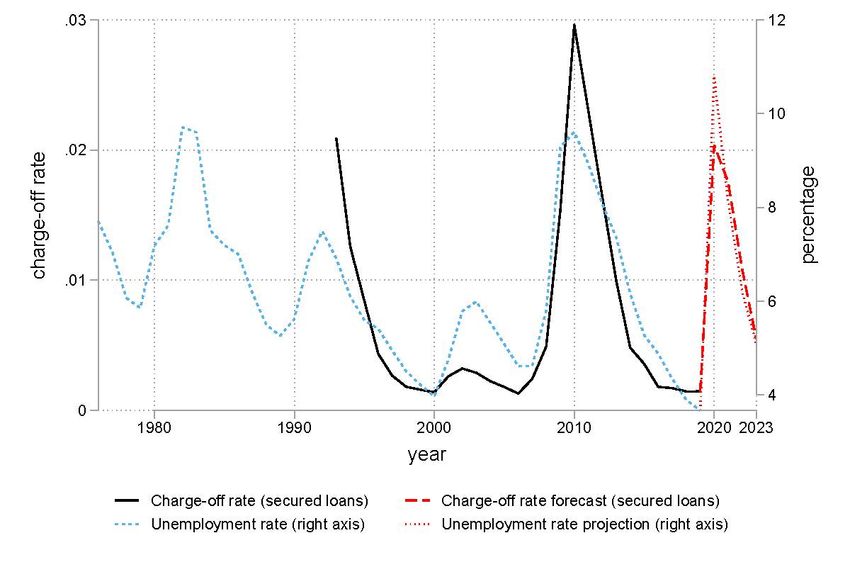
Conflictof
Conflict   ofInterest
               InterestDisclosure:
              Interest   Disclosure:The
                        Disclosure:   Theauthors
                                           authors did
                                                     did not
                                                         not receive
                                                             receive financial
                                                                      financial support
                                                                                 support from any firm or person
                                                                                                             person for
                                                                                                                     for this
                                                                                                                          this
 paperor
paper   orfrom
            fromanyanyfirm
                        firmoror person
                               person    with
                                       with    a financial
                                            a financial    or political
                                                        or political    interest
                                                                     interest     in this
                                                                              in this      paper.
                                                                                      paper. TheyThey  are currently
                                                                                                  are currently       not an
                                                                                                                not officers,
directors,  or boardormembers
 officer, director,               of any organization
                        board member                    with anwith
                                         of any organization    interest in this paper.
                                                                     an interest  in this paper.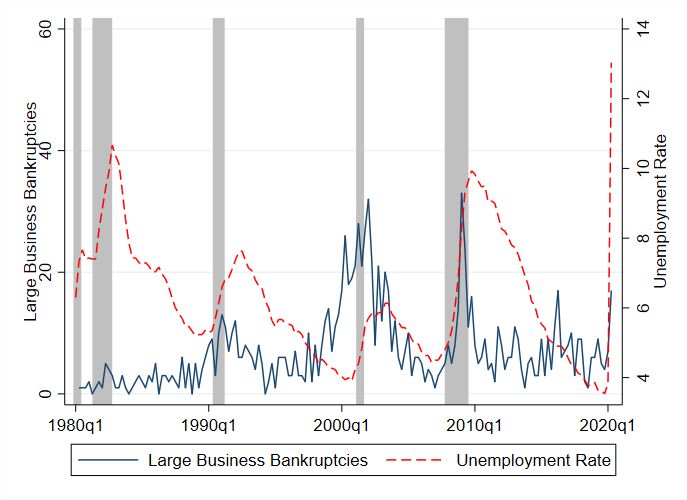
Sizing up corporate restructuring in the COVID crisis*

                              Robin Greenwood, Ben Iverson, David Thesmar

                                              September 2020

                                                  Abstract

        In the wake of the COVID-19 pandemic, the financial and legal system will need to deal with a
surge of financial distress in the business sector. Some firms will be able to survive, while others will face
bankruptcy and thus need to be liquidated or reorganized. Many surviving firms will need to be downsized
or acquired. In normal times, this triage is supported by the court system, banks, and financial markets. The
goal of this paper is to size up the coming surge of financial distress, list the challenges it presents in the
current environment, and offer potential policy solutions. Overall, our analysis suggests that the two key
issues will be court congestion and excess liquidation and failure of small firms.

*
 Greenwood is from Harvard and NBER; Iverson is from BYU; Thesmar is from MIT, NBER and CEPR. We thank
Usman Omer and Jiaheng Yu for great research assistance, and Sam Antill, Jan Eberly, Sam Hanson, Edie Hotchkiss
Adi Sunderam and Eric Zwick for helpful comments.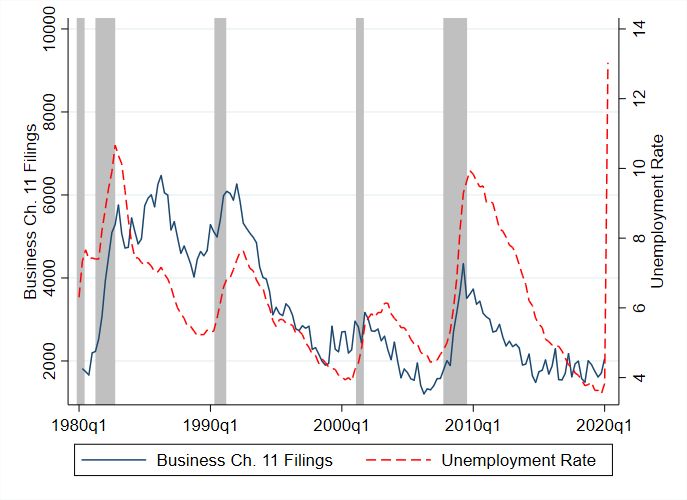
The 2019 Coronavirus pandemic is an economic shock of unprecedented magnitude. In the first two
quarters of 2020, US GDP contracted by 9.5%, with many forecasters anticipating at best a slow recovery

and persistent output gap for years to come.1 Even if the most acute effects of the shock turn out to be

temporary, the consequences for many businesses will be severe. Some will fail or have failed already,

others will have to undergo major changes in order to survive. Failure may mean acquisition by a rival,

voluntary exit, or liquidation. Even surviving firms may have to renegotiate legacy debt, raise fresh funds
or downsize.

      In normal times, the triage between dying and surviving firms is implemented by bankruptcy courts

and financial markets. This architecture is generally suited to the job, but gets stretched during recessions.
This time around, the size of the task appears daunting.
      The goal of this paper is to estimate how many firms will fail, evaluate how effective the triage will

be, and what, if anything, should be done to help it occur efficiently. Our analysis proceeds in three steps:
We first size up the coming surge of financial distress, then list the challenges it presents to the legal and
financial architecture in the current environment, and finally describe potential policy solutions.

      To set the stage, we estimate the upcoming increase in financial distress. We start by measuring the
impact on firm revenues and profits. Overall, the impact on firm profits and revenues so far is comparable

to the worst quarter of the 2008-2009 financial crisis. But analyst forecasts beyond 2021 suggest the
intermediate-term consequences will be milder. We then turn to forecasting the impact on corporate
leverage, which will rise as a function of the severity and length of the recession. Using a methodology

similar to Crouzet and Gourio (2020) but using data on smaller firms, we forecast the impact of reduced

revenues and profits on corporate balance sheets. Unsurprisingly, the effects will be particularly acute for
the smallest firms in the economy, because they have weaker initial balance sheets and, to a lesser extent,

larger fixed costs. Then, relying on analysis by Ma (2020) and Altman (2020), we forecast bond ratings

downgrades and defaults. The number of defaults can be expected to increase substantially in the coming

year. We close this section with a forecast of the upcoming surge of bankruptcies. This forecast is based on
the historical correlation between business bankruptcy filings and unemployment rates. Based on current

1
 While, as of Feb 14, 2020, economic forecasters polled by the Survey of Professional Forecasters anticipated
cumulative growth over 2020-2022 of 5.8%, as of Aug 14, they expect growth over 2020-2023 to be 3.8%. Thus,
even though they expect a clear rebound in 2021, professional forecasters anticipate an output gap (compared to
earlier forecasts) lasting well into 2023.

                                                        2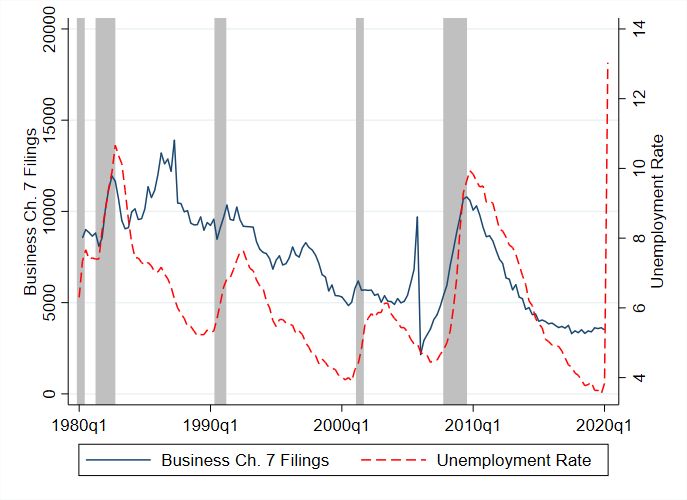
state of the economy, we expect overall bankruptcies to increase by as much as 140% in the current year.2
By all metrics then, corporate financial distress is set to increase.

      In Section II, we discuss the challenges posed by this surge to the legal and financial infrastructure

that deals with corporate distress. This infrastructure usually triages amongst financially distressed firms,

filtering those who will disappear (“liquidate”) from those who will reemerge (“restructure”). This time,

because of the unprecedented flow of distress documented in Section 1 and the uncertainty created by the
pandemic, this triage may be difficult to implement, leaving some firms wrongly liquidated, while other

firms artificially alive. We discuss these concerns and, as it turns out, some are real, others probably less

so.
      First, we investigate the oft-cited claim that the COVID-led recession will require a large amount of
cross-industry or cross-regional reallocation of capital, reducing the need for the bankruptcy system to

selectively cull the restructuring-worthy firms. To be sure, the short-run impact of COVID has had a
significant industry component: airlines and hospitality, among other industries, have been hard hit. But
reallocation depends on longer-term prospects of these industries. To test this, we calculate the dispersion

of equity analyst forecasts of firms’ future earnings at various horizons. Such expected dispersion is in
general a reliable indicator of ex-post realized dispersion. Since the crisis, it has, if anything, decreased.

This time around, analysts thus expect the post-COVID economy to look more similar to the pre-COVID
economy than is commonly argued. Second, we quantify the capacity constraints of courts. We predict that
the coming surge of bankruptcies could increase the judge caseload by 158% from 2019 levels, well beyond

the caseloads seen in 2009-2010.3 Third, we contrast the fates of small and large firms. Looking at the data,

we show that small firms restructure very rarely. This is especially worrisome as the balance sheets of small
firms are hit the hardest by the current recession. Fourth, we discuss the availability of financing for firms

undergoing restructuring. When in the process of redrafting their capital structures, firms typically need to

rely on debtor-in-possession financing (DeMarzo, Krishnamurthy and Rauh, 2020). Relying on analysis by

Wang (2020), we appraise the amount of such financing needed to handle the coming wave of restructuring.

2
  Despite the economic headwinds, the pace of business bankruptcy filings in 2020 has been modest, with a strong
uptick among the very largest US companies but little change among small businesses. Among the largest US public
companies, bankruptcy filings have been concentrated in industries and companies in distress well before the
pandemic (retail, energy).
3
  Appointing new judges to handle such a surge would require Congress to approve funding for this expansion in a
new bill, which has not occurred to date.

                                                       3
We find the required amount to be very small relative to the size of the corporate debt market. Fifth and
last, we study the banking system. To handle default, banks must be able to absorb large losses on their
corporate loan portfolios. Using Call Reports, we delve into banks’ balance sheets and find that U.S. banks
have, for the moment, sufficient capacity to absorb losses on commercial loans. Overall, our analysis
suggests that the two key issues will be court congestion and excess liquidation of small firms. Meanwhile,
lack of financing seems to be less problematic, consistent with Hanson, Stein, Sunderam and Zwick (this
issue).
Building on the growing list of proposals that have circulated in the wake of the crisis, Section III
discusses policy options that could make the triage of distressed firms more efficient. Our discussion
focuses on the key issues identified in Section II: alleviating court congestion, and targeting smaller firms.
A first form of solution consists of encouraging out-of-court restructuring for smaller firms. We discuss
moratoria and payment deferral schemes, which essentially freeze debt repayment for a limited amount of
time. Such moratoria have been implemented in many countries around the world, and could be
implemented in the US. Another approach has been suggested by Greenwood and Thesmar (2020), who
propose a tax credit for lenders and landlords who accept a haircut on existing loans to small businesses.
Their idea consists in drafting a simple master agreement with pre-specified values, to avoid endless
haggling over terms. Overall, restructuring subsidies and payment deferrals are options that are especially
suited for small businesses and should be targeted at them. But even in ordinary times, just under half a
million establishments per year close, suggesting that these programs must be carefully tailored to avoid
inefficiently subsidizing large numbers of firms.
A second set of policy options consists of changing the bankruptcy process itself. Iverson, Ellias, and
Roe (2020) focus on court staffing. They estimate that, by recalling between 50 and 250 judges, the U.S.
court system would ensure that caseload by bankruptcy judge stays at the level of the 2009 crisis. Other
policies are related to bankruptcy law. We discuss a recent provision enacted right before the pandemic,
Subchapter V of the bankruptcy code, which offers an off-the-shelf streamlined process for small businesses
to access restructuring. In recent months, Subchapter V filings have been increasing, but take-up is still
limited with only 506 total Subchapter V filings as of June 2020.4 We advocate for a real-time monitoring
4
https://www.epiqglobal.com/en-us/about/news/restructuring-bankruptcy/chapter-11-commercial-bankruptcies-up-
in-june
4of this provision in the coming months, to evaluate its effectiveness and increase its attractiveness to failing
small businesses. We also discuss recent proposals by Stiglitz (2020), who suggests a large scale,
administrative procedure to substitute debt for government-sponsored equity, and by Blanchard, Philippon
and Pisani (2020) who propose that the government accepts larger haircuts than other creditors, conditional
on the firm reemerging from bankruptcy.
Our paper complements a growing number of studies on the impact of the COVID-19 crisis on firms.
Brunnermeier and Krishnamurthy (2020) discuss the notion of excess leverage, and the effect of the Federal
Reserve policies on debt overhang. Hanson, Stein, Sunderam and Zwick (2020) and Saez and Zucman
(2020) emphasize direct government support to firms via grants. Compared to these papers, our focus is on
how to deal with firms once they are in extreme distress or have already failed. To be sure, if the crisis is
short and the landscape of economic activity looks similar post-pandemic, it may well make sense to keep
as many firms as possible alive, with the government subsidizing firms to avoid macroeconomic “scarring”.
But the longer is the crisis, the more the burden should be shared between the government and private
creditors and equity holders.
I. The Impact of the COVID-19 Shock on US businesses
As of September 2020, the ultimate length of the economic crisis is still highly uncertain. However,
it seems clear that the most acute effects of the crisis on US firms occurred in the second quarter of 2020,
when some industries – including airlines, restaurants, and hotels – came to a virtual standstill. This section
seeks to estimate the impact of the pandemic on creating distress and restructuring among U.S. businesses,
with an emphasis on the differential effects between large and small firms. We first estimate the impact of
the crisis on revenues and earnings. We then trace the impact through to leverage ratios on firm balance
sheets. Last, we turn to the impact of default rates and bankruptcy.
1.1 Revenues and Earnings for Small and Large Firms
A variety of data sources paint a detailed picture of the pandemic on US firms. Early in the pandemic,
the US Census administered weekly surveys to small and medium sized enterprises on the impact that
Covid-19 had had on their business. Panel A of Figure 1 plots data from the most recent of these surveys,
administered in late July 2020. We show the percentage of small firms, by NAICS sector, that report the
pandemic having a “large negative effect” on their business. The figure reveals the well-known pattern that
5entertainment, restaurants and hotels were the most severely affected sectors. In the next group, more than
40% of firms in the mining, oil and gas, transportation and health care sectors reported severe adverse
impact on their business. Overall, with the exceptions of utilities, construction, and finance and insurance,
all sectors have a significant share of firms that have experienced negative effects of the pandemic.
More detailed measures of firm impact can be constructed for public firms, which report quarterly
revenues. Panel B presents the percentage change in revenue between the second quarter of 2019 and the
second quarter of 2020, weighted by 2019 revenues, for the same two-digit NAICS sectors shown in Panel
A based on data from Compustat. To preserve comparability across firms and sectors reporting at the same
time, we limit the sample to firms with US headquarters and fiscal years that end in December, March, June
of September. As can be seen, the sectors most impacted for smaller firms are also hit among larger
companies: entertainment, restaurants & hotels. But there are differences, indicating that smaller, private
firms, are hit more severely than the typical Compustat firm.
Panel C shows the distribution of revenue changes for the full universe of public firms. For these
larger firms, the shock is big but so far, its magnitude is similar to the Great Recession of 2009. Revenues
for the median firm dropped by 9.3% between 2019 Q2 and 2020 Q2, while median growth between
2008Q1 and 2009 Q1 (the trough of the 2009 crisis) was -8.1%.
Compared to the Great Recession, the effect of the COVID crisis on sales is more left-skewed than
the financial crisis, but somewhat dampened by these firms’ more flexible cost structure. As can be seen
from Panel C, more than 10% of firms lost over half their revenues in 2020Q2, while only about 5% of
firms lost half their revenues at the trough of the 2009 crisis. Suspecting that this strong left tail could have
been magnified by (operating and financial) leverage effects, we zoom in on the share of firms reporting
negative earnings. Fixed costs structures turned out to have dampened, rather than magnified, the left tail
of the sales shock. In Panel D, we plot the percentage of public firms in Compustat with negative earnings
in any given quarter. Among the largest firms, 37% report negative earnings in 2020Q2, a number strikingly
similar to the first quarter of 2009 and the first quarter of 2001. Overall, within publicly listed firms, while
the shock on sales is more left-tailed compared to the financial crisis, the share of firms with negative
earnings is so far not larger. This suggests that the most severely hit firms had more flexible cost structures.
There are limits to the value of this comparison, however, because the length of the current crisis is still
6unknown, and would be substantially impacted if the United States went through a second lockdown period
similar to that of Q2 2020.
To help make the comparison between 2020 (which is ongoing) and 2009 (which is completed), we
turn to analyst forecasts, which allow us to go further into the future. We use the same data as Landier and
Thesmar (2020), which contain, for the largest 1,000 firms, analyst forecasts of earnings for years 2020,
2021, 2022 from data provider Refinitiv. For these larger firms, we show in Appendix Table B.1 that these
forecasts have been reliable (i.e., unbiased) at a one-year horizon, while slightly optimistic at longer
horizons.5 We also check, in non-reported analysis, that analysts are unbiased in terms of the fraction of
negative earnings predicted (i.e. the fraction of negative earnings firms they forecast is in line with ex post
realizations).
Table 1 summarizes the revision of earnings forecasts for different sectors since mid-February. For
each industry, we compute the unweighted average of the growth in earnings forecasts between February
2020 and May 2020. We exclude firms for which the beginning-of-period forecast of earnings is negative.
We compare these estimated growth rates to the beginning of the Great Recession. Specifically, for the
earlier period we compute the percentage revision between Jun 08 and March 09.
Table 1 shows that, from the point of view of large public firms, equity analysts do not believe that
either the short- or long-term effects will be even half of what they believed would happen at the beginning
of the Great Recession. Second, the short-term dispersion of revision is modest compared to 2009, both at
short and longer horizon. This is consistent with the idea that the COVID shock is expected to have a
relatively homogeneous impact across these large firms. In Section 2, we will use a version of this
dispersion to appraise the extent of future reallocation expected by analysts.
To sum up, based on looking at current and expected earnings and revenues, large public firms are
less impacted than is commonly supposed, both in terms of realized and expected earnings. For these large
5
It is well known that analyst forecasts at one year horizon used to be biased towards optimism in the 1990s on the
universe of IBES firms. But even on this sample, short-term optimism has essentially disappeared since the late
1990s (Kothari, 2002).
7firms, the effect of the recession can be expected to be relatively homogeneous. Meanwhile, for smaller
firms, the PULSE survey suggests that the shock seems to be stronger: We explore this further below.
1.2 Is the COVID crisis biased towards industries with predominantly smaller firms?
We lack timely and granular data on the financial position of small firms, but we can study indirect
measures of small firm exposure by asking whether industries and sectors that are disproportionately
populated by small firms (agricultural, construction, restaurants) are also those industries and sectors that
are most impacted by the COVID-19 shock. Panel A of Figure 2 provides a simple depiction of this, by
plotting the sector-level unemployment rate in July 2020 against the share of total employment in that sector
represented by small businesses. As can be seen, leisure and hospitality has suffered the largest increase in
unemployment, but overall this industry falls in the middle of the distribution in the mix of small and large
firms (restaurants are mainly small firms, but hotels include many large firms, for example). Overall, there
is no discernible correlation between sector-level unemployment and the small business employment share.
Panel B of Figure 2 shows a related analysis. The solid line shows the national unemployment rate.
The dashed line shows the unemployment rate based on the sum of sector-level unemployment rates in
every month, weighted by small business employment. As can be seen, these two series track each other
closely, including in the most recent period.6
1.3 Impact on Leverage Ratios
Crouzet and Gourio (2020), in a series of Federal Reserve blog posts, explore the financial position
of US public firms as they enter the pandemic and make forecasts of their leverage in the coming year.
Many nonfinancial publicly traded companies entered 2020 with elevated levels of leverage compared to
the historical average, but only slightly. However, they suggest that the fragility is tempered by their low
level of interest expense and high cash positions.
6
A further dimension of heterogeneity is geographic dispersion in firms. While all states have restaurants and
entertainment, some locations are concentrated in industries such as oil and gas, which suffered disproportionately in
the early phases of the crisis. In general, the geographic dispersion of unemployment, measured as the standard
deviation of unemployment rates across states, correlates strongly with the national unemployment rate over time.
This recent period is consistent with this overall pattern.
8Crouzet and Gourio (2020) forecast the future liquidity position of public firms using assumptions
about the impact of Covid-19 on operating cash flows, and holding fixed payouts and investment. Although
they forecast 30% of firms exhausting their cash buffers by the third quarter of 2020, the implications are
softened by the heightened availability of credit for public firms.
There is much less information available on the financial structure of smaller, non-listed,
businesses. However, for selected years the IRS publishes aggregate income statement and balance sheet
data by size class through the Sources of Income Statistics. Table 2 summarizes statistics from these data
for the most recent year available which is 2013. We measure shareholders equity as the sum of capital
stock, paid in capital, and retained earnings. Leverage is one minus the ratio of shareholder equity to assets.
As can be seen, smaller businesses have dramatically higher leverage ratios, relying heavily on bank debt
and loans from shareholders.7
In the spirit of Crouzet and Gourio (2020), we ask what would happen if businesses in each size class
experienced a 30% decline in revenues with no decline in fixed expenses, except for cost of goods sold
which scales with revenues. For simplicity, in this exercise we assume no investment, although the
conclusions are unchanged if one allows for it. Table 2 shows these results. For the smallest businesses
(less than $1m in revenue), a 30% drop in annual revenue with no offsetting change in fixed expenses is
enough to effectively wipe out the equity in the business. As can be seen, this comes from two forces. First,
smaller firms have higher leverage to start with. This is partly due to the fact that firm’s equity is partly on
the owner’s private balance sheet for smaller firms, but this pattern of decreasing is observed even for larger
firms. Second, smaller firms have a much bigger share of fixed expenses (financial and operating leverage)
and operate with at higher asset-to-sales ratios.8
1.4 Predicting Credit Downgrades and Defaults
Ma (2020) draws on 72 years of historical data from the Moody’s Default and Recovery Database,
to forecast default and downgrade rates for firms rated by Moody’s. Across ratings classes, she finds that
7
Some caution is warranted in interpreting financial statement for the very smallest firms in the economy, those with
total assets under $0.5 million. These firms have low book assets and typically no external shareholders, and limited
retained earnings because they are pass-through corporations. For the slightly larger smaller firms, these concerns are
somewhat alleviated. We focus on the next larger set of firms, those with assets between $0.5M and $1.0M.
8
Carletti et al (2020) implement a similar analysis on Italian firms. They estimate that the lockdown will lead about
17% of Italian firms to end up with negative book equity. These firms are disproportionately smaller firms. We cannot
conduct the same analysis since we do no have details about the distribution of small firms’ balance sheets.
9increases in the unemployment rate and declines in real GDP growth strongly predict higher probabilities
of a rating downgrade. Drawing on recent forecasts of the unemployment rate and real GDP growth for
2020-2022 from professional forecasters, she predicts significant increases in downgrades, ratings
withdrawals, and default.
Of the 4,476 issuers overseen by Moody's at the start of 2020, 1.4% have defaulted and 3.4% have
had their rating withdrawn by June of 2020. Ma forecasts that an additional 4.9% will default and an
additional 8.8% will have their ratings withdrawn by the end of 2020. According to her estimates, the US
economy is through only about a fifth of the predicted number of defaults for this year, not to mention the
additional defaults in the following years. While the corporate sector has fared unusually well thus far,
history indicates that many more defaults and downgrades are to be expected. Using different
methodologies, Altman (2020) also forecasts default rates in 2020, using data at the bond- and issuer level.
His conclusions are similar, forecasting an aggregate bond default rate of 5.75%.
1.5 Predicting the Rate of Bankruptcy
The most severe form of financial distress is firm failure or bankruptcy. Despite the economic
headwinds, the pace of business bankruptcy filings in 2020 has been modest, with large increases among
the largest US companies, but little change among small businesses (under 100 employees). Through
August 2020, overall business bankruptcies are actually 1% lower than the same timeframe in 2019.
However, larger firms have been entering bankruptcy at higher rates, with overall Chapter 11 bankruptcies
up 35% relative to 2019 and bankruptcies of firms with more than $50 million in assets rising by 194%
(Wang, Yang, Iverson and Kluender, 2020). But bankruptcy filings by the largest US public companies
have been concentrated in industries and companies that were experiencing distress well before the
pandemic or lockdown period. Among the largest 20 firms by assets filing for bankruptcy in the first two
quarters of 2020, five were in retail and apparel sectors, and seven were in oil and gas and mining.
There is a strong and intuitive historical relationship between unemployment rate – as a high-
frequency measure of economic conditions – and the frequency of business bankruptcy. Figure 3 shows the
close historical relationship between business bankruptcy filings nationally and the national unemployment
rate, based on official filing statistics from the Administrative Office of the U.S. Courts. Panel A plots the
relationship for business Chapter 7 (liquidation) filings, which are dominated by small businesses. Firms
10that file for Chapter 11 (reorganization), shown in Panel B, are generally larger than those that enter Chapter
7, but still contain many small firms as well. In Panel C we display filings only for public firms with greater
than $100M in assets at the time of filing, from a different database, the LoPucki-UCLA Bankruptcy
Research Database. As can be seen, all three series are strongly counter-cyclical, although the number of
large business bankruptcies is somewhat noisy. Further, Figure 3 puts the sharp rise in the unemployment
rate in the second quarter of 2020 into context – clearly, if historical trends are repeated, an unprecedented
number of bankruptcies is on the horizon.
Following the methodology of Iverson, Ellias, and Roe (2020), we forecast business bankruptcies
based on an expected unemployment rate from 2020Q3 – 2020Q4 of 9.2 percent from the Survey of
Professional Forecasters.9 Based on the historical relationship between bankruptcies and unemployment, a
9.2 percent unemployment rate predicts that the pace of business bankruptcy filings can be expected to
increase by 140%, relative to 2019. Importantly, this forecast uses unemployment rate forecasts while
ignoring the recent path of unemployment rates of 14.7 percent, 13.3 percent, 11.1 percent, and 10.2 in
April, May, June and July, respectively. Even though much of this spike reflects temporary shutdowns, it
is likely that the stresses of the initial lockdown period will lead to bankruptcy for some firms.10
There are several factors that may be dampening bankruptcy filings currently. First, there was a very
strong policy response in the form of the CARES act, PPP, Main Street Lending Facility, and the extension
of unemployment insurance. Second, many of the triggers that force restructuring and bankruptcy were
relaxed. In the lead-up to the pandemic, loan covenants for public firms were notably light, resulting in
fewer technical defaults and hence fewer renegotiations.11 And, when firms have defaulted, lenders and
landlords have been relatively lenient in allowing excess time to cure missed payments. Evidence suggests
that missed payments have been quite common. For example, the Census Small Business Pulse survey
shows that 11.5% of all small businesses had missed a loan payment by the first week of May, and 23.6%
had missed other payments such as rent. If lenders have willing to be lenient thus far, many firms that have
missed payments may avoid bankruptcy, at least in the short run. The temporary nature of the initial shock,
9
https://www.philadelphiafed.org/research-and-data/real-time-center/survey-of-professional-
forecasters/2020/survq320
10
Iverson, Ellias, and Roe (2020) explicitly adjust bankruptcy forecasts for temporary unemployment. Even with this
adjustment, their methodology results in forecasted bankruptcy increases of close to 100%. Further, forecasts of the
unemployment rate arguably already account for the temporary nature of the unemployment seen in the second quarter
of 2020.
11
https://www.bloomberg.com/opinion/articles/2020-02-18/the-cov-lite-fight-in-leveraged-loans-is-lost
11the policy response, and the lack of triggers that force restructuring have combined to reduce the number
of bankruptcies we might have otherwise expected so far. Importantly, if these factors are only temporary,
low bankruptcy numbers seen so far in 2020 only indicate the calm before the storm. On the other hand, if
these factors have served to actually prevent financial distress for many firms, our forecasted bankruptcies
could be far too high.
II. Triaging of Distressed Firms in the Recession
The previous section laid out what we know about the size of the COVID-19 shock, and some
forecasts of how this shock will affect large and small firms across the U.S. economy. In this section, we
first describe the triage-type process by which distressed firms shut down, liquidate, or get reorganized.
Within this framework, we lay out several frictions that could prevent efficient liquidation or restructuring
from occurring. We then turn to understanding how the triage process and the underlying frictions are
impacted by the pandemic. The overriding goal of this section is to identify the specific restructuring
frictions that COVID-19 could exacerbate as well as those which might not be as concerning.
2.1 Triaging Distressed Firms in a Wave of Corporate Distress
How does the bankruptcy process triage distressed firms? To fix ideas, consider a firm with
continuation value V, liquidation value L, and debt repayment D. The firm is financially distressed: V is
close to D. It has barely enough future cash-flows to pay back its debt. The flow chart in Figure 4 describes
the different outcomes of financial distress and the empirical probabilities associated with each branch of
the tree.
Continuation: If V>D and V>L, the firm has enough resources to pay back its debt. It can and seeks
to continue to operate. But because V is close to D, it may underinvest. This is the classic problem of debt
overhang: Debtholders absorb a disproportionate share of the value created by new projects, so that junior
investors – especially shareholders-- are reluctant to fund them (see Brunnermeier and Krishnamurthy,
2020, for a recent presentation). The solution in this case would be an informal, out of court, restructuring
to reduce D, though this rarely happens in practice.
Exit: If L>D but Vrestaurants. For small businesses, such voluntary exit also happens when D>L, i.e. liquidation proceeds do
not cover existing obligations. Technically, the firm should file for bankruptcy, but for small firms the fixed
cost of doing so often outweighs the potential benefits for claimants such as landlords or lessors.
Exiting out of court is incredibly common. Statistics from the Census Business Dynamics Statistics
database show that, in the past 20 years, 91.7% of firms that exit do so outside of bankruptcy.
Bankruptcy with straight-out liquidation: When VV. The firm defaults on payments, places
itself under the authority of a court of justice and is liquidated. In some instances, the entire firm is sold off.
In others, assets are sold separately (piecemeal liquidation). This is the most common path for bankrupt
firms, particularly for smaller businesses. Among firms going through a formal bankruptcy process, 84.4%
of the firms go through this process as opposed to the Chapter 11 filing that we describe below.12
Chapter 11 filing. When VV, it sends the firm to liquidation, either by converting the case to Chapter 7 or
dismissing it outright (leaving the firm to liquidate out of court). Alternatively, if the business is estimated
to be viable (V>L), it is reorganized. In a reorganization, equity holders and some junior creditor claims are
usually wiped out, with senior debtholders becoming owners of the new firm.
Conditional on chapter 11 filing, the majority of firms are liquidated. Among the 15.6% of
bankruptcy filings that happen under Chapter 11, 10.2% end up liquidated, and 5.6% re-emerge. As we
discuss below, the vast majority of the re-emerging firms are large.
2.2 Frictions to Efficient Triage in the Pandemic
The triage described above does not occur in a vacuum; it is organized by a financial and legal
architecture. It requires support from courts, including bankruptcy judges and trustees, and lawyers who
sometimes intervene ahead of the formal filing by drafting out-of-court restructuring proposals, which take
place under the shadow of the law, or prepackaged bankruptcy proposals to speed up the process after filing.
12
For ease of explanation, we assume that all firms for which VV choose liquidation in bankruptcy. In
practice, firms of this type could also liquidate outside of court as long as creditors agree to take a loss without need
for court intervention.
13On the financing side, different types of investors play important roles. First, firms may need funding
during the negotiation itself (“debtor in possession” financing), which is often provided by senior lenders.
Second, firms may need funding to emerge from bankruptcy. Such funding can be provided by current
claimants as well as external investors. Last, investors may assist firms out of court in various capacities:
providing risky funds (distressed investors), financing the takeover of the firm by an acquiror, accepting
out of court renegotiation of their claims (usually in exchange for a share of the upside of the company).
The triage implemented by the financial and legal infrastructure is likely to become less efficient in
times of acute crisis. In theory, to be efficient, the sorting described in Figure 4 should lead to continuation
whenever V>L, and exit whenever L>V. In the COVID crisis however, the accumulation of corporate
distress will impose stress on the legal and financial infrastructure, potentially reducing the quality of the
triage. We have in mind four mechanisms:
• There is uncertainty about whether the COVID crisis is temporary or structural. If it
is temporary, this corresponds to an increase in D (obligations that arose due to the temporary shock
to revenue). V does not change as cumulative future cash-flows are virtually unchanged. In this
case, continuation is best when the firm was viable before: V>L Alternatively, if COVID leads to
permanent reallocation across US regions or industries, this corresponds to a reduction of V (as the
firm’s prospects are diminished) and an increase in L (as the firms’ assets should be deployed
elsewhere).
• Congestion: Judges and lawyers are overwhelmed by the large wave of financial
distress. As a result, their estimates of V and L are noisier and wrong decisions happen more often.
Also, the duration of the process is longer, part of V is destroyed in the process, making it more
likely that L>V due to restructuring costs.
• The COVID crisis disproportionately impacts smaller firms, which are harder to
continue. For smaller firms, the estimate of V is noisier. Further, for small businesses a larger part
of the continuation value V is not pledgeable to outside investors (it corresponds to the know-how
of the entrepreneur, intangible capital like reputation, organization capital etc.).
Suppose that only value V’restructuring small firms may be quite large relative to their size, forcing V down and resulting in
L>V for these firms, even though V would be larger if restructuring were not needed.
• Critical outside funding may be lacking in a crisis. Firms typically need funding during
the process and after emergence. The funding need is greatest among firms with large working
capital balances, such as restaurants and retail, which are highly distressed due to the pandemic. As
above, this may create a wedge between the actual continuation value of the firm V and what outside
investors are able to fund. This can tilt the process towards excess liquidation
2.3 Costs of Financial Distress in the COVID Recession
Before discussing the extent to which these frictions are exacerbated by the COVID crisis, we
perform a back-of-the-envelope estimate of the aggregate costs of financial distress that could occur during
the COVID pandemic. Doing so is an important first step because it recognizes that even in regular times,
bankruptcy and other milder forms of financial distress can be costly. For example, Andrade and Kaplan
estimate that the costs of financial distress are between 10 and 23 percent of enterprise value. The frictions
above potentially increase these costs further.
Data from the Federal Judicial Center’s Integrated Database (IDB) gives the amount of liabilities
owed by bankrupt firms from 2008-2017. Over this ten-year period, the average firm in Chapter 7 had
$4.6M in liabilities at the time of filing while the average Chapter 11 firm owed $64.8M, and these
distributions have been very stable over time. The bankruptcy forecasting exercise we discussed earlier
suggested an estimated 15,638 Chapter 11 bankruptcies and 37,374 Chapter 7 bankruptcies over the next
year. Given the average size of firms that enter bankruptcy, this yields $1.01 trillion dollars of liabilities
will go into Chapter 11 and $171.9 billion will enter Chapter 7.
How much value could be lost from these bankruptcies? Financial distress costs are notoriously
hard to estimate. We base our estimates on the midpoint of Andrade and Kaplan’s (1998) estimates, but
also recognize that there are many distress costs which occur well before a firm enters bankruptcy (Elkamhi,
Ericsson, and Parsons, 2012) which are not included in our calculations. Assuming that 16.5% of firm value
is lost due to financial distress, we estimate that frictions to restructuring could result in a loss of $195.5
billion, equal to 0.9% of U.S. GDP.
15An alternative more fine-tuned calibration is obtained by predicting the number of bankruptcies for
different size ranges of firms using the IDB (the overall bankruptcy forecasts in Section 1.5 use quarterly
filing statistics for the longer 1980-2019 period, but official filing statistics are not divided by firm size).
The IDB contains firm size, thereby allowing us to forecast bankruptcy filings for various size buckets
using more recent data from 2008-2017. We estimate:
!"#$%&'()*+,!" = . + 01#+2'" + 3# + 4!"
where !"#$%&'()*+,!" is the number of bankruptcies in size bucket , in month (, 1#+2'" is the national
unemployment rate, and 3# are calendar month fixed effects to soak up seasonality. We run this regression
separately for each size bucket ,.13 Based on these estimates, we can forecast the number of bankruptcies
in each size range if the unemployment rate were 9.2%, as expected in the Survey of Professional
Forecasters. This exercise yields an expected 91,256 business bankruptcies over the next year (Table B.1),
a substantially higher number than we forecast when using the longer time series from 1980-2019. This is
because the relationship between unemployment and bankruptcies has strengthened over time, as can be
seen in Figure 3. From this projection, we estimate aggregate costs of financial distress of $282.0 billion
(1.4% of US GDP). Of these losses, roughly 20 percent are estimated to come from firms with less than
$100M in liabilities.
Importantly, the above exercises assume that all firms experience a 16.5 percent loss of value due to
financial distress, but this estimate is based on large, public companies. There is evidence that suggests that
smaller firms may experience substantially higher losses. Bris, Welch, and Zhu (2006) estimate that direct
fees alone could be as high as 30% of firm value for small businesses. In addition, smaller firms are much
more likely to be liquidated, and Bris, Welch, and Zhu (2006) estimate that liquidation in Chapter 7 destroys
significantly more value than Chapter 11, even after accounting for selection of firms into each chapter.
In addition to the firm value losses we just estimated, we can also estimate the costs of employee
separations and reduced wages. To do so, we start from Bernstein, Colonnelli, and Iverson (2019), who
show that the random assignment of a bankruptcy judge can exogenously move a firm from Chapter 11 to
Chapter 7, resulting in a 34% drop in the number of employees at the establishments owned by the bankrupt
firm. Their paper also shows that a surprisingly large fraction of firms – 58% – are sensitive to the
13
The results of this estimation are in Appendix Table B.1, and we find essentially identical results if we use year-
over-year differences instead of levels in the regression.
16assignment of the judge, meaning that a large fraction of firms could easily be shifted across bankruptcy
procedures. Given that bankrupt establishments in their samples have on average 36 employees, this
suggests that assigning the most lenient judge to the average bankrupt firm could save 58% x 34% x 36 =
7 jobs. Multiplying this figure with our bankruptcy forecasting exercises above and in Section 1.5, which
predict between 31,407 and 68,749 an additional business bankruptcies in the country, this would lead to
some excess destruction of 220,000 to 480,000 jobs, or about 0.15% of the U.S. workforce.14
2.4 Evaluating Frictions in the COVID Crisis
In this section, we evaluate the frictions listed above, and provide evidence on whether the pandemic
has made them more severe.
2.4.1 Is the COVID Crisis Temporary or Structural?
How much reallocation should we expect in the current crisis? If the crisis leaves the economy
essentially unchanged except for a temporary, albeit very large shock, business fundamentals are unchanged
and few firms should be liquidated. If however the crisis is going to deeply affect the productive structure
of the economy, liquidation should become the norm so that capital and labor can be reallocated.
It is obviously very hard to gauge the expected allocative effect of the current crisis. Jaimovitch and
Siu (forthcoming) document how recent business cycles have led to permanent shifts in capital-labor
substitution, indicating durable changes in the structure of the economy, but the current crisis is different
in nature. Barrero, Bloom and Davis (2020) use firm-level one-year ahead forecasts of employment to
derive a measure of expected reallocation and find it to be quite large. This, in addition to other evidence,
notably on stock returns dispersion and working from home, points to durable labor reallocation in the
economy, consistent with the view that the crisis will permanently destroy some jobs.
We complement these analyses with an additional analysis is based on equity analyst forecasts. We
analyze the dispersion of equity analysts’ earnings forecasts during the spring of 2020 using the same data
described in Section I. We compute the following reallocation index:
14
While many of these workers will be reallocated to new firms, there is extensive evidence that job losses lead to
permanent reduction in earnings. Looking at all mass layoffs in recessions, Davis and von Wachter (2011) find that
workers experience a 20 percent reduction in long-term wages. Focusing on bankruptcy-related layoffs, Graham et
al. (2019) find similar long-term wage reductions.
175",% = ∑& 7& 89:&,",% 8,
where 7& is a firm weight and 9:&,",% is the expected earnings growth for firm i, at date t, and at horizon
ℎ ∈ {2020,2021,2022}. We compute 7& as the earnings share of firm i in 2019 (we restrict ourselves to
firms with positive 2019 earnings). Following Landier and Thesmar (2020), we compute the forecasted
'
earnings growth of firm i, as of date t, and for horizon h: 9:&,",% = % CD9" EFG&,"(% /EFG&,)*'+ I − 1K.
The reallocation index 5",% is an intuitive measure: It captures the cross-sectional dispersion of
expected earnings growths, across firms. It can also receive a more structural interpretation. We show in
Appendix A that, assuming firms operate with a Cobb-Douglas technology combining capital and labor and
operate with a constant leverage, the measure 5",% corresponds to the total number of units of capital that
are expected to be reallocated across firms, between 2019 and year h, normalized by the aggregate capital
stock as of 2019. It essentially captures the share of capital (or labor) that will move across firms, provided
investment tracks future profits.
Barrero, Bloom and Davis (2020), study smaller firms and conclude that the COVID shock will lead
to substantial reallocation. Our approach differs from theirs in several ways. Its advantage is that it can
leverage analyst forecasts, which are reasonably accurate and available at long horizons (until 2022, and
even 2024 for a smaller set of firms). One drawback is that we focus on larger, publicly listed, firms.
Another limitation of our approach is that it does not rely on actual forecasts of decisions (Barrero et al look
at hiring plans), but on expected profits from these decisions. We are implicitly assuming a stable relation
between expected profits and expected investment.
In order to build credibility for our measure, we display it in Appendix Figure B.2. over the 1990-
2018 period, along with its realization (thereby replacing 9" EFG&,"(% by EFG&,"(% in the formula). This
Figure shows that expected reallocation is in line with ex-post realization. Hence, the lack of responsiveness
of expected reallocation cannot be attributed to forecasts “staleness”. The only exception is for forecasts
issued in April 2007, i.e. before the financial crisis, where analysts underestimated the amount of expected
reallocation that would eventually happen. But as soon as the crisis unfolded, their forecasts were in line
with ex post realizations.
In Figure 6, we show the evolution of our reallocation measure between February and May 2020, for
each one of the three horizons 2020, 2021 and 2022. While expected dispersion for 2020 went up
dramatically, this is not the case for longer horizon forecasts. Expected dispersion has not increased for
182021 and has actually decreased in 2022. Analyst forecasts have been revised downwards very strongly,
but all in the same direction, making firms more similar to one another. Another explanation for this
somewhat counter intuitive result is that, while some firms have benefited from the crisis (seeing their FG
going up and thereby contributing to increase the index), their weight in aggregate earnings is relatively
small. Most firms experienced a reduction in expected 2021 and 2022 earnings, which made firms more
similar to one another. Overall, the term structure of expectations distortions has become downward
sloping: The shock will make firms more different in the short-run, but less different in the longer-run,
reducing the need for capital reallocation. In short, industry reallocation is forecast to be lower than is
commonly supposed.
2.4.2 Crowding of the Bankruptcy Court System
Iverson (2018) estimates the effects of court congestion on several bankruptcy outcomes using the
2005 bankruptcy reform as a shock to court caseloads. First, looking at creditor recovery rates, Iverson
(2018) estimates that a 5.8% increase in caseloads results in a 10% increase in bank business loan charge-
offs. Extrapolating these estimates to a caseload shock of 30% (the typical increase seen in a recession), we
might expect recovery rates to drop by 47%.
As discussed above, we use a simple forecasting model based on the unemployment rate to forecast
business bankruptcies. The same bankruptcy judges who oversee business cases also deal with consumer
bankruptcy cases, and consumers constitute about 80% of the total workload for an average bankruptcy
judge. We can use the same process outlined in Section 1.5 to forecast consumer bankruptcies to estimate
how overall bankruptcy court caseloads might react to the COVID-19 recession.15 If unemployment is 9.2
percent over the next year, caseloads are forecasted to rise by 158%, close to five times the rise seen in a
typical recession. While one should have caution when extrapolating Iverson’s (2018) estimates outside the
natural experiment, there are potentially large court congestion effects on creditor recovery rates if
bankruptcies rise even half as much as our forecast.
The evidence in Iverson (2018) also suggests that as bankruptcy judges become busier, they focus
their effort on larger firms, possibly at the expense of smaller firms. As caseloads rise, larger firms are
15
A detailed explanation of this forecasting exercise and the calculation of court caseloads is in Iverson, Ellias, and
Roe (2020).
19actually more likely to emerge from bankruptcy, although the process takes longer. Meanwhile, smaller
firms are more likely be dismissed from court, leaving many of them to liquidate without court protection.
2.4.3 The Small Firm Problem
The COVID crisis has the potential to especially distress small firms. This is not because the
pandemic has especially affected industries dominated by small firms (Section 1.2), but instead because
small firms’ balance sheets are more vulnerable to losses in revenues (Section 1.3). We discuss here how
financial distress differentially affects small and large firms.
Figure 4 confirms that large firms in need of restructuring have multiple options available, while
small firms have no other option but to liquidate. Above $500m of liabilities, close to 80% of the bankruptcy
filings end up as a Chapter 11-backed reorganization. The contrast with small businesses is striking: Below
$1m of liabilities, 90% of the filings are straight-out liquidations, while less than 5% of bankruptcies end-
up as re-emergence from a Chapter 11 filing. For a small firm, failure means liquidation almost all of the
time.
There are reasons to believe that, for larger firms, the part of triaging system implemented by Chapter
11 is reasonably efficient in normal times. While academics have pointed out large frictions in the Chapter
11 process, in particular with regards to failures to fully rehabilitate distressed firms (Hotchkiss, 1995) and
long delays in bankruptcy courts (Dou, Taylor, Wang, and Wang, 2020), the majority of large firms that
enter Chapter 11 successfully emerge, and most estimates of inefficient continuation or liquidation are small
(Djankov, Hart, McLiesh, and Shliefer (2008); Dou, Taylor, Wang, and Wang (2020)). One exception to
these findings is Antill (2020), who estimates that 22% of large firms are inefficiently liquidated. We further
note that, even if the firm itself is efficiently continued, many contracts within the firm may be inefficiently
terminated. For example, Graham, Kim, Li, and Qiu (2019) show that, on average, employees who work
for large corporations that enter Chapter 11 experience a 10% decline in wages over the next seven years.
Importantly, this effect is most pronounced in thin labor markets, suggesting that inefficient reallocation of
workers plays an important role in these losses.
Frictions to restructuring small firms are substantially larger. Even small disruptions to cash flow can
trigger restructuring as many of these firms maintain low cash buffers and lack access to lines of credit
(Bartik et al 2020). Based on the June 27 Census Pulse Survey, including financial assistance and loans,
20only 30% of small businesses reported having enough cash to maintain operations for another three months.
Thus, even when L > N, it is possible that forced, inefficient restructuring can occur simply because smaller
firms run out of financing to continue to operate. Second, when restructuring does occur, smaller firms have
fewer options available. Chapter 11 bankruptcy imposes costs that can be as high as 30% of a small
business’s total value (Bris, Welch, and Zhu, 2006), making it close to prohibitive for many small
businesses even if they wish to continue. Consistent with this, small firms are more likely to simply shut
down: Data from the Census Bureau Business Dynamics Statistics (BDS) shows that, on average from 2000
– 2016, 412,209 firms close annually. Meanwhile, only 36,783 businesses file for bankruptcy annually
during the same time period, according to U.S. Courts filing statistics. In the end, while only 5.6% of all
firms going bankrupt survive the process, these firms are predominantly large firms, so in liabilities-
weighted terms, about 43% of the dollars of claims re-emerge.
High liquidation rates among small businesses are not inherently inefficient; it depends on how well
labor and capital can be redeployed to new uses. Most evidence shows that after liquidation, reallocation
of capital and labor to new uses is quite difficult. Graham, Li, Kim, and Qiu (2019) show that workers
experience large wage losses after liquidation, especially in thin markets. Capital reallocation appears even
harder than labor reallocation. Eisfeldt and Rampini (2006) show that capital reallocation is lower during
recessions, indicating stronger search and financing frictions precisely when liquidations tend to happen.
Bernstein, Colonnelli, and Iverson (2019) estimate the effects on capital utilization when a small business
is forced to Chapter 7: a business establishment that is forced to liquidate is 17 percentage points more
likely to be unoccupied five years after the bankruptcy, relative to an identical establishment that remained
in Chapter 11.16
2.4.4 Financing Restructuring
To deal with the upcoming large flow of bankruptcies, and in particular handle debt restructuring,
the financial system will be needed at several levels. Brunnermeier and Krishnamurthy (2020) fear that
banks will have a propensity to interrupt lending to firms in financial trouble, and propose policies designed
16
This is not because Chapter 11 firms are inefficiently continued. Roughly 75% of all business establishments that
stay in Chapter 11 are reallocated to other uses, so even in Chapter 11 there is a large amount of reallocation. But,
because the liquidation is not forced, it allows for reallocation that leads to higher utilization rates overall. Moreover,
these effects are driven entirely by forced liquidation in “thin” asset markets, defined as areas with few other
businesses in the same industry or areas with low amounts of small business financing available.
21avoid this. DeMarzo, Krishnamurthy and Rauh (2020) fear a lack of DIP financing for firms in the process
of restructuring (DIP) financing, and propose setting a government-sponsored SPV to fill that gap.
2.4.4.1 Corporate debt restructuring will have a small effect on banks’ balance sheets
We explore here how much banks’ balance sheets would be impacted by the upcoming wave of
defaults and also large-scale debt restructuring. Our main finding is that the effect of a large wave of defaults
or debt restructuring would be modest, since SME loans are only a small fraction of banks’ assets.
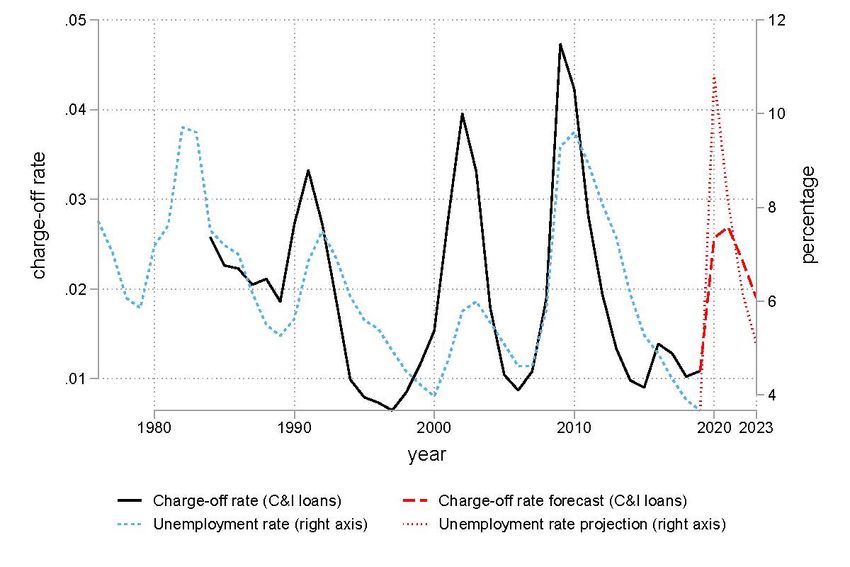
In the first step of this analysis, we predict corporate loans charge-offs using unemployment data. To
do this, we use Call Reports to compute aggregate charge-off rates (we use Charge-off rates on C&I loans
and secured loans to corporations, which we aggregate over all banks covered in the Call reports). As shown
in Figure 5, charge-off rates, which are typically around 1% in economic expansions and rose to 5% during
the financial crisis, are strongly correlated with unemployment rate fluctuations. We exploit this
relationship to build an econometric model linking the innovation of charge-off rates and unemployment
rate (in this we follow Blank, Hanson, Stein, and Sunderam 2020). We obtain an R-squared of 0.87 for
secured loans and 0.55 for C&I loans.
We then use forecasts of unemployment for 2020, 2021, 2022 and 2023 from the Survey of
Professional Forecasters, which, combined with our models allow us to make forecasts of charge-off rates
until 2023. We report these forecasts in Figure 5. We expect charge-off rates on C&I loans to be as high as
3% and secured loans to increase to 2%. These projections are less dramatic than during the financial crisis
because, as of this writing in August 2020, professional forecasters anticipate that, post COVID crisis,
unemployment will return faster to normal than in the aftermath of the financial crisis.
Do these projections have the power to shock banks’ balance sheets in a meaningful way? Current
data suggests they do not. In Table 3, we report the results of this analysis, separately for all banks, the 20
largest ones by assets and the rest. The first take away is that SME loans are already just a fraction of equity
(slightly less than 40% for all banks, and a much smaller fraction for the top 20, a priori systemically more
important, banks). As a result, a 2 percentage points increase in the fraction of charge-offs only has a very
small impact on aggregate equity (2% times 40%), an order of magnitude smaller than 2019 dividend
payouts which were 26% of book equity. The overall lesson of this quantification exercise is that SME loan
22You can also read