Measuring the Australian Night Time Economy 2019-20 - A project for the Council of Capital City Lord Mayors
←
→
Page content transcription
If your browser does not render page correctly, please read the page content below
Measuring the Australian Night Time Economy 2019-20
A project for the Council of Capital City Lord Mayors
                                                        Ingenium Research
Document Information

Enquiries about this document can be addressed to:
Andrew License / Anna Edwards / Terry Bevan
E: anna@ingeniumresearch.com.au
E: andrew@ingeniumresearch.com.au
                                                                                 Ingenium Research
27 August 2021

                                                       Ingenium Research Pty Ltd, Melbourne, Australia
                                                                ACN: 619676112, GST No: 90619676112

Document Information

 Project reference number         P21-03-02

 File name                        P21-03-02_CCCLM_NTE_2019-20_Economic

 Title                            Measuring the Australian Night Time Economy 2019-2020

 Version                          Final

 Last update                      27/08/21

 Name of authors                  Anna Edwards, Andrew License

 Name of reviewer                 Terry Bevan

 Document status                  Public

 Review status                    Complete

 Approval status                  Final

                                                                 Prepared by Ingenium Research - August 2021
Table of Contents and Glossary

1.      THE AUSTRALIAN NIGHT TIME ECONOMY .......................................................................................... 6
     1.1.         ABOUT THIS REPORT .................................................................................................................................... 6
     1.2.         INTRODUCTION ............................................................................................................................................ 6
     1.3.         THE IMPACT OF COVID-19 ON THE NTE ................................................................................................. 7
     1.4.         AUSTRALIAN NTE PERFORMANCE IN 2019/20 ....................................................................................... 12
2.      THE AUSTRALIAN NTE IN THE STATES AND TERRITORIES ............................................................. 15
     2.1.         OVERVIEW .................................................................................................................................................. 15
     2.2.         SUB-SECTORAL PERFORMANCE................................................................................................................. 18
3.      THE NTE IN AUSTRALIAN CITIES ........................................................................................................... 21
     ADELAIDE ..................................................................................................................................................................25
     BRISBANE ..................................................................................................................................................................28
     CANBERRA ................................................................................................................................................................ 31
     DARWIN ....................................................................................................................................................................34
     GOLD COAST ........................................................................................................................................................... 37
     HOBART ....................................................................................................................................................................40
     MAROONDAH ..........................................................................................................................................................43
     MELBOURNE .............................................................................................................................................................46
     NEWCASTLE ..............................................................................................................................................................49
     NORTHERN BEACHES ...............................................................................................................................................52
     PARRAMATTA ...........................................................................................................................................................55
     PERTH .......................................................................................................................................................................58
     PORT PHILLIP ............................................................................................................................................................ 61
     SYDNEY .....................................................................................................................................................................64
4.      APPENDIX .................................................................................................................................................. 68
     4.1.         DATA SOURCES ..........................................................................................................................................68
     4.2.         NTE DEFINITION ........................................................................................................................................69
     4.3.         CORE NTE LGA RANKINGS....................................................................................................................... 71
     4.4.         ADDITIONAL TABLES FOR STATES, TERRITORIES AND LGAS .................................................................... 73
     4.5.         REFERENCES ............................................................................................................................................... 78

Page |3                                                                                                                 Prepared by Ingenium Research - August 2021
Table of Contents and Glossary
Glossary of terms
 Term                       Definition
 ABS                        Australian Bureau of Statistics – the national provider of official government statistics.
 ANZSIC                     Australian and New Zealand Standard Industrial Classification – a method of assigning
                            establishments to a standardised set of activity
 Employment                 The number of employees associated with the establishment(s). Elements of charts and
                            infographics relating to employment throughout this report are coloured red.
 Establishment(s)           Actively trading business(es) recorded in the Australian Bureau of Statistics Business
                            Register (ABSBR) as at 30th June in each reporting year. Elements of charts and
                            infographics relating to establishments throughout this report are coloured blue.
 LGA                        Local Government Area – the municipal geographic area of a local council.
 NTE                        Night Time Economy – economic activity which occurs at establishments primarily
                            between the hours of 6 p.m. and 6 a.m. The NTE can be broken down into Core, Non-
                            Core and Supply as per the table below. The focus of this report is the Core NTE.
 SA2                        Statistical Area 2 – An ABS geographic area classification defined using the Census of
                            Population and Housing.
 Turnover ($m)              The sales and service income generated by the establishment(s), exclusive of goods
                            and service tax (GST). Elements of charts and infographics relating to turnover
                            throughout this report are coloured green.
 Sector                     Description
 Core NTE                   The activities that provide primary establishment services to leisure users between 6pm
                            and 6am. The Core NTE is split into sub-sectors of Drink, Entertainment and Food and
                            then further sub-divided.
 Non-Core NTE               Establishments that may operate across the 24-hour day and some of which provide
                            integral services to Core NTE leisure activities. These include public and private
                            transport, hotels and other forms of accommodation, retail services and public services
                            such as policing, health services, parking, and lighting.
 Supply NTE                 Supply NTE establishments tend to operate during the day but are part of the Core
                            NTE supply chain via the production or wholesaling of Food, Drink or Entertainment
                            products for resale in leisure outlets.
 Non-NTE                    This refers to all the other economic activities outside the NTE definition.
 Total Economy              This is the sum of all economic activity within a defined geography.

Methodology note. Detailed economic data in this report is sourced from the ABS Counts of Australian Businesses, including Entries and
Exits. This data has some limitations; in that it reflects the primary activity of the business and does not define the temporal nature of its
activity, however, the approach provides the best estimate available for NTE activity using ANZSICs that are most likely to be open
between 6pm and 6am based on prior research. For further methodological detail, see Appendix 4.1 (p68).

Page |4                                                                                       Prepared by Ingenium Research - August 2021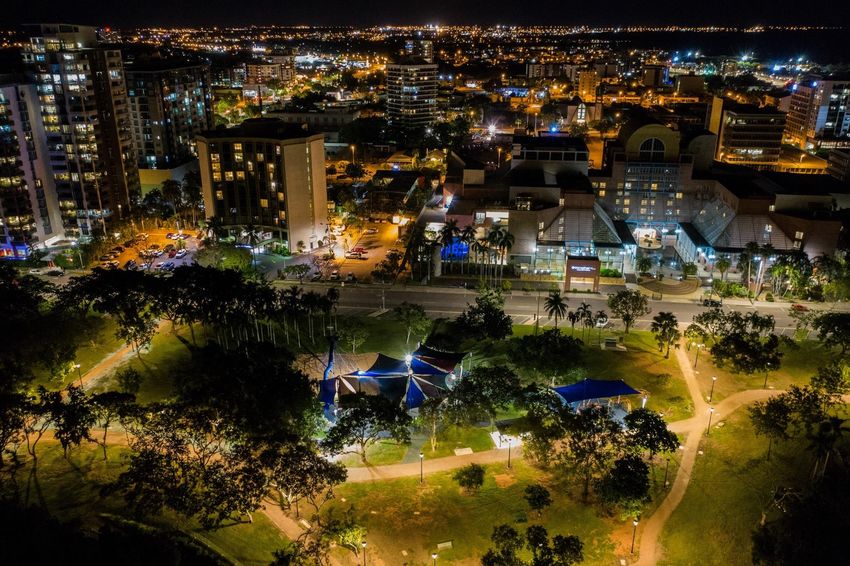
The Australian Night Time Economy

Page |5           Prepared by Ingenium Research - August 2021
The Australian Night Time Economy

1.     The Australian Night Time Economy
1.1.   About this report
       The Council of Capital City Lord Mayors have been commissioning annual analysis to measure the size of the
       Australian Night Time Economy (NTE), with data available since 2009. The NTE is defined as economic activity
       occurring between 6pm and 6am and is split into Core, Non-Core and Supply sectors. This report focuses on
       the Core NTE, which consists of Food, Drink and Entertainment (consumption) businesses and these
       businesses’ economic performance in the latest financial year for which official data is available (2019-20).

1.2.   Introduction
       The year 2020 was one unlike any other in modern times. The COVID-19 pandemic wreaked havoc on
       communities and economies across the globe, with all countries being affected by the virus. Despite a
       prolonged second wave in Victoria and further outbreaks since then, Australia has controlled the virus better
       than most countries, through closed borders and strong lockdown measures.

       The initial impacts of COVID-19 were devastating to many Australian businesses, although a high proportion
       were able to enrol in the Federal Government’s JobKeeper scheme to retain and support their employees.
       One of the sectors most affected was Accommodation and Food Services – a key subset of the NTE, with
       many cafés and restaurants required to shut their doors and offer takeaway services only. This impact is
       reflected in JobKeeper statistics, which show the sector had the highest proportion of businesses receiving
       JobKeeper payments in April 2020 (56% of all businesses)i. It is also evident in the Australian Bureau of
       Research (ABS) Business Indicators Business Impacts of COVID-19 Surveyii, which found that in June 2020, 84%
       of these businesses had experienced a decline in revenue compared to the same period in the previous year.
       Of those businesses that had reported a decline, 63% reported a decrease in revenue of more than 50%.

       Following the emergence from lockdowns, night-time businesses needed to adapt to changing conditions
       such as physical distancing restrictions, density limits, the lack of international tourism, new home working
       arrangements and the postponement or cancellation of events and festivals - all of which led to significant
       drops in people movement and visitation to city CBDsiii.

       Prior to the pandemic, CCCLM research established that the Australian NTE had achieved a record run of
       continuous growth, with many years performing better than the total economy. Conditions for NTE businesses
       have generally improved since the early days of the pandemic – although challenges and uncertainties remain.
       As such, it is crucial to understand what impact the early days may have had on the sector, so that policy
       makers can make evidence-based decisions on support for the NTE in their areas.

       This research focuses primarily on data from the 2019-20 financial year, depicting the early impact of the
       pandemic on Australia’s NTE. For many businesses, falls in employment and sales turnover were temporary,
       although the ongoing nature of the pandemic is continually altering the economic landscape. While this report
       does provide evidence of more recent impacts, the longer-term impact on businesses will not be known until
       the release and analysis of official 2020-21 financial year data.

       The report commences by framing the Australian impacts within a global context, followed by analysis of state
       / territory data, and a review of each member city of CCCLM’s Local Government Safe Cities Network (LGSCN).

       This report aims to support Australia in retaining and growing its safe and vibrant NTE in a changing world.

       Page |6                                                                   Prepared by Ingenium Research - August 2021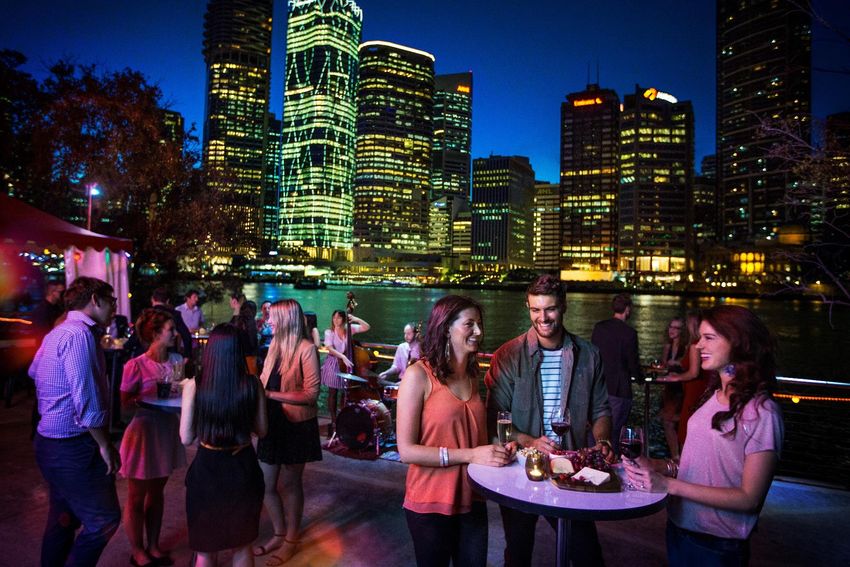
The Australian Night Time Economy

1.3.   The impact of COVID-19 on the NTE
1.3.1. The global reaction to the impact of COVID-19
       NTEs worldwide have been impacted by the lockdowns and physical distancing requirements of the pandemic.
       For example, a sample of data from c49 countries analysed by the International Labour Organization (ILO)
       showed that, employment in the Accommodation and Food Services sector fell by -20% between Q2 2019
       and Q2 2020iv, while the working hours fell by -33% during the same period. The same report shows that
       Other Services (which includes “arts, entertainment and recreation”, “other service activities” and “activities of
       households as employers”) experienced the second highest declines; -13% between Q2 2019 and Q2 2020
       and a fall in hours of -21% across the same period. Another ILO report estimated the pandemic led to job
       losses for 18 million Accommodation and Food workers worldwidev.

       Prior to the onset of the pandemic, many cities had been developing NTE specific governance structures with
       more than 60 cities having appointed night time leaders and/or committees vi. These structures act as a holistic
       point of liaison between NTE stakeholders and government to ensure alignment of ideas, to explore the
       impact of developments, and to facilitate connected strategic planning in specific local environments.

       It is reasonable to assume that none of these initiatives had any inkling of what COVID-19 might have in store
       for them – and it would not be unreasonable to state that, across the globe, leaders of countries and cities
       still seek to understand how they may successfully emerge from the pandemic. The unprecedented and acute
       impact of the pandemic on the sector has resulted in nightlife leaders coming together to share ideas and
       findings. Examples of some of these knowledge sharing forums are presented below.

                                        The Responsible Hospitality Institute (RHI) has been providing resources and
                                        consultation services on nightlife in the USA since 1983. In April 2021, it hosted
       RHI’s Sociable                   its annual Sociable City Summit as a virtual event vii. The event brought
                                        together more than 80 speakers and panellists from all sections of the NTE,
       City Summit                      including law enforcement agencies, nightlife associations, government,
                                        consultants and business to discuss approaches to addressing both the impact
                                        of immediate change and the longer term re-emergence of the sector.

       The Global Nighttime Recovery Planviii is the result of collaboration between
       more than 130 nightlife experts from across over 70 cities coordinated by
       nightlife advocacy agency VibeLab. The plan is a series of chapters guiding
                                                                                                  Global
       cities on various practices implemented to reactivate nightlife following the           Nighttime
       impact of the COVID-19 pandemic. Topics covered include utilising outdoor
       space, the future of dance floors, 24-hour cities, nightlife workers, governance     Recovery Plan
       and government policy support models.

                                          Global Cities After Dark (GCAD)ix is an Asia Pacific forum focused on the
                                          future of nightlife and the social economy, a partnership between VibeLab
       Global Cities                      and Electronic Music Conference Director Jane Slingo. In March 2021, the

       After Dark                         GCAD Conference took place as a hybrid event in Sydney. While Australia’s
                                          borders remained closed, keynote speakers from across the globe presented

       Conference                         virtually, while the audience was provided with an opportunity to discuss key
                                          night time issues and brainstorm potential solutions presented by the latest
                                          pandemic challenges.

       Page |7                                                                    Prepared by Ingenium Research - August 2021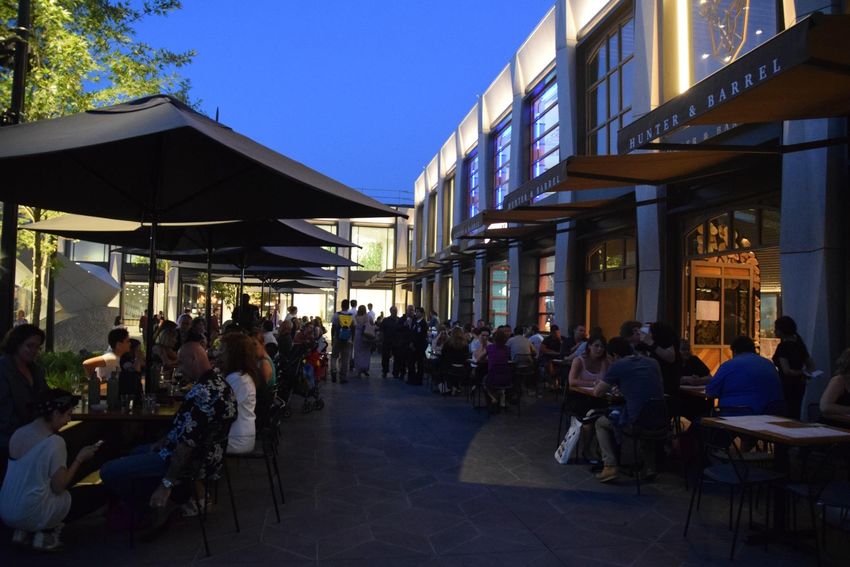
The Australian Night Time Economy

1.3.2. Australian impact

      Employment
      The impacts of COVID-19 and its associated restrictions on Australian businesses and communities during the
      early months of the pandemic were substantial. ABS’ Weekly Payroll Jobs and Wages dataset paints a stark
      picture of this impact, with employment across all industries falling nearly 9% in the space of a month from
      its pre-COVID peak (14th March 2020 to 11th April 2020). While this was unprecedented, the impacts on two
      key industries were particularly devastating – Accommodation and Food services and Arts and Recreation
      Services, with losses of -35% and -30% respectively, as can be seen in Figure 1, below.

      Figure 1: Indexed trend in employment from January 2020 to June 2021 (14th March 2020 = 100)

      Source: ABS Weekly Payroll Jobs and Wages from January 2020 to May 2021

      By June 2020 (the end point of economic data focus in this report) some recovery had been achieved, but
      employment remained c20% down from the March 2020 peak.

      From July 2020 to May 2021 these two sectors remained below their pre-COVID baseline. While Arts and
      Recreation Services have almost returned to normal, Accommodation and Food Services employment is still
      10% below the March 2020 peak. Research by the National Skills Commission x notes that positions such as
      waiters, bar tenders/baristas and kitchenhands saw the greatest rebounds after the largest declines.

      The recent Federal Budget Papersxi, noted that, part-time and casual workers were particularly affected during
      this period, resulting in women and young people being more likely to have lost work.

      The impact of Australia’s border closures may be a factor in slower uplifts in performance. Many states and
      territories are noting a critical shortage of hospitality workers, with positions often taken up by those on
      working holiday or international student visas proving difficult to fill. In June 2021, 38% of Accommodation
      and Food and 22% of Arts and Recreation businesses reported having difficulty finding suitable staff xii. With
      borders set to be closed until at least mid-2022, recent rule changesxiii allowing international students to work
      more than 40 hours per fortnight may help in alleviating this skill shortage.

      While federal schemes such as JobKeeper have acted as lifelines to businesses in these sectors, many councils
      and state / territory governments quickly mobilised to provide additional support to establishments, through
      their own grant schemes or programs to assist these businesses.

      Page |8                                                                    Prepared by Ingenium Research - August 2021
The Australian Night Time Economy

Without these interventions, it is likely the initial impacts would have been sustained for much longer, with
more permanent business closures and a more prolonged decline in the NTE. While this report focusses on
the latest economic data to the end of the 2020 financial year, some early signs of recovery have been
observed, which can be explored and further compared in detail once key official data is released for the
2020/21 financial year.

People movement
Google mobility reports use mobile device users’ anonymised location history data to track the number of
visits to specific locations (similar to footfall counts). The data is helpful in understanding changes in people’s
behaviours and comparing the relative impact of the pandemic across geographic areas. While employment
figures initially showed a sharp drop, followed by some recovery, a similar picture emerges when looking at
mobility. As can be seen in Figure 2 below, mobility data mirrors employment data, with visits to workplaces
and retail and recreation sites falling by 46% and 45% respectively, while time spent at residential locations
increased by 20% between 14 March and 11 April 2020.

Figure 2: Indexed trend in people movement from February 2020 to June 2021

                                        Melbourne           Labour Day             Australia Day
                                                                                                   Easter
                                       Mitchell Shire
                                        Lockdown

                                                                                 Christmas

Source: Google Mobility data for Australia from February 2020 to May 2021

Visits to retail and recreation sites improved slightly in the run up to the end of the financial year, which aligns
with the increases in employment in Figure 1. The trends in visits to retail and recreation locations and
workplaces are closely aligned. This alignment has been recognised by city councils whose CBDs have been
particularly hard hit by COVID-19 associated restrictions and work from home protocols. Councils have looked
to introduce innovative approaches such as vouchers to entice patrons back to the city. As demonstrated in
the later months in Figure 2, these initiatives do seem to be yielding some success, although Australia’s
suppression of the virus is likely a contributing factor.

Page |9                                                                            Prepared by Ingenium Research - August 2021
The Australian Night Time Economy

Key dates
The table below provides key events relating to COVID-19 and the NTE across 2020, to provide context to the
trends demonstrated in Figure 1 and Figure 2.

January 2020                 25th January       First case of COVID-19 recorded in Australia

March 2020                   1st March          First death from COVID-19 recorded in Australia

                                                $17.6bn Federal Government economic plan to support jobs,
                             12th March
                                                businesses and households announced (first stage)

                                                National restrictions on gatherings, overseas travel, aged care
                             18th March
                                                announced and ANZAC day ceremonies cancelled

                                                National restriction on non-residents entering Australia
                             20th March
                                                commences

                                                Federal Government announces $66.1bn economic support
                             22nd March
                                                package (second stage)

                             30th March         Federal JobKeeper scheme announced

May 2020                     8th May            National three step plan for easing restrictions announced

June 2020                    30th June          Lockdown commences in ten Melbourne postcodes

July 2020                    8th July           Melbourne and Mitchell Shire enter 6-week lockdown

August 2020                  28th August        JobKeeper extension 1 commences

                                                ABS announce Australian GDP fell 7% in the June quarter, with
September 2020               2nd September
                                                the country officially entering recession

                                                Melbourne moves from stage four restrictions to the first step
                             13th September
                                                of the roadmap to reopening

                                                Boundary between metro and regional Victoria removed and
November 2020                8th November
                                                25km distance limit no longer in place

                             19th November      South Australia enters six-day circuit breaker lockdown

                                                Australia out of recession, with 3.3% increase in GDP in the
December 2020                2nd December
                                                September quarter

                             19th December      Northern Beaches stay at home orders commence

P a g e | 10                                                           Prepared by Ingenium Research - August 2021
The Australian Night Time Economy P a g e | 11 Prepared by Ingenium Research - August 2021
The Australian Night Time Economy

1.4.   Australian NTE performance in 2019/20
1.4.1. Overview                                                                         Core NTE 19/20 &            % Total
                                                                     Measure
       Prior to 2019/20, the Australian NTE had achieved                               Change from 18/19           Economy
       a record run of sustained growth. The number of
       Core NTE establishments has continued to grow
       in 2019/20 (+2.5%) to over 113,700 establishments                                   113,726
       – a greater percentage increase than the total                                                               4.7%
       economy (+2%). This is likely a reflection of pre-                                    +2.5%
                                                                   Establishments
       pandemic activity, with business entry and exit
       rates comparable to previous years.

       Unfortunately, the impact of the COVID-19
                                                                                          894,910
       pandemic and the associated measures put in
       place to suppress the virus such as lockdowns,
                                                                                                                    8.7%
                                                                                             -20.4%
       physical distancing and density requirements, had            Employment
       a more immediate and devastating impact on the
       sector’s employees and revenue position. The
       impact on the Core NTE was disproportionately
       large when compared to the Non-Core NTE,                                          $127.6bn
       Supply NTE and the wider economy.                                                                            3.7%
                                                                                              -8.6%
       Core NTE employment fell by just over 20%                   Sales Turnover
       between June 2019 and June 2020, reducing from              Based on 2021 Australian Bureau of Statistics data (CABEE 2016-20)
       over 1.1m employees to just under 900k.

       There have been signs of recovery, but many establishments are still operating below their pre-COVID peak.

       Sales turnover was severely impacted, falling 9% (or $12bn) between June 2019 and June 2020 to $127.6bn.
       As noted recently by the ABSxiv, the measures put in place by federal and state/territory governments to
       support the Accommodation and Food Services have been effective but not quite enough to stave off a fall
       in Earnings Before Interest, Taxes, Depreciation, and Amortization brought about by the pandemic.

       Figure 3 shows that employment declined by -3.8% in the total economy (driven by losses in the NTE), while
       sales turnover increased slightly (+2.4%), and above inflation (+1.3%).

       Figure 3: Percentage change in establishments, employment and sales turnover 2018/19 to 2019/20

       P a g e | 12                                                                 Prepared by Ingenium Research - August 2021
The Australian Night Time Economy
1.4.2. Sub-sectoral performance
The growth in Australia’s NTE establishments in 2019/20 was Measure & % Core
Sub-sector
primarily driven by the Entertainment sub-sector, which Change 19-20 NTE
increased by +4.7% (+1,530 establishments, representing 30% Establishments
of Core NTE establishments).
8,629
While Entertainment establishment growth is likely reflective of 8%
pre-COVID activity, employment (-29%) and sales turnover (-
Drink +0.0%
9%) experienced substantial declines because of the
pandemic. Within Entertainment, employment in Sports and 34,382
Physical Recreation (-33% / -31,105 employees) and the 30%
Creative and Performing Arts (-32% / -15,295 employees) was Entertainment +4.7%
particularly impacted during the first three months of the
pandemic (March to June 2020), a consequence of lockdowns 70,715
and social distancing restrictions. 62%
Food +1.8%
While Entertainment was hard hit, recent employment trends
(explored in Section 1.3.2) noted substantial improvement in Employment
the months after June 2020, suggesting signs of recovery,
110,245
although considerable challenges remain.
12%
Food and Drink did not experience such sharp declines initially, Drink -17.2%
but equally, as noted in Section 1.3.2 (p8), have not seen as
strong a recovery. 200,450
22%
As the largest NTE sub-sector, Food’s 70,715 establishments Entertainment -28.9%
account for 62% of Core NTE establishments, 65% of
employment and 52% of sales turnover. While the 584,210
proportional loss in employment (-18%) was lower than in the 65%
Entertainment sub-sector, the absolute loss in jobs was much Food -17.6%
greater, with 125,000 fewer employees in June 2020 than in
Turnover
June 2019. Many cafés and restaurants pivoted to provide
takeaway services and outdoor dining, where possible, but $19.3bn
there are often substantial costs involved in pivoting business 15%
models and losses in income were incurred. Drink -2.8%
Finally, the number of establishments in the Drink sub-sector
$42.3bn
remained static (8,629 in June 2020). Drink’s employment
33%
decreased by a similar proportion to the Food sub-sector (- -9.3%
Entertainment
17%) driven mainly by losses in Pubs, Taverns and Bars (-19%
/ -22,000). Liquor Retailing experienced a small decline in
$66.0bn
employment (-5%) and growth in sales turnover (+9% / 52%
+$698m), as patrons switched to home consumption. This
Food -9.6%
helped the Drink sub-sector maintain sales turnover of $19.3bn
(a loss of -2.8% on 2019). Based on 2021 Australian Bureau of Statistics data
(CABEE 2016-2020 dataset)
P a g e | 13 Prepared by Ingenium Research - August 2021The Australian Night Time Economy P a g e | 14 Prepared by Ingenium Research - August 2021
The Australian NTE in the states and territories

2.     The Australian NTE in the states and territories
2.1.   Overview
       As might be expected, the impact of the pandemic on the NTE has varied by state and territory. The NTE
       establishment growth rate across Australia between June 2019 and June 2020 was 2.5%, driven by strong
       performance within Victoria, which gained +5.5% (1,754) establishments between June 2019 and June 2020
       (Table 1). This performance was matched only by Tasmania, where the number of establishments increased
       by +5.5% (+120). Nearly all other states and territories experienced establishment growth below the Australian
       average – with Western Australia (-0.1%) and Australian Capital Territory (-0.4%) recording contractions in
       their establishment bases.

       Victoria’s strong growth in establishments meant it continued to gain on New South Wales, which had 1.5%
       growth in establishments. While establishment growth was strong in Victoria, initial pandemic losses in Core
       NTE employment (-19%) and sales turnover (-7%) were substantial (although less than the Australian average).

       In terms of volume of decline, New South Wales has experienced the greatest loss in Core NTE employment
       (-92,760 / -27%) and turnover (-$4,389m / -10%), reducing to 249,960 employees and $38.4bn, respectively.

       Queensland’s establishment base marginally increased (+0.7%) but endured heavy losses in employment
       (-43,675 / -20%) and sales turnover (-$2,729m / -10%) driven primarily by substantial declines in the
       Entertainment sub-sector. In South Australia, performance was similar to the national average but with slightly
       less employment and turnover loss.

       Table 1: Core NTE by state/territory in 2019/20 with change from 2018/19 to 2019/20

       Source: Based on Australian Bureau of Statistics CABEE 2016-2020 dataset, Ref: WTS1/S5

       It is clear that the two territories experienced the pandemic very differently to one another. The Australian
       Capital Territory bucked the trend, as the only area to experience an increase in Core NTE employment
       (+4.0%) and a modest decrease in turnover (-3.2%). This was driven by the Food sub-sector, likely due to pre-
       pandemic economic growth combined with fewer COVID-19 cases and associated lockdowns, relative to some
       states and territories. Northern Territory on the other hand experienced above average establishment growth
       (+3.4%) but the largest percentage decreases in employment (-32%) and sales turnover (-16%).

       It should be noted that these performance figures relate to the first three months of the pandemic. Utilising
       the ABS Weekly Payroll Jobs and Wages dataset, it is possible to gain an indicative view of the recovery in
       each area, which is explored overleaf through the lens of the Accommodation and Food Services sector.

       P a g e | 15                                                                             Prepared by Ingenium Research - August 2021
The Australian NTE in the states and territories
Figure 4: Indexed trend in Accommodation and Food Services employment across states/territories (Jan 2020 to May 2021)
P a g e | 16 Prepared by Ingenium Research - August 2021The Australian NTE in the states and territories
Figure 4 shows employment trends from January 2020 to May 2021 for Accommodation and Food Services,
which include a large proportion of the Food and Drink NTE sub-sector definitions. These trends suggest the
following outlook for each state in 2021 (bearing in mind future outbreaks or other factors could alter this):
While the Core NTE has experienced heavy losses, recent trends in
New South Accommodation and Food Services suggest the state is likely to experience a
Wales
small recovery in Food and/or Drink, having maintained consistent
employment (of 90% of pre-COVID peak) since August 2020.
Victoria
Following a tough second wave between July and October 2020, Victoria has
seen strong growth since November, with employment in May 2021
approximately 10% higher than June 2020. However, Victoria’s recent lockdown
in June 2021 may set back this performance leading to minimal annual growth.
Similar to NSW, Queensland could experience a small recovery in Food and/or
Queensland Drink, having maintained consistent employment in Accommodation and
Food Services (at approx. 90% of pre-COVID peak) since August 2020.
The state has recovered well, reaching the pre-COVID peak in January 2021. The
snap lockdowns in January, April and June/July 2021 impacted employment but
Western
the NTE could see some growth on the June 2020 figures above.
Australia
Since losing almost 40% of employment in the first month of the pandemic,
South the state has recovered well, with May 2021 employment reaching
Australia
approximately 95% of the pre-COVID peak. This has dipped slightly in June
2021 but employment recovery should be expected.
The state experienced 10% decline in NTE employment from 2019-2020. Since
then, Accommodation and Food Services has grown faster than the national Tasmania
average, to 90% of the pre-COVID peak, indicating a strong NTE recovery.
The ACT was the only state to experience any growth in NTE employment over
Australian 2020. Figure 4 suggests the NTE may have grown more had it not been for
Capital
the pandemic. Since July 2020, some growth in Accommodation and Food
Services has occurred but in June 2021 employment is at a similar level to June
Territory 2020. This suggests that NTE employment figures for the 2020/21 financial year
are unlikely to show the strong growth rates experienced during 2019/20.
While the sector experienced the biggest proportional loss in NTE employment
(-32%), Figure 4 suggests June 2020 was a low point for Accommodation and Northern
Territory
Food Services. In June 2021, employment in this sector has surpassed its pre-
COVID peak. Growth in NTE employment should be expected.
While Figure 4 provides some encouraging signs in terms of employment, it should be noted that the
Accommodation and Food Services sector covers businesses that are not included within the Core NTE. A
complete picture of the 2021 impact on the NTE will not be available until 2022 once 2020/21 financial year
data is released by the ABS.
P a g e | 17 Prepared by Ingenium Research - August 2021The Australian NTE in the states and territories
2.2. Sub-sectoral performance
There appears to be a shift in balance across the Food (62%), Drink (8%) and Entertainment (30%) sub-sectors,
with an increase in the diversity of activities emerging – with less Drink and more Entertainment and Food.
Figure 5: Change in Core NTE establishments, by As noted in Section 1.4.2 (p13), the number of Drink
sub-sector 2018/19 to 2019/20 establishments did not change between 2018/19 and
2019/20. The trend across the majority of states and
territories is that Drink establishments are stagnating
or in decline – the key exceptions are the Northern
Territory (+10%), Victoria (+1.9%) and South Australia
(+1.3%).
These decreases are usually paired with increases in
Entertainment and/or Food establishments. The
number of Food establishments increased by 1.8%
between 2018/19 and 2019/20, driven primarily by
increases in Victoria (+5.5%) and Tasmania (+8.7%).
Entertainment has seen establishment growth of 3%
or higher (4.7% on average) across every state or
territory except Tasmania (0.2%) and the Australian
Capital Territory (-1.7%). This strong establishment
growth in Entertainment was driven by increases in
the Creative and Performing Arts (+4.4% in Australia)
and Sports and Physical Recreation (+6.2% in
Australia).
These shifts in establishment rates suggests the Core
NTE across the majority of states and territories is
evolving away from a stereotypical Drink led nightlife
to one that is more Entertainment or experience
based, suggesting a shift in social behaviours and
market demands.
These trends should continue to be monitored to
understand whether the rebalancing continues.
Full details of establishments, employment and
turnover for each state and territory are provided
overleaf (Table 2, Table 3 and Table 4), along with
change between 2018/19 and 2019/20 for each key
Based on 2019 Australian Bureau of Statistics data
metric.
(CABEE 2014-2018 dataset), Ref: WTS2/2018_Charts
P a g e | 18 Prepared by Ingenium Research - August 2021The Australian NTE in the states and territories Table 2: Drink by state/territory in 2019/20 with change from 2018/19 to 2019/20 Source: Based on Australian Bureau of Statistics CABEE 2013-2017 dataset, Ref: WTS1/S5 Table 3: Entertainment by state/territory in 2019/20 with change from 2018/19 to 2019/20 Source: Based on Australian Bureau of Statistics CABEE 2013-2017 dataset, Ref: WTS1/S5 Table 4: Food by state/territory in 2019/20 with change from 2018/19 to 2019/20 Source: Based on Australian Bureau of Statistics CABEE 2013-2017 dataset, Ref: WTS1/S5 P a g e | 19 Prepared by Ingenium Research - August 2021
The Australian NTE in the states and territories

P a g e | 20                       Prepared by Ingenium Research - August 2021
                                                                  Photo credit: VisitCanberra
The NTE in Australian cities
3. The NTE in Australian cities
While the pandemic’s impact to June 2020 varied by state and territory, the same is also true across the cities
of Australia. This section of the report explores these trends across each of the fourteen cities that are
members of the CCCLM’s Local Government Safe Cities Network (LGSCN).
For each LGSCN member city, this section provides a summary of the strategies and measures put in place
the council to mitigate the impact of the pandemic on the NTE. This detail is followed by a review of the
economic performance of each city’s Core NTE.
Comparative NTE performance
While this report focuses on fourteen cities, the wider Ingenium Research analysis covers 88 of Australia’s
most populous and economically active Local Government Areas (see Table 9 and Table 10, p71). This analysis
confirms that Sydney continues to have the highest density of Core NTE establishments in Australia, with over
191 establishment per km2 and the second largest volume of establishments (5,113 in 2020), with only Brisbane
hosting more in 2020 (6,629 establishments).
Table 5: Core NTE establishment comparative performance between the fourteen cities in this report
Sydney’s Core NTE establishment growth rate stalled over the last year, increasing +0.3%, while Melbourne
experienced a substantial increase (+8.6%), mirroring the pattern observed at the Victorian state level in
Section 2 (p15). This, in turn, has increased Melbourne’s density to 74 Core NTE establishments per km2, up
from 68 in 2018/19. Port Phillip in Victoria has also shown strong establishment growth over the last year
(+4.8%).
After Melbourne, the greatest growth rate in establishments was experienced by Hobart (+7.3%), followed
closely by Parramatta (+5.5%). Most of the remaining cities experienced establishment growth in line with the
Australian average (+2.5%). The exceptions were Perth (-2.4%), Northern Beaches (-1.3%), Canberra (-0.4%)
and the Gold Coast (-0.2%), which all experienced decline.
These trends are explored further in each city’s dedicated report section.
P a g e | 21 Prepared by Ingenium Research - August 2021The NTE in Australian cities People movement Google Mobility data allows an understanding of pattern changes in visitation to retail and recreation locations. This is a particularly useful indicator in understanding likely future trends in NTE performance by acting as a proxy for consumer confidence in interacting socially. Naturally, a reduction in visitation will have follow on effects to the businesses within these areas. As such, these visitation trends are explored overleaf from February 2020 to June 2021 for each of the fourteen LGSCN cities. Figure 6 demonstrates the impacts of lockdowns on retail and recreation visitation across each of the cities, while also highlighting the lingering impacts of prolonged lockdowns, particularly within Victoria. For example, Maroondah saw an extended period of reduced visitation from July to November 2020 but had rebounded by May 2021. This was not the case for Port Phillip or Melbourne, where visitation was still 30% lower than the pre-COVID baseline in May 2021. The most recent Victorian lockdown in June has worsened visitation, meaning that NTEs in these areas have likely faced prolonged challenges during the 2020/21 financial year. Port Phillip and Melbourne are not the only cities with retail and recreation visits substantially below the pre- pandemic baseline – this is also the case for City of Sydney, where visits were still 35% down by 7 June 2021. This is quite different to Sydney’s neighbouring LGAs, where trends were more in line with Australia as a whole. Unfortunately, with the exception of Newcastle (which may also be affected), these NSW LGAs are likely to be further impacted as a result of the June/July 2021 lockdowns. This highlights that, even without restrictions, there is still uncertainty looming over businesses in NSW capital and Victorian cities, with consumer confidence not fully returned. This uncertainty will also be impacting investment and expansion decisions by NTE businesses within these cities. Other cities across Australia have experienced trends in visitation that are broadly like that of Australia as a whole but they are still below the pre-pandemic baseline. The one exception is Darwin where, following the initial impacts of the pandemic, visitation levels have been higher than the pre-COVID baseline, highlighting its strong performance in suppression of the virus. It is likely, however, that the recent snap lockdowns in late June 2021 will affect this performance. P a g e | 22 Prepared by Ingenium Research - August 2021
The NTE in Australian cities
Figure 6: Indexed trend in people movement to retail and recreation locations for each city (February 2020 to June 2021)

        P a g e | 23                                                             Prepared by Ingenium Research - August 2021
The NTE in Australian cities P a g e | 24 Prepared by Ingenium Research - August 2021
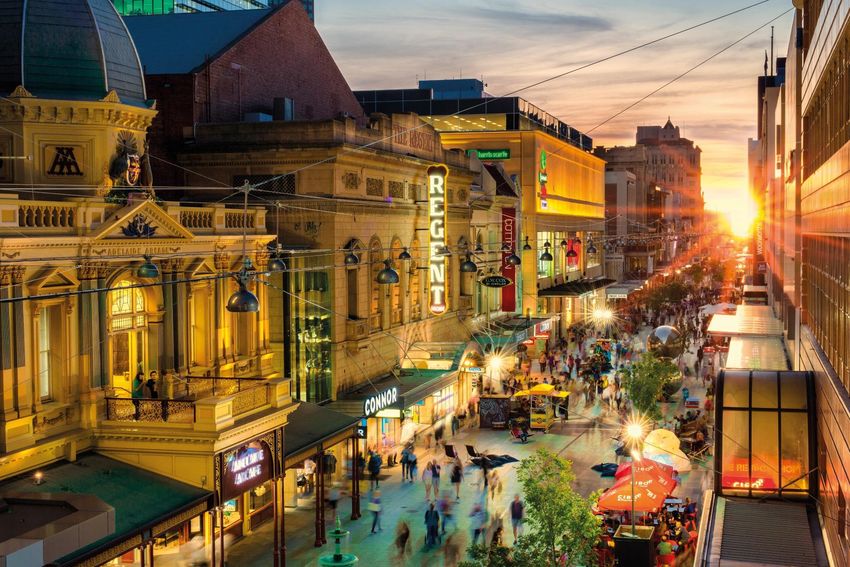
Adelaide
________________

Australia’s most liveable city
A focus on key metrics, trends, and uniqueness
Adelaide

Area profile
South Australia’s capital city was ranked the third
most liveable city in the world by the Economist
Intelligence Unit in 2021, and first most liveable in
Australia.
Surrounded by world-famous wine regions,
Adelaide is Australia’s only city to be awarded Great
Wine Capital of the world status.
Renowned for its creative culture, Adelaide is a
member of the UNESCO Creative Cities network,
has been designated as the first and only City of
Music in Australia and has been described as
Australia’s festival city.

The Council’s pandemic response
As restrictions eased, the City of Adelaide launched campaigns to encourage people to reconnect with their beautiful city and
provided direct benefit to businesses through promotion of their offers.

The City of Adelaide has been supporting city businesses by providing over $11 million in assistance through the creation of
grants, activities, activations, financial relief, advice, and assistance programs. All of this despite the City of Adelaide being
among those city businesses most significantly impacted by this global pandemic, experiencing a loss in income of
approximately $20 million for the 2019-2020 financial year alone.

Examples of support provided include an Outdoor Activation Grant ($1.15m) and the Christmas Incentive Scheme ($223k) which
were both oversubscribed with applications. These grants have also benefited the broader City economy, by supporting local
tradespeople, manufacturers, artists, performers, and more as the works or activations were carried out. Other initiatives include:

    •    $100,000 for an extension of the Summer Street Beats and Eats series.
    •    Implementation of an Event Infrastructure Funding scheme of up to $50,000.
    •    $1m to assist existing CBD-based events to expand into city-wide events split over 2021/22 and 2022/23.
    •    An addition of $1m to the Events and Sponsorship Program for new major events in the City in 2021/22 and 2022/23.
    •    $250,000 to complement and leverage the January 2021 round of the South Australian Tourism Commission’s Great
         State Vouchers, incorporating paid experiences and hospitality offerings.
    •    $250,000 to design and implement a digital Marketplace for Adelaide businesses within the first quarter of 2021.

Despite the challenges the city has faced during the pandemic, Adelaide remains a city that puts the safety and wellbeing of its
community first. The Council has supported its community and residents by providing rates hardship options, introducing
contactless parking payment, and supplying groceries to our elderly community members.

Adelaide has always been a progressive, resilient, and creative city, enriched by the diversity of its people. The Council states
that “together, we will continue to overcome challenges and ensure Adelaide remains a city ‘Designed for Life’”.

         P a g e | 26                                                               Prepared by Ingenium Research - August 2021
Adelaide
NTE Performance
Adelaide has the third highest density of both Food (up from
Key Metrics
fourth place in 2019) and Drink establishments in Australia. This
is driven by a large number of Cafes and Restaurants (432) # Core NTE 2020 % Total
Measure
% Change 19-20 Economy
Takeaway Food Services (176) and Pubs, Bars and Taverns
(120).
861
Historically, Food and Drink establishments have formed a high
proportion of Adelaide’s Core NTE. This is still the case, with
5.6%
Establishments +2.3%
71% of Adelaide’s Core NTE businesses belonging to the Food
sub-sector (compared 62% nationally) and 15% belonging to
the Drink sub-sector (compared 8% nationally). This naturally 9,115
means that the city’s Entertainment sector forms a smaller part 10.7%
of its Core NTE (14% compared to 30% nationally) – with half Employment -20.1%
of these establishments are Creative and Performing Arts.
$1,137m
The city experienced a small increase (+2.3%) in Core NTE 4.1%
establishments between 2019 and 2020. This included 14
Sales Turnover -11.2%
additional Takeaway Food Service and 9 extra Creative and
Performing Arts businesses.
# Establishments
As with most other geographic areas, the pandemic caused Sub-sector % Core NTE
% Change 19-20
great financial strain on the LGA’s NTE, with a loss of -11% in
sales turnover and a reduction of -20% in employment as of
June 2020. The Food sub-sector experienced the greatest 133
declines in both turnover (-14%) and employment (-23%). 15.4%
Drink +1.5%
Unlike some other cities in Australia, Adelaide’s Entertainment
sub-sector was less impacted, with a reduction of -7% and -8%
respectively in sales turnover and employment (compared to - 120
9%/-29% respectively across Australia as a whole). This is
13.9%
Entertainment +7.1%
similar for South Australia, suggesting that the state’s
pandemic policies enabled these businesses to continue
608
trading more than in some other states.
70.6%
Food +1.5%
# 2020
Measure Density
% Change 19-20
26,180 1,681
Population
+2.5% per km2
P a g e | 27 Prepared by Ingenium Research - August 2021Brisbane ________________ Australia’s largest NTE A focus on key metrics, trends, and uniqueness
Brisbane

Area profile
Brisbane is the capital of Queensland, and
Australia’s third most populous city.
In April 2020, Lord Mayor Adrian Schinner
announced a new Community, Arts and Night-time
Economy committee chaired by Cr Vicki Howard.
The committee will work with the business
community to develop the night time economy in
key precincts such as Fortitude Valley and the CBD.
The Brisbane Vision 2031 Strategy includes the
theme of a “vibrant, creative city” and commits to a
target of “a variety of music and night time
entertainment precincts” in the City

The Council’s pandemic response
Brisbane City Council is working with local businesses and industry stakeholders to identify ways it can support its NTE to adapt
and become stronger, safer, and more diverse than ever before. The Council is taking action to help rebuild Brisbane’s economy
by delivering initiatives under its Economic Recovery Taskforce, which was established to boost the city’s economy in the wake
of coronavirus. Brisbane’s Economic Development Plan and Creative Brisbane Creative Economy Strategy set out aspirations for
Brisbane to be regarded as a ‘top-ten’ lifestyle city. As part of this vision, the Council will continue working with the business
community to enhance the NTE in key precincts of the city such as Fortitude Valley and the Brisbane Central Business District.

Brisbane City Council is backing local businesses by easing the financial burden, supporting local jobs and investing in the city’s
future. This includes direct support for businesses; and a range of initiatives such as making it easier for residents to continue
contributing to the NTE, provision of facilities, improvement in safety and investment in events and festivals. Examples include:

  •    Providing an initial $7.9m business relief package, $4.5m in waived rent and reimbursements for Council lessees and
       tenants and $3m in direct assistance for community groups on Council land.
  •    Providing a six-month rates freeze for all ratepayers plus rates rebates for eligible organisations and individuals.
  •    Supporting events and festivals by honouring payments to cancelled event organisers, reallocating funding from festivals
       to creative sector support programs, and providing facilities such as City Hall, Riverstage, Brisbane Powerhouse and
       Parklands. Council supported several events including the Brisbane Festival, BrisAsia Festival, Indigenous Art Program,
       markets, movies in the park, QUBE effect, Lord Mayor’s Seniors Christmas Parties and Christmas Carols. Council also
       worked with the music industry to deliver events, such as Valley Fiesta and Winter Sounds.
  •    Promotional campaigns such as Fun Things to do After Dark and Brisbane Greeter Twilight Tours attracted people back
       to the city, while temporarily turning-off parking meters reduced the cost of visits to the city.
  •    Conducting business forums, professional development, case studies, training programs and videos.
  •    Streamlining processes, including reducing assessment times for licenses and permits.
  •    Exploring opportunities to activate the city through the Brisbane City Centre Master Plan 2014 refresh.
  •    Safety initiatives including Public Space Liaison Officers, Audits, Citysafe Camera Network and creative lighting.

         P a g e | 29                                                               Prepared by Ingenium Research - August 2021
Brisbane
NTE Performance
Brisbane is Australia’s largest NTE, with the highest number of
Key Metrics
Core NTE establishments. The scale of the city geography plays
its part in delivering NTE statistics which on the one hand tend # Core NTE 2020 % Total
Measure
% Change 19-20 Economy
to be very high in absolute numbers and yet low in relative
density. Its substantial geography stretches over 1,343km2.
However, within its central postcodes (4000 CBD, 4006 6,629
Fortitude Valley and 4101 West End) the NTE is particularly 4.9%
dense, with figures not dissimilar to Sydney, Perth, or Adelaide. Establishments +1.6%
The Core NTE makes an important contribution to Brisbane’s
labour market, representing almost one in ten jobs in June 60,015
2020 (9%) while the equivalent figure nationally is 7%. 9.0%
Brisbane’s NTE employment declined by almost 15% to June Employment -14.5%
2020, which was less than experienced at the state level (-19%)
suggesting the initiatives employed by the Council have been $7,736m
somewhat effective in mitigating the pandemic’s impact. 3.6%
Sales Turnover -9.1%
# Establishments
Sub-sector % Core NTE
% Change 19-20
296
4.5%
Drink -2.3%
1,938
Brisbane’s Core NTE is distributed across the Food, Drink and 29.2%
Entertainment sub-sectors in a similar manner to that of Entertainment +5.0%
Australia as a whole, but with a slightly higher than average
Food sub-sector (66% as opposed to 62%) and a smaller Drink 4,395
sub-sector (5% compared to 8%). 66.3%
Food +0.4%
After many years of strong growth in its NTE, the Brisbane LGA
experienced a small increase in the number of Core NTE
establishments between 2019 and 2020 (+1.6% / +109). This # 2020
increase was primarily driven by the Entertainment sub-sector, Measure Density
% Change 19-20
which gained an additional 93 businesses (+5%), with Food
seeing a modest increase in establishments (+0.4%) and Drink 1,273,000 948
experiencing decline (-2%). Most of the new Entertainment
businesses were in the Creative and Performing Arts (+37) and Population
+1.5% per km2
Sports and Physical Recreation Activities (+37) industries.
P a g e | 30 Prepared by Ingenium Research - August 2021Canberra
________________
The national capital and a growing foodie haven
A focus on key metrics, trends, and uniqueness
Photo credit: VisitCanberraCanberra
Area profile
A city within a nature park that forms the Australian
Capital Territory, the nation’s capital, Canberra, is known
for its cultural attractions and thriving food and wine
scene. The inner-city corridor of suburbs stretching
from Acton and across Civic, Braddon and to Dickson
and inner south suburbs such as Kingston house the
majority of cafes, restaurants, bars and entertainment
venues including theatres and cinemas. Over recent
years a proliferation of new residential development
along the city corridor and inner south has increased
inner city living options with a flow on effect for both
hospitality and tourism venues in these areas.
The City’s pandemic response
A range of ACT Government advice, supports, rebates and programs are available to Canberra’s businesses and community
to help with the recovery from the impacts of COVID-19. As of June 2021, this includes but is not limited to the following:
The ACT Event Fund fosters positive economic, community and social outcomes by supporting events that can safely connect
the Canberra community and visitors, while the $700,000 Amp It Up! Fund assists eligible small to medium live music venues
by offsetting costs associated with programming and promotion, providing opportunities for musicians/performance artists.
The Canberra Business Advice and Support Service, delivered by the Canberra Business Enterprise Centre provides up to four
hours of free tailored advice, along with development workshops and webinars, to businesses impacted by the pandemic.
The Tourism Cooperative Marketing Fund provides grants to ACT tourism operators and attractions for collaborative marketing
projects, while the COVID-Safe Tourism Co-Investment Program supports recovery from the combined effects of bushfires and
COVID-19 through grant funding for development of COVID-safe tourism products and infrastructure project.
In addition to the over $10 million provided to the sector in annual arts funding, the ACT Government has committed more
than $8 million in economic stimulus to support Canberra’s creatives through the COVID-19 pandemic. This includes a series
of grants and funding opportunities to assist the ACT’s creative arts industry during these difficult times.
A range of licensing/registration fees have been waived, including:
• the food business registration fee (until 31 March 2022)
• the outdoor dining permit fee waiver (until 30 June 2022)
• on and off liquor licensees annual licence fee (until 31 March 2021). The annual licence fee for some liquor licensees
has been tapered to provide a 50% fee reduction (until 31 March 2022).
• Liquor licence holders could also choose to move to a general liquor licence, free of charge until 30 June 2021.
A rates rebate of $2,622 will be available for commercial properties with an average unimproved value of $2m or less, while a
range of payroll tax waivers, exemptions and deferrals are available to eligible businesses to assist businesses that are unable
to operate, or can only operate on a limited basis, due to ACT Government health-related restrictions. Additionally, eligible
cafes, restaurants and takeaway businesses could receive a $1,000 rebate on electricity, while eligible hotels/accommodation
providers and large function/events venues could also apply to receive a rebate on their fixed water and sewerage charges.
P a g e | 32 Prepared by Ingenium Research - August 2021Canberra
NTE Performance
The Core NTE plays an important role in the ACT’s total
Key Metrics
economy – comprising a higher-than-average proportion of
establishments (5.9% vs. 4.7% nationally), sales turnover (5.2% # Core NTE 2020 % Total
Measure
% Change 19-20 Economy
vs. 3.3% nationally) and employment (13% vs. 7.2% nationally.
Between 2019 and 2020, the number of Core NTE
1,811
establishments experienced a small decrease of 0.4% (-7).
There was, however, considerable business churn, with 307
5.9%
Establishments -0.4%
business exits and 288 entries.
While the overall number of Core NTE establishments
31,050
remained relatively static, sales turnover fell by -3.2%, likely due
13.2%
to the pandemic. Core NTE Employment in the ACT defied this
Employment +4.0%
– and the national trend – with more people employed in Core
NTE establishments at the end of the 2019-20 financial year
$3,352m
than the year prior (+4.0%). This could be a result of the 5.2%
relatively fewer restrictions endured by the ACT compared to
Sales Turnover -3.2%
other areas.
The majority of the employment increase was driven by the
# Establishments
Food sub-sector, with Cafés and Restaurants returning to 2018 Sub-sector % Core NTE
% Change 19-20
levels (increasing +7% on 2019, following a contraction
between 2018 and 2019) and Takeaway Food Services gaining
an additional 635 employees (+14%). The Food sub-sector also 99
gained the 15 businesses, which will have been a contributing 5.5%
factor in this strong employment performance. Drink -12.4%
This growth means the Food sub-sector continues to represent
a higher proportion of the ACT’s Core NTE establishment pool 472
than the national average (69% compared to 62%). This
26.1%
Entertainment -1.7%
strength in Food businesses is offset by a slightly lower
proportion of businesses classified as either Entertainment
1,240
(26%) or Drink (6%) than Australia as a whole (30% and 8%
respectively).
68.5%
Food +1.2%
The proportion of Drink establishments has decreased, with the
sub-sector experiencing a large fall in establishment numbers
(-14) since June 2019, with eleven of these classified as Pubs, # 2020
Measure Density
Taverns and Bars. % Change 19-20
431,380 183
Population
+1.2% per km2
P a g e | 33 Prepared by Ingenium Research - August 2021You can also read