Satellite inference of water vapour and above-cloud aerosol combined effect on radiative budget and cloud-top processes in the southeastern ...
←
→
Page content transcription
If your browser does not render page correctly, please read the page content below
Atmos. Chem. Phys., 19, 11613–11634, 2019
https://doi.org/10.5194/acp-19-11613-2019
© Author(s) 2019. This work is distributed under
the Creative Commons Attribution 4.0 License.

Satellite inference of water vapour and above-cloud aerosol
combined effect on radiative budget and cloud-top processes in the
southeastern Atlantic Ocean
Lucia T. Deaconu1,2 , Nicolas Ferlay2 , Fabien Waquet2 , Fanny Peers3 , François Thieuleux2 , and Philippe Goloub2
1 Department  of Physics, University of Oxford, OX1 3PU, Oxford, UK
2 Université de Lille, CNRS, UMR 8518, LOA – Laboratoire d’Optique Atmosphérique, 59000 Lille, France
3 College of Engineering, Mathematics and Physical Sciences, University of Exeter, Exeter, UK

Correspondence: Lucia T. Deaconu (lucia.deaconu@physics.ox.ac.uk) and Nicolas Ferlay (nicolas.ferlay@univ-lille.fr)

Received: 25 February 2019 – Discussion started: 6 March 2019
Revised: 12 August 2019 – Accepted: 13 August 2019 – Published: 13 September 2019

Abstract. Aerosols have a direct effect on the Earth’s ra-        by selecting the months associated with one meteorological
diative budget and can also affect cloud development and          regime (June–August).
lifetime, and the aerosols above clouds (AAC) are partic-            The results show that the region we focus on is primar-
ularly associated with high uncertainties in global climate       ily under the energetic influence of absorbing aerosols, lead-
models. Therefore, it is a prerequisite to improve the de-        ing to a significant positive shortwave direct effect at the
scription and understanding of these situations. During the       top of the atmosphere. For larger loads of AACs, clouds are
austral winter, large loadings of biomass burning aerosols        optically thicker, with an increase in liquid water path of
originating from fires in the southern African subcontinent       20 g m−2 and lower cloud-top altitudes by 100 m. These re-
are lifted and transported westwards, across the southeastern     sults do not contradict the semi-direct effect of above-cloud
Atlantic Ocean. The negligible wet scavenging of these ab-        aerosols, explored in previous studies. Furthermore, we ob-
sorbing aerosols leads to a near-persistent smoke layer above     serve a strong covariance between the aerosol and the wa-
one of the largest stratocumulus cloud decks on the planet.       ter vapour loadings, which has to be accounted for. A de-
Therefore, the southeastern Atlantic region is a very impor-      tailed analysis of the heating rate profiles shows that within
tant area for studying the impact of above-cloud absorbing        the smoke layer, the absorbing aerosols are 90 % responsi-
aerosols, their radiative forcing and their possible effects on   ble for warming the ambient air by approximately 5.7 K d−1 .
clouds.                                                           The accompanying water vapour, however, has a longwave
   In this study we aim to analyse and quantify the effect        effect at distance on the cloud top, reducing its cooling by
of smoke loadings on cloud properties using a synergy of          approximately 4.7 K d−1 (equivalent to 7 %). We infer that
different remote sensing techniques from A-Train retrievals       this decreased cloud-top cooling in particular, in addition
(methods based on the passive instruments POLDER and              with the higher humidity above the clouds, might modify the
MODIS and the operational method of the spaceborne li-            cloud-top entrainment rate and its effect, leading to thicker
dar CALIOP), collocated with ERA-Interim re-analysis me-          clouds. Therefore, smoke (the combination of aerosol and
teorological profiles. To analyse the possible mechanisms         water vapour) events would have the potential to modify and
of AAC effects on cloud properties, we developed a high           probably reinforce the underlaying cloud cover.
and low aerosol loading approach, which consists in evaluat-
ing the change in radiative quantities (i.e. cloud-top cooling,
heating rate vertical profiles) and cloud properties with the
smoke loading. During this analysis, we account for the vari-
ation in the meteorological conditions over our sample area

Published by Copernicus Publications on behalf of the European Geosciences Union.
11614                                                               L. T. Deaconu et al.: Satellite inference of water vapour

1   Introduction                                                   well captured by models. This is mainly due to limitations
                                                                   in accurately representing the aerosol and cloud spatial and
The South Atlantic Ocean (SAO) is covered almost perma-            vertical distributions, the aerosol absorption capacity, and the
nently by the largest stratocumulus cloud deck on the planet.      cloud properties, such as cloud optical thickness, liquid water
These clouds play a very important role in the climate sys-        path and effective radius. In situ measurements can be used
tem, as they cool the tropics by reflecting sun radiation back     to improve our understanding of the aerosol direct radiative
into space (Bretherton et al., 2004; Wood, 2012). Between          forcing and cloud adjustments to the presence of aerosols.
June and October, biomass burning aerosols originating from        Recent airborne campaigns aim to answer several scientific
fires in the southern African subcontinent are lifted and trans-   questions related to the smoke-and-cloud regime over the At-
ported long distances westwards, mostly above the low-level        lantic region using multiple aircraft and surface-based instru-
clouds (Ichoku et al., 2003; Waquet et al., 2009). The south-      mentation located at different measurement sites, over the
ern African subcontinent is the main annual contributor of         period 2016 to 2018 (Zuidema et al., 2016). The three cam-
biomass burning aerosols, as most of this region is covered        paigns (ORACLES, CLARIFY and AEROCLO-sA) offer the
by savannah. Due to agricultural practices, the savannah veg-      opportunity for international scientists to collaboratively ver-
etation is burned and a large amount of aerosol is injected        ify and validate different satellite measurements and con-
into the atmosphere (Labonne et al., 2007). The negligible         strain the climate models.
wet scavenging of the aerosols transported above the clouds           Although in situ measurements are more detailed and
leads to a near-persistent smoke layer above the stratocumu-       provide a better characterization of aerosols and their ef-
lus deck, which can be suspended in the atmosphere for sev-        fects, these local measurements are not sufficient for re-
eral days. These dark-coloured aerosols are efficient in ab-       gional or global climate studies. Space-borne observations
sorbing shortwave radiation, which can warm the lower tro-         allow the retrieval of aerosol and cloud properties over large
posphere and can modify the radiative budget, with a large-        spatial–temporal scales, facilitating the study of their effects
scale effect on climate that is not yet well understood. For in-   on climate and reducing the related uncertainties. The A-
stance, at the top of the atmosphere, the sign and amplitude of    Train satellite constellation includes different passive and ac-
the direct radiative effect (DRE) depend on the aerosol prop-      tive sensors that provide near-simultaneous measurements
erties and on the reflective properties of the underlying sur-     of aerosol and cloud properties, allowing the combination
face. The aerosol DRE can be positive or negative, depending       and comparison of various methods and also the possibility
on the cloud albedo, the aerosol type and its level of absorp-     to perform instrumental synergies. The study of the above-
tion (Lenoble et al., 1982; Keil and Haywood, 2003; Peers et       cloud aerosol properties and radiative impacts as well as their
al., 2015). The aerosol effects are, in fact, even more complex    potential interactions with the underlying clouds using satel-
and may stabilize, promote or suppress the cloud formation,        lite observations is a relatively recent topic in the field of re-
as a function of the position of the absorbing aerosol layer       mote sensing. Until now, different methods and instruments
with respect to the cloud layer and the contact with the cloud     were used for the retrieval of the above-cloud aerosol prop-
droplets. In the case of absorbing aerosols above stratocu-        erties. Lidar instruments that provide the vertical profile of
mulus clouds, the warming of the layers located above the          the atmosphere are valuable tools for the study of above-
clouds would tend to stabilize the boundary layer. This stabi-     cloud aerosol scenes. The lidar CALIOP (Cloud-Aerosol Li-
lization would induce a lower entrainment rate and a moister       dar with Orthogonal Polarization), installed on the CALIPSO
boundary layer. The resulting effects would be an increase         (Cloud-Aerosol Lidar and Infrared Pathfinder Satellite Ob-
in the liquid water content and preservation of cloud cover        servation) satellite, uses backscatter measurements to deter-
(Brioude et al., 2009; Johnson et al., 2004). Conversely, if       mine the vertical structure of the atmosphere and the prop-
the aerosols are within the cloud, the warming of the atmo-        erties of the aerosol and cloud layer (Vaughan et al., 2009;
spheric layer due to aerosol absorption tends to reduce the        Winker et al., 2009; Young and Vaughan, 2009). The opera-
relative humidity and the liquid water content, decreasing the     tional method developed for CALIOP allows the retrieval of
stratocumulus cloud cover (Hill et al., 2008). Additionally, an    the aerosol properties (i.e. mainly the aerosol optical thick-
increase in the number of aerosols serving as cloud conden-        ness, AOT) for scenes with aerosols above clouds. How-
sation nuclei (CCN) could lead to a larger number of smaller       ever, the method relies on assumptions on the extinction-
cloud droplets that bring about more reflective clouds, in-        to-backscatter ratio of aerosols, and alternative CALIOP-
ducing a cooling of the Earth–atmosphere system (Twomey,           based research methods have also been introduced to re-
2007). The reduction of cloud droplet size may potentially         trieve the above-cloud AOT (ACAOT). The depolarization
have other impacts on precipitation and cloud properties.          ratio method (first introduced by Hu et al., 2007, and fur-
   All this considered, the southeastern Atlantic region is        ther implemented by Deaconu et al., 2017; Kacenelenbogen
well suited to investigate the interactions of aerosols above      et al., 2019; Liu et al., 2015) and the colour ratio method
clouds (AAC) with radiation and clouds. Currently the com-         (Chand et al., 2008) use fewer assumptions for the retrieval
plexity of these interactions in the southeastern Atlantic and     of AAC properties. These techniques are based on light trans-
their influence on local and global climate are, however, not      mission methods and treat the liquid water clouds situated

Atmos. Chem. Phys., 19, 11613–11634, 2019                                          www.atmos-chem-phys.net/19/11613/2019/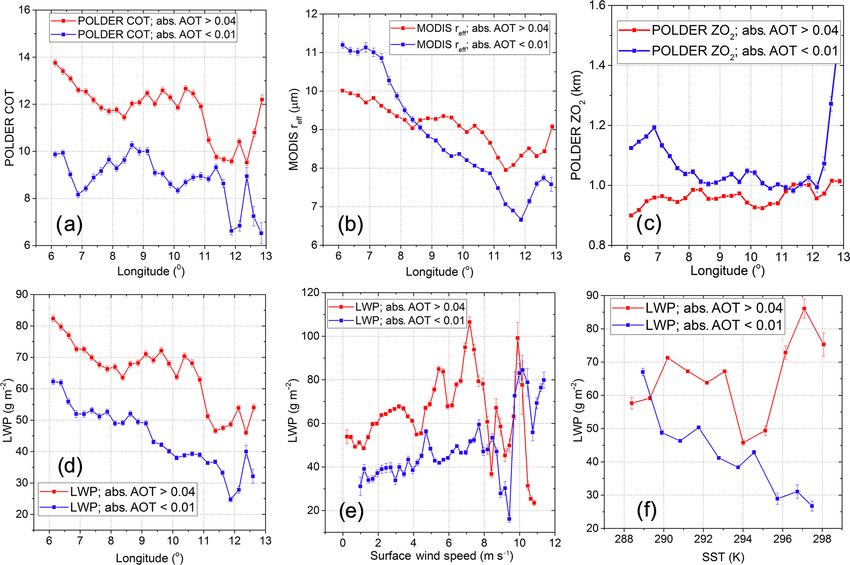
L. T. Deaconu et al.: Satellite inference of water vapour                                                                        11615

Table 1. Satellites and models and their associated parameters used in this study.

                       Satellites and models    Parameters                                References
                       POLDER                   AOT (865 nm)                              Waquet et al. (2009)
                                                SSA 865 nm (and absorption AOT)           Waquet et al. (2013)
                                                COT, corrected for absorption             Peers et al. (2015)
                                                Cloud altitude ZO2 (km)                   Vanbauce et al. (2003)
                       MODIS                    reff (µm)                                 Meyer et al. (2015)
                       CALIOP                   σaer at 532 nm (and AOT)                  Vaughan et al. (2009);
                                                Aerosol base and top altitudes (km)       Young and Vaughan (2009)
                                                Cloud-top altitudes (km)
                       ECMWF                    Temperature (K)                           Berrisford et al. (2011)
                                                Relative humidity (%)                     Dee et al. (2011)
                                                Specific humidity (g kg−1 )
                                                Wind direction (◦ )
                                                Wind amplitude (m s−1 )
                       GAME radiative           Heating rates in SW and LW (K d−1 )       Dubuisson et al. (2006)
                       transfer model           DRE at TOA (Wm−2 )

Table 2. Mean values of aerosol properties over the specific area from June to August 2008, in the case of high values of absorption AOT
(> 0.04) and in the case of low values of absorption AOT (< 0.01), respectively.

                                POLDER aerosol        Absorption    AOT865 nm        SSA865 nm    AE670/865
                                properties            AOT865 nm
                                High                         0.05          0.26           0.80          2.03
                                Low                         0.005          0.06           0.86          1.75

underneath the aerosol layer as a target. Passive sensors                the ultraviolet (UV) range by the with Ozone Monitoring In-
have also been used to obtain information on aerosols above              strument (OMI). Similar methods that can retrieve the above-
clouds. The multidirectional polarization measurements have              cloud AOT and, simultaneously, the cloud properties have
shown sensitivity to scenes with aerosols above clouds (Wa-              also been developed for the Moderate Resolution Imaging
quet et al., 2009; Hasekamp, 2010; Knobelspiesse et al.,                 Spectroradiometer (MODIS) instrument (Jethva et al., 2013;
2011), as they strongly modify the polarized light reflected             Meyer et al., 2015a). For more methods, please refer to Ta-
back to space by the cloud layer. Waquet et al. (2013) have              bles 1 and 2 of Kacenelenbogen et al. (2019), which report
developed an operational method for retrieving the proper-               earlier studies that observed AAC using passive and active
ties of AACs that relies on the polarized radiances mea-                 satellite sensors.
sured by the POLDER (Polarization and Directionality of                     Previous studies that aimed to analyse the impact of ab-
Earth Reflectances) instrument, on board the PARASOL (Po-                sorbing aerosols on the cloud properties and radiative forcing
larization and Anisotropy of Reflectances for Atmospheric                were based on the exploitation of several A-Train satellite ob-
Science coupled with Observations from a Lidar) satellite.               servations and modelling. Costantino and Bréon (2013) used
The method is able to retrieve the AOT at 865 nm and the                 MODIS to retrieve aerosol and cloud properties, collocated
Ångström exponent, which is a parameter indicative of the                with CALIOP estimates of aerosol and cloud altitudes. Their
particle size. Furthermore, Peers et al. (2015) have devel-              objective was to use the simultaneous satellite-retrieved
oped a complementary method that uses additional total mul-              aerosol and cloud properties to contribute to the knowledge
tidirectional radiances measured by POLDER to retrieve the               of aerosol effect on low-level stratocumulus cloud micro-
aerosol single-scattering albedo (SSA) and the cloud optical             physics (cloud droplet effective radius, reff ), optical prop-
thickness (COT). Passive sensor techniques that solely use               erties (COT) and liquid water path (LWP). Their results
total radiance measurements have also been used to obtain                showed that the aerosol effects on the cloud microphysics
information on aerosols above clouds. Torres et al. (2012)               are strong when the layers are in contact: effective radius can
have developed an algorithm to retrieve the ACAOT and the                decrease from 15–16 down to 10–11 µm for an aerosol index
underlying COT, using radiance measurements performed in                 that varies from 0.02 to 0.5, suggesting a potential indirect

www.atmos-chem-phys.net/19/11613/2019/                                                   Atmos. Chem. Phys., 19, 11613–11634, 2019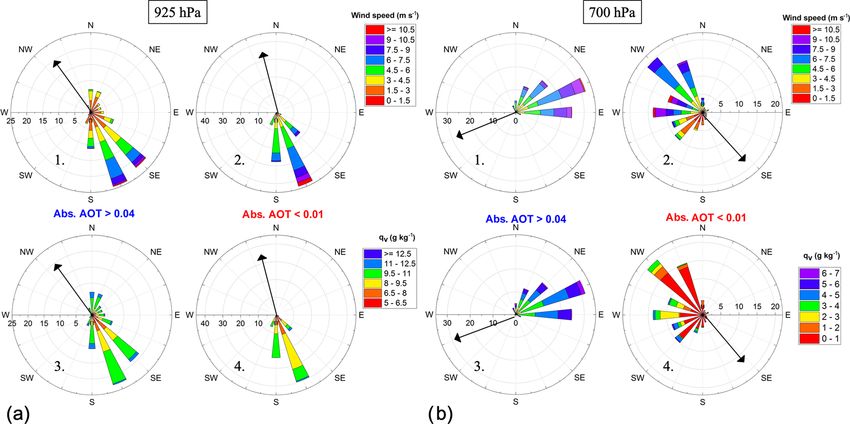
11616                                                               L. T. Deaconu et al.: Satellite inference of water vapour

effect of aerosols. Wilcox (2010) also used the aerosol and        ferent cloudy conditions at St. Helena. They show that the
cloud altitudes retrieved with CALIOP in combination with          specific humidity (qv ) is higher within the aerosol plumes
OMI aerosol index in order to analyse the link between the         (around 700 hPa). This was previously observed during the
absorbing aerosols located above clouds and the marine stra-       UK-SAFARI 2000 campaign (Haywood et al., 2003) with
tocumulus cloud properties. His results showed that the pres-      qv values larger than 2 to 4 g kg−1 within the aerosol layer,
ence of absorbing aerosol layers led to a heating (by nearly       while outside the smoke plume the qv values are less than
1 K at 700 hPa) in the lower troposphere that stabilizes the at-   1 g kg−1 . The moisture may have a role in the aerosol age-
mosphere. This warming coincides with LWP values greater           ing (Dubovik et al., 2002; Haywood et al., 2003; Kar et
by more than 20 g m−2 and cloud-top altitude lower by 200 m        al., 2018) and a radiative significance in both shortwave and
in cases when high loadings of smoke are transported above         longwave spectra. Radiative transfer calculations show that
the cloud. Sakaeda et al. (2011) obtained similar results using    mid-tropospheric moisture generates a net diurnal cooling
the Community Atmospheric Model 3.0 (CAM) constrained              of approximately 0.45 K d−1 , decreasing the impact of the
by satellite observations.                                         shortwave heating caused by the biomass burning aerosols
   As mentioned above, the effect of aerosols on the cloud         that reaches 1.5 K d−1 . As in Wilcox (2010), this study shows
cover can be complex and indirect and can result from              a decrease in the cloud-top altitude of about 112 m near St.
the modification of the atmospheric thermodynamics by the          Helena under polluted conditions.
aerosol loading, e.g. a modification of atmospheric stability.        Starting from all these studies, we have developed our own
But to go further, a difficulty and challenge in the analysis      strategy in order to better understand the effect of aerosols
of aerosol effects on clouds comes from the fact that cloud        and meteorological parameters on clouds. Our strategy ex-
properties are also, and often primarily, sensitive to mete-       ploits several satellite measurements and meteorological re-
orological conditions and corresponding atmospheric ther-          analysis data as constraints of a radiative transfer model. We
modynamics and dynamics. Studies dedicated to aerosol ef-          focus on situations with large amounts of absorbing aerosols
fects should thus aim to disentangle, if possible, aerosol         above the clouds and compare them with cases characterized
effects on cloud properties from effects of meteorological         by low values of absorbing AOT. Also, in order to minimize
conditions only (Brenguier and Wood, 2009; Stevens and             the meteorological impact, we analysed only a limited time
Brenguier, 2009). A level of complexity comes from the             period over a smaller area off the coast of Angola. Smoke
fact that covariances exist between meteorological parame-         layer elevated above the clouds can induce a semi-direct ef-
ters and aerosol concentration and properties. Climatology         fect through an energetic forcing due to both the effects of
of biomass burning events may coincide with changes in             biomass burning aerosol and water vapour. The semi-direct
meteorological regimes. For example, Adebiyi et al. (2015)         effect is defined as a change in the vertical profiles of tem-
showed a shift southward in circulation patterns and thermo-       perature in the atmosphere due to the presence of absorb-
dynamics between July–August and September–October, as             ing aerosol layers located above clouds. This modification
the southern African anticyclone strengthens. Also, while the      may affect the process of evaporation and cloud formation.
aforementioned studies depict dry smoke plumes, biomass            We therefore developed a method to calculate the profiles of
burning aerosol events can be accompanied by varying wa-           heating rates in the visible and thermal infrared by combin-
ter vapour production. Several studies (Clements et al., 2006;     ing POLDER and CALIOP data as well as meteorological
Parmar et al., 2008; Potter, 2005) suggest that depending on       data. In Sect. 2, we present the different parameters used to
the moisture content of fresh biomass, the natural or anthro-      estimate the AAC, cloud properties and the meteorological
pogenic biomass fires are releasing water vapour in the at-        variables and some elements of climatology available for the
mosphere (in addition to organic and black carbon, CO2 and         southeastern Atlantic Ocean. We also describe the CALIOP–
CO; Levine, 1990), which can influence the atmospheric dy-         POLDER synergy and the radiative transfer calculations.
namics, and thus moisture transport. Without measurements          Section 3 describes a “low and high approach”, which con-
of water vapour release from biomass burning in field condi-       sists in distinguishing between two different aerosol-loading
tions, however, it is difficult to constrain the effect on wa-     situations and analysing the difference in the statistic of cloud
ter vapour transport. It might be important to account for         properties and meteorological parameters. We present this
the effect of this accompanying moisture and to identify the       strategy in terms of selected area, time period and covari-
different air circulation patterns that will lead the biomass      ance between aerosol load and meteorological data. Section 4
burning transportation off the coast of southern Africa. This      shows the changes in cloud properties with respect to the
was performed by Adebiyi et al. (2015), who incorporated           aerosol loadings, the overall radiative effect of the smoke
radiosonde measurements from St. Helena Island of temper-          layer for the selected region and an attempt to separate the
ature and specific humidity, MODIS AOT550 nm , CALIOP              radiative effects of the biomass burning aerosols from those
aerosol altitude data and reanalysis data (ERA-Interim) to         of the water vapour. Section 5 provides the conclusions and
provide a unique dataset of thermodynamic profiles linked          perspectives.
to clear and polluted conditions. They also investigated the
radiative effect of moisture and absorbing aerosol in dif-

Atmos. Chem. Phys., 19, 11613–11634, 2019                                          www.atmos-chem-phys.net/19/11613/2019/
L. T. Deaconu et al.: Satellite inference of water vapour                                                                   11617

2     Dataset and methodology                                     (g kg−1 ), pressure (hPa), wind speed (m s−1 ), wind direction
                                                                  (◦ ) and ozone (atm-cm). The assimilating model is config-
2.1    Description of the dataset                                 ured for 60 vertical levels, from the surface up to 0.1 hPa. The
                                                                  horizontal resolution of the products is 0.5◦ and the reanaly-
In this study, we use version 4.00 of the official output         sis data are provided every 6 h (Dee et al., 2011). In our study,
product PARASOL_PM02-L2 for AAC scenes (available at              these data were spatially and temporally collocated with the
the ICARE website, http://www.icare.univ-lille1.fr/parasol/       POLDER and CALIOP observations. All these parameters
products/, last access: 13 December 2017) to retrieve the         are summarized in Table 1.
properties of aerosols above clouds. The parameters used
in our study are the aerosol optical thickness, the aerosol       2.2   Radiative transfer calculation and synergy
single-scattering albedo and the aerosol-corrected cloud op-            CALIOP–POLDER
tical thickness. All these parameters are retrieved at a res-
olution of 6 × 6 km2 and available at 490 and 865 nm. We          To compute fluxes and heating rates at different levels in the
also use the Ångström exponent, which is primarily indica-        atmosphere, in the visible and also in the thermal infrared
tive of the particle size (i.e. with the AOT retrieved at 865     ranges, we use the Global Atmospheric ModEl (GAME),
and 670 nm). The aerosol model prescribed by the POLDER           which is a fast and high-spectral-resolution radiative transfer
satellite algorithm (i.e. particle size and absorption) is also   code that allows the calculations of radiances (and fluxes) in
used to extrapolate these optical properties over a large spec-   horizontal and plan-parallel atmospheric layers (Dubuisson
tral range. The uncertainties associated with these variables     et al., 2006). The model accounts for the Rayleigh scatter-
are thoroughly described in Peers et al. (2015) and Wa-           ing effects and for the scattering and absorbing properties of
quet et al. (2013). The lidar CALIOP is primarily used to         clouds and aerosols that have to be computed over the dif-
determine the aerosol layer vertical extent. We used level        ferent spectral intervals: 208 spectral intervals for the short-
2 version 3.01 of the inversion products, officially named        wave spectrum (from 220 nm to 4 µm) and 115 spectral in-
CAL_LID_ L2_ 05kmALay, for the aerosol base and top               tervals for the longwave spectrum (from 4 to 50 µm). This
altitudes, CAL_LID_L2_05kmCLay for the cloud-top alti-            method allows the discretization of the radiation field in a
tude and CAL_LID_L2_ 05km_APro for the vertical pro-              finite number of propagation directions and allows us to ef-
file of aerosol extinction at 532 nm (data can be found at        ficiently compute the multiple scattering processes occurring
http://www.icare.univ-lille1.fr/calipso/products/, last access:   in the atmosphere whatever the value of the optical thickness.
7 January 2018) (Vaughan et al., 2009; Young and Vaughan,            The GAME model requires information on the vertical dis-
2009). Other cloud parameters considered are the cloud            tribution of aerosol and clouds, their optical and microphys-
droplet effective radius, reff inferred by MODIS, the liq-        ical properties, and the vertical structure of the atmosphere.
uid water path (LWP), the cloud altitude (ZO2 ) and the           Inputs to GAME are the collocated POLDER, CALIOP and
aerosol-corrected cloud optical thickness (COT) retrieved         ERA-Interim re-analysis data for the temperature and humid-
with POLDER. ZO2 is calculated using the POLDER oxygen            ity profiles, which are crucial for the radiative computation in
pressure method (POxygen ), which is determined from differ-      the longwave spectrum.
ential absorption between two spectral bands centred on the          In GAME the computation is made for plane-parallel lay-
oxygen A-band (763 and 765 nm) (Buriez et al., 1997; Van-         ers of the atmosphere, each layer characterized by particular
bauce et al., 2003). In our study, the ZO2 product is used as a   values of aerosol (or cloud) and meteorological parameters.
proxy for the cloud-top altitude estimate outside the CALIOP      We have divided the lower troposphere into 100 m thick lay-
track. The liquid water path is computed with the homoge-         ers from the surface up to 8 km. Above this altitude (up to
neous assumption, using POLDER COT and the MODIS reff :           100 km) the layers are more roughly distributed, as the up-
                                                                  per atmosphere is not under the influence of biomass burn-
          2ρw                                                     ing aerosols and not in our field of interest. For each 100 m
LWP =         × COT × reff ,                               (1)    aerosol layer we provided the CALIOP extinction coefficient
           3
                                                                  (σe , km−1 sr−1 ).
where ρw is the water density. The MODIS reff bias for               However, the standard CALIOP product can underesti-
biomass burning aerosols above clouds (Meyer et al., 2015b)       mate the geometrical thickness of the aerosol layer when the
is expected to be of about 2 % on average and then should         optical thickness is large enough, due to the attenuation of the
have a small effect on the LWP computation.                       backscattered signal (Jethva et al., 2014). It can also underes-
   In order to estimate the main thermodynamic quantities         timate the AOT when aerosols are below a certain detection
of the atmosphere, we use the ERA-Interim product pro-            threshold (Kacenelenbogen et al., 2014; Watson-Parris et al.,
vided by the European Centre for Medium-Range Weather             2018). The CALIOP miscalculation of the aerosol bottom al-
Forecasts (ECMWF) model (Berrisford et al., 2011). This           titude would implicitly underestimate the aerosol extinction
reanalysis meteorological database delivers various parame-       profile (i.e. the AOT), and hence the aerosol radiative forc-
ters, including profiles of temperature (K), specific humidity    ing. A recent study that uses independent lidar backscattering

www.atmos-chem-phys.net/19/11613/2019/                                          Atmos. Chem. Phys., 19, 11613–11634, 2019
11618 L. T. Deaconu et al.: Satellite inference of water vapour
Figure 1. Biomass burning study case: (a) CALIOP initial extinction coefficient (m−1 ) at 532 nm (σe,532 nm ), (b) scaled CALIOP σe,532 nm
as a function of latitude; (c) example of CALIOP extinction coefficient profile at 532 nm (blue) and the result of scaling (red) with the
POLDER AOT extrapolated at 532 nm.
measurements at 1064 nm of the Cloud-Aerosol Transport mainly on the profile of atmospheric component, cloud and
System (CATS) (Yorks et al., 2014) shows that the CALIOP water vapour, with their temperatures. In the longwave spec-
algorithm probably overestimates the base of the aerosol trum we considered a negligible effect of aerosols. The sum
layer by 500 m (Rajapakshe et al., 2017). Indeed, aerosol– between HRSW and HRLW gives the total heating rate, re-
cloud interaction is possible, but from our data, most of the ferred to as HRtotal in the following.
retrievals show detached situations. Deaconu et al. (2017)
showed that the CALIOP operational algorithm underesti- 2.3 Elements of climatology in the southeastern
mates the AOT above clouds with a factor of 2 to 4 depend- Atlantic Ocean
ing on the aerosol type, when compared to other methods
dedicated for above-cloud aerosol retrievals – the POLDER 2.3.1 Meteorological patterns
polarization method (Waquet et al., 2009) and the CALIOP
depolarization ratio method (DRM) (Deaconu et al., 2017;
The pattern of the atmospheric circulation plays a determi-
Hu et al., 2007). By analysing the consistency between the
nant role in the transport of aerosols emitted from the African
above-cloud aerosol retrievals from the POLDER method
continent. Meteorology and circulation patterns can also im-
and CALIOP DRM, they also found good agreement for
pact the stratocumulus clouds by changing the thermody-
AOT retrievals when the microphysics of the aerosols are
namic environment, regardless of the presence (or absence)
well defined (such as biomass burning aerosols) and when
of aerosols above clouds. Therefore, it is necessary to sepa-
the aerosol layer is detached from the cloud. These results
rate (or constrain) the effects of meteorology on clouds from
give confidence in our ability to measure the properties of
the variations caused by AAC in order to study the aerosol
AAC over the South Atlantic region using the POLDER
effects on clouds in the SAO. In this area, the main atmo-
method. Therefore, in our study we will use the POLDER
spheric circulation is dominated by easterly winds through-
AOT865 nm retrieved under the CALIOP track to scale the
out the air column and south-easterlies close to the surface,
CALIOP σe profile used in GAME (Fig. 1). As the POLDER
as shown in the study of Adebiyi et al. (2015) Figs. 8 to 10.
AOT is retrieved at 865 nm and the CALIOP σe is used
From July to October the Southern Hemisphere is influenced
at 532 nm, the σe scaling first requires an extrapolation of
by the Atlantic anticyclone between 600 and 800 hPa and the
POLDER AOT at 532 nm. Afterwards, we infer the result-
trade winds at the surface (with winds stronger than 5 m s−1 ).
ing CALIOP σe,scaled at 550 nm, which is the native wave-
The September–October period presents differences com-
length used for AOT in the radiative transfer model. As men-
pared to the July–August period, as different circulation
tioned before, the base of the aerosol layer is biased high,
patterns cause a maximum coverage of the stratocumulus
which means that the calculation of the heating rates is con-
clouds, and more importantly, a maximum in the continen-
fined within a slightly thinner geometrical aerosol layer (by
tal aerosol loading transported westwards over the Atlantic
500 m). This, however, does not alter the results and conclu-
basin, around 10◦ S. This region is also characterized by two
sions of our study.
different humidity and temperature regimes: larger values are
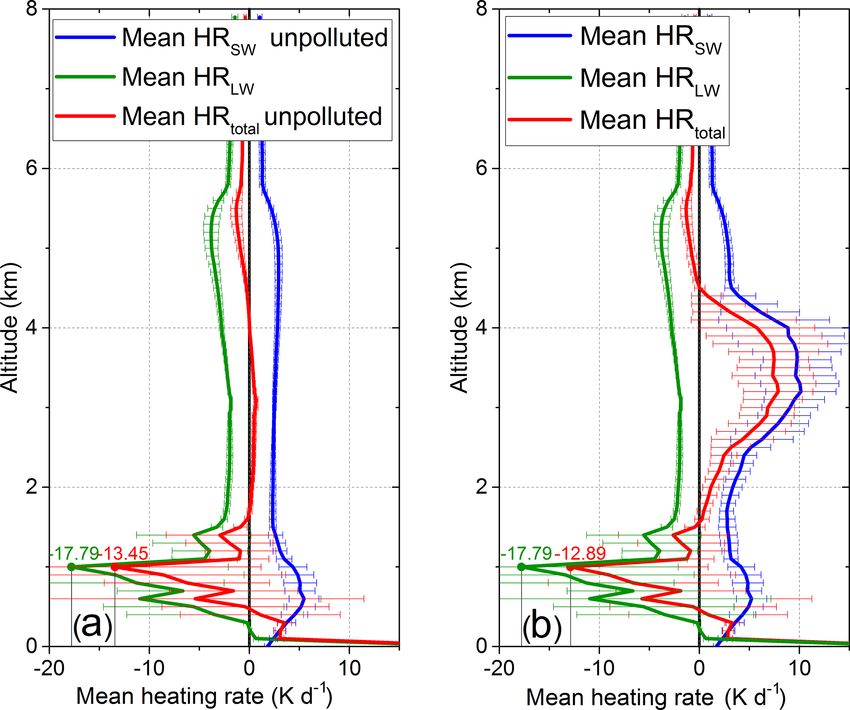
We compute the instantaneous heating rate (HR) pro-
found north of 20◦ S compared to the southern region. Ade-
files (K d−1 ) in the shortwave and in the longwave domains
biyi et al. (2015) also described a general increase in the mid-
(HRSW and HRLW ). The first is due to the shortwave absorp-
tropospheric moisture at 600 hPa during September–October,
tion of aerosols and water vapour. The second is the result
suggesting an association between the aerosol loading and
of infrared absorption and emission processes and depends
moisture.
Atmos. Chem. Phys., 19, 11613–11634, 2019 www.atmos-chem-phys.net/19/11613/2019/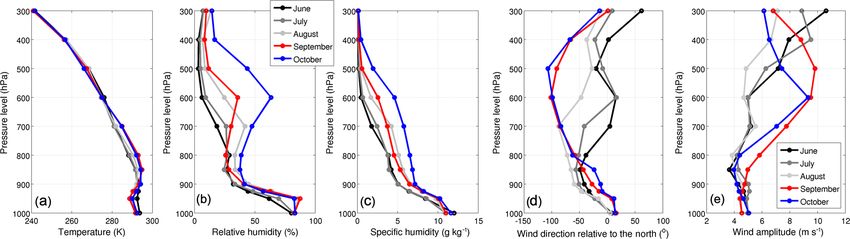
L. T. Deaconu et al.: Satellite inference of water vapour 11619
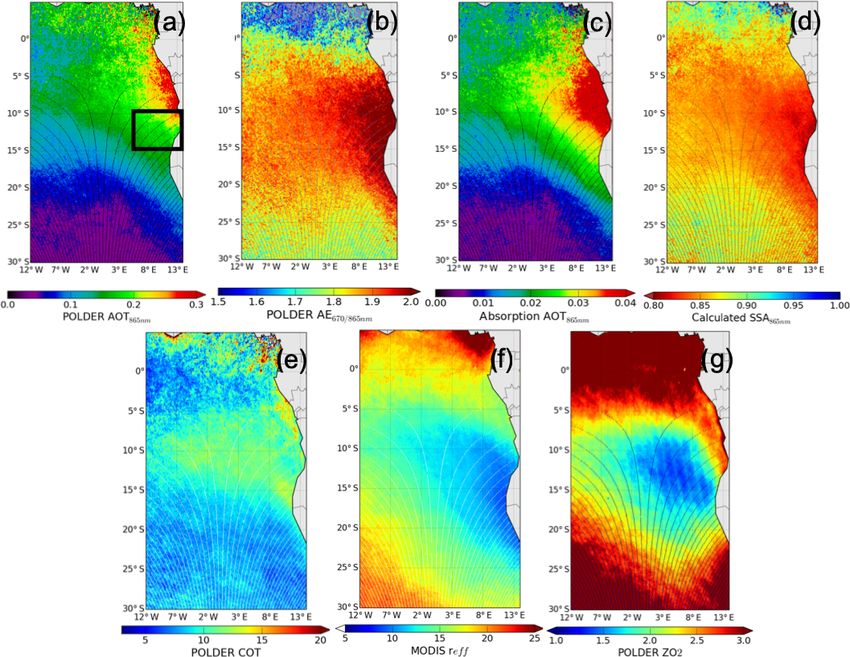
Figure 2. Mean values of above-cloud aerosol and cloud properties above the South Atlantic Ocean, for a period of 6 months (May to
October) from 2006 to 2009: (a) POLDER AOT865 nm . The black box represents the sample area close to Angola’s coast described in
Sect. 3.2; (b) POLDER AE670/865 nm ; (c) POLDER absorption AOT865 nm ; (d) POLDER SSA865 nm ; (e) POLDER COT (corrected for
above-cloud absorbing aerosols); (f) MODIS effective radius, reff (µm); (g) POLDER cloud altitude (ZO2 ) derived from oxygen pressure
(km).
2.3.2 Aerosol and cloud properties et al., 1998). Also, between 0 and 5◦ N, the values of the
AE670/865 decrease to 0.4 (not shown on the colour scale),
The maps shown in Fig. 2 present the average values of dif- which correspond to values prescribed for the dust model in
ferent POLDER and MODIS aerosol and cloud retrievals at the POLDER algorithm, indicating that dust particles could
a horizontal resolution of 6 × 6 km2 , acquired from May to be preferentially transported above clouds over this area.
October 2006 to 2009 over an area that extends from 30◦ S Information related to the absorption property of the
to 5◦ N and from 12◦ W to 14◦ E in the SAO. aerosols is given by the single-scattering albedo and/or by the
Large aerosol loadings are found close to the coast, where absorption AOT865 nm , which is the product of the extinction
the average above-cloud AOT exceeds 0.3 at 865 nm. To- (total) AOT by (1 – SSA). For this region we observe high
wards the west, the ACAOT decreases to an average of 0.2 values of absorption AOT865 nm , which exceed 0.04 close to
at 865 nm due to transportation and deposition of aerosols the coast (Fig. 2c) and decrease progressively westwards.
(Fig. 2a). As expected, the mean values of the Ångström ex- These estimates are consistent with the values retrieved for
ponent (AE670/865 ) along the shoreline are larger than 2.0, the SSA865 nm of 0.80 at seashore that increase to 0.87 around
characteristic of very fine particles of smoke (Dubovik et al., 12◦ W (Fig. 2d). The observations are in agreement with the
2002), while westwards the mean AE670/865 values slightly typical values provided by AERONET (Dubovik et al., 2002;
decrease to around 1.85 (Fig. 2b). This suggests an increase Sayer et al., 2014) and the field campaigns Southern African
in the particle size, as the plume is transported towards the Regional Science Initiative (SAFARI-2000; Leahy et al.,
open sea. The decrease in the mean AE values with longi- 2007; Swap et al., 2002), ObseRvations of Aerosols above
tude can suggest the evolution of the aerosol properties, such CLouds and their intEractionS (ORACLES-2016; Pistone
as growth of the smoke aerosols associated with ageing (Kar et al., 2019) and Dust and Biomass Experiment (DABEX;
et al., 2018; Müller et al., 2007; Waquet et al., 2013; Reid
www.atmos-chem-phys.net/19/11613/2019/ Atmos. Chem. Phys., 19, 11613–11634, 2019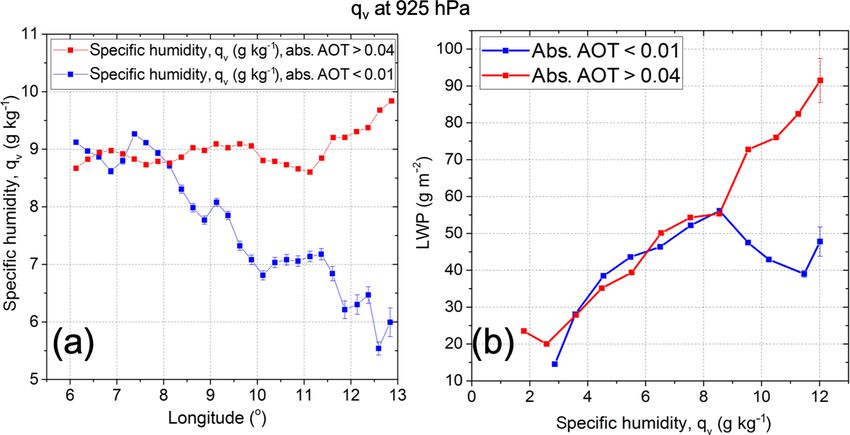
11620 L. T. Deaconu et al.: Satellite inference of water vapour
tween the products increases systematically when CTA ex-
ceeds 1.5 km. In this region an underestimation of around
300 m by the POLDER product is more likely.
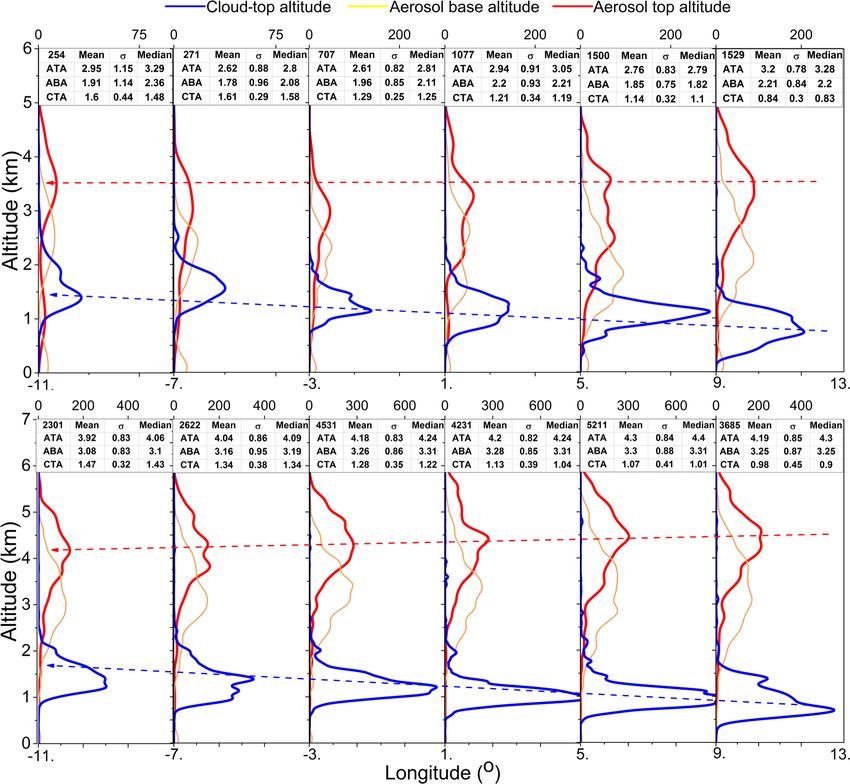
Figure 4 shows the variation with longitude of cloud and
aerosol altitudes retrieved with CALIOP over the South At-
lantic for a period of 6 months (May to October) from 2006
to 2010. We reported the mean values of cloud-top altitude,
aerosol top altitude (ATA) and aerosol base altitude (ABA)
for longitude bins of 4◦ . The data are shown for May–July in
the first row and for August–October in the second row. The
mean, standard deviation and median, as well as the number
of measurements for each 4◦ bin are provided in the associ-
ated tables. For both time periods, we notice the cloud-top
altitude increasing from 1 to 1.5 km towards the west. This
suggests that the clouds develop and become more convec-
Figure 3. POLDER cloud altitude (ZO2 ) compared to CALIOP tive further away from the coast. The average aerosol top al-
cloud-top altitude, over a period of 6 months (May to October) from titude is higher during the second interval (August–October),
2006 to 2010 along the CALIOP track. Lateral histograms show the and we observe a higher number of AAC situations. This is
data distribution.
likely due to the fact that the biomass burning events that
reach higher altitudes are most frequent during the late aus-
tral winter. We also observe a double layer aerosol profile
Johnson et al., 2008) for the biomass burning aerosols. North in the first period, mainly west of 1◦ E (upper left profiles):
of the latitude of 5◦ S, the SAO region is under the influence one mode around 3.0 km and another around 1 km, which
of dust particles and the retrieved SSA865 nm is up to 0.97, are likely to correspond to sea salt aerosols located in the
which is expected for mineral dust particles that do not ab- boundary marine layer. In the first period the aerosol base
sorb much light in the near-infrared range (Dubovik et al., and top altitudes do not show strong variability across the
2002). longitude, while in the second period the average aerosol al-
Low-level stratocumulus clouds typically cover the South titude decreases from east to west. This suggests that contact
Atlantic Ocean. Generally, these clouds are characterized situations between the cloud and the aerosol layers are less
by rather small droplets (reff of approximately 10 µm) and frequent close to the coast and increase as the aerosols are
by optical thickness values of around 10–15 (Szczodrak et transported westwards.
al., 2001). In the presence of above-cloud biomass burning
aerosols, MODIS-retrieved COT can be underestimated by
more than 20 %, especially over bright clouds with large 3 The high- and low-smoke-loading and absorption
COT (Haywood et al., 2004; Peers et al., 2015). Figure 2e approach
presents the mean POLDER COT that was corrected for the
aerosol-induced bias due to aerosol above–cloud absorption 3.1 Strategy of analysis
(Peers et al., 2015). The MODIS cloud droplet effective ra-
dius (reff ) (Fig. 2f) is increasing from the coast towards the One objective of the current study is to analyse the changes in
open sea, from 10 to 15 µm. In Fig. 2g we observe a min- cloud properties with aerosol loading and absorption, as pre-
imum cloud altitude of 1.2 km central to the stratocumulus viously observed (e.g. Wilcox, 2010) and if these differences
deck, which increases radially as the stratocumulus transition can be understood and attributed to the overlying aerosols or
into cumulus clouds or when the frequency of other types of to the meteorological variability. We also consider the po-
clouds increases (Warren et al., 1988). Figure 3 compares the tential effect of the water vapour and its variability. Another
POLDER ZO2 product with the CALIOP cloud-top altitude objective is to evaluate the radiative forcing of smoke events,
(CTA). In the case of geometrically thick clouds, the oxy- which could help in understanding the impact of atmospheric
gen pressure method mainly indicates the cloud middle pres- processes that lead to differences in cloud properties. We
sure (Ferlay et al., 2010) instead of cloud-top pressure. This propose a low and high approach, which consist in distin-
explains the difference that we observed between POLDER guishing between two different smoke loading situations and
ZO2 and CALIOP (CTA) over a period of 6 months (May to analysing the difference in the statistic of cloud properties
October) from 2006 to 2010 along the CALIOP track: the and meteorological parameters, for a selected temporal and
two altitude measurements are well correlated but ZO2 is spatial domain. In the following, for the high cases the above-
lower than CTA. From the side histograms, we notice that the cloud absorption AOT865 nm is larger than 0.04, while the low
majority of CTA values are centred around 1.25 km, while cases are characterized by absorption AOT865 nm lower than
ZO2 values are centred around 0.9 km. The difference be- 0.01. In this section, we first justify the choice of the sample
Atmos. Chem. Phys., 19, 11613–11634, 2019 www.atmos-chem-phys.net/19/11613/2019/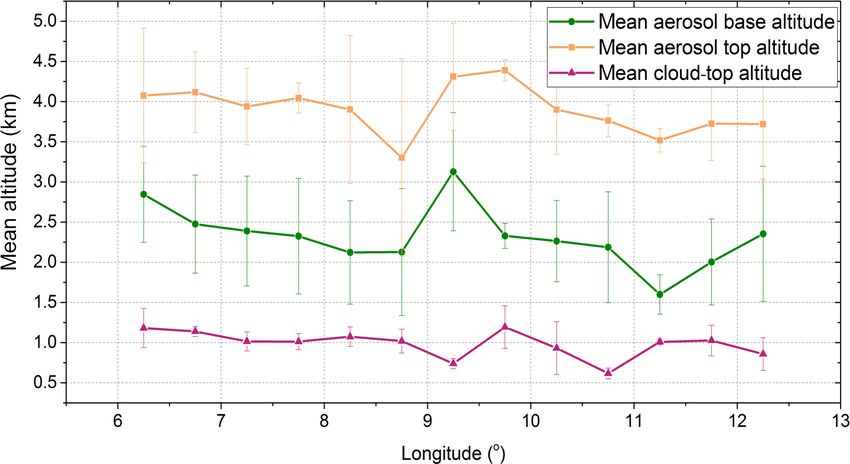
L. T. Deaconu et al.: Satellite inference of water vapour                                                                           11621

Figure 4. First and second rows of the panel present the histograms of the cloud-top altitude (CTA), the aerosol top altitude (ATA) and the
aerosol base altitude (ABA) retrieved using CALIOP, as a function of longitude for two time periods: first row (May to July) and second
row (August to October) from 2006 to 2010. The mean, median and standard deviation over 4◦ of longitude as well as the number of
measurements are shown in the associated tables. The selected area extends from 30◦ S to 5◦ N and 12◦ W to 14◦ E over the South Atlantic
Ocean (SAO).

area and time period selected for this study. We then analyse           affect the retrieval of aerosol properties with the POLDER
the covariance relationship between the aerosol load and the            polarization method (Deaconu et al., 2017).
water vapour content and explore the meteorological patterns               The variability of meteorological parameters in this sam-
for the selected area in function of the high and low scenar-           ple area is emphasized in Fig. 6, which presents ERA-Interim
ios. Analysis of the differences in cloud properties will fol-          monthly mean meteorological parameters from June to Oc-
low in Sect. 4.                                                         tober 2008. We can observe that the temperature profile does
                                                                        not change much throughout this period, while the relative
                                                                        humidity (RH) and the specific humidity (qv ) change from
3.2   Selection of a sample area and time period                        month to month. In June and July, moisture levels are com-
                                                                        parable, with values of qv lower than 2.5 g kg−1 at 700 hPa,
We selected a region close to Angola’s coast that expands               in contrast with August and September where qv reaches
from 15 to 10◦ S and 6 to 14◦ E (Fig. 2a – black box), which            5 g kg−1 at 700 hPa. In October, RH shows a strong peak be-
is close to the main stratocumulus region identified by Klein           tween 700 and 500 hPa, and qv is also larger compared to pre-
and Hartmann (1993). The spatial size of the domain is lim-             vious months. The average monthly horizontal winds show a
ited in order to control the natural variability of cloud prop-         significant difference between the months of SO compared
erties and meteorology. Also, the domain is close to the                to JJA. The winds are much stronger in SO and much more
coast so that aerosol loading is high (Fig. 2) and aerosols are         westwards above 800 hPa. The wind speed also increases
mainly detached from low-level clouds (Figs. 4 and 5). This             above 800 hPa during these months. Winds in August dif-
is important in order to minimize the microphysical interac-            fer from the winds in June–July, but not significantly below
tions between aerosols and cloud droplets (i.e. indirect effect)        800 hPa.
and the probability of aerosols within the clouds, which could

www.atmos-chem-phys.net/19/11613/2019/                                                 Atmos. Chem. Phys., 19, 11613–11634, 2019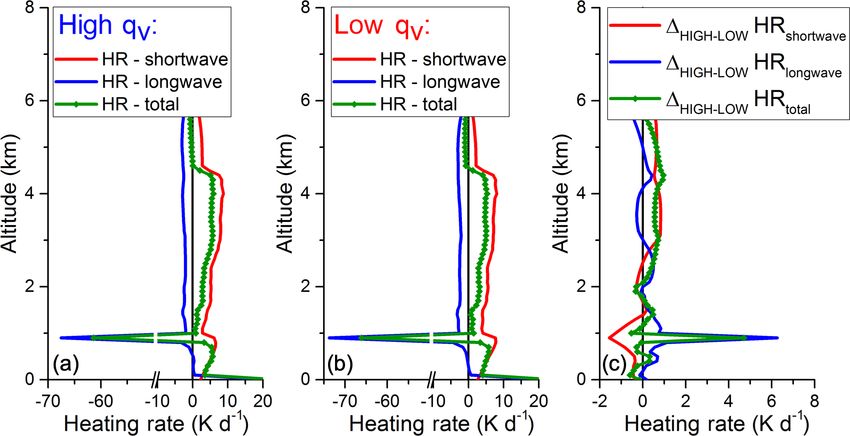
11622                                                                   L. T. Deaconu et al.: Satellite inference of water vapour

                                                                       posphere. Some of their results suggested that the fuel mois-
                                                                       ture could make a significant contribution to the humidity
                                                                       within the aerosol plumes resulting from biomass combus-
                                                                       tion (Clements et al., 2006; Hudspith et al., 2017; Parmar et
                                                                       al., 2008).

                                                                       3.4   Meteorological patterns for high and low situations

                                                                       We investigate the mean temperature, specific humidity, rela-
                                                                       tive humidity and atmospheric subsidence provided by ERA-
                                                                       Interim, over JJA 2008, for smoke situations with high and
                                                                       low absorption and loading. Because of the covariance be-
Figure 5. Mean cloud-top altitude, aerosol base altitude and aerosol   tween aerosol and water vapour, in our study smoke loading
top altitude retrieved with CALIOP operational product, as a func-     means aerosol and water vapour loading.
tion of longitude, between 6 and 13◦ E for June–August 2008. Ver-
                                                                          Figure 8a shows that the temperature profile is almost
tical bars represent the standard deviation.
                                                                       identical between high and low cases throughout the atmo-
                                                                       spheric column. In both cases, we notice a temperature in-
   Knowing these temporal variations in mean meteorolog-               version, called subsidence inversion, that occurs as result of
ical parameters, we chose to analyse the aerosol and cloud             adiabatic compression when high-pressure systems sink the
parameters and their correlation over the months of June to            upper air layers. A moderate to strong temperature inver-
August (JJA) 2008. Doing so, we mostly select one meteoro-             sion almost always caps stratocumulus clouds located un-
logical regime characterized by few differences at the cloud           der a high-pressure centre (such as the South Atlantic an-
altitudes in terms of wind, temperature, and humidity and a            ticyclone). When smoke layers heated by the solar radia-
moderate water vapour content at the aerosol layer.                    tion cover low-level stratocumulus clouds, the temperature
                                                                       inversion is strengthened (Kaufman et al., 2005). In our case,
3.3   Covariance between humidity and aerosol loading                  we can observe a small increase by 1 K at 850 hPa for high
                                                                       smoke loadings.
We analysed the mean values of the specific humidity from                 The average humidity profiles (Figs. 8b and 7c) show some
June to August 2008 over the sampling area, at different pres-         significant differences between the two cases. For the high
sure levels, as a function of the aerosol loading. Figure 7            cases the average relative humidity (RH) is almost saturated
shows the ERA-Interim qv values at six pressure levels as              at the cloud level and presents a strong peak at 700 hPa
a function of the POLDER AOT at 865 nm. At the surface                 (RH ≈ 40 %). The RH difference between high and low situ-
and at 950 hPa, the average qv is almost constant, varying             ations reaches a maximum between 800 and 600 hPa, where
slightly with the AOT from 10 to 12 g kg−1 and from 7.5                the smoke layer resides. Also, the specific humidity is higher
and 10 g kg−1 , respectively. Higher in altitude, at 500 and           (up to 2.5 g kg−1 ) everywhere throughout the air column for
400 hPa the mean values of qv are very small, regardless of            the smoke cases and we notice an increase in qv by 300 %
the aerosol loading. On the other hand, at the smoke plume             at 700 hPa compared with only 35.7 % at 925 hPa (pressure
level (i.e. between 850 and 700 hPa) we notice a strong in-            level mostly associated with the cloud level). Conversely,
crease in the qv with the AOT, from 2 to 7 g kg−1 and from 1           subsidence is stronger by about 1 Pa min−1 at 700 hPa when
to 5 g kg−1 , respectively. So, there is a covariance between          low loadings of aerosols are present above the clouds (mainly
humidity and aerosol loading at aerosol’s altitudes, which             during June–July). It confirms the description of Adebiyi et
confirm previous findings from Adebiyi et al. (2015).                  al. (2015) (see Fig. 15) that the large-scale subsidence de-
   An interpretation of the humidity reinforcement with                creases when aerosol loadings are higher, which would tend
larger biomass burning AOT could originate from combus-                to push the cloud to rise in altitude.
tion processes. Depending on the fire intensity and the meteo-            The meteorological database allows us to compute wind
rological conditions, smoke parcels can be saturated with wa-          speed roses and specific humidity roses, representative for
ter vapour and the latent heat resulting from the condensation         high- and low-aerosol situations. This will give information
of the water vapour can enhance the vertical development               on the circulation of air masses (e.g. wind direction) that
of convection due to additional buoyancy. It is possible that          cause the humidity and the aerosols close to the coast. Fig-
smoke and water vapour released during biomass combus-                 ure 9 presents the frequency distribution of these parameters
tion are both advected at higher altitudes, which contributes          over the sample area in the JJA 2008 period, for two pres-
to the humidity in the aerosol plumes. Through laboratory              sure levels: 925 hPa – mainly corresponding to the cloud-top
measurements and experimental studies scientists have at-              altitude (Fig. 9a) – and 700 hPa – where aerosols are found
tempted to confirm that water vapour from wildland or grass            (Fig. 9b). At 925 hPa we notice that both situations are char-
fires can significantly modify the dynamic of the lower tro-           acterized by south-easterly winds, with wind speeds of 6 to

Atmos. Chem. Phys., 19, 11613–11634, 2019                                             www.atmos-chem-phys.net/19/11613/2019/
L. T. Deaconu et al.: Satellite inference of water vapour 11623
Figure 6. Monthly mean meteorological parameters computed with ERA-Interim models at 12 h UTC, from June to October 2008, over
the sample area: (a) temperature (K); (b) relative humidity (%); (c) specific humidity (g kg−1 ); (d) wind direction relative to the north (◦ );
(e) wind amplitude (m s−1 ).
close to the surface is higher for the high cases. At 700 hPa
the wind direction and moisture are very different for the
two situations: easterlies are associated with larger AOTs and
larger humidity values, while the wind coming from the open
ocean is characterized by low values of AOT and humidity.
We consider these differences when we analyse the change in
cloud properties between the low- and high-smoke-loading
situations.
4 Results
4.1 Difference in cloud properties
We follow our strategy and analyse here the variation in
cloud parameters for different scenarios of smoke (aerosol
Figure 7. Mean specific humidity as a function of POLDER and water vapour) loadings, between June and August 2008.
AOT865 nm retrieved at different pressure levels, within the selected The variations in cloud parameters are analysed as a function
region over June–August 2008. The vertical bars represent the stan-
of longitude and as a function of meteorological parameters.
dard deviation for the specific humidity.
By choosing a particular time period and a spatial domain,
we showed in the previous section that we reduced the me-
teorological variability and thus its potential effect on cloud
9 ms−1 for more than 50 % of the cases and with specific hu- properties.
midity that is usually larger than 9 g kg−1 . Figure 9b shows Figure 10 presents different cloud properties as a function
that the meteorological parameters at 700 hPa are, however, of longitude for the two AOT conditions. We observe a west-
very different for the two conditions. It is obvious that the air wards evolution of some parameters with longitude, regard-
masses carrying high loads of smoke are predominantly com- less of the high or low situations. For example, POLDER
ing from the land (direction E–NE), while the air circulation COT, MODIS reff and LWP show an increase westward (pan-
responsible for low absorption AOT is originating from the els a, b and d) that might result from changes in cloud optical
open ocean (main direction W–NW). Even if it was expected, and microphysical properties, driven by changes in sea sur-
it can be considered an interesting result because it shows the face temperature (SST) and meteorological conditions away
consistency between the POLDER AOT retrievals and the from the coast (also consistent with the fact that the wind
ERA-Interim meteorological parameters. The wind speed is direction is mostly westwards).
generally 1–2 m s−1 higher in the case of larger-absorption Most of the parameters display a difference between the
AOT and the qv is 4 to 6 times larger for these cases. low and high situations, as there is a visible gap between the
To conclude, few meteorological differences are found be- values corresponding to the two situations, independently of
tween the high and low situations at lower altitudes and longitude. MODIS reff increases from E to W from 6.5 to
where the clouds reside: similar temperature inversion, simi- 11 µm when the aerosol loading is low. One can also observe
lar wind direction and specific humidity. However, humidity a weaker increase when the aerosol loading is high, from 8 to
www.atmos-chem-phys.net/19/11613/2019/ Atmos. Chem. Phys., 19, 11613–11634, 201911624 L. T. Deaconu et al.: Satellite inference of water vapour Figure 8. Mean values of (a) temperature profile and (b) relative humidity profile, (c) specific humidity profile and (d) atmospheric subsi- dence at noon, w (downwelling wind, Pa min−1 ), within the sample region, from June to August 2008 selected for two situations: POLDER absorption AOT865 nm smaller than 0.01 (red lines, mainly June–July 2008) and POLDER absorption AOT865 nm larger than 0.04 (blue lines, mainly August 2008). Figure 9. Wind speed rose (1–2) and specific humidity rose (3–4) at 925 hPa (a) and 700 hPa (b) for situations with absorption AOT larger than 0.04 (1–3) and with absorption AOT smaller than 0.01 (2–4). The radius shows the frequency of wind direction. The arrow represents the main wind direction. 10 µm (Fig. 10b). This difference may suggest that the cloud atically larger by approximately 20 g m−2 (Fig. 10d), from microphysics are different for the situations with and without E to W over the interest area. This increase is significant aerosols. Due to the bias in the CALIOP retrievals of aerosol here, as it represents between 33 % and 66 % larger LWP: base altitude, we cannot exclude the possibility of aerosol– +20 g m−2 is 66 % more LWP in the E and 33 % in the W. cloud contact cases that could lead to a reduction of reff for When analysing the LWP as a function of the SST and the the polluted cases. We also notice thicker clouds when the ab- surface wind speed (Fig. 10e and f), we notice that the differ- sorption AOT is larger than 0.04, as POLDER COT corrected ence between the low and high situations is almost indepen- from absorption increases by approximately 3 units along the dent of longitude. As in Fig. 10d, the results show a differ- longitude (Fig. 10a). As a result, the inferred LWP is system- ence in the liquid water path for the two scenarios regardless Atmos. Chem. Phys., 19, 11613–11634, 2019 www.atmos-chem-phys.net/19/11613/2019/
L. T. Deaconu et al.: Satellite inference of water vapour                                                                          11625

Figure 10. Mean values of POLDER COT (a), MODIS reff , (b) POLDER ZO2 (c) and liquid water path (LWP) (d) as a function of
longitude. Mean values of LWP as a function of meteorological parameters: surface wind speed (e) and sea surface temperature (SST) (f) are
also presented. The data are separated into situations with POLDER absorption AOT865 nm smaller than 0.01 (red lines) and with POLDER
absorption AOT865 nm larger than 0.04 (blue lines).

of the meteorological conditions, with LWP being systemat-             by 20 g m−2 and an around 200 m decrease in the cloud-top
ically larger for the high cases. LWP increases with surface           altitude retrieved with CALIOP.
wind speed away from the coast (Fig. 10e) but behaving very               The last parameter that we analysed is the variation in the
differently as a function of SST (Fig. 10f). For the low case,         specific humidity at 925 hPa as a function of longitude over
LWP clearly decreases with SST, while a tendency is much               the zone, corresponding to the results presented in Sect. 3.3
less clear in the high case.                                           and 3.4 (Fig. 11a). Not surprisingly after the previous results,
   Another cloud parameter we analysed is the POLDER                   the humidity is higher when large loads of absorbing aerosols
cloud altitude, ZO2 (Fig. 10c). In the case of low absorp-             are present above clouds. It is also rather constant on average
tion/burden ZO2 slightly increases with longitude, while in            along the longitude with values between 8.5 and 10 g kg−1 .
the high cases we observe slightly lower cloud altitudes that          Its variation is very different in the low case, with a westward
remain under 1 km. It is unlikely that the lower cloud alti-           increase from 5.5 to 9 g kg−1 . This difference is not directly
tudes are the result of stronger atmospheric subsidence. As            understandable as the wind direction and amplitude are not
Fig. 8d shows, the subsidence is lower (with 1 Pa min−1 ) for          very different between the two cases (see Fig. 9a).
polluted situations while cloud altitudes are also lower. The             Furthermore, we studied the covariance between the spe-
small altitude difference might be the result of enhanced con-         cific humidity and the LWP because of very obvious phys-
vection away from the coast in the low situation. The effect           ical links. Figure 11b shows the relationship between LWP
of an upper level of aerosol on the estimate of cloud altitude         computed for the high and low situations as a function of the
derived from oxygen pressure is questionable.                          specific humidity at 925 hPa. We notice that in both cases,
   The analysis of the cloud parameter variation over the              the average LWP increases linearly with qv up to 55 g m−2 at
zone shows a common feature of their variations – a west-              9 g kg−1 , where a shift occurs. In the low case a decrease in
ward increase in cloud parameters. Significant differences             LWP with larger humidity is observed, while in the high case
between the low- and high-aerosol situations, with a larger            the LWP increase is not perturbed. It is one additional argu-
LWP for the high case, remain for different meteorological             ment that shows the difference between the two smoke load-
conditions (wind, SST). These results do not contradict a              ing situations. One interpretation is that processes leading to
“cloud thickening” effect described by Wilcox (2010), who              some negative feedback could be significantly perturbed by
obtained from microwave measurements an increased LWP                  the presence of the smoke layers overlying the stratocumulus
                                                                       cloud layer. In Sect. 4.4 we will analyse this figure in more

www.atmos-chem-phys.net/19/11613/2019/                                                Atmos. Chem. Phys., 19, 11613–11634, 2019
You can also read