2015 2015 Themed Entertainment ...
←
→
Page content transcription
If your browser does not render page correctly, please read the page content below
2015   2015

Global
Attractions
Attendance
Report
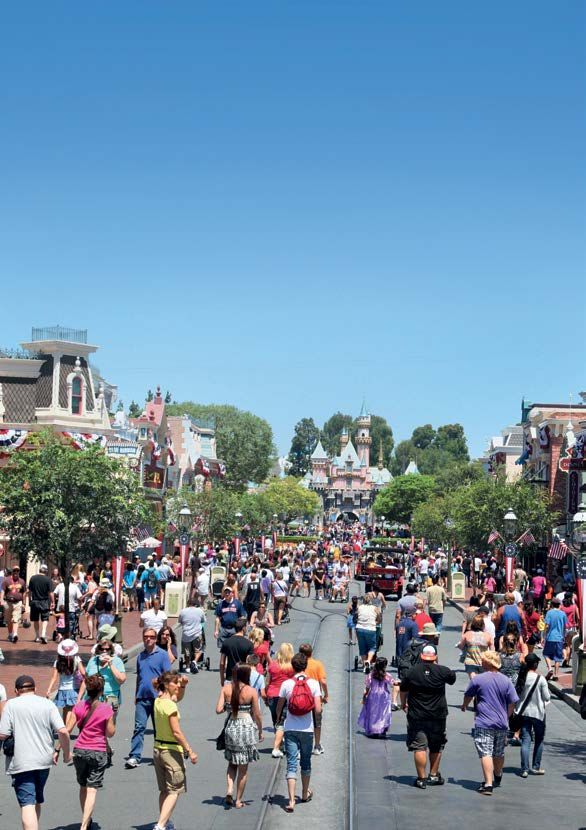
COVER: © Disneyland at Disneyland Resort®,
Anaheim, CA, U.S.

CREDITS
TEA/AECOM 2015 Theme Index and Museum Index: The Global Attractions Attendance Report
Publisher: Themed Entertainment Association (TEA)
Research: Economics practice at AECOM
Editor: Judith Rubin
Publication team: Tsz Yin (Gigi) Au, Beth Chang, Linda Cheu, Bethanie Finney, Kathleen LaClair,
Jodie Lock, Sarah Linford, Erik Miller, Jennie Nevin, Margreet Papamichael, Jeff Pincus,
John Robinett, Judith Rubin, Brian Sands, Will Selby, Matt Timmins, Feliz Ventura, Chris Yoshii
©2016 TEA/AECOM. All rights reserved.

CONTACTS
For further information about the contents of this report and about the Economics practice at
AECOM, contact the following:

John Robinett                                      Chris Yoshii
Senior Vice President, Americas                    Vice President, Asia-Pacific
john.robinett@aecom.com                            chris.yoshii@aecom.com
T +1 213 593 8785                                  T +852 3922 9000

Brian Sands, AICP                                  Margreet Papamichael
Vice President, Americas                           Director, EMEA
brian.sands@aecom.com                              margreet.papamichael@aecom.com
T +1 202 821 7281                                  T +44 20 3009 2283

Linda Cheu                                         aecom.com/economics
Vice President, Americas
linda.cheu@aecom.com
T +1 415 955 2928

For information about TEA (Themed Entertainment Association):

Judith Rubin                                       Jennie Nevin
TEA Publications, PR & Social Media                TEA Chief Operating Officer
judy@teaconnect.org                                jennie@teaconnect.org
T +1 314 853 5210                                  T +1 818 843 8497

teaconnect.org

2015                          2015

              The definitive annual attendance study
              for the themed entertainment and
              museum industries.
              Published by the Themed Entertainment
              Association (TEA) and the Economics
              practice at AECOM.

Global
Attractions
Attendance
Report
                                                       3
CONTENTS
THE BIG PICTURE 6 2015 THEME INDEX 22
The Americas 22
Asia-Pacific 42
Europe, Middle East and Africa (EMEA) 52
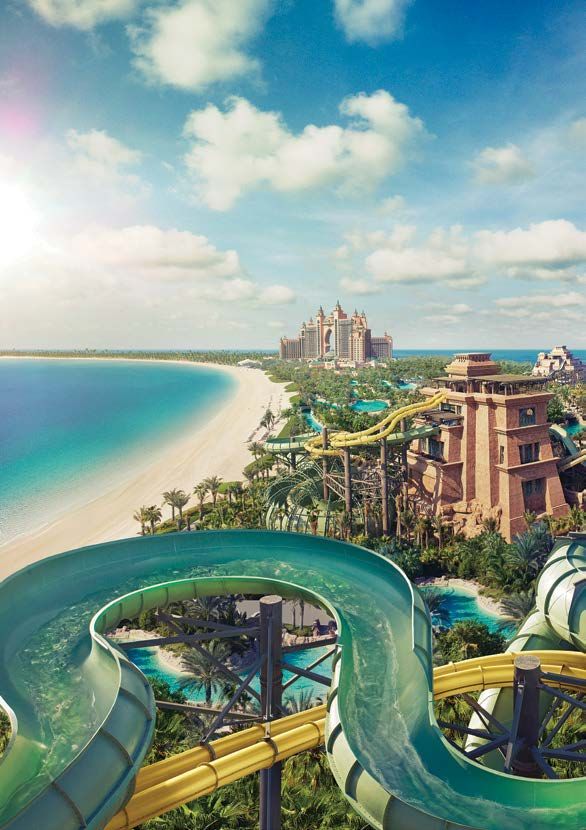
© Aquaventure Water Park,
Dubai, U.A.E.
4
2015 MUSEUM INDEX                       64   ABOUT THIS STUDY                        78
The Americas                            72   Methodology and evolution of the TEA/   78
Asia-Pacific                            74   AECOM Theme Index and Museum Index
Europe, Middle East and Africa (EMEA)   76   Frequently Asked Questions              78
                                             About TEA and AECOM                     82

                                                                                          5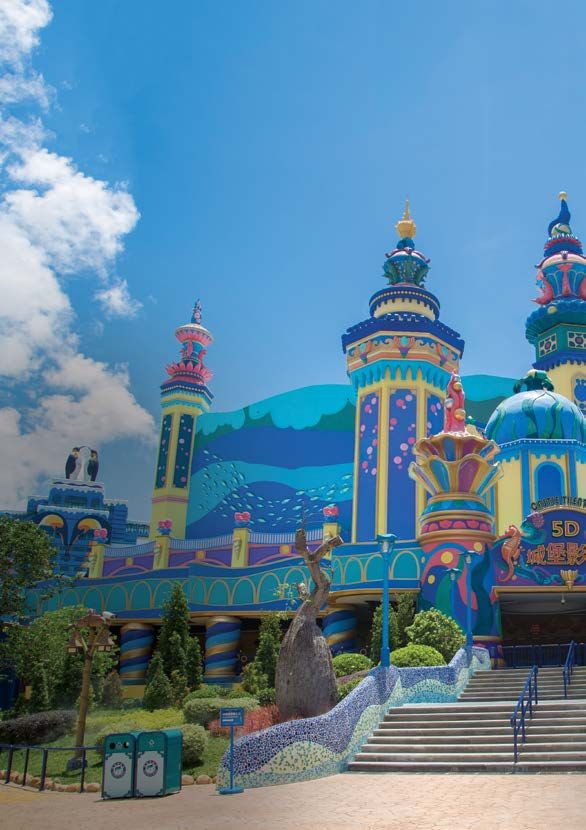
THE BIG
PICTURE

5.4%
Top 25 amusement/theme parks
attendance growth worldwide
2014–15

235.6m
Top 25 amusement/theme parks
worldwide attendance 2015

7.2%
Top 10 theme park groups
worldwide attendance
growth 2014–15

6
It is the 10 year anniversary of the TEA/
                                           AECOM Theme Index, and what a year it
                                           has been. The top attraction operators
                                           saw growth of over 7%, with the Top 25
                                           theme parks achieving over 5% growth
                                           — tremendous numbers for a relatively
                  John Robinett            mature industry. Over our 10 years of
                  Senior Vice President,   tracking the industry we have seen
                  Economics, Americas      steady improvements in business volume,
                                           despite a global recession, introduction of
                                           exciting new technologies, and continued
                                           internationalization of the attractions world.

                                           This year, global theme park attendance
                                           was driven largely by strong performance
                                           of the major Asian and U.S. operators,
                                           including Chimelong, SongCheng, Disney
                                           and Universal. Water parks saw healthy
                                           attendance improvements of almost 4% with
                                           most markets doing well. Finally, museums,
                                           while having a few standouts with double
                                           digit growth such as the Hermitage in Russia,
                                           and the Shanghai Science and Technology
                                           Museum, held steady overall.

                                           So what specific changes have occurred
                                           in the business over the last 10 years?
                                           Three areas stand out — Industry volume,
                                           distribution, and ownership.

© The Wizarding World of
Harry Potter™, Universal
Studios Japan®, Osaka, Japan

                                                                                            7
Same Parks versus Top 25 Parks                                                                        Top 25 parks
                                                                                                      Same parks

As you can see opposite, industry                 250M

volume as measured by theme park
attendance has grown steadily, both               200M

organically and through new park

                                         Attendance
                                                  150M
additions. Attendance at the top 25
parks grew from 187 M in 2006 to 236
                                                  100M
M in 2015, with a 2.6% annual growth
rate. At the 18 parks that were in the                50M
list continuously over this period,
attendance grew from 151 M in 2006,              0      0
                                                             2006 2007 2008 2009 2010 2011 2012 2013 2014 2015
to 192 M in 2015, equal to a 2.7%
growth rate.

Shares of Global Attendance by Region                                                                  2006
                                                                                                       2015
The geographic distribution
of attractions has moved
east across the globe with
Asia‑Pacific now capturing 42%                                                EMEA
                                                 North America
of the world’s major attractions,
up from 35% 10 years ago.                                                  2006    2015       Asia-Pacific
                                                                           13%     11%

                                                      2006    2015
                                                      52%     47%                             2006    2015
                                                                                              35%     42%

Major Parks' Share of Global Attendance

And with regard to ownership,
while the industry has certainly                      30%                         29%
                                                                                                       Disney
welcomed a number of high
quality new operators, market                               2006     57%             2015   55%        Universal
                                                                                                       Other Top
share has actually consolidated              13%                             17%                       25 parks
under the two majors, Disney
and Universal.

It has been a good decade overall, and we look
forward to what the next one will bring.

8                                                                                               © 2016 TEA / AECOM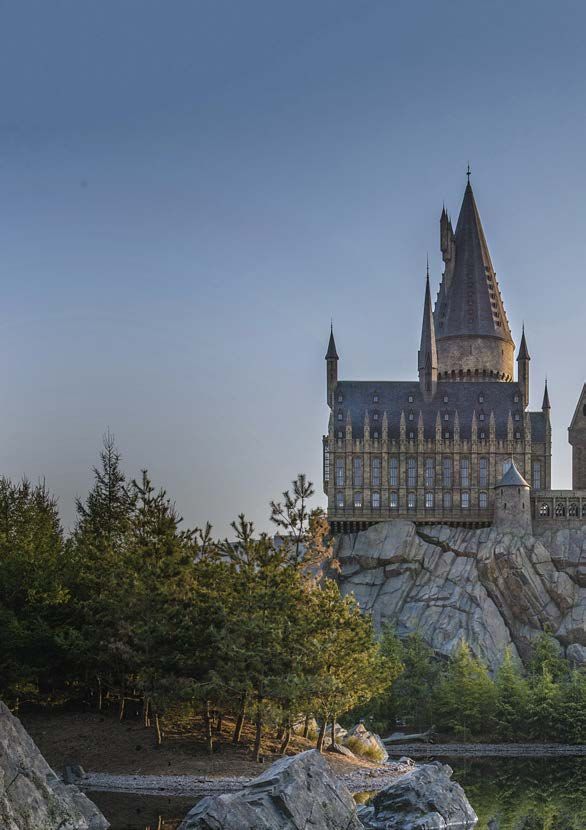
TOP 10
THEME PARK GROUPS
WORLDWIDE

                                                                           ATTENDANCE

                                                                                          ATTENDANCE
                                                             CHANGE
    GROUP
RANK

                                                                           2015

                                                                                          2014
                                                             %
1      WALT DISNEY ATTRACTIONS                                2.7% 137,902,000 134,330,000
2      MERLIN ENTERTAINMENTS GROUP                            0.2% 62,900,000 62,800,000
3      UNIVERSAL PARKS AND RESORTS                           11.8% 44,884,000 40,152,000
4      OCT PARKS CHINA                                        7.8% 30,180,000 27,990,000
5      SIX FLAGS INC.                                        11.4% 28,557,000 25,638,000
6      CEDAR FAIR ENTERTAINMENT COMPANY                       4.9% 24,448,000 23,305,000
7      CHIMELONG GROUP                                       26.4% 23,587,000 18,659,000
8      FANTAWILD (NEW)                                       77.4% 23,093,000 13,020,000
9      SEAWORLD PARKS & ENTERTAINMENT                         0.3% 22,471,000 22,399,000
10 SONGCHENG WORLDWIDE                                       53.4% 22,338,000 14,560,000
 TOP 10 TOTAL ATTENDANCE 2015                                      420,360,000 382,853,000
 TOP 10 TOTAL ATTENDANCE 2014                                7.2% 392,039,000

7.2%                             420.4m                       392.0m
Top 10 theme park groups         Top 10 theme park groups     Top 10 theme park groups
worldwide attendance             worldwide attendance 2015    worldwide attendance 2014
growth 2014–15

© 2016 TEA / AECOM                                                                             9
TOP 25
AMUSEMENT/THEME PARKS
WORLDWIDE
THE NETHERLANDS 24
1 PARK
FRANCE
1 PARK
9
22
12 1
21
10
18
GERMANY
1 PARK
1
2 8 6
7
11 5
3
4
FLORIDA, U.S.
CALIFORNIA, U.S. 7 PARKS
3 PARKS
Key Growth 2006–15
Circles represent size of attendance at 2010–11 3.8%
2011–12 5.2%
ranked parks in the geography indicated.
10m–15m
2012–13 4.3%
Up to 5m
Slices within circles represent proportion 2013–14 4.1%
5–10m
15m+
of attendance in the geography from the 2014–15 5.4%
ranked park indicated by number. Shading 2006–15 26.3%
indicates attendance at the ranked park
versus all other ranked parks. -10% 0% +10% +20% +30%
10 © 2016 TEA / AECOM16 14 SOUTH KOREA
23 DENMARK 2 PARKS
1 PARK
25
CHINA 13
3 PARKS
17
20
3
5
HONG KONG 19 15 4
2 PARKS
JAPAN
4 PARKS
5.4% 235.6m 223.5m
Top 25 amusement/theme parks Top 25 amusement/theme parks Top 25 amusement/theme parks
attendance growth worldwide worldwide attendance 2015 worldwide attendance 2014
2014–15
© 2016 TEA / AECOM 11TOP 25
AMUSEMENT/THEME PARKS
WORLDWIDE
ATTENDANCE
ATTENDANCE
CHANGE
Location
RANK
PARK
2015
2014
%
1 MAGIC KINGDOM at Walt Disney World, Lake Buena Vista, FL, U.S. 6.0% 20,492,000 19,332,000
2 DISNEYLAND, Anaheim, CA, U.S. 9.0% 18,278,000 16,769,000
3 TOKYO DISNEYLAND, Tokyo, Japan -4.0% 16,600,000 17,300,000
4 UNIVERSAL STUDIOS JAPAN, Osaka, Japan 17.8% 13,900,000 11,800,000
5 TOKYO DISNEY SEA, Tokyo, Japan -3.5% 13,600,000 14,100,000
6 EPCOT at Walt Disney World, Lake Buena Vista, FL, U.S. 3.0% 11,798,000 11,454,000
7 DISNEY'S ANIMAL KINGDOM 5.0% 10,922,000 10,402,000
at Walt Disney World, Lake Buena Vista, FL, U.S.
8 DISNEY'S HOLLYWOOD STUDIOS 5.0% 10,828,000 10,312,000
at Walt Disney World, Lake Buena Vista, FL, U.S.
9 DISNEYLAND PARK AT DISNEYLAND PARIS, 4.2% 10,360,000 9,940,000
Marne-la-Vallée, France
10 UNIVERSAL STUDIOS at Universal Orlando, FL, U.S. 16.0% 9,585,000 8,263,000
11 DISNEY'S CA ADVENTURE, Anaheim, CA, U.S. 7.0% 9,383,000 8,769,000
12 ISLANDS OF ADVENTURE at Universal Orlando, FL, U.S. 8.0% 8,792,000 8,141,000
13 CHIMELONG OCEAN KINGDOM, Hengqin, China 36.0% 7,486,000 5,504,000
26.3% 186.5m
Top 25 amusement/theme parks Top 25 amusement/theme parks
attendance growth worldwide worldwide attendance 2006
2006–15
12 © 2016 TEA / AECOMATTENDANCE
ATTENDANCE
CHANGE
Location
RANK
PARK
2015
2014
%
14 EVERLAND, Gyeonggi-Do, South Korea 0.6% 7,423,000 7,381,000
15 OCEAN PARK, Hong Kong SAR -5.2% 7,387,000 7,792,000
16 LOTTE WORLD, Seoul, South Korea -3.9% 7,310,000 7,606,000
17 HANGZHOU SONGCHENG PARK, Hangzhou, China 25.5% 7,289,000 5,810,000
18 UNIVERSAL STUDIOS HOLLYWOOD, Universal City, CA, U.S. 4.0% 7,097,000 6,824,000
19 HONG KONG DISNEYLAND, Hong Kong SAR -9.3% 6,800,000 7,500,000
20 NAGASHIMA SPA LAND, Kuwana, Japan 4.3% 5,870,000 5,630,000
21 EUROPA-PARK, Rust, Germany 10.0% 5,500,000 5,000,000
22 SEAWORLD FL, Orlando, FL, U.S. 2.0% 4,777,000 4,683,000
23 TIVOLI GARDENS, Copenhagen, Denmark 5.7% 4,733,000 4,478,000
24 DE EFTELING, Kaatsheuvel, The Netherlands 6.4% 4,680,000 4,400,000
25 SONGCHENG LIJIANG ROMANCE PARK, Lijiang, China 170.4% 4,678,000 1,730,000
TOP 25 TOTAL ATTENDANCE 2015 235,568,000 220,920,000
TOP 25 TOTAL ATTENDANCE 2014 5.4% 223,450,000
5.4% 235.6m 223.5m
Top 25 amusement/theme parks Top 25 amusement/theme parks Top 25 amusement/theme parks
attendance growth worldwide worldwide attendance 2015 worldwide attendance 2014
2014–15
© 2016 TEA / AECOM 13TOP 20
WATER PARKS
WORLDWIDE
GERMANY 12 15
2 PARKS
10
2
FLORIDA, U.S.
6 4 PARKS
3
TEXAS, U.S. 17
1 PARK
4 THE BAHAMAS
1 PARK
1
COLOMBIA 19
3
1 PARK
19
11
BRAZIL
3 PARKS
5
Key Growth 2010–15
Circles represent size of attendance at 2010–11 8.2%
2011–12 5.4%
ranked parks in the geography indicated.
2012–13 7.1%
Up to 1m
Slices within circles represent proportion
1m–2m
2013–14 2.8%
of attendance in the geography from the 2014–15 3.7%
2m+
ranked park indicated by number. Shading 2010–15 29%
indicates attendance at the ranked park
versus all other ranked parks. -10% 0% +10% +20% +30%
14 © 2016 TEA / AECOM18 CZECH REPUBLIC
1 PARK
14
CHINA 7 8
2 PARKS
9 U.A.E. SOUTH KOREA
1 2 PARKS
1 PARK
MALAYSIA 16
1 PARK
INDONESIA 19
1 PARK
AUSTRALIA 13
1 PARK
3.7% 28.7m 27.6m
Top 20 water parks attendance Top 20 water parks worldwide Top 20 water parks worldwide
growth worldwide 2014–15 attendance 2015 attendance 2014
© 2016 TEA / AECOM 15TOP 20
WATER PARKS
WORLDWIDE
ATTENDANCE
ATTENDANCE
CHANGE
Location
RANK
PARK
2015
2014
%
1 CHIMELONG WATER PARK, Guangzhou, China 4.1% 2,352,000 2,259,000
2 TYPHOON LAGOON AT DISNEY WORLD, Orlando, FL, U.S. 5.0% 2,294,000 2,185,000
3 BLIZZARD BEACH AT DISNEY WORLD, Orlando, FL, U.S. 5.0% 2,107,000 2,007,000
4 BAHAMAS AQUAVENTURE WATER PARK, Paradise Island 1.0% 1,868,000 1,850,000
(Nassau, New Providence), Bahamas
5 THERMAS DOS LARANJAIS, Olimpia, Brazil -9.2% 1,761,000 1,939,000
6 AQUATICA, Orlando, FL, U.S. 2.0% 1,600,000 1,569,000
7 OCEAN WORLD, Gangwon-Do, South Korea -5.9% 1,509,000 1,604,000
8 CARIBBEAN BAY, Gyeonggi-Do, South Korea -4.0% 1,434,000 1,493,000
9 AQUAVENTURE WATER PARK, Dubai, U.A.E. 0.0% 1,400,000 1,400,000
10 WET 'N WILD, Orlando, FL, U.S. 2.0% 1,310,000 1,284,000
16 © 2016 TEA / AECOMATTENDANCE
ATTENDANCE
CHANGE
Location
RANK
PARK
2015
2014
%
11 HOT PARK RIO QUENTE, Caldas Novas, Brazil 0.0% 1,288,000 1,288,000
12 THERME ERDING, Erding, Germany 23.5% 1,235,000 1,000,000
13 WET 'N' WILD GOLD COAST, Gold Coast, Australia 0.0% 1,200,000 1,200,000
14 SHENYANG ROYAL OCEAN PARK WATER WORLD, -1.9% 1,150,000 1,172,000
Fushun, China
15 TROPICAL ISLANDS, Krausnick, Germany 10.0% 1,100,000 1,000,000
16 SUNWAY LAGOON, Kuala Lumpur, Malaysia -2.1% 1,077,000 1,100,000
17 SCHLITTERBAHN, New Braunfels, TX, U.S. 0.0% 1,037,000 1,037,000
18 AQUAPALACE, Prague, Czech Republic 18.0% 997,000 845,000
19 ATLANTIS WATER ADVENTURE, Jakarta, Indonesia 1.0% 970,000 960,000
BEACH PARK, Aquiraz, Brazil 2.2% 970,000 949,000
PISCILAGO, Girardo (Bogotá), Colombia -4.7% 970,000 1,018,000
TOP 20 TOTAL ATTENDANCE 2015 28,659,000 28,141,000
TOP 20 TOTAL ATTENDANCE 2014 3.7% 27,627,000
3.7% 28.7m 27.6m
Top 20 water parks attendance Top 20 water parks worldwide Top 20 water parks worldwide
growth worldwide 2014–15 attendance 2015 attendance 2014
© 2016 TEA / AECOM 17TOP 20
MUSEUMS
WORLDWIDE 18
20 5
LONDON, U.K.
6 MUSEUMS
13 9
11
NEW YORK, NY, U.S.
2 MUSEUMS 12 6
PARIS, FRANCE 17
1
2 MUSEUMS
15
3
WASHINGTON, DC, U.S.
4 MUSEUMS 14 1
3
3
Key Growth 2012–15
Circles represent size of attendance at 2012–13 7.2%
Up to 2.5m
ranked parks in the geography indicated.
5m–7.5m
2.5m–5m
Slices within circles represent proportion 2013–14 1.6%
7.5m+
of attendance in the geography from the
ranked park indicated by number. Shading -0.7% 2014–15
indicates attendance at the ranked park
versus all other ranked parks. -5% 0% +5% +10% +15%
18 © 2016 TEA / AECOM16
ST PETERSBURG, RUSSIA
1 MUSEUM
VATICAN CITY
7
1 MUSEUM
19
2
BEIJING, CHINA
2 MUSEUMS
SHANGHAI, CHINA 8
1 MUSEUM
10 TAIPEI, TAIWAN
1 MUSEUM
-0.7% 106.5m 107.3m
Top 20 museums attendance Top 20 museums worldwide Top 20 museums worldwide
growth worldwide 2014–15 attendance 2015 attendance 2014
© 2016 TEA / AECOM 19TOP 20
MUSEUMS
WORLDWIDE
ATTENDANCE
ATTENDANCE
FREE/PAID
MUSEUM
CHANGE
Location
RANK
2015
2014
%
1 LOUVRE, Paris, France -6.5% 8,700,000 9,300,000 Paid
2 NATIONAL MUSEUM OF CHINA, Beijing, China -4.5% 7,290,000 7,630,000 Free
3 NATIONAL MUSEUM OF NATURAL HISTORY, -5.5% 6,900,000 7,300,000 Free
Washington, DC, U.S.
NATIONAL AIR AND SPACE MUSEUM , 3.0% 6,900,000 6,700,000 Free
Washington, DC, U.S.
5 BRITISH MUSEUM, London, U.K. 1.9% 6,821,000 6,695,000 Free
6 THE METROPOLITAN MUSEUM OF ART, 1.6% 6,300,000 6,200,000 Paid
New York, NY, U.S.
7 VATICAN MUSEUMS, Vatican, Vatican City -2.8% 6,002,000 6,177,000 Paid
8 SHANGHAI SCIENCE & TECHNOLOGY MUSEUM, 40.9% 5,948,000 4,220,000 Paid
Shanghai, China
9 NATIONAL GALLERY, London, U.K. -7.9% 5,908,000 6,417,000 Free
10 NATIONAL PALACE MUSEUM (TAIWAN), Taipei, Taiwan -2.1% 5,288,000 5,402,000 Paid
20 © 2016 TEA / AECOMATTENDANCE
ATTENDANCE
FREE/PAID
MUSEUM
CHANGE
Location
RANK
2015
2014
%
11 NATURAL HISTORY MUSEUM, London, U.K. -1.9% 5,284,000 5,388,000 Free
12 AMERICAN MUSEUM OF NATURAL HISTORY, 0.0% 5,000,000 5,000,000 Paid
New York, NY, U.S.
13 TATE MODERN, London, U.K. -18.5% 4,713,000 5,785,000 Free
14 NATIONAL GALLERY OF ART, Washington, DC, U.S. 5.4% 4,104,000 3,892,000 Free
15 NATIONAL MUSEUM OF AMERICAN HISTORY, 2.5% 4,100,000 4,000,000 Free
Washington, DC, U.S.
16 STATE HERMITAGE, St Petersburg, Russia 12.9% 3,668,000 3,248,000 Paid
17 MUSÉE D'ORSAY, Paris, France -1.2% 3,440,000 3,481,000 Paid
18 VICTORIA & ALBERT MUSEUM, London, U.K. 7.9% 3,432,000 3,180,000 Free
19 CHINA SCIENCE TECHNOLOGY MUSEUM, 4.4% 3,360,000 3,218,000 Paid
Beijing, China
20 SCIENCE MUSEUM (SOUTH KENSINGTON), 0.0% 3,356,000 3,356,000 Free
London, U.K.
TOP 20 TOTAL ATTENDANCE 2015 106,514,000 106,589,000
TOP 20 TOTAL ATTENDANCE 2014 -0.7% 107,300,000
-0.7% 106.5m 107.3m
Top 20 museums attendance Top 20 museums worldwide Top 20 museums worldwide
growth worldwide 2014–15 attendance 2015 attendance 2014
© 2016 TEA / AECOM 21THE AMERICAS 5.9% Top 20 amusement/theme parks attendance growth North America 2014–15 146.3m Top 20 amusement/theme parks North America attendance 2015 1.0% Top 10 amusement/theme parks attendance growth Latin America 2014–15 22
Remarkable growth
                                     in theme parks and
                                     water parks
                   Brian Sands       North American theme parks — up 5.9%
                   Vice President,
                   Economics, The    Last year we said everything was looking
                   Americas          good in the Americas and poised for
                                     moderate growth — but 2015 blew the roof
                                     off moderate. This market did really well.

                                     In theme parks, not only did the two top
                                     operators, Disney and Universal, both excel,
                                     the North American market as a whole did
                                     well, too. How well? Over the last couple
                                     years, the aggregate increase of the 20 top
                                     performing theme parks in North America
                                     was between 2% and 3.5% — good, steady,
                                     moderate growth. But it positively leapt
                                     beyond that in 2015 to an impressive 5.9%
                                     — almost three times the number for 2014.
                                     Disney was up 6% in attendance and alone
                                     accounted for nearly 40% of the growth
                                     by the top six operators in the U.S. (Disney,
                                     Universal, Sea World, Six Flags, Cedar Fair,
                                     and Merlin) — that’s massive. Universal was
                                     up by a little over 9%, accounting for 18%
                                     of the top operators’ attendance growth.
                                     But some of the regional chains also turned
                                     in impressive numbers. Six Flags was up a
                                     remarkable 11% and accounted for 22% of
                                     the top operators’ growth. Cedar Fair was
                                     also up 4.9%, and Merlin was up 15%, albeit
                                     from a relatively low base in North America.
© Bootleggers Run,
Splish Splash Water Park,
Calverton, NY, U.S.

                                                                                23
From the perspective of a decade, the Orlando. Next year we’ll see what the IP
10‑year growth in this market is 22% — has done for Universal Hollywood, as well
from about 120 M visits in pre-recession as how Universal begins to leverage its
2006, to more than 146 M in post-recession acquisition of DreamWorks.
2015, and including the low point of 2009.
With Disney, it’s a combination of
North America’s 5.9% stands up well even continuing to do many things well and the
in the face of fast growing Asia, where the anticipation factor of Star Wars. We expect
top performing parks were up 6.9% in 2015. to see Disney realize many opportunities
to satisfy guests over the next few years
IP and the immersion factor as Star Wars attractions, Star Wars lands
and Star Wars character interactions unfold
What were some primary factors? — and even before that happens, they’re
Intellectual property (IP) was a big one. making the most of the anticipation with
Universal’s numbers continue to be driven walk-throughs, stage shows, Jedi training
primarily by Harry Potter at Universal camp and, naturally, retail — plenty of retail.
Magic Kingdom, © Walt Disney World®,
Lake Buena Vista, FL, U.S.
24Flight of the Hippogriff™, © Universal Studios,
Universal Orlando, FL, U.S.
Visitation to Orlando has reportedly more than
doubled over the past 20 years, growing from
32.4 M in 1995 to 66.1 M in 2015.
Themed and branded experiences high-tech rides such as Justice League,
are becoming ever more immersive, which features DC Comics characters;
comprehensive, complete, and intimate with exciting new roller coasters and other
from the guest’s experience, starting online, improvements, plus discounts to encourage
extending to their approach to the park, the purchase of annual passes. Cedar Fair had
park itself obviously, and then again after similar success via such new attractions as
the park via online communications. All of Iron Reef at Knott’s Berry Farm.
this translates to a better guest experience,
longer stays, more repeat visits and more Catering to destination tourism as well as
per cap spending. regional markets pays off. Orlando’s tourism
numbers were strong — they didn’t fall off
Good rides and smart business even though Latin America was hurting
economically and more Latin Americans
Good rides and good marketing continue stayed home in 2015. In fact, visitation
to prove their worth at all parks. The healthy to Orlando has reportedly more than
attendance increase posted by Six Flags doubled over the past 20 years, growing
parks owes a lot to both; keeping regional from 32.4 M in 1995 to 66.1 M in 2015,
markets and local fan base happy with new, solidifying Orlando's position as the most
25visited destination in the nation, thanks addressing the challenges. Integrated
undoubtedly to the large and continued resorts are on the drawing board for
investments made in its theme parks, SeaWorld’s future.
resorts, and related amenities.
The resort model
Beyond attendance, the parks are simply
doing smarter business, leaving less money The integrated resort reinforces the
on the table through variable pricing, immersion factor by encouraging guests
better retail offerings that make shopping to remain in the operator’s territory,
and dining an extension of the branded within the experience bubble. Extend the
experience, and through embracing the stay, keep the revenue, serve up a more
integrated resort model of operation — unified experience to the guest — that’s a
reinforcing immersion. So even when win‑win‑win that transforms a theme park or
attendance is flat, per caps revenue can a water park into a multi-day destination, and
be strong. has a ripple economic effect in the region.
At SeaWorld parks, 2015 attendance Disney has long been a major resort
numbers were basically flat, up 0.3% total, operator with tremendous revenue, an
driven by mixed performance across their unbeatable lifestyle brand and an expanding
portfolio. Since taking the helm about a year portfolio of leisure offerings. Looking
ago, CEO Joel Manby, who has a strong regionally and sub-regionally, some of the
track record from his years at the head of smaller operators have also practiced this
Herschend Family Entertainment, has put for a while to good effect. Examples include
together a strong team and begun visibly Herschend’s offerings in the Pigeon Forge,
The New Revolution Virtual Reality Coaster, ©
Six Flags Magic Mountain, Valencia, CA, U.S.
26© Cedar Point, Sandusky, OH, U.S.
TN area around Dollywood, as well as what from those park guests not staying at the
Merlin Entertainments has been doing to lodging, and you can achieve the holy grail
leverage the popular LEGO IP, having added of success. We’re seeing Universal move
both a LEGOLAND park and a hotel near into that space in a big way: in Orlando
Orlando, a second hotel at LEGOLAND having opened Cabana Bay, and opening
Carlsbad and looking at additional hospitality Sapphire Falls this year and Volcano Bay
elements. Merlin is also considering new next year — getting in on the water park
lodging types for its Orlando park. side. Tourists coming in for a week or more
are looking for a range of experiences.
The challenge is keeping the balance of
elements — lodging, retail, dining and Helping to diversify the offering for tourists
entertainment. Oversize the lodging in Orlando and to grow its presence in
product and the whole project suffers. the market, Merlin opened The Orlando
On the other hand, create a compelling Eye observation experience, a SEA LIFE
multi-day experience, single or multi- Aquarium, and a Madame Tussauds,
gated, with well‑designed retail, dining and thereby anchoring the new I Drive 360
entertainment, and lodging that allows retail‑dining‑entertainment (RDE) center
access to the park as well as separation on International Drive.
6.0% 16.0% 8.0%
Magic Kingdom at Walt Universal Studios at Cedar Point, Sandusky,
Disney World, attendance Universal Orlando, attendance growth 2014–15
growth 2014–15 attendance growth 2014–15
27North American water parks — up 4.3% (around 100,000 each), benefiting from
overall growth of the Orlando market. Also
Overall, water park attendance numbers in showing strong growth were Splish Splash,
North America were also up significantly up 22% and Camelbeach, up 31%. More
in 2015 for the Top 20 facilities — than 100k visits were tallied for Camelbeach
at 4.3%, nearly tripling the growth rate which benefited from the opening of the
in 2014 numbers — a remarkably strong Camelback Lodge and Aquatopia Indoor
showing after the past two years’ flat to Water Park as the resort continues its
negative numbers. development as a serious, year round
destination. Splish Splash benefited
Looking back at attendance over a 10‑year primarily from a very hot and dry summer
period for this market shows growth from in that part of the world as well as some
slightly under 12 M to nearly 14 M, an minor renovations.
increase of 17% for the decade. (Last year
we began tabulating for the Top 20 but that’s Our charts for 2015 show a new entrant:
taken into account here.) Although that’s Wet’n’Wild splash town near Houston, a
not quite as much as the 22% growth over park recently acquired and improved by
the equivalent period in North America’s top CNL Properties. The benefits of CNL’s
theme parks, it’s very good. multi-million-dollar reinvestment brought
attendance numbers up to about a half
Driving 2015 growth for North American million in 2015, spelling new competition in
water parks were several with particularly a region dominated by Schlitterbahn.
healthy increases, including Typhoon
Lagoon and Blizzard Beach, both up 5% Latin America
Though growth was modest at the Latin
American theme parks in 2015, adding 1.0%
to reach 14.7 M, the top theme parks in Latin
America grew 33% over the last 10 years,
which denotes strong growth, though from
a relatively modest base. In Latin America’s
theme park and water park scene, we see
encouraging growth and innovation in
several respects, as well as areas that show
room for future improvement. The region’s
economic and political volatility are apparent
in the varying performance of the parks.
For Latin America’s water parks, 2015 was
a disappointing year for the most part, with
© Camelbeach, Tannersville, PA, U.S. some exceptions. At 9.5 M attendance
for the top water parks, performance was
28basically flat. (We just started tracking these
in 2013, so don’t have a figure for 10‑year
growth yet.)
A struggling economy and currency
decline relative to the dollar reduced
tourism from Latin America to Orlando, and
increased local visitation. This helped boost
attendance by 10.0% at Brazil’s Beto Carrero
(with 2014 attendance restated, resulting
in a modest increase), a multifaceted park
that also benefited from having added some
new kids’ adventure areas, and good social
media exposure.
A major attendance drop at Fantasilandia
in Chile was due to the economy, which © Bahamas Aquaventure Water Park,
is certainly creating headwinds for many Paradise Island, Nassau, New Providence, Bahamas
park operators in the region. Despite
having added new features, Thermas dos
Laranjais, Brazil, declined by more than
9%, due to a combination of the economy Though it doesn’t have parks in the top
and an accident. Piscilago in Columbia lists, the properties of Grupo Xcaret in
posted an attendance decline of about 5%. the Cancun area are understood to have
Attendance at Bahamas Aquaventure has experienced good attendance growth,
been restated for 2014, placing it at the top benefiting from the general growth of
of Latin American water parks. tourism from North America to Mexico.
Many larger properties in Latin America
Despite the weak overall regional and Mexico, especially those with water
performance, a number of water parks parks, do well as part of integrated resorts.
performed very well. Parque Acuatico But Xcaret focuses more on developing
Xocomilin Guatemala credited a new area new attractions and experiences of
opened the previous year in the adjoining high quality along with sub-brands and
theme park (El Gran Parque de Diversiones products, successfully capturing a large
Xetulul) for bringing in 22.6% more visitors. share of the eco-tourism and specialty
Parque Aquatic El Rollo in Mexico helped attractions market with a range of activities
push attendance 8.5% with a new FlowRider and adventures, natural beauty, history
and a giant inflatable slide. Beach Park and culture. It’s a smart, authentic, well-
also grew modestly (2.2%), likely helped located and clustered attractions product
by the economy pushing Brazilians to line that is right-sized and positioned to
vacation in‑country rather than in Orlando, serve the regional market, and one that is
for example. growing over time.
29PERFORMANCE OF TOP OPERATORS IN NORTH AMERICA This year we are including this special section reviewing the topline performance of the major operators in the North American market. As shown in the graphs below, despite the maturity of the market, it was generally a good year for the operators and in some cases it was remarkable. © Disneyland at Disneyland Resort®, Anaheim, CA, U.S. 30
The power of per caps                           was driven by such factors as the 60th
                                                anniversary of Disneyland, the continued
In total, estimated revenue at the top          success of its major films with ties-in to
operators grew from $16.6 B in 2014 to          its park, and associated investments.
$18.3 B in 2015, an increase of $1.7 B or       Taken together, we estimate that revenue
10.4%. Growth of attendance was not quite       at Disney’s parks grew to over $126 per
as strong, but still very healthy, increasing   visitor, an increase of 3.7%.
from 186.8 M in 2014 to 199.5 M in 2015,
an increase of 12.6 M or 6.8%. Combining        Universal’s Theme Parks segment also
these figures results in an increase in         performed very well, with estimated net
average revenue per attendee (or per            revenue (excluding estimated revenues
capita) grew from $88.80 to $91.79, an          associated with its hotels and Universal
increase of $2.99 or 3.4%. While this may       Japan) reaching nearly $3.1 B, up by
appear relatively modest, by comparison         $522 M or 20.5%. Similarly, estimated
U.S. gross domestic product (GDP) grew          attendance growth was strong at
by only 2.4% and the S&P 500 declined           9.3%, increasing attendance to 26.8 M,
marginally (-0.7%).                             continuing to be primarily driven by its
                                                ongoing Harry Potter-related investments.
Performance at the operator level varied        The combined effect was estimated growth
considerably. Disney reports on a fiscal        in revenue per attendee to Universal parks
year basis and with the Parks and Resorts       of 10.3%, pushing it over $114 per visitor.
segment combined, with our estimate that
the Parks sub-segment (i.e., excluding          Cedar Fair had revenue growth of 7.5%,
Resorts) had revenue of nearly $10.9 B in       which when combined with its attendance
2015, an increase of $983 M or 9.9% over        growth of 4.9%, meant that revenue per
the estimate of almost $9.9 B in 2014.          attendee increased modestly by 1.6% to
Disney remains far and away the largest         reach well over $50 per visitor. Six Flags
operator, and singlehandedly accounted          and Merlin also both grew revenues,
for 57% of the total revenue growth in 2015.    but this was exceeded by attendance
                                                growth, which pushed down revenue per
Attendance at Disney’s domestic parks           attendee for both. SeaWorld slightly grew
was estimated up a remarkable 6.0               attendance, but also experienced a modest
percent last year, reaching 86.1 M visitors,    decline in revenue, which resulted in a small
and accounting for 39% percent of the           decline in revenue per visitor.
total increase at the top operators. This

                                                                                             31
These figures underscore a number of Note that where possible, the information
important industry axioms. First, it all starts in this special section was taken from
and ends with the guest experience, which public filings and other corporate
is driven by “the story” and its realization at releases, with estimates made by AECOM
the park, both of which require significant where information was unavailable or
initial investment and regular reinvestment. insufficiently detailed.
Second, the importance of attendance as
a metric is superseded by that of revenue,
and ultimately profitability. Finally, if done
right, it can be easier to get visitors to
spend more than it is to get new visitors.
Summary Indicators, Top Operators in Revenue grew
North America, 2014 and 2015
$12,000 25%
REVENUE PER
ATTENDANCE
$10,000
20%
REVENUE
20.5%
CAPITA
Domestic parks revenue ($ millions)
$8,000
15%
2014 $16.6B 186.8M $88.80 $6,000
12.7%
10%
2015 $18.3B 199.5M $91.79 9.9%
$4,000
7.5%
2015 Change $1.7B 12.6M $2.99 6.6% 5%
$2,000
% Change 2014–15 10.4% 6.8% 3.4%
0%
$0
-0.5%
2014 -$2,000 -5%
2015
Disney
Universal
Sea World
Six Flags
Cedar Fair
Merlin
% change
estimated
32© Cedar Point, Sandusky, OH, U.S.
Attendance grew Revenue per attendee was mixed
$140 12%
100 16%
90 15.0% $120 10%
14%
10.3%
Domestic parks revenue per attendee
80
Domestic parks attendance (millions)
$100 8%
12%
70
11.0% $80 6%
10%
60
9.3%
8% $60 4%
50
3.7%
40 2%
6% $40
6.0%
30 1.6%
4.9% 4% $20 0%
20
-0.8%
2% $0 -2%
10
-2.0%
0 0% -$20 -3.2% -4%
0.3%
Disney
Universal
Sea World
Six Flags
Cedar Fair
Merlin
Disney
Universal
Sea World
Six Flags
Cedar Fair
Merlin
33TOP 20
AMUSEMENT/THEME PARKS
NORTH AMERICA
ONTARIO, CANADA
1 PARK 13 NEW JERSEY, U.S.
3.6m 19 1 PARK
3.1m
OHIO, U.S.
2 PARKS 16 15 PENNSYLVANIA, U.S.
6.8m 17 1 PARK
3.3m
VIRGINIA, U.S.
20 1 PARK
2.8m
FLORIDA, U.S.
8 PARKS 10 11 1
14 18
81.4m 8
12
2
9 6
7
3
5 4
CALIFORNIA, U.S.
6 PARKS
45.3m
Key Growth 2006–15
Circles represent size of attendance at 2010–11 2.9%
2011–12 3.6%
ranked parks in the geography indicated.
10m–15m
2012–13 2.7%
Up to 5m
Slices within circles represent proportion 2013–14 2.2%
5–10m
15m+
of attendance in the geography from the 2014–15 5.9%
ranked park indicated by number. Shading 2006–15 22.1%
indicates attendance at the ranked park
versus all other ranked parks. -10% 0% +10% +20% +30%
34 © 2016 TEA / AECOMATTENDANCE
ATTENDANCE
CHANGE
Location
RANK
PARK
2015
2014
%
1 MAGIC KINGDOM at Walt Disney World, Lake Buena Vista, FL 6.0% 20,492,000 19,332,000
2 DISNEYLAND, Anaheim, CA 9.0% 18,278,000 16,769,000
3 EPCOT at Walt Disney World, Lake Buena Vista, FL 3.0% 11,798,000 11,454,000
4 DISNEY'S ANIMAL KINGDOM 5.0% 10,922,000 10,402,000
at Walt Disney World, Lake Buena Vista, FL
5 DISNEY'S HOLLYWOOD STUDIOS 5.0% 10,828,000 10,312,000
at Walt Disney World, Lake Buena Vista, FL
6 UNIVERSAL STUDIOS at Universal Orlando, FL 16.0% 9,585,000 8,263,000
7 DISNEY'S CA ADVENTURE, Anaheim, CA 7.0% 9,383,000 8,769,000
8 ISLANDS OF ADVENTURE at Universal Orlando, FL 8.0% 8,792,000 8,141,000
9 UNIVERSAL STUDIOS HOLLYWOOD, Universal City, CA 4.0% 7,097,000 6,824,000
10 SEAWORLD FL, Orlando, FL 2.0% 4,777,000 4,683,000
11 BUSCH GARDENS TAMPA BAY, Tampa, FL 3.0% 4,252,000 4,128,000
12 KNOTT'S BERRY FARM, Buena Park, CA 5.0% 3,867,000 3,683,000
13 CANADA'S WONDERLAND, Maple, Ontario 2.0% 3,617,000 3,546,000
14 SEAWORLD CA, San Diego, CA -7.0% 3,528,000 3,794,000
15 CEDAR POINT, Sandusky, OH 8.0% 3,507,000 3,247,000
16 KINGS ISLAND, Kings Island, OH 3.0% 3,335,000 3,238,000
17 HERSHEY PARK, Hershey, PA 2.0% 3,276,000 3,212,000
18 SIX FLAGS MAGIC MOUNTAIN, Valencia, CA 9.0% 3,104,000 2,848,000
19 SIX FLAGS GREAT ADVENTURE, Jackson, NJ 9.0% 3,052,000 2,800,000
20 BUSCH GARDENS WILLIAMSBURG, Williamsburg, VA 3.0% 2,780,000 2,699,000
TOP 20 TOTAL ATTENDANCE 2015 146,270,000 138,144,000
TOP 20 TOTAL ATTENDANCE 2014 5.9% 138,144,000
5.9% 146.3m 138.1m
Top 20 amusement/theme Top 20 amusement/theme parks Top 20 amusement/theme parks
parks attendance growth North America attendance 2015 North America attendance 2014
North America 2014–15
© 2016 TEA / AECOM 35TOP 20
WATER PARKS
NORTH AMERICA
MIDWEST U.S. 16
15
1 PARK
12
NORTHEAST U.S.
0.4m 17 3 PARKS
WEST U.S. 11
6 1.4m
3 PARKS 19 18
14
1.4m 10 20 SOUTHEAST U.S.
4 PARKS
2.1m
TEXAS, U.S. 13
7
5
4 PARKS 9 4 1 FLORIDA, U.S.
2.6m 8
5 PARKS
3 2 8.0m
Key Growth 2010–15
Circles represent size of attendance at 2010–11 0.1%
2011–12 2.2%
ranked parks in the geography indicated.
2.3% 2012–13
Up to 1m
Slices within circles represent proportion
1m–2m
2013–14 1.6%
of attendance in the geography from the 2014–15 4.3%
2m+
ranked park indicated by number. Shading 2010–15 6.0%
indicates attendance at the ranked park
versus all other ranked parks. -5% 0% +5% +10% +15%
36 © 2016 TEA / AECOMATTENDANCE
ATTENDANCE
CHANGE
Location
RANK
PARK
2015
2014
%
1 TYPHOON LAGOON AT DISNEY WORLD, Orlando, FL 5.0% 2,294,000 2,185,000
2 BLIZZARD BEACH AT DISNEY WORLD, Orlando, FL 5.0% 2,107,000 2,007,000
3 AQUATICA, Orlando, FL 2.0% 1,600,000 1,569,000
4 WET 'N WILD, Orlando, FL 2.0% 1,310,000 1,284,000
5 SCHLITTERBAHN, New Braunfels, TX 0.0% 1,037,000 1,037,000
6 WATER COUNTRY USA, Williamsburg, VA 0.0% 726,000 726,000
7 ADVENTURE ISLAND, Tampa, FL 3.0% 663,000 644,000
8 SCHLITTERBAHN, Galveston,TX 0.0% 551,000 551,000
9 SIX FLAGS-HURRICANE HARBOR, Arlington, TX 5.0% 549,000 523,000
10 SIX FLAGS-WHITE WATER, Marietta, GA 6.1% 541,000 510,000
11 HYLAND HILLS WATER WORLD, Denver, CO 0.0% 527,000 527,000
12 SPLISH-SPASH, Calverton NY 21.9% 513,000 421,000
13 WET'N'WILD SPLASHTOWN, Houston, TX 0.8% 501,000 497,000
14 WET N' WILD, Phoenix, AZ 3.0% 481,000 467,000
15 SIX FLAGS HURRICANE HARBOR, Jackson, NJ 4.0% 440,000 423,000
16 CAMELBEACH, Tannersville, PA 30.8% 437,000 334,000
17 ZOOMEZI BAY, Powell, OH 1.7% 423,000 416,000
18 DOLLYWOOD'S SPLASH COUNTRY, Pigeon Forge, TN 2.0% 416,000 408,000
19 RAGING WATERS, San Dimas, CA -6.1% 403,000 429,000
20 WET N' WILD EMERALD POINT, Greensboro, NC 1.0% 402,000 398,000
TOP 20 TOTAL ATTENDANCE 2015 15,921,000 15,356,000
TOP 20 TOTAL ATTENDANCE 2014 4.3% 15,268,000
4.3% 15.9m 15.3m
Top 20 water parks attendance Top 20 water parks North Top 20 water parks North
growth North America 2014–15 America attendance 2015 America attendance 2014
© 2016 TEA / AECOM 37TOP 10
AMUSEMENT/THEME PARKS
LATIN AMERICA AND CARIBBEAN
MEXICO
4 PARKS
7
6.5m
6
4 1
8
GUATEMALA
1 PARK
1.2m
5
COLOMBIA
1 PARK
1.4m
BRAZIL
3 2 PARKS
3.7m
2
CHILE
1 PARK 9
10
1.0m ARGENTINA
1 PARK
1m
Key Growth 2010–15
Circles represent size of attendance at 2010–11 0.7%
2011–12 2.6%
ranked parks in the geography indicated.
10m–15m
2012–13 3.8%
Up to 5m
Slices within circles represent proportion 2013–14 6.0%
5–10m
15m+
of attendance in the geography from the 2014–15 1.0%
ranked park indicated by number. Shading 2010–15 10.5%
indicates attendance at the ranked park
versus all other ranked parks. -15% 0% +5% +10% +15%
38 © 2016 TEA / AECOMATTENDANCE
ATTENDANCE
CHANGE
Location
RANK
PARK
2015
2014
%
1 SIX FLAGS MEXICO, Mexico City, Mexico 0.0% 2,368,000 2,368,000
2 BETO CARRERO WORLD, Santa Catarina, Brazil 10.0% 2,000,000 1,818,000*
3 HOPI HARI, São Paulo, Brazil 0.0% 1,668,000 1,668,000
4 LA FERIA DE CHAPULTEPEC, Mexico City, Mexico 2.1% 1,584,000 1,552,000
5 PARQUE MUNDO AVENTURA, Bogotá, Colombia -2.4% 1,389,000 1,423,000
6 PARQUE XCARET, Cancun, Mexico 6.2% 1,287,000 1,212,000
7 PLAZA DE SESAMO, Monterrey, Mexico 0.0% 1,221,000 1,221,000
8 MUNDO PETAPA, Guatemala City, Guatemala 5.4% 1,199,000 1,138,000
9 FANTASIALANDIA, Santiago, Chile -9.7% 1,003,000 1,111,000
10 PARQUE DE LA COSTA, Tigre, Argentina -6.3% 956,000 1,020,000
TOP 10 TOTAL ATTENDANCE 2015 14,675,000 14,531,000*
TOP 10 TOTAL ATTENDANCE 2014 1.0% 14,531,000*
* Figure restated since 2014 Theme Index
1.0% 14.7m 14.5m*
Top 10 amusement/theme Top 10 amusement/theme parks Top 10 amusement/theme parks
parks attendance growth Latin America attendance 2015 Latin America attendance 2014
Latin America 2014–15
© 2016 TEA / AECOM 39TOP 10
WATER PARKS
LATIN AMERICA AND CARIBBEAN
THE BAHAMAS
1 1 PARK
1.9m
10
7
GUATEMALA
MEXICO 6 1 PARK
2 PARKS 0.9m
0.7m
COLOMBIA 4
1 PARK
1m
4
3 BRAZIL
5 PARKS
4.9m
2
9
8
Key Growth 2013–15
Circles represent size of attendance at 2013–14 4.5%
ranked parks in the geography indicated.
Up to 1m
Slices within circles represent proportion
1m–2m
of attendance in the geography from the
2m+
2014–15 0.3%
ranked park indicated by number. Shading
indicates attendance at the ranked park
versus all other ranked parks. -5% 0% +5% +10% +15%
40 © 2016 TEA / AECOMATTENDANCE
ATTENDANCE
CHANGE
Location
RANK
PARK
2015
2014
%
1 BAHAMAS AQUAVENTURE WATER PARK, 1.0% 1,868,000 1,850,000*
Paradise Island (Nassau, New Providence), Bahamas
2 THERMAS DOS LARANJAIS, Olimpia, Brazil -9.2% 1,761,000 1,939,000
3 HOT PARK RIO QUENTE, Caldas Novas, Brazil 0.0% 1,288,000 1,288,000
4 PISCILAGO, Girardo (Bogotá), Colombia -4.7% 970,000 1,018,000
BEACH PARK, Aquiraz, Brazil 2.2% 970,000 949,000
6 PARQUE ACUATICO XOCOMIL, 22.6% 940,000 767,000
San Martín Zapotitlán, Retalhuleu, Guatemala
7 PARQUE ACUATICO EL ROLLO, Morelos, Mexico 8.5% 510,000 470,000*
8 WET 'N WILD SAO PAULO, São Paulo, Brazil 0.0% 496,000 496,000
9 RIO WATER PLANET, Rio de Janeiro, Brazil 0.0% 400,000 400,000
10 WET 'N WILD, Cancun, Mexico 1.6% 259,000 255,000
TOP 10 TOTAL ATTENDANCE 2015 9,462,000 9,432,000*
TOP 10 TOTAL ATTENDANCE 2014 0.3% 9,432,000*
* Figure restated since 2014 Theme Index
0.3% 9.5m 9.4m*
Top 10 water parks attendance Top 10 water parks Latin Top 10 water parks Latin
growth Latin America 2014–15 America attendance 2015 America attendance 2014
© 2016 TEA / AECOM 41ASIA-PACIFIC 6.9% Top 20 amusement/theme parks attendance growth Asia-Pacific 2014–15 130.9m Top 20 amusement/theme parks Asia-Pacific attendance 2015 19.6m Top 20 water parks Asia-Pacific attendance 2015 42
Theme parks:
                                           6.9% attendance
                                           increase is Mainland
                                           China driven
                                           The impact of Chimelong
                                           and Songcheng
                 Chris Yoshii              At 6.9%, attendance at the top theme parks
                 Vice President,           in the Asia-Pacific region for 2015 reflects
                 Asia-Pacific              a year of strong growth. This number, which
                                           is good compared to previous years, was
                 Beth Chang                driven almost entirely by Mainland China,
                 Regional Director,        the primary factor being the many new
                 Economics, Asia‑Pacific   parks that have recently completed their
                                           first full year of operation.

                                           These included Chimelong Ocean
                                           Kingdom, which with 7.5 M attendance
                                           posted a 36% increase over 2014 and
                                           moved up to the #4 position on the chart.
                                           On the resort side, Ocean Kingdom added
                                           a second and third hotel, bringing its room
                                           total to more than 4,000. On the park side,
                                           a new 5D theater was added. These were
                                           backed by quite a bit of online marketing
                                           and promotion.

                                           Songcheng Group is another major entrant,
                                           posting a 53% increase in total attendance
                                           for 2015. Due to the success of several
                                           new parks, Songcheng made a big splash
                                           on our charts — both the top 10 worldwide
Chimelong 5D Castle
Theater, © Chimelong Ocean
                                           theme park operators and the top 20
Kingdom, Hengqin, China                    theme parks within Asia.

                                                                                     43
The Songcheng parks’ main feature is live, and leisure-based industry. Developers are
theatrical shows with a cultural theme. supporting that service industry; projects
These shows are quite popular with are getting approved and financed, and the
tourists and the parks are well located — amount of themed entertainment product
in Hangzhou, Lijiang and Sanya — to make keeps growing.
the most of tour group business, especially
within the mainland. The combination Outside China, highs and lows
of high-traffic locations, live shows and
culture and a relatively small footprint is a Results were more mixed for theme parks
winner for Songcheng. in other Asian countries than China, for
2015. With attendance of 13.9 M, Universal
There’s been a fair amount of press about Studios Japan had a very good year, in
softness in China’s economy, but that fact beating their previous record year
reflects a shift from manufacturing to with a near 18% increase and lifting it to
service. If you look at services, tourism the position of #2 park in Asia (beating out
and education, these things are booming. Tokyo Disney Sea). This can be credited to
Entertainment spending is going up very its first full year of operation with the Harry
fast; spending on education is increasing. Potter attractions.
This all spells good news for our tourism
The Wizarding World of Harry Potter™,
© Universal Japan, Tokyo, Japan
44Universal Studios Japan had a very good year,
in fact beating their previous record year with
a near 18% increase.
In Korea, Everland was stable while Lotte Water parks: Chimelong on top again
World showed a decrease that can be
interpreted as a fallback after a slate of Overall, water park visitation in 2015 in the
new attractions brought an attendance Asia-Pacific region was slack, about 1%
surge in 2014. total for the top attended parks.
In Hong Kong, Ocean Park and Disney both Weather was the culprit in Korea, which had
declined in visitation, attributable to fewer a very wet summer. But even though Korea
tourists from Mainland China, although had a down year, the status and outlook of
the residential market remained strong. the water park scene in Asia are positive.
There had been protests in Hong Kong China saw many new entries into the market
concerning tourism, which has grown — a huge construction boom in fact, that
significantly there in recent years. The will influence the numbers in the future.
protests prompted many Chinese to avoid
Hong Kong and travel to other places such Chimelong Water park added attendance
as Japan and Thailand. and maintained its status as the #1 water
park in the world, even in the face of
Universal Studios Singapore saw a very Disney’s very good year back in the U.S.,
good increase of 9% for 2015, quite strong. with Typhoon Lagoon and Blizzard Beach.
And it’s worth noting that in Southeast Asia’s water park sector outgrew North
Asia, many parks are doing well, although America’s a couple of years ago and that
their numbers are not always big enough to position will be maintained. Part of the credit
earn a place on our top-attended lists. All in goes to Southeast Asia, where the weather
all, 2015 was a pretty good year for theme supports year-round operation.
parks in Asia.
17.8% 36% 170.4%
Universal Studios Japan Chimelong Ocean Kingdom, Songcheng Lijiang
attendance growth 2014–15 China, attendance growth Romance Park, China,
2014–15 attendance growth 2014–15
45OCT Happy Valley, Shenzhen, China
Water parks are harder to track than theme shake up our charts each year with parks
parks in Asia. They are being built at a faster and operators climbing up and dropping off.
pace — there might be as many as five As attendance increases at the top parks,
water parks being built for every new theme it also raises the minimum attendance a
park. Water parks also tend to be smaller park needs to achieve in order to stay on
and locally based. the charts.
A volatile, growing market Next year’s charts will reflect the first
half-year of attendance at Shanghai
Volatility will continue to be a hallmark of Disney, opening this season. Once it has
the Asia-Pacific market, as it is still growing been open a full year, we will have a better
rapidly and may not stabilize for perhaps sense of when the Asian parks market
another decade. The sector is still a long will overtake North America altogether —
way from saturation and maturity. This will whether it will be around 2020 as we’ve
Volatility will continue to be a hallmark of the Asia-
Pacific market, as it is still growing rapidly and may
not stabilize for perhaps another decade.
46Disney Shanghai will be a watershed event.
It is expected to do very well and have a
positive effect on the region.
previously estimated, or sooner. As things We can see it already happening in the
continue to evolve and mature in Asia, we’ll movie industry. Cinema box office revenue
see shifting ownership and consolidation in China will pass North American at some
of smaller parks into larger chains as part of point fairly soon, and studios have already
the process. been moving to a more international
product, or at least a product with
Global context Asian elements.
Disney Shanghai will be a watershed event. In Southeast Asia, a growing number of
It is expected to do very well and have a large, diversified media companies that
positive effect on the region. The Asian are active in TV, broadcasting, gaming
market really likes the Disney product. and mobile technology are exploring
Behind that, Universal Beijing is under how to move into theme parks and family
construction, and other international entertainment centers.
brand IPs are looking around very actively
in China. Operators, local governments And even though they don’t show up in
and the IP companies all show definite this report, developers in Asia have a lot of
interest in building branded attractions in interest in indoor entertainment — smaller
a meaningful way, in the largest consumer size facilities of 30,000–50,000 square
market in the world. feet, usually within retail centers. Oriented
to children, teens and families visiting
That said, the Chinese government is for 2–3 hours at a stretch, these facilities
cautious about having too much Western represent opportunities for themed
content, and it will be interesting to see entertainment professionals. Shopping
how Eastern projects blend local media, malls look to them for differentiation as
local culture and heritage with Western Asia is moving very quickly to a saturated
concepts and Western brands — and retail environment. Sometimes there’s a
how much of that might translate back to cluster of attractions similar to the Merlin
attractions in the West. There’s certainly Entertainments business model.
room for something of everything in the
market, including traditional culture-based
attractions and Chinese media-based
experiences as well as foreign.
47TOP 20
AMUSEMENT/THEME PARKS
ASIA-PACIFIC
SOUTH KOREA
2 PARKS
14.7m
JAPAN
4 PARKS
CHINA 7 5
50m
11 PARKS
48m
10
19 20 4 1
18
3
17 8
16 2
15 11
14 13
HONG KONG
9 6
2 PARKS
14.2m
12
SINGAPORE
1 PARK
4.2m
Key Growth 2010–15
Circles represent size of attendance at 2010–11 7.5%
2011–12 5.8%
ranked parks in the geography indicated.
10m–15m
2012–13 7.5%
Up to 5m
Slices within circles represent proportion
5–10m
2013–14 4.9%
15m+
of attendance in the geography from the 2014–15 6.9%
ranked park indicated by number. Shading 2010–15 26.7%
indicates attendance at the ranked park
versus all other ranked parks. -10% 0% +10% +20% +30%
48 © 2016 TEA / AECOMATTENDANCE
ATTENDANCE
CHANGE
Location
RANK
PARK
2015
2014
%
1 TOKYO DISNEYLAND, Tokyo, Japan -4.0% 16,600,000 17,300,000
2 UNIVERSAL STUDIOS JAPAN, Osaka, Japan 17.8% 13,900,000 11,800,000
3 TOKYO DISNEY SEA, Tokyo, Japan -3.5% 13,600,000 14,100,000
4 CHIMELONG OCEAN KINGDOM, Hengqin, China 36.0% 7,486,000 5,504,000
5 EVERLAND, Gyeonggi-Do, South Korea 0.6% 7,423,000 7,381,000
6 OCEAN PARK, Hong Kong SAR -5.2% 7,387,000 7,792,000
7 LOTTE WORLD, Seoul, South Korea -3.9% 7,310,000 7,606,000
8 HANGZHOU SONGCHENG PARK, Hangzhou, China 25.5% 7,289,000 5,810,000
9 HONG KONG DISNEYLAND, Hong Kong SAR -9.3% 6,800,000 7,500,000
10 NAGASHIMA SPA LAND, Kuwana, Japan 4.3% 5,870,000 5,630,000
11 SONGCHENG LIJIANG ROMANCE PARK, Lijiang, China 170.4% 4,678,000 1,730,000
12 UNIVERSAL STUDIOS SINGAPORE, Singapore 9.4% 4,200,000 3,840,000
13 CHANGZHOU DINOSAUR PARK, Changzhou, China 6.8% 3,950,000 3,700,000
14 OCT EAST, Shenzhen, China 4.2% 3,940,000 3,780,000
15 OCT HAPPY VALLEY, Beijing, China 12.0% 3,740,000 3,340,000
16 CHIMELONG PARADISE, Guangzhou, China 8.0% 3,619,000 3,351,000
17 OCT WINDOW OF THE WORLD, Shenzhen, China -4.4% 3,440,000 3,600,000
18 SONGCHENG SANYA ROMANCE PARK, Sanya, China 72.1% 3,322,000 1,930,000
19 OCT HAPPY VALLEY, Shenzhen, China -1.5% 3,250,000 3,300,000
20 JIUZHAI SONGCHENG RESORT, Jiuzhaigou, China 67.0% 3,140,000 1,880,000
TOP 20 TOTAL ATTENDANCE 2015 130,944,000 120,874,000
TOP 20 TOTAL ATTENDANCE 2014 6.9% 122,527,000
6.9% 130.9m 122.5m
Top 20 amusement/theme parks Top 20 amusement/theme parks Top 20 amusement/theme parks
attendance growth Asia‑Pacific Asia-Pacific attendance 2015 Asia-Pacific attendance 2014
2014–15
© 2016 TEA / AECOM 49TOP 20
WATER PARKS
ASIA-PACIFIC
12
2 SOUTH KOREA
9 4 PARKS
3
4.6m
18
CHINA 17 1
JAPAN
6 PARKS 15 8 1 PARK
6.3m 14 5 0.9m
INDIA 13
16
1 PARK 6
0.8m 10
MALAYSIA
SINGAPORE 20
3 PARKS
1 PARK 2.6m
0.7m
INDONESIA 11 7
2 PARKS
1.8m
19 4 AUSTRALIA
2 PARKS
1.9m
Key
Circles represent size of attendance at
ranked parks in the geography indicated.
Up to 1m
Slices within circles represent proportion
1m–2m
of attendance in the geography from the
2m+
ranked park indicated by number. Shading
indicates attendance at the ranked park
versus all other ranked parks.
50 © 2016 TEA / AECOMATTENDANCE
ATTENDANCE
CHANGE
Location
RANK
PARK
2015
2014
%
1 CHIMELONG WATER PARK, Guangzhou, China 4.1% 2,352,000 2,259,000
2 OCEAN WORLD, Gangwon-Do, South Korea -5.9% 1,509,000 1,604,000
3 CARIBBEAN BAY, Gyeonggi-Do, South Korea -4.0% 1,434,000 1,493,000
4 WET 'N' WILD GOLD COAST, Gold Coast, Australia 0.0% 1,200,000 1,200,000
5 SHENYANG ROYAL OCEAN PARK — WATER WORLD, -1.9% 1,150,000 1,172,000
Fushun, China
6 SUNWAY LAGOON, Kuala Lumpur, Malaysia -2.1% 1,077,000 1,100,000
7 ATLANTIS WATER ADVENTURE, Jakarta, Indonesia 1.0% 970,000 960,000
8 SUMMERLAND, Tokyo, Japan 3.5% 915,000 884,000
9 WOONGJIN PLAYDOCI WATERDOCI, -5.0% 898,000 945,000
Gyeonggi-Do, South Korea
10 SUNWAY LOST WORLD OF TAMBUN, Perak, Malaysia 22.7% 859,000 700,000
11 OCEAN PARK WATER ADVENTURE, Jakarta, Indonesia 3.5% 804,000 777,000
12 LOTTE WATER PARK, Seoul, South Korea (new) NA 772,000 NA
13 WATER KINGDOM, Mumbai, India 0.0% 750,000 750,000
14 PLAYAMAYA WATER PARK, Wuhan, China 35.2% 730,000 540,000
15 WUHU FANTAWILD WATER PARK, Wuhu, China 129.1% 708,000 309,000
16 LEGOLAND WATER PARK, Johor, Malaysia 11.1% 700,000 630,000
17 ZHENGZHOU FANTAWILD WATER PARK, Zhengzhou, China 215.5% 694,000 220,000
18 CHANGDE HAPPY WATER WORLD, Changde, China (new) NA 690,000 NA
19 WET 'N' WILD SYDNEY, Sydney, Australia -4.9% 675,000 710,000
20 ADVENTURE COVE WATER PARK, Singapore 7.5% 660,000 614,000
TOP 20 TOTAL ATTENDANCE 2015 19,547,000 16,867,000
TOP 20 TOTAL ATTENDANCE 2014 1.0% 19,362,000
1.0% 19.5m 19.4m
Top 20 water parks attendance Top 20 water parks Asia-Pacific Top 20 water parks Asia-Pacific
growth Asia‑Pacific 2014–15 attendance 2015 attendance 2014
© 2016 TEA / AECOM 51EMEA 2.8% Top 20 amusement/theme parks attendance growth EMEA 2014–15 61.2m Top 20 amusement/theme parks EMEA attendance 2015 9.0m Top 10 water parks EMEA attendance 2015 52
EMEA’s ups
                                          and downs
                                          Northern Europe outperforms
                                          Southern Europe
                   Margreet Papamichael
                   Director, EMEA         Overall the theme park and water park
                                          attendance numbers for 2015 in the EMEA
                                          region (Europe, Middle East and Africa)
                                          show quite a bit of growth, but a somewhat
                                          bumpy ride. In Europe particularly, some of
                                          the top parks did tremendously well while
                                          others just doodled by.

                                          Euro Disney’s numbers have been back
                                          on the upswing for two reasons: France as
                                          a whole is doing better economically, and
                                          Disney has made significant investments
                                          including new attractions themed on top
                                          IPs Star Wars and Frozen, as well as general
                                          improvements in the park.

                                          Europa-Park in Rust, Germany, is
                                          consistently in the top 5 for attendance,
                                          as it was for 2015. This family-owned park
                                          does really well, going from strength to
                                          strength. In marking its 40th anniversary
                                          in 2015 Europa-Park brought in a 10%
                                          increase, which is huge. The park recently
                                          increased its accommodation offerings and
                                          benefited from that as well. Over the course
                                          of the last 10 years, this park has grown with
                                          a compound annual growth rate of around
                                          3.4%, which shows great consistency.

© Aquanura, Efteling,
The Netherlands

                                                                                     53
Similarly, de Efteling in the Netherlands, Other increases can mostly be credited to
another family-owned park, has shown the market picking up and doing well, with
consistent growth through the cycles with Southern Europe slightly behind Northern
a very similar compound annual growth Europe, a pattern we noted in 2014 as well.
rate of around 3.9%. The park has recently
announced both new attractions and
additional accommodation, which may
well see it increase its growth rate.
10-year review, EMEA’s top parks
ATTENDANCE
ATTENDANCE
ATTENDANCE
% CHANGE
2005–2015
Location
PARK
2015
2010
2005
DISNEYLAND PARK AT DISNEYLAND PARIS, 0.2% 10,360,000 10,500,000 10,200,000
Marne-la-Vallée, France
EUROPA-PARK, Rust, Germany 3.4% 5,500,000 4,250,000 3,950,000
TIVOLI GARDENS, Copenhagen, Denmark 1.2% 4,733,000 3,696,000 4,188,000
DE EFTELING, Kaatsheuvel, The Netherlands 3.9% 4,680,000 4,000,000 3,200,000
WALT DISNEY STUDIOS PARK AT 7.8% 4,440,000 4,500,000 2,100,000
DISNEYLAND PARIS, Marne-la-Vallée, France
PORT AVENTURA, Salou, Spain 0.7% 3,600,000 3,050,000 3,366,000
LISEBERG, Gothenburg, Sweden -0.2% 3,100,000 2,900,000 3,150,000
GARDALAND, Castelnuovo del Garda, Italy -0.8% 2,850,000 2,800,000 3,100,000
LEGOLAND WINDSOR, Windsor, U.K. 4.9% 2,250,000 1,900,000 1,400,000
ALTON TOWERS, Staffordshire, U.K. -1.3% 1,925,000 2,750,000 2,200,000
LEGOLAND BILLUND, Billund, Denmark 3.2% 2,050,000 1,650,000 1,490,000
PUY DU FOU, Les Epesses, France 8.7% 2,050,000 1,350,000 890,000
THORPE PARK, Chertsey, England 2.8% 1,850,000 1,850,000 1,400,000
PHANTASIALAND, Brϋhl, Germany -0.5% 1,900,000 1,850,000 2,000,000
PARC ASTERIX, Plailly, France 0.3% 1,850,000 1,663,000 1,800,000
FUTUROSCOPE, Jaunay-Clan, France 2.5% 1,800,000 1,825,000 1,400,000
PARQUE WARNER, Madrid, Spain 5.1% 1,641,000 1,193,000 1,000,000
CHESSINGTON WORLD OF ADVENTURES, 4.5% 1,640,000 1,200,000 1,054,000
Chessington, U.K.
HEIDE PARK, Soltau, Germany 2.3% 1,525,000 1,350,000 1,220,000
GRONALUND, Stockholm, Sweden 3.9% 1,461,087 1,305,612 1,000,000
TOTAL 2.0% 61,205,087 55,582,612 50,108,000
54You can also read