GLOBAL ATTRACTIONS
ATTENDANCE REPORT
←
→
Page content transcription
If your browser does not render page correctly, please read the page content below
GLOBAL ATTRACTIONS ATTENDANCE REPORT

Cover: Crazy, Thermas Dos
Laranjais, Olímpia, Brazil
© Thermas Dos Laranjais

CREDITS
TEA/AECOM 2016 Theme Index and Museum Index: The Global Attractions Attendance Report                                      The definitive annual attendance
Publisher: Themed Entertainment Association (TEA)                                                                          study for the themed entertainment
Research: Economics practice at AECOM                                                                                      and museum industries.
Editor: Judith Rubin
Publication team: Tsz Yin (Gigi) Au, Beth Chang, Bryan Chen, Linda Cheu, Lucia Fischer, Marina                             Published by the Themed
Hoffman, Olga Kondaurova, Kathleen LaClair, Shaojin Li, Sarah Linford, George Marling, Erik Miller,                        Entertainment Association (TEA) and
Jennie Nevin, Margreet Papamichael, John Robinett, Judith Rubin, Brian Sands, William Selby,
Matt Timmins, Feliz Ventura, Chris Yoshii
                                                                                                                           the Economics practice at AECOM.
©2017 TEA/AECOM. All rights reserved.

CONTACTS                                                                                              GLOBAL ATTRACTIONS
For further information about the contents of this report and about the Economics practice at         ATTENDANCE REPORT
AECOM, contact the following:

John Robinett                                      Chris Yoshii
Senior Vice President, Americas                    Vice President, Asia-Pacific
john.robinett@aecom.com                            chris.yoshii@aecom.com
T +1 213 593 8785                                  T +852 3922 9000

Brian Sands, AICP                                  Margreet Papamichael
Vice President, Americas                           Director, EMIA
brian.sands@aecom.com                              margreet.papamichael@aecom.com
T +1 202 821 7281                                  T +44 20 3009 2283

Linda Cheu                                         aecom.com/economics
Vice President, Americas
linda.cheu@aecom.com
T +1 415 955 2928

For information about TEA (Themed Entertainment Association):

Judith Rubin                                       Jennie Nevin
TEA Publications, PR & Social Media                TEA Chief Operating Officer
judy@teaconnect.org                                jennie@teaconnect.org
T +1 314 853 5210                                  T +1 818 843 8497

TEAconnect.org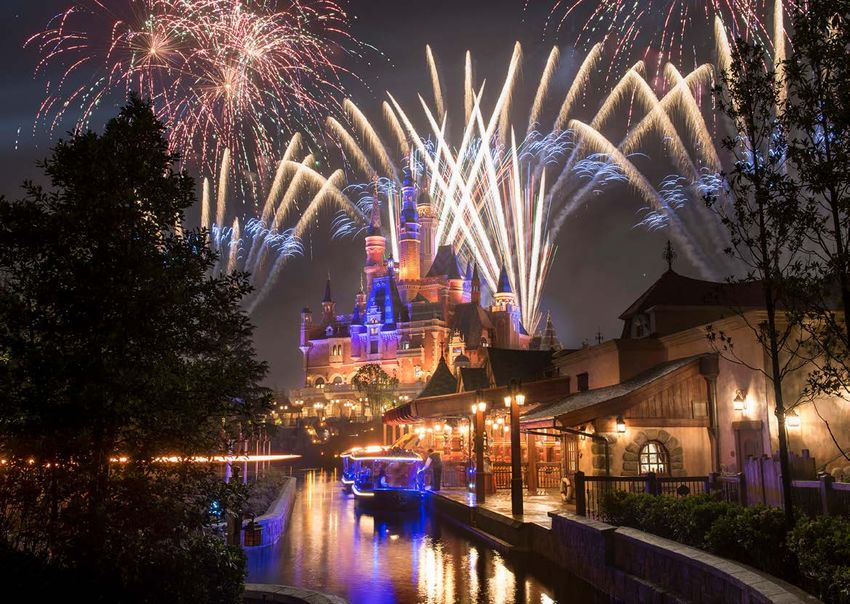
CONTENTS

    THE BIG PICTURE                                       6
    THE AMERICAS                                         22
    ASIA-PACIFIC                                         38
    EMEA                                                 48
    MUSEUMS                                              58
    ABOUT THE STUDY                                      74
    FREQUENTLY ASKED QUESTIONS                           75

    13.9%
    Universal Studios Hollywood,
    Universal City, California,
    attendance growth 2015–16
                                                                                 Credit: David Sprague/Universal Studios Hollywood.
    “Flight of the Hippogriff” — Hogwarts castle,              HARRY POTTER, characters, names and related indicia are trademarks
    with a view of Flight of the Hippogriff, Universal        of and © Warner Bros. Entertainment Inc. Harry Potter Publishing Rights
    Studios Hollywood’s first outdoor roller coaster                     © JKR. (s17) ©2017 Universal Studios. All Rights Reserved.

4                                                                                                                                       5
THE BIG
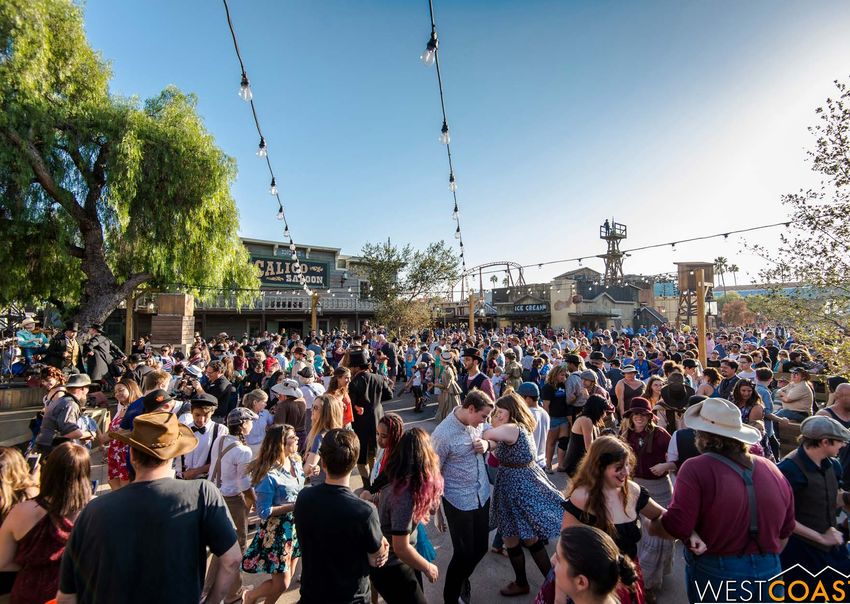
Hoe Down for Ghost Town Alive!
at Knott’s Berry Farm, Buena Park, CA, U.S.
© Albert Lam, Westcoaster
PICTURE
JOHN ROBINETT
Senior Vice President,
Economics, Americas
—
After a record breaking 2015,
2016 has given the industry
mixed results, with slow, steady
growth in many markets along
with some minor declines
-1.1% in others.
—
Top 25 amusement/
theme parks attendance
growth worldwide
2015–16
The major theme park operators continued
their positive performance, with a 4.3%
increase in overall business volume growing
233.1m from 420 million to 438 million annual
attendees over the year. The top 25 theme
Top 25 amusement/ parks showed a slight dip of about 1%, driven
theme parks worldwide
largely by anomalies in Asia (more on this and
attendance 2016
other factors in our regional write ups).
Looking at our major geographies, North
235.6m America and Latin America showed modest,
single-digit advances, while Europe and Asia
Top 25 amusement/
theme parks worldwide were down by similar amounts.
attendance 2015
6 © 2017 TEA / AECOM © 2017 TEA / AECOM 7
TOP 10
                                                                                                          THEME PARK GROUPS
    SLOW, STEADY GROWTH IN MANY MARKETS.                                                                  WORLDWIDE

                                                                                                          GROUP NAME

                                                                                                                                                                                                     ATTENDANCE

                                                                                                                                                                                                                  ATTENDANCE
                                                                                                                                                                                      % CHANGE
    Turning to water parks and museums, we can          While weather, tourism, and political issues

                                                                                                          RANK
    report positive results for both. Globally, water   have tapped the brakes on growth a bit this

                                                                                                                                                                                                     2016

                                                                                                                                                                                                                  2015
    parks continued their strong growth trend, with     year, we feel confident that the business,
    attendance increases of 3.6% at the top 20.         through some exciting new investments and         1 WALT DISNEY ATTRACTIONS                                                  1.8% 140,403,000 137,902,000
    Existing parks are doing well, and new parks        operational improvements, along with strong
    are being built. This reflects, to some degree,     leisure consumption globally, will continue its
                                                                                                          2 MERLIN ENTERTAINMENTS GROUP                                              1.2% 61,200,000 60,500,000*
    the lower barriers to entry of this particular      characteristically steady growth pattern over     3 UNIVERSAL PARKS AND RESORTS                                              5.5% 47,356,000 44,884,000
    attraction category. The top 20 museums hit         the long run.
    a new high this year of 108 million attendees,
                                                                                                          4 OCT PARKS CHINA                                                         11.9% 32,270,000 28,830,000*
    exceeding the previous record by over one                                                             5 FANTAWILD                                                               37.0% 31,639,000 23,093,000
    million guests.
                                                                                                          6 SIX FLAGS INC.                                                           5.4% 30,108,000 28,557,000
                                                                                                          7 CHIMELONG GROUP                                                         16.0% 27,362,000 23,587,000
                                                                                                          8 CEDAR FAIR ENTERTAINMENT COMPANY                                         2.7% 25,104,000 24,448,000
       37.0%                                                                                              9 SEAWORLD PARKS & ENTERTAINMENT                                          -2.1% 22,000,000 22,471,000
       Fantawild group,                                                                                   10 PARQUES REUNIDOS                                                       -6.0% 20,825,000 22,154,000
       attendance growth
       2015–16                                                                                              TOP 10 TOTAL ATTENDANCE 2016                                                         438,267,000 416,426,000
                                                                                                            TOP 10 ATTENDANCE GROWTH 2015–16                                         4.3% 438,267,000 420,360,000

                                                                                                          * Adjustment versus the figure we published in last year’s report

                                                                                                          4.3%                                     438.3M                      420.4M
                                                                                                          Top 10 theme park groups                 Top 10 theme park groups    Top 10 theme park groups
                                                                                                          attendance growth worldwide              worldwide attendance 2016   worldwide attendance 2015
      © Fantawild                                                                                         2015–16

8                                                                                                         © 2017 TEA / AECOM                                                                                                   9
TOP 25
     AMUSEMENT/THEME PARKS
     WORLDWIDE

                                                                                                     ATTENDANCE

                                                                                                                    ATTENDANCE

                                                                                                                                                                                                                                 ATTENDANCE

                                                                                                                                                                                                                                                ATTENDANCE
           Location

                                                                                                                                       Location
                                                                                        % CHANGE

                                                                                                                                                                                                                   % CHANGE
     RANK

                                                                                                                                 RANK
     PARK

                                                                                                                                 PARK
                                                                                                     2016

                                                                                                                    2015

                                                                                                                                                                                                                                 2016

                                                                                                                                                                                                                                                2015
     1 MAGIC KINGDOM AT WALT DISNEY WORLD, LAKE BUENA VISTA, FL, U.S.                 -0.5% 20,395,000 20,492,000                14 LOTTE WORLD, SEOUL, SOUTH KOREA                                              11.5%         8,150,000      7,310,000
     2 DISNEYLAND, ANAHEIM, CA, U.S.                                                  -1.8% 17,943,000 18,278,000                15 UNIVERSAL STUDIOS HOLLYWOOD, UNIVERSAL CITY, CA, U.S.                        13.9%         8,086,000      7,097,000
     3 TOKYO DISNEYLAND, TOKYO, JAPAN                                                 -0.4% 16,540,000 16,600,000                16 EVERLAND, GYEONGGI-DO, SOUTH KOREA                                           -3.0%         7,200,000      7,423,000
     4 UNIVERSAL STUDIOS JAPAN, OSAKA, JAPAN                                           4.3% 14,500,000 13,900,000                17 HONG KONG DISNEYLAND, HONG KONG SAR                                         -10.3%         6,100,000      6,800,000
     5 TOKYO DISNEY SEA, TOKYO, JAPAN                                                 -1.0% 13,460,000 13,600,000                18 OCEAN PARK, HONG KONG SAR                                                   -18.8%         5,996,000      7,387,000
     6 EPCOT AT WALT DISNEY WORLD, LAKE BUENA VISTA, FL, U.S.                         -0.7% 11,712,000 11,798,000                19 NAGASHIMA SPA LAND, KUWANA, JAPAN                                            -0.3%         5,850,000      5,870,000
     7 DISNEY'S ANIMAL KINGDOM AT WALT DISNEY WORLD, LAKE BUENA VISTA, FL, U.S.       -0.7% 10,844,000 10,922,000                20 EUROPA PARK, RUST, GERMANY                                                    1.8%         5,600,000      5,500,000
     8 DISNEY'S HOLLYWOOD STUDIOS AT WALT DISNEY WORLD, LAKE BUENA VISTA, FL, U.S.    -0.5% 10,776,000 10,828,000                21 SHANGHAI DISNEYLAND, SHANGHAI, CHINA                                              –        5,600,000 NEW ENTRY
     9 UNIVERSAL STUDIOS AT UNIVERSAL ORLANDO, FL, U.S.                                4.3%        9,998,000      9,585,000      22 WALT DISNEY STUDIOS PARK AT DISNEYLAND PARIS, MARNE LA VALLÉE, FRANCE        -1.6%         4,970,000 5,050,000*
     10 ISLANDS OF ADVENTURE AT UNIVERSAL ORLANDO, FL, U.S.                            6.5%        9,362,000      8,792,000      23 DE EFTELING, KAATSHEUVEL, THE NETHERLANDS                                     1.8%         4,764,000      4,680,000
     11 DISNEY'S CALIFORNIA ADVENTURE, ANAHEIM, CA, U.S.                              -0.9%        9,295,000      9,383,000      24 TIVOLI GARDENS, COPENHAGEN, DENMARK                                          -2.0%         4,640,000      4,733,000
     12 CHIMELONG OCEAN KINGDOM, HENGQIN, CHINA                                      13.2%         8,474,000      7,486,000      25 SEAWORLD FLORIDA, ORLANDO, FL, U.S.                                          -7.9%         4,402,000      4,777,000
     13 DISNEYLAND PARK AT DISNEYLAND PARIS, MARNE LA VALLÉE, FRANCE                 -14.2%        8,400,000      9,790,000*      TOP 25 TOTAL ATTENDANCE 2016                                                                233,057,000 228,081,000
                                                                                                                                  TOP 25 ATTENDANCE GROWTH 2015–16                                               -1.1% 233,057,000 235,568,000

     * Adjustment versus the figure we published in last year’s report

                                                                                                                                 -1.1%                                    233.1m                            235.6m
                                                                                                                                 Top 25 amusement/theme                   Top 25 amusement/                 Top 25 amusement/
                                                                                                                                 parks attendance growth                  theme parks worldwide             theme parks worldwide
                                                                                                                                 worldwide 2015–16                        attendance 2016                   attendance 2015

10                                                                                                        © 2017 TEA / AECOM     © 2017 TEA / AECOM                                                                                                          11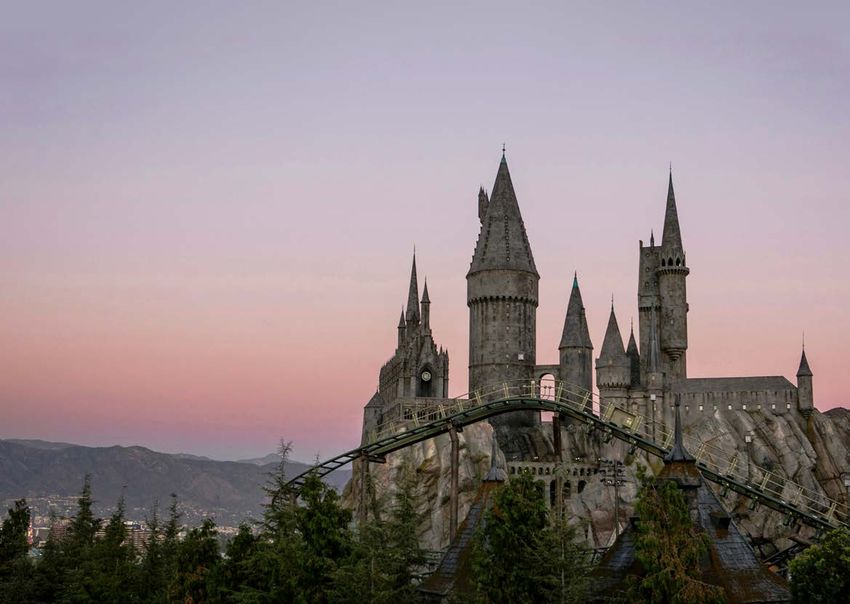
TOP 25
AMUSEMENT/THEME PARKS
WORLDWIDE
24
DENMARK
THE NETHERLANDS 23
1 PARK / ATTENDANCE 4.6M
1 PARK / ATTENDANCE 4.7M SOUTH KOREA 15 14
2 PARKS / ATTENDANCE 15.4M
GERMANY 20
FRANCE 22 13
20
1 PARKS / ATTENDANCE 5.6M 3
2 PARKS / ATTENDANCE 13.3M 5
15
CALIFORNIA, U.S. CHINA 20 12 4
2 10 25 1 2 PARKS / ATTENDANCE 14.1M
3 PARKS / ATTENDANCE 35.3M
11
9 FLORIDA, U.S. JAPAN
7 PARKS / ATTENDANCE 77.5M
4 PARKS / ATTENDANCE 50.4M
8 7 6 HONG KONG 18 19
2 PARKS / ATTENDANCE 12.1M
KEY GROWTH 2011–16
Circles represent size of attendance at 2011–12 5.2%
10m–15m
ranked parks at the geography indicated.
-1.1% 233.1m 235.6m
5m–10m
Upto 5m
Slices within circles represent proportion 2012–13 4.3%
15m+
of attendance at the geography from the 2013–14 4.1%
ranked park indicated by number. Shading
2014–15 5.4% Top 25 amusement/theme Top 25 amusement/ Top 25 amusement/
indicates attendance at the ranked park
versus all other ranked parks. 2015–16 -1.1% parks attendance growth theme parks worldwide theme parks worldwide
worldwide 2015–16 attendance 2016 attendance 2015
-5 0 5 10
12 © 2017 TEA / AECOM © 2017 TEA / AECOM 13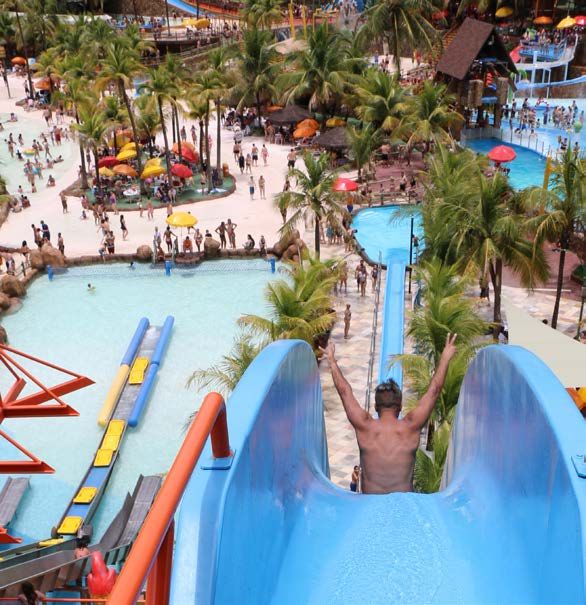
TOP 20
     WATER PARKS
     WORLDWIDE

                                                                                        ATTENDANCE

                                                                                                       ATTENDANCE

                                                                                                                                                                                                            ATTENDANCE

                                                                                                                                                                                                                            ATTENDANCE
           Location

                                                                                                                          Location
                                                                           % CHANGE

                                                                                                                                                                                              % CHANGE
     RANK

                                                                                                                    RANK
     PARK

                                                                                                                    PARK
                                                                                        2016

                                                                                                       2015

                                                                                                                                                                                                            2016

                                                                                                                                                                                                                            2015
     1 CHIMELONG WATER PARK, GUANGZHOU, CHINA                             7.9%        2,538,000      2,352,000      11 WET 'N WILD, ORLANDO, FL, U.S.                                        0.0%        1,310,000       1,310,000
     2 TYPHOON LAGOON AT DISNEY WORLD, ORLANDO, FL, U.S.                 -0.7%        2,277,000      2,294,000      12 SUNWAY LAGOON, KUALA LUMPUR, MALAYSIA                                17.9%        1,270,000        1,077,000
     3 BLIZZARD BEACH AT DISNEY WORLD, ORLANDO, FL, U.S.                 -0.8%        2,091,000      2,107,000      13 THERME ERDING, ERDING, GERMANY                                        0.8%        1,245,000       1,235,000
     4 THERMAS DOS LARANJAIS, OLIMPIA, BRAZIL                            11.2%        1,959,000      1,761,000      14 WET 'N' WILD GOLD COAST, GOLD COAST, AUSTRALIA                        3.5%        1,242,000       1,200,000
     5 BAHAMAS AQUAVENTURE WATER PARK, PARADISE ISLAND, BAHAMAS           0.0%        1,868,000      1,868,000      15 SHENYANG ROYAL OCEAN PARK WATER WORLD, FUSHUN, CHINA                  1.7%        1,170,000       1,150,000
     6 CARIBBEAN BAY, GYEONGGI-DO, SOUTH KOREA                            8.1%        1,550,000      1,434,000      16 TROPICAL ISLANDS, KRAUSNICK, GERMANY                                 13.1%        1,133,000       1,002,000*
     7 AQUATICA, ORLANDO, FL, U.S.                                       -4.0%        1,536,000      1,600,000      17 ATLANTIS WATER ADVENTURE, JAKARTA, INDONESIA                         14.4%        1,110,000         970,000
     8 OCEAN WORLD, GANGWON-DO, SOUTH KOREA                              -2.4%        1,473,000      1,509,000      18 BEACH PARK, AQUIRAZ, BRAZIL                                           7.6%        1,044,000         970,000
     9 AQUAVENTURE WATER PARK, DUBAI, U.A.E.                              2.1%        1,430,000      1,400,000      19 SCHLITTERBAHN, NEW BRAUNFELS, TX, U.S.                                0.0%        1,037,000        1,037,000
     10 HOT PARK RIO QUENTE, CALDAS NOVAS, BRAZIL                         7.2%        1,381,000      1,288,000      20 WUHU FANTAWILD WATER PARK, WUHU, CHINA                               44.6%        1,024,000         708,000
                                                                                                                     TOP 20 TOTAL ATTENDANCE 2016                                                        29,688,000 28,370,000
                                                                                                                     TOP 20 ATTENDANCE GROWTH 2015–16                                        3.6%        29,688,000 28,659,000

     * Adjustment versus the figure we published in last year’s report

                                                                                                                    3.6%                                   29.7m                       28.7m
                                                                                                                    Top 20 water parks attendance          Top 20 water parks          Top 20 water parks
                                                                                                                    growth worldwide 2015–16               worldwide attendance 2016   worldwide attendance 2015

14                                                                                           © 2017 TEA / AECOM     © 2017 TEA / AECOM                                                                                                   15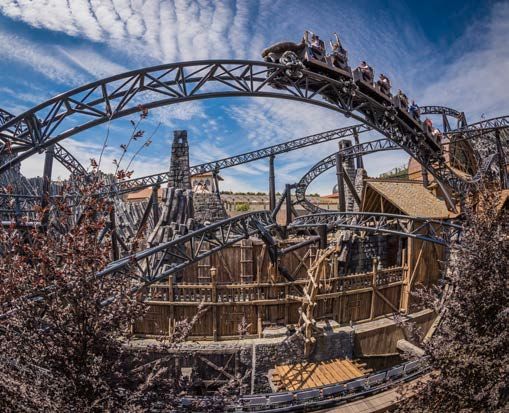
TOP 20
WATER PARKS
WORLDWIDE
16 13
GERMANY
2 PARKS / ATTENDANCE 2.4M
SOUTH KOREA
9
U.A.E. 8 6
2 PARKS / ATTENDANCE 3.0M
19 1 PARK / ATTENDANCE 1.4M
2 15
U.S. CHINA
11 4 PARKS / ATTENDANCE 7.2M 1
3 PARKS / ATTENDANCE 4.7M
3 20
MALAYSIA 17
INDONESIA
1 PARK / ATTENDANCE 1.3M
12 1 PARK / ATTENDANCE 1.1M
18
4 BRAZIL
3 PARKS / ATTENDANCE 4.4M
10
14
AUSTRALIA
1 PARK / ATTENDANCE 1.2M
KEY GROWTH 2011–16
Circles represent size of attendance at 2011–12 5.4%
ranked parks at the geography indicated.
3.6% 29.7m 28.7m
Up to 1m
2012–13 7.1%
1m–2m
Slices within circles represent proportion
of attendance at the geography from the 2013–14
2m+
2.8%
ranked park indicated by number. Shading
2014–15 3.7% Top 20 water parks attendance Top 20 water parks Top 20 water parks
indicates attendance at the ranked park
versus all other ranked parks. 2015–16 3.6% growth worldwide 2015–16 worldwide attendance 2016 worldwide attendance 2015
-5 0 5 10
16 © 2017 TEA / AECOM © 2017 TEA / AECOM 17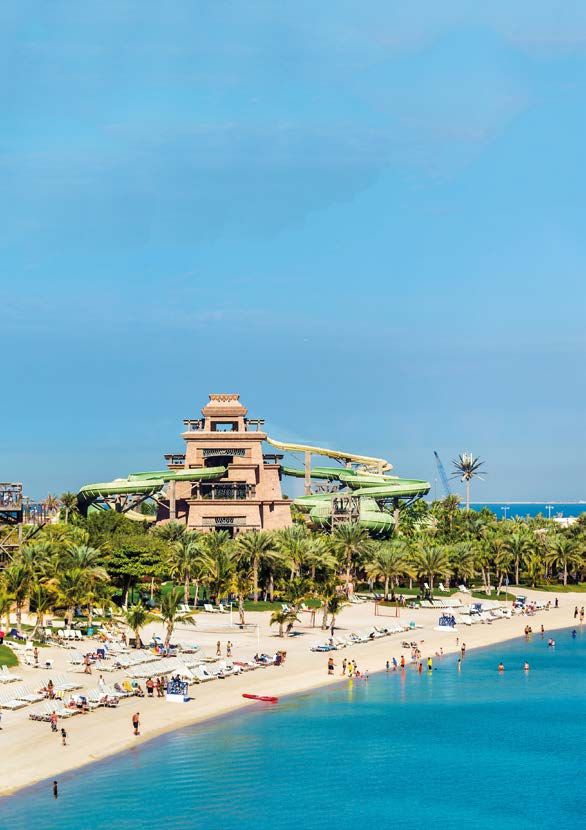
TOP 20
     MUSEUMS
     WORLDWIDE

                                                                                  ATTENDANCE

                                                                                                    ATTENDANCE

                                                                                                                                                                                                       ATTENDANCE

                                                                                                                                                                                                                       ATTENDANCE
                                                                                                    FREE/PAID

                                                                                                                                                                                                                       FREE/PAID
                                                                     % CHANGE

                                                                                                                                                                                        % CHANGE
     RANK

                                                                                                                    RANK
     PARK

                                                                                                                    PARK
                                                                                  2016

                                                                                                    2015

                                                                                                                                                                                                       2016

                                                                                                                                                                                                                       2015
     1 NATIONAL MUSEUM OF CHINA, BEIJING, CHINA                     3.6%        7,550,000        7,290,000          11 AMERICAN MUSEUM OF NATURAL HISTORY, NEW YORK, NY, U.S.          0.0%         5,000,000       5,000,000
     2 NATIONAL AIR AND SPACE MUSEUM , WASHINGTON, DC, U.S.         8.7%        7,500,000        6,900,000          12 NATIONAL PALACE MUSEUM (TAIWAN), TAIPEI, TAIWAN               -11.8%         4,666,000       5,288,000
     3 LOUVRE, PARIS, FRANCE                                      -14.9%        7,400,000        8,700,000          13 NATURAL HISTORY MUSEUM, LONDON, U.K.                          -12.5%         4,624,000       5,284,000
     4 NATIONAL MUSEUM OF NATURAL HISTORY, WASHINGTON, DC, U.S.     2.9%        7,100,000        6,900,000          14 NATIONAL GALLERY OF ART, WASHINGTON, DC                         3.8%         4,261,000       4,104,000
     5 THE METROPOLITAN MUSEUM OF ART, NEW YORK, NY, U.S.           6.3%        6,700,000        6,300,000          15 STATE HERMITAGE, ST PETERSBURG, RUSSIA                         12.3%         4,119,000       3,668,000
     6 BRITISH MUSEUM, LONDON, U.K.                                -5.9%        6,420,000        6,821,000          16 CHINA SCIENCE TECHNOLOGY MUSEUM, BEIJING, CHINA                14.0%         3,830,000       3,360,000
     7 SHANGHAI SCIENCE & TECHNOLOGY MUSEUM, SHANGHAI, CHINA        6.2%        6,316,000        5,948,000          17 NATIONAL MUSEUM OF AMERICAN HISTORY, WASHINGTON, DC            -7.3%         3,800,000       4,100,000
     8 NATIONAL GALLERY, LONDON, U.K.                               6.0%        6,263,000        5,908,000          18 REINA SOFÍA, MADRID, SPAIN                                     12.2%         3,647,000       3,250,000
     9 VATICAN MUSEUMS, VATICAN, VATICAN CITY                       1.1%        6,067,000        6,002,000          19 NATIONAL MUSEUM OF KOREA, SEOUL, SOUTH KOREA                    8.5%         3,396,000       3,130,000
     10 TATE MODERN, LONDON, U.K.                                  23.9%        5,839,000       4,713,000           20 CENTRE POMPIDOU, PARIS, FRANCE                                  6.3%         3,300,000       3,105,000
                                                                                                                     TOP 20 TOTAL ATTENDANCE 2016                                                  107,798,000 105,771,000
                                                                                                                     TOP 20 ATTENDANCE GROWTH 2015–16                                 1.2%         107,798,000 106,514,000

                                                                                                                    1.2%                                  107.8m                     106.5m
                                                                                                                    Top 20 museums attendance             Top 20 museums worldwide   Top 20 museums worldwide
                                                                                                                    growth worldwide 2015–16              attendance 2016            attendance 2015

18                                                                                             © 2017 TEA / AECOM   © 2017 TEA / AECOM                                                                                              19
TOP 20
MUSEUMS
WORLDWIDE
13 6
U.K.
4 MUSEUMS / ATTENDANCE 23.1M 10
8
15
RUSSIA
1 MUSEUM / ATTENDANCE 4.2M
CHINA
17 2
20 3 MUSEUMS / ATTENDANCE 17..7M
14 3
U.S. 9
VATICAN CITY
1 MUSEUM / ATTENDANCE 6.1M 15
6 MUSEUMS / ATTENDANCE 34.4M
11
5
4 FRANCE 1
2 MUSEUMS / ATTENDANCE 10.7M 7 19
SOUTH KOREA
1 MUSEUM / ATTENDANCE 3.4M
SPAIN 18
1 MUSEUM / ATTENDANCE 3.6M
12
TAIWAN
1 MUSEUM / ATTENDANCE 4.7M
KEY GROWTH 2012–16
Circles represent size of attendance at 2012–13 7.2%
2.5m–5.0m
5.0m–7.5m
Up to 2.5m
ranked parks at the geography indicated.
Slices within circles represent proportion 2013–14 1.6% 1.2% 107.8m 106.5m
7.5m+
of attendance at the geography from the
ranked park indicated by number. Shading 2014–15 -0.7%
indicates attendance at the ranked park Top 20 museums attendance Top 20 museums worldwide Top 20 museums worldwide
versus all other ranked parks. 2015–16 1.2% growth worldwide 2015–16 attendance 2016 attendance 2015
-5 0 5 10
20 © 2017 TEA / AECOM © 2017 TEA / AECOM 21THE AMERICAS
Fantasialandia,
Santiago, Chile
© Fantasialandia
BRIAN SANDS
Vice President,
Economics, The Americas
—
GROWTH HERE, GROWTH THERE …
Looking at attendance alone at
the top-visited theme parks in
the Americas in 2016, visitation
numbers add up to modest,
1.2% year-over-year growth of just
Top 20 amusement/ 1.2 percent. The only North
theme parks attendance American theme park operator
growth North America
2015–16 to show significant increases
during this period was Universal
Studios, where the Harry Potter
148.0m intellectual property (IP) exerts a
Top 20 amusement/theme powerful ongoing spell.
parks North America
attendance 2016
—
However, this lull in attendance growth,
146.3m especially in the mature, North American
market, is part of a complex business picture,
Top 20 amusement/theme
parks North America where much has been happening and plenty
attendance 2015 more is on the way.
22 23NORTH AMERICA
6.5%
Disney and Universal Islands of Adventure at
Universal Orlando, Florida,
attendance growth 2015–16
Disney remains dominant by a very large
margin. As the largest theme park operator in
MUCH HAS BEEN HAPPENING
North America, if Disney attendance doesn’t AND PLENTY MORE IS ABOUT
grow, the overall numbers won’t rise by much
even if competitors post significant increases
TO HAPPEN
as occurred in 2016. Domestically, Disney
attendance numbers showed an overall Disney has new IP magic of its own to deliver
decline of about one percent for the year, with in its North American parks, most notably
the Magic Kingdom down about 0.5% and the Pandora land (Avatar) at Disney’s Animal
Disneyland down 1.8 %. Despite this, revenue Kingdom at the start of the 2017 season, as
was up 5% at domestic operations, reflecting well as the redesigned and renamed Disney
increased guest spending, reportedly driven Springs retail-dining-entertainment (RDE) Skull Island: Reign of Kong™, Universal Islands
by higher average prices for admissions area (which has a fictional, quasi-IP focused of Adventure™ © Universal Orlando Resort
to theme parks and cruise line bookings, on settlement of the area in the mid-1800s by
increased food, beverage, and merchandise a cattle rancher who discovered the town’s
spending, and higher room rates. namesake springs…). For its part, Universal is Most of it was attributable to Harry Potter, Six Flags, Cedar Fair
also continuing to grow domestically, with its but credit also goes to the new Walking and SeaWorld
What’s going on with attendance? Disney new second gate in Orlando, the “water theme Dead attraction that opened in 2016, and
resources have lately been concentrated in park” Volcano Bay, opening around the same to continued impact from attractions that Our figures show Six Flags parks reported
Asia, with Shanghai Disney Resort having time as Pandora. Here too the combination were new at USH in 2015: Fast and Furious 5% increase in attendance and 4% growth
opened in mid-2016. Meanwhile, Universal’s of increases in guest spending and higher and Springfield (The Simpsons). In Orlando, in revenue for 2016, reflective of increased
Harry Potter attractions have been a powerful attendance drove significantly higher at Universal Studios Florida, attendance season pass sales and higher ticket
draw in both Hollywood and Orlando. But revenues at Universal’s domestic theme increases were driven by Skull Island at Islands prices. Six Flags Magic Mountain was up
park segment. of Adventure (2016) and the renovation of The a remarkable 7.3%, driven by the growth
Hulk ride in addition to the continued positive of tourism to the Los Angeles area and
10.8M Getting into more detail about Universal’s
2016 attendance surge: Our figures show
effect of the Harry Potter attractions, that
started with The Wizarding World of Harry
improvements at the park, including the
addition of VR to The New Revolution ride.
Disney’s Animal Kingdom at Walt Universal parks numbers in the US were up Potter in 2010, followed by Diagon Alley and Similarly strong performance in the range of
Disney World, Lake Buena Vista,
Florida, attendance 2016
7.4%, led by a nearly 14% increase at Universal Hogwarts Express in 2014, as well as the new 5.0% or more was experienced at Six Flags
Studios Hollywood (USH). Sapphire Falls hotel in 2016 which added Great Adventure, Six Flags Great America,
about 1,000 rooms to the resort. and Six Flags Mexico, driven by the continued
success of and addition of new IP-branded
Both Disney and Universal are doing well with rides, such as The Battle for Metropolis,
the resort model which entails a continually The Joker, Harley Quinn Crazy Train, and
improving and growing mix of hotel capacity, VR‑overlays on some existing rides.
new/upgraded attractions, better food and
beverage and retail, and additional gates. At The Cedar Fair parks chain was up 2.7% in
Universal Orlando, Volcano Bay is a significant attendance for 2016. Cedar Fair revenues
element of this, as the operator has closed its were also up for the year, which the
previous water park Wet & Wild, which was not operator attributes to season pass pricing
contiguous to the main property, the old site adjustments, higher season pass visitation,
Rivers of Light, of which may eventually be redeveloped into a new live entertainment and new rides. Knott’s
Disney’s Animal Kingdom,
Walt Disney World Resort,
major new Universal lodging area. Berry Farm attendance growth, estimated at
Lake Buena Vista, Florida, U.S. 3.8% was helped by significant renovations
© Disney of Ghost Rider and the revered Mrs. Knott’s
24 25Chicken Dinner Restaurant. Canada’s Big data helps uncover big revenue
Cedar Point, Sandusky, Ohio, U.S. Cobra’s Curse, Busch Gardens Tampa Bay,
Wonderland was up 2.9%; it added some new opportunities. It is a business maxim that it Tampa, FL
© Cedar Fair
small rides and VR headsets to the Thunder costs less to motivate existing customers © 2017 SeaWorld Parks
Run coaster. Cedar Point added the new to spend more, than to add new customers.
coaster Valravn and was up 3.0%. Doing so also frees up cash flow for
reinvestment, and in the attractions industry,
Under the leadership of new CEO Joel continual reinvestment is the eternal driver of
Manby and his team, SeaWorld parks are repeat business. Other operators are getting
still in transition as the operator repositions onboard the big-data train. Universal’s new
itself, placing more emphasis on thrills Volcano Bay, for example, has a modern
and experience while continuing its role in enterprise system with RFID technology that
conservation and education, and making will support flexibility for guests entering and
plans for new parks overseas. Across exiting and enable more data collection.
the network of SeaWorld parks in the US, IP, data and reinvestment and developers select the best IP in which
attendance was down 2.1%. According to our to invest for their attractions, including
estimates, SeaWorld Florida was down almost Intellectual property (IP) is going to continue identifying as yet under-utilized IPs.
8%, and Busch Gardens was down 2% in spite to be a critical, essential factor for most park
of both parks having opened new attractions and ride development in the foreseeable Water parks
in 2016. SeaWorld San Diego attendance 7.3% future. IP is everywhere, and operators on
was flat, which is more encouraging, and the Six Flags Magic all scales are using it. Six Flags parks, for The top 20 North American water parks
industry — not just the theme park industry, Mountain, Valencia, instance, are having continued success overall showed an attendance decline
but the zoo and aquarium industry as well — California, with the Justice League rides they have of 0.7% for 2016, with uneven results
attendance growth
will be watching as it rolls out the new Orca 2015–16
been adding, notably coming to Six Flags across the map. There were a few notable
Encounter experience in summer 2017. Magic Mountain, Valencia, this year and so exceptions though, with Six Flags Whitewater
entering the LA entertainment markets. A in GA, up by 5.0% due to the addition of
Revenues up, big data pays off differentiator is that the bigger operators a major ride, the Wahoo Racer. Six Flags
have inherent IP as well — their own names Hurricane Harbor (Jackson, NJ) was up
Having more customer data to work with than are media brands — as well as fully realized 2%, which can be credited to investment
ever before, through such innovations as the stories and worlds, plus tremendous in renovations. In addition, the new water
Magic Band and other customer tracking marketing exposure via associated films, park Typhoon Texas (located in Katy, TX,
systems, Disney has found ways to enhance television shows, DVDs, toys, books, clothing, near Houston) had a remarkably strong
guest experience and increase revenue and even Broadway shows. first year, with 440,000 visitors, placing it at
with such initiatives as pricing optimization, position 15 in the list. Attendance at Disney’s
retail positioning, a tiered system for season Speaking of big data, IP has proved its value Typhon Lagoon and Blizzard Beach showed
passes with blackout dates and incentives, in ways that are now calculable when we a marginal decline of about 1%, probably a
and vacation packages. Disney combines compare investment track records at parks result of Disney theme parks being down.
creativity and big data with efforts such over the years. Using historic information SeaWorld Aquatica (Orlando) was down 4%.
as Haunted Mansion Ghost Post — a 2017 from the TEA/AECOM Theme Index, AECOM
Thea Award recipient — that brought special researchers have analyzed the benefits of
value to season pass holders, new revenues adding new lands and new rides — mostly
to the operator, enables Disney to observe IP branded — in terms of their impact on
and encourage the behavior of a niche guest attendance over a three-year period after
group, and changes the way pass holders opening. In general, the median attendance
utilize the park. impact of a new land over three years can
be tremendously positive, and a new ride
over the same period is also likely to have a
Six Flags Magic
strong positive attendance result. We have Slideboarding, Pocono Mountains, Pennsylvania
also developed a model to compare the © WhiteWater
Mountain
© Six Flags relative value of IPs, and are helping operators
26 27heating the water, as well as improved
LATIN AMERICA AND MEXICO food and beverage offerings and a strong
marketing program.
Water parks
In Columbia, Piscilago (Bogotá) attendance was
Latin American water parks showed an overall down 3.7% due to wet weather. Guatemala’s
attendance increase of 3.1% for year 2016. Parque Acuatico Xocomil was down nearly
Leading the pack was Thermas dos Laranjais 11%; the operator added new features but also
(Olímpia, Brazil), up an impressive 11.2% after cut back on marketing as the park had been
reinvesting in a new Surf Master ride as well as overcrowded the previous year, so this might
an overall expansion, while also benefiting from be seen as a deliberate correction in order to
earlier investments in previous expansions improve visitor experience.
to their onsite and nearby lodging. More
broadly, the park also benefited from growth The healthy growth of the Latin American
in tourism, primarily domestic. Due to ongoing water parks market is driven by a combination
macro-economic challenges in Brazil and of the generally good climate in much of Latin
an associated exchange rate decline, fewer America for water parks, the relatively low cost 7.6%
Brazilians traveled to the Orlando area in 2016 to build such parks, and the inclusion of lodging Beach Park, Aquiraz,
and this benefited many attractions in Brazil. onsite in most cases. It is a smart model — one Brazil attendance
that extends the season, provides good value growth 2015–16
Also in Brazil, Hot Park (Rio Quente) posted for operators and guests, and keeps revenue
Vaikuntudo, Beach Park,
a 7.2% visitation increase having added new onsite. We expect to see more and more onsite Aquiraz, Brazil
rides. Beach Park (Aquiraz) surpassed the integration of water parks and resorts in Latin © Beach Park
one-million attendance mark, up 7.6%, having America, North America, and globally.
added a new retail-dining-entertainment
zone and the new ride Vaikuntudo, and also
benefiting from previous investments in Theme parks
onsite lodging. Thermas Water Park in São
Pedro grew a dramatic 29%, driven by major Elsewhere in Latin America and Mexico,
improvements to its pools, which included WE EXPECT TO SEE MORE AND theme park attendance was nearly flat
with an overall increase of about 0.4% that
MORE ON-SITE INTEGRATION OF reflected ups and downs across the region
WATER PARKS AND RESORTS in 2016. Six Flags Mexico was up 5%; the
park added a Justice League dark ride, plus
tourism overall was up to Mexico City, and
Theme Parque Nacional Del Café,
the economy doing well in Mexico more Quindio, Colombia
generally. Parque Xcaret was up 8.9%; this © Theme Parque Nacional Del Café
reflects strong tourism growth in the Cancun
Riviera Maya region and the continued
popularity of this park, which is well suited In Columbia, there is a new entrant into the
to a combination of the Mexican and Top 10 list for this region: Theme Parque
international tourist market. Nacional del Café (Coffee Park) located in
Quindío, and up 5% in attendance over the
Beto Carrerro Brazil was up 4%, benefiting previous year. In Bogotá, Parque Mundo
from good domestic tourism, as did the Aventura suffered a 15% attendance
4.0% water parks in the area. But Hopi Hari was
down 12%; plagued by labor problems and
decline, attributable largely to wet weather.
Fantasilandia in Santiago, Chile, did well, up
Beto Carrero World, Santa
Catarina, Brazil, attendance strikes, as well as wet weather, with the park 8.2%, due to a combination of new rides, an
growth 2015–16 unfortunately going into bankruptcy in 2016. extended season, and good weather.
28 29TOP 20
AMUSEMENT/THEME PARKS
NORTH AMERICA
ATTENDANCE
ATTENDANCE
Location
% CHANGE
RANK
PARK
2016
2015
1 MAGIC KINGDOM AT WALT DISNEY WORLD, LAKE BUENA VISTA, FL -0.5% 20,395,000 20,492,000
2 DISNEYLAND, ANAHEIM, CA -1.8% 17,943,000 18,278,000
3 EPCOT AT WALT DISNEY WORLD, LAKE BUENA VISTA, FL -0.7% 11,712,000 11,798,000
4 DISNEY'S ANIMAL KINGDOM AT WALT DISNEY WORLD, LAKE BUENA VISTA, FL -0.7% 10,844,000 10,922,000
5 DISNEY'S HOLLYWOOD STUDIOS AT WALT DISNEY WORLD, LAKE BUENA VISTA, FL -0.5% 10,776,000 10,828,000
6 UNIVERSAL STUDIOS AT UNIVERSAL ORLANDO, FL 4.3% 9,998,000 9,585,000
7 ISLANDS OF ADVENTURE AT UNIVERSAL ORLANDO, FL 6.5% 9,362,000 8,792,000
8 DISNEY'S CALIFORNIA ADVENTURE, ANAHEIM, CA -0.9% 9,295,000 9,383,000
ONTARIO, CANADA 9 UNIVERSAL STUDIOS HOLLYWOOD, UNIVERSAL CITY, CA 13.9% 8,086,000 7,097,000
13
1 PARK / ATTENDANCE 3.7M 10 SEAWORLD FLORIDA, ORLANDO, FL -7.9% 4,402,000 4,777,000
OHIO, U.S. 16 14 11 BUSCH GARDENS TAMPA BAY, TAMPA, FL -2.0% 4,169,000 4,252,000
2 PARKS / ATTENDANCE 7.0M PENNSYLVANIA, U.S.
18 12 KNOTT'S BERRY FARM, BUENA PARK, CA 3.8% 4,014,000 3,867,000
1 PARK / ATTENDANCE 3.3M
ILLINOIS, U.S. 20 13 CANADA'S WONDERLAND, MAPLE, ONTARIO, CANADA 2.9% 3,723,000 3,617,000
1 PARK / ATTENDANCE 7.0M 19 NEW JERSEY, U.S.
1 PARK / ATTENDANCE 3.2M 14 CEDAR POINT, SANDUSKY, OH 2.8% 3,604,000 3,507,000
15 SEAWORLD SAN DIEGO, SAN DIEGO, CA 0.0% 3,528,000 3,528,000
16 KINGS ISLAND, KINGS ISLAND, OH 1.5% 3,384,000 3,335,000
15 17 17 SIX FLAGS MAGIC MOUNTAIN, VALENCIA, CA 7.3% 3,332,000 3,104,000
CALIFORNIA, U.S. 12
2
6 PARKS / ATTENDANCE 46.2M 10 11 1 18 HERSHEY PARK, HERSHEY, PA 0.0% 3,276,000 3,276,000
9 7
8
FLORIDA, U.S. 19 SIX FLAGS GREAT ADVENTURE, JACKSON, NJ 5.5% 3,220,000 3,052,000
6 8 PARKS / ATTENDANCE 81.7M
3 20 SIX FLAGS GREAT AMERICA, GURNEE, IL 5.6% 2,950,000 2,793,000
5 4
TOP 20 TOTAL ATTENDANCE 2016 148,013,000 146,283,000
TOP 20 ATTENDANCE GROWTH 2015–16 1.2% 148,013,000 146,270,000
KEY GROWTH 2011–16
Circles represent size of attendance at 2011–12 3.6%
10m–15m
ranked parks at the geography indicated.
1.2% 148.0m 146.3m
Up to 5m
5m–10m
Slices within circles represent proportion 2012–13 2.7%
15m+
of attendance at the geography from the 2013–14 2.2%
ranked park indicated by number. Shading
2014–15 5.9% Top 20 amusement/theme Top 20 amusement/theme
indicates attendance at the ranked park Top 20 amusement/theme
versus all other ranked parks. 2015–16 1.2% parks attendance growth parks North America parks North America
North America 2015–16 attendance 2016 attendance 2015
-5 0 5 10
30 © 2017 TEA / AECOM © 2017 TEA / AECOM 31TOP 10
AMUSEMENT/THEME PARKS
LATIN AMERICA
ATTENDANCE
ATTENDANCE
Location
% CHANGE
RANK
PARK
2016
2015
1 SIX FLAGS MEXICO, MEXICO CITY, MEXICO 5.0% 2,486,000 2,368,000
13
MONTERREY, MEXICO
1 PARK / ATTENDANCE 1.2M 2 BETO CARRERO WORLD, SANTA CATARINA, BRAZIL 4.0% 2,080,000 2,000,000
3 LA FERIA DE CHAPULTEPEC, MEXICO CITY, MEXICO 0.4% 1,591,000 1,584,000
CANCÚN, MEXICO 4 HOPI HARI, SÃO PAULO, BRAZIL -12.0% 1,468,000 1,668,000
3 1 5
1 PARK / ATTENDANCE 1.4M 5 PARQUE XCARET, CANCÚN, MEXICO 8.9% 1,401,000 1,287,000
MEXICO CITY, MEXICO 7 GUATEMALA 6 PLAZA DE SESAMO, MONTERREY, MEXICO 0.0% 1,221,000 1,221,000
2 PARKS / ATTENDANCE 4.1M 1 PARK / ATTENDANCE 1.2M
7 MUNDO PETAPA, GUATEMALA CITY, GUATEMALA 1.8% 1,220,000 1,199,000
8 PARQUE MUNDO AVENTURA, BOGOTÁ, COLOMBIA -15.0% 1,180,000 1,389,000
9 FANTASIALANDIA, SANTIAGO, CHILE 8.2% 1,085,000 1,003,000
COLOMBIA 10 8 10 THEME PARQUE NACIONAL DEL CAFÉ, QUINDIO, COLOMBIA 5.0% 1,050,000 1,000,000
2 PARKS / ATTENDANCE 1.4M
TOP 10 TOTAL ATTENDANCE 2016 14,782,000 14,719,000
TOP 10 ATTENDANCE GROWTH 2015–16 0.7% 14,782,000 14,675,000
4
2
BRAZIL
2 PARKS / ATTENDANCE 3.4M
CHILE 9
1 PARK / ATTENDANCE 1.1M
KEY GROWTH 2011–16
Circles represent size of attendance at 2011–12 2.6%
10m–15m
ranked parks at the geography indicated.
0.7% 14.8m 14.7m
Up to 5m
5m–10m
Slices within circles represent proportion 2012–13 3.8%
15m+
of attendance at the geography from the 2013–14 5.1%
ranked park indicated by number. Shading
2014–15 1.0% Top 10 amusement/theme Top 10 amusement/ Top 25 amusement/
indicates attendance at the ranked park
versus all other ranked parks. 2015–16 0.7% parks attendance growth theme parks Latin America theme parks Latin America
Latin America 2015–16 attendance 2016 attendance 2015
-5 0 5 10
32 © 2017 TEA / AECOM © 2017 TEA / AECOM 33TOP 20
WATER PARKS
NORTH AMERICA
ATTENDANCE
ATTENDANCE
Location
% CHANGE
RANK
PARK
2016
2015
1 TYPHOON LAGOON AT DISNEY WORLD, ORLANDO, FL -0.7% 2,277,000 2,294,000
2 BLIZZARD BEACH AT DISNEY WORLD, ORLANDO, FL -0.8% 2,091,000 2,107,000
3 AQUATICA, ORLANDO, FL -4.0% 1,536,000 1,600,000
4 WET 'N WILD, ORLANDO, FL 0.0% 1,310,000 1,310,000
5 SCHLITTERBAHN, NEW BRAUNFELS, TX 0.0% 1,037,000 1,037,000
6 WATER COUNTRY USA, WILLIAMSBURG, VA 1.0% 733,000 726,000
7 ADVENTURE ISLAND, TAMPA, FL -2.0% 650,000 663,000
8 SIX FLAGS-WHITE WATER, MARIETTA, GA 5.0% 568,000 541,000
9 SCHLITTERBAHN, GALVESTON,TX 2.0% 562,000 551,000
10 SIX FLAGS-HURRICANE HARBOR, ARLINGTON, TX 0.0% 549,000 549,000
MIDWEST U.S. 18 16 11 NORTHEAST U.S.
1 PARK / ATTENDANCE 0.4M 14 3 PARKS / ATTENDANCE 1.4M 11 SPLISH-SPASH, CALVERTON NY 0.0% 513,000 513,000
12 WET'N'WILD SPLASHTOWN, HOUSTON, TX 0.0% 501,000 501,000
20 19
13 6 SOUTH U.S. 13 WET N' WILD, PHOENIX, AZ 0.0% 481,000 481,000
17 8 3 PARKS / ATTENDANCE 1.7M
14 SIX FLAGS HURRICANE HARBOR, JACKSON, NJ 2.0% 449,000 440,000
WEST U.S.
3 PARKS / ATTENDANCE 1.3M 15 TYPHOON TEXAS, KATY, TX - 440,000 NEW ENTRY
15 16 CAMELBEACH, TANNERSVILLE, PA 0.0% 437,000 437,000
TEXAS, U.S. 12 5
4 7
1
5 PARKS / ATTENDANCE 3.1M 17 HYLAND HILLS WATER WORLD, DENVER, CO -2.3% 434,000 444,000*
10 9 FLORIDA, U.S.
5 PARKS / ATTENDANCE 7.9M 18 ZOOMEZI BAY, POWELL, OH 0.0% 423,000 423,000
3 2
19 DOLLYWOOD'S SPLASH COUNTRY, PIGEON FORGE, TN 0.0% 416,000 416,000
20 RAGING WATERS, SAN DIMAS, CA 0.0% 403,000 403,000
TOP 20 TOTAL ATTENDANCE 2016 15,810,000 15,436,000
TOP 20 ATTENDANCE GROWTH 2015–16 -0.7% 15,810,000 15,921,000
* Adjustment versus the figure we published in last year’s report
KEY GROWTH 2011–16
Circles represent size of attendance at 2011–12 2.2%
-0.7% 15.8m 15.9m
ranked parks at the geography indicated.
Up to 1m
2012–13 -2.3%
1m–2m
Slices within circles represent proportion
of attendance at the geography from the 2013–14
2m+
1.6%
ranked park indicated by number. Shading
2014–15 4.3% Top 20 water parks Top 25 water parks North Top 25 water parks North
indicates attendance at the ranked park
versus all other ranked parks. 2015–16 -0.7% attendance growth North America attendance 2016 America attendance 2015
America 2015–16
-5 0 5 10
34 © 2017 TEA / AECOM © 2017 TEA / AECOM 35TOP 10
WATER PARKS
LATIN AMERICA
ATTENDANCE
ATTENDANCE
Location
% CHANGE
RANK
PARK
2016
2015
1 THERMAS DOS LARANJAIS, OLÍMPIA, BRAZIL 11.2% 1,959,000 1,761,000
2 BAHAMAS
1 PARK / ATTENDANCE 1.9M 2 BAHAMAS AQUAVENTURE WATER PARK, PARADISE ISLAND, BAHAMAS 0.0% 1,868,000 1,868,000
3 HOT PARK RIO QUENTE, CALDAS NOVAS, BRAZIL 7.2% 1,381,000 1,288,000
MEXICO 7
1 PARK / ATTENDANCE 0.5M 4 BEACH PARK, AQUIRAZ, BRAZIL 7.6% 1,044,000 970,000
GUATEMALA 5 PISCILAGO, GIRARDOT (BOGOTÁ), COLOMBIA -3.7% 970,000 1,007,000*
6
1 PARK / ATTENDANCE 0.8M 6 PARQUE ACUATICO XOCOMIL, SAN MARTÍN ZAPOTITLÁN, RETALHULEU, GUATEMALA -10.9% 838,000 940,000
COLOMBIA 5 7 PARQUE ACUATICO EL ROLLO, MORELOS, MEXICO 2.0% 520,000 510,000
1 PARK / ATTENDANCE 1M
8 WET 'N WILD SAO PAULO, SÃO PAULO, BRAZIL -2.0% 486,000 496,000
9 RIO WATER PLANET, RIO DE JANEIRO, BRAZIL -2.0% 392,000 400,000
10 THERMAS WATER PARK, SÃO PEDRO, BRAZIL 29.4% 330,000 255,000
TOP 10 TOTAL ATTENDANCE 2016 9,788,000 9,495,000
TOP 10 ATTENDANCE GROWTH 2015–16 3.4% 9,788,000 9,462,000
9 10
8
1
4
3
BRAZIL
6 PARKS / ATTENDANCE 5.9M
* Adjustment versus the figure we published in last year’s report
KEY GROWTH 2013–16
Circles represent size of attendance at
ranked parks at the geography indicated. 2013–14 5.7%
Up to 1m
3.4% 9.8m 9.5m
1m–2m
Slices within circles represent proportion
of attendance at the geography from the 2014–15
2m+
0.3%
ranked park indicated by number. Shading
indicates attendance at the ranked park
versus all other ranked parks.
2015–16 3.4% Top 10 water parks Top 10 water parks Latin Top 10 water parks Latin
attendance growth Latin America attendance 2016 America attendance 2015
-5 0 5 10 America 2015–16
36 © 2017 TEA / AECOM © 2017 TEA / AECOM 37ASIA-PACIFIC
Enchanted Storybook Castle,
Shanghai Disneyland,
Shanghai Disney Resort,
Shanghai, China
© Disney
CHRIS YOSHII BETH CHANG
Vice President, Executive Director,
Asia-Pacific Economics, Asia‑Pacific
— —
REINVESTMENT AND MARKETING
ARE KEY FACTORS TO GROWTH
On the whole, 2016 was a strong
year for Asia’s theme park group
operators, with substantial
growth led by OCT, Fantawild
and Chimelong. Attendance
increases for these three
operators came from newly
-2.8% opened locations as well as
Top 20 amusement/ same-park growth.
theme parks
attendance growth
Asia-Pacific 2015–16 —
Effective marketing campaigns helped
drive the growth, as did smart reinvestment
127.3m and facility upgrades. New entertainment
programming at some parks also stimulated
Top 20 amusement/ attendance. Asian park operators have
theme parks Asia-Pacific
been adopting increasingly sophisticated
attendance 2016
promotions to drive repeat visitation
and bring more guests in during slower
periods, using pricing incentives and social
130.9m media engagement. Some groups are also
extending their scope of operations by
Top 20 amusement/
theme parks Asia-Pacific forming management agreements with
attendance 2015 scenic areas and smaller attractions nearby.
38 39The top-performing operators are working Economy, tourism and per caps Shanghai Disneyland opens
to influence visitation patterns along with
growing attendance. A characteristic of Asia’s economy remains quite robust We don’t yet have a full year of numbers for
this market is that there can be very sharp and this helps to drive rising theme park Shanghai Disneyland. However, the opening
differences in attendance levels on holidays attendance. There are individual differences of Shanghai Disneyland has already shown THE OVERALL FORECAST STILL
vs other times — visitation might be in the from one country to another, but in general itself to be a watershed event. The park
tens of thousands on a holiday weekend, yet 2016 was a very stable year, and the outlook is performing even better than expected HOLDS, THAT BY THE YEAR 2020,
only a few thousand on an average weekday.
Operators are having some success in using
remains very positive. Tourism is very
strong: in most places, we’re seeing double
and therefore has proven, without a doubt,
the depth of opportunity China’s market
ATTENDANCE AT THEME PARKS
targeted marketing to help even out those digit growth in terms of visitor arrivals, both represents. It demonstrates that the Chinese IN CHINA WILL SURPASS THAT
attendance patterns, with regular outreach
via WeChat and similar online forums. Tickets
domestically and internationally. market will support the price point of a Disney
park: tickets have been selling, and guests
OF THE US.
are typically bought on the spot using a Domestic parks, however, tend to have have been coming in the millions. Disney
mobile device, and when visitors arrive at the unrealized income potential. We see that did a very good job, making a significant
park they gain admission by scanning a QR these parks are — as the bigger players investment and producing a world-class park Fantawild had several new parks pass
code on their devices. are doing — upgrading slowly and steadily with state-of-the-art attractions. It paves the their first full year of operation in 2016 and
improving facilities, often adopting domestic way for future development; Universal Studios deliver large increases in attendance. New
In addition to such promotions as food IP, and generally doing better in their markets is surely happy to see this, with Universal attractions and a flexible pricing system
offers and special ticket deals, there are and marketing through the use of social Studios Beijing currently under development, helped drive the growth.
content angles. Some operators — OCT media. But in contrast to the larger parks, and we see other developers and brands
for one — have added more entertainment domestic parks in Asia are below average moving forward with their own plans as well. Universal Studios Japan had another strong
programming. Some are using tie-ins when it comes to guest in-park spending. year with more than 14 million visits, largely
with domestic IP (intellectual property) to While focusing on driving attendance, these The overall forecast still holds, that by the due to the continuing appeal of its Harry
appeal to their family markets. Fantawild, for operators are still leaving money on the table year 2020, attendance at theme parks in Potter attractions. Attendance at theme
example, has an agreement with a popular, in regard to potential revenue in retail, games, China will surpass that of the US. It’s simply a parks in the rest of Japan was largely flat.
local cartoon series, Boonie Bears, allowing food and beverage, and VIP experiences. matter of arithmetic — China’s market is four
them to have characters from the series in times the population of the US. Both Hong Kong Disneyland and Ocean Park
the park. Hong Kong experienced sharp visitation
Asia’s Top 20 parks — declines, respectively 10.3% and 18.8%.
Regional ups and downs It was the second year of declines for
both. A primary reason was the reduced
3.4M Parks in China did very well in 2016, while
parks in Hong Kong struggled. Elsewhere in
level of tourism from Mainland China. The
Chinese tourists have been going to other
Fantawild Oriental
Asia, there were some marked successes destinations such as Thailand, Japan and
Heritage, Ningbo, China,
attendance 2016 while other numbers were flat or even in Korea. (The sheer volume of tourism to
decline. This uneven performance may point Hong Kong has sparked some negative
to what we can expect to be a normal pattern local reactions that have discouraged
as the Asian sector continues to evolve: visitation.) There is also more competition
while growing very quickly, competition in that Chinese now have many theme parks
and sharp changes in tourism can greatly to visit in their own country, meaning that
impact performance. when they do travel to Hong Kong they don’t
necessarily visit a theme park. Both Hong
The market is far from saturated. OCT Kong Disneyland and Ocean Park Hong Kong
Shanghai is a good example. Even with such have new attractions in the works, so we
formidable competition as a new Disney expect to see their numbers recover soon.
park in the same market, OCT Shanghai had Existing parks can’t sit still; they need to
a creditable performance in 2016. OCT did continually reinvest, upgrade, and improve
Fantawild Oriental Heritage,
Ningbo, China take the trouble to invest in their facility to their offers and marketing to maximize their
© Fantawild remain competitive. revenue streams.
40 41South Korea also had mixed results with the 2016 report. This change contributes to
Lotte World benefiting from higher foreign the -2.8% decline in the top 20 Asia-Pacific 1.2M
tourist arrivals and enjoying a sharp increase theme park attendance growth. When we Wet ‘N’ Wild Gold Coast,
of 11%. This was something of a rebound compare the growth of same parks open for Australia, attendance 2016
from the previous year, where tourism had both years, it is a healthy growth of 1.6%.
been negatively affected by concerns about
MERS. Everland’s numbers for 2016 were The industry evolves,
relatively flat. and TEA helps
A change of category affects Chinese AECOM continues to partner with TEA on
operator Songcheng Worldwide in relation producing the annual Theme Index but
to the 2016 Theme Index. Songcheng is a also in support of TEA’s efforts around the
successful attraction operator with a growing globe to promote excellence and growth
number of properties and attendance. within the visitor attractions industry.
However as this operator’s focus is on large The TEA Asia Pacific Division is active
performance shows with small supporting throughout the region with events including
areas, we are no longer considering regular networking mixers in Beijing and
Songcheng in the same category as full- Shanghai, presentations at trade events and
day, large-scale theme parks. Therefore conferences, behind-the-scenes visits to
Songcheng Worldwide is not included in parks and educational programming.
Wet ‘N’ Wild Gold Coast, Australia
6.0M Water parks — still growing In Korea, Caribbean Bay had a standout
Ocean Park Hong Kong year with strong recovery from the MERS
SAR, attendance 2016 Overall, water parks performed very strongly scare and poor weather of the previous year.
in 2016 in Asia with 6.9% overall growth. In the meantime, other Korean water park
Chimelong retained the designation of attendance numbers were mostly flat.
top-attended water park worldwide, with
solid attendance growth as a result of more In Southeast Asia, Sunway Lagoon in Kuala
entertainment programming and a longer Lumpur added a Nickelodeon water park
operating season. Water parks in other cities extension, which boosted attendance
in China generally experienced growth or flat significantly. Sunway’s Perak property also
performance despite a significant number of had a very strong result due to the launch of
new facilities. two new attractions, the Ultimate Night Park
and the Lost World Petting Zoo.
Many new, smaller, water park/water play
areas opened up in China in 2016; several The Jungle Water Adventure in Bogor,
online sources indicate as many as 50. These Indonesia had a dramatic rise in attendance,
are not always what we would consider a full- due to better economic conditions and
fledged water park, hence the term “water aggressive marketing campaigns as well as
play area.” Either way, the trend is continuing. revised entry pricing.
Such facilities can be built very quickly, with
relatively little expense and on a smaller
Ocean Park, Hong Kong SAR footprint than a theme park.
42 43TOP 20
AMUSEMENT/THEME PARKS
ASIA-PACIFIC
ATTENDANCE
ATTENDANCE
Location
% CHANGE
RANK
PARK
2016
2015
1 TOKYO DISNEYLAND, TOKYO, JAPAN -0.4% 16,540,000 16,600,000
2 UNIVERSAL STUDIOS JAPAN, OSAKA, JAPAN 4.3% 14,500,000 13,900,000
3 TOKYO DISNEY SEA, TOKYO, JAPAN -1.0% 13,460,000 13,600,000
4 CHIMELONG OCEAN KINGDOM, HENGQIN, CHINA 13.2% 8,474,000 7,486,000
5 LOTTE WORLD, SEOUL, SOUTH KOREA 11.5% 8,150,000 7,310,000
NORTH CHINA 16 6 5 SOUTH KOREA 6 EVERLAND, GYEONGGI-DO, SOUTH KOREA -3.0% 7,200,000 7,423,000
1 PARK / ATTENDANCE 3.8M 2 PARKS / ATTENDANCE 15.4M
7 HONG KONG DISNEYLAND, HONG KONG SAR -10.3% 6,100,000 6,800,000
SOUTH WEST CHINA 8 OCEAN PARK, HONG KONG SAR -18.8% 5,996,000 7,387,000
19 9
1 PARK / ATTENDANCE 2.6M 1 9 NAGASHIMA SPA LAND, KUWANA, JAPAN -0.3% 5,850,000 5,870,000
3
17 10 SHANGHAI DISNEYLAND, SHANGHAI, CHINA – 5,600,000 NEW ENTRY
SOUTH CENTRAL CHINA 15 4 2
6 PARKS / ATTENDANCE 27.5M 14
11 UNIVERSAL STUDIOS SINGAPORE, SINGAPORE -2.4% 4,100,000 4,200,000
13 12 JAPAN
4 PARKS / ATTENDANCE 50.4M 12 OCT EAST, SHENZHEN, CHINA 0.5% 3,960,000 3,940,000
HONG KONG SAR 8 7 13 OCT WINDOW OF THE WORLD, SHENZHEN, CHINA 13.7% 3,910,000 3,440,000
20
2 PARKS / ATTENDANCE 12.1M 10 EAST CHINA
18 3 PARKS / ATTENDANCE 11.4M 14 OCT HAPPY VALLEY, SHENZHEN, CHINA 18.8% 3,860,000 3,250,000
15 CHIMELONG PARADISE, GUANGZHOU, CHINA 6.0% 3,836,000 3,619,000
16 OCT HAPPY VALLEY, BEIJING, CHINA 2.4% 3,830,000 3,740,000
17 FANTAWILD ADVENTURE, ZHENGZHOU, CHINA 24.1% 3,509,000 2,828,000
11 SINGAPORE
1 PARK / ATTENDANCE 4.1M 18 FANTAWILD ORIENTAL HERITAGE, NINGBO, CHINA – 3,441,000 NEW ENTRY
19 OCT HAPPY VALLEY, CHENGDU, CHINA -1.5% 2,550,000 2,590,000
20 OCT HAPPY VALLEY, SHANGHAI, CHINA 2.1% 2,390,000 2,340,000
TOP 20 TOTAL ATTENDANCE 2016 127,256,000 116,323,000
TOP 20 ATTENDANCE GROWTH 2015–16 -2.8% 127,256,000 130,944,000
KEY GROWTH 2011–16
Circles represent size of attendance at 2011–12 5.8%
10m–15m
ranked parks at the geography indicated.
-2.8% 127.3m 130.9m
Up to 5m
5m–10m
Slices within circles represent proportion 2012–13 7.5%
15m+
of attendance at the geography from the 2013–14 4.9%
ranked park indicated by number. Shading
2014–15 6.9% Top 20 amusement/theme Top 20 amusement/ Top 20 amusement/
indicates attendance at the ranked park
versus all other ranked parks. 2015–16 -2.8% parks attendance growth theme parks Asia-Pacific theme parks Asia-Pacific
Asia-Pacific 2015–16 attendance 2016 attendance 2015
-5 0 5 10
44 © 2017 TEA / AECOM © 2017 TEA / AECOM 45TOP 20
WATER PARKS
ASIA-PACIFIC
ATTENDANCE
ATTENDANCE
Location
% CHANGE
RANK
PARK
2016
2015
1 CHIMELONG WATER PARK, GUANGZHOU, CHINA 7.9% 2,538,000 2,352,000
2 CARIBBEAN BAY, GYEONGGI-DO, SOUTH KOREA 8.1% 1,550,000 1,434,000
3 OCEAN WORLD, GANGWON-DO, SOUTH KOREA -2.4% 1,473,000 1,509,000
4 SUNWAY LAGOON, KUALA LUMPUR, MALAYSIA 17.9% 1,270,000 1,077,000
16
2 5 WET 'N' WILD GOLD COAST, GOLD COAST, AUSTRALIA 3.5% 1,242,000 1,200,000
10
SOUTH KOREA
4 PARKS / ATTENDANCE 4.7M 6 SHENYANG ROYAL OCEAN PARK — WATER WORLD, FUSHUN, CHINA 1.7% 1,170,000 1,150,000
3
7 ATLANTIS WATER ADVENTURE, JAKARTA, INDONESIA 14.4% 1,110,000 970,000
18
15 8 WUHU FANTAWILD WATER PARK, WUHU, CHINA 44.6% 1,024,000 708,000
CHINA 1
6 PARKS / ATTENDANCE 6.3M 11 9 SUNWAY LOST WORLD OF TAMBUN, PERAK, MALAYSIA 16.4% 1,000,000 859,000
8 6
10 WOONGJIN PLAYDOCI WATERDOCI, GYEONGGI-DO, SOUTH KOREA 0.2% 900,000 898,000
12 JAPAN 11 PLAYAMAYA WATER PARK, SHANGHAI, CHINA 38.1% 870,000 630,000
1 PARK / ATTENDANCE 0.9M
12 SUMMERLAND, TOKYO, JAPAN -5.8% 862,000 915,000
13 THE JUNGLE WATER ADVENTURE, BOGOR, WEST JAVA, INDONESIA 42.7% 815,000 571,000
17
MALAYSIA 4 14 OCEAN PARK WATER ADVENTURE, JAKARTA, INDONESIA 0.1% 805,000 804,000
3 PARKS / ATTENDANCE 3.0M 14
9 7 INDONESIA
3 PARKS / ATTENDANCE 2.7M 15 ZHENGZHOU FANTAWILD WATER PARK, ZHENGZHOU, CHINA 15.6% 802,000 694,000
13
SINGAPORE 19 16 LOTTE WATER PARK, SEOUL, SOUTH KOREA 0.9% 779,000 772,000
1 PARK / ATTENDANCE 0.7M
17 LEGOLAND WATER PARK, JOHOR, MALAYSIA 0.0% 700,000 700,000
18 PLAYAMAYA WATER PARK, WUHAN, CHINA -5.5% 690,000 730,000
19 ADVENTURE COVE WATER PARK, SINGAPORE 0.0% 660,000 660,000
20
5 AUSTRALIA
2 PARKS / ATTENDANCE 1.9M 20 WET 'N' WILD SYDNEY, SYDNEY, AUSTRALIA -5.9% 635,000 675,000
TOP 20 TOTAL ATTENDANCE 2016 20,895,000 19,308,000
TOP 20 ATTENDANCE GROWTH 2015–16 5.4% 20,895,000 19,547,000
KEY GROWTH 2011–16
Circles represent size of attendance at 2011–12 7.4%
ranked parks at the geography indicated.
5.4% 20.9M 19.5M
Up to 1m
2012–13 6.0%
1m–2m
Slices within circles represent proportion
of attendance at the geography from the 2013–14
2m+
1.2%
ranked park indicated by number. Shading
2014–15 1.0% Top 20 water parks Top 20 water Top 20 water
indicates attendance at the ranked park
versus all other ranked parks. 2015–16 5.4% attendance growth parks Asia‑Pacific parks Asia‑Pacific
Asia‑Pacific 2015–16 attendance 2016 attendance 2015
-5 0 5 10
46 © 2017 TEA / AECOM © 2017 TEA / AECOM 47EMEA
Puy du Fou
Les Epesses, France
MARGREET PAPAMICHAEL
Director, EMEA
—
In the EMEA region, theme
park attendance numbers for
2016 are marginally down by
1%, reflecting a pretty stable
year overall, considering the
politically and economically
tumultuous times.
-1.1%
Top 20 amusement/
theme parks
—
attendance growth Top EMEA performers
EMEA 2015–16
In Spain, Parque Warner (Madrid) showed an
impressive increase of more than 9% on the
60.5m back of an equally impressive increase in
tourism to Madrid, and a clearly strengthening
Top 25 amusement/ domestic economy.
theme parks EMEA
attendance 2016
In France, Puy du Fou (Les Epesses) gained a
healthy increase in attendance of more than
8% further enhancing its rise as a unique and
61.2m quality attraction in Europe. Its large-scale,
live pageantry is clearly hitting all the right
Top 25 amusement/
theme parks EMEA notes with its audience, and the park is driving
attendance 2015 tourism to the local area now.
48 49Futuroscope’s (Poitiers, France) attendance Decline in Paris Water parks
numbers rose more than 5% on the back of
some very good promotional campaigns. Despite some of the best 2016 theme park Overall, we see that water parks in the EMEA In Germany, Tropical Islands (near Berlin)
Futuroscope has strengthened its image in attendance increases for the EMEA region region also experienced a pretty stable year, recorded an impressive, double-digit increase
the market over the last couple of years with being in France, Disneyland Paris experienced with some outstanding performers: of 13%. Tropical Islands began as a traditional
an increasing image of ‘fun’ over ‘education’ a steep decline, with attendance falling by indoor water park built in an old aircraft
though it still very much delivers on the around 14%. A variety of factors including In Spain, Siam Park (Tenerife) recorded hangar. The operator opened an outdoor
educational messages it set out to promote. economic and political events, as well as a impressive growth of more than 15%, which component in 2016 that transformed the
rainy start to the season and flooding in Paris, can be attributed to a large increase in tourism property into an all-seasons resort — an
In Germany, Phantasialand (Brühl), achieved an brought down overall tourism numbers to to this area. The healthy and growing economy investment that seems to be paying off. The
attendance increase of more than 5% following the greater Paris region. From 2015 to 2016, in Spain’s domestic markets is a boon here park is now looking forward to building on
upon their investment in the new themed tourism was down 1.5 million — a decline of just as it was for Parque Warner’s increase in this year-round provision and is increasing its
land, Klugheim, a new expansion featuring 1.5%, which in turn was down 1.1% from 2014. attendance, mentioned above. accommodation stock.
immersive attractions and two signature roller However, considering that attendance to Walt
coasters. Developed within a limited footprint, Disney Studios Park was down by only 1.6%,
this new land was created with great attention we would suggest that other elements, such
to design detail, from the audio to the food as overdue re-investment, may have had an
and beverage. The way the two coasters are effect. We expect it to take some time before
intertwined is a spectacle in itself. these numbers right themselves again.
5.0% 1.4M
Phantasialand
Brϋhl, Germany, Aquaventure
attendance Water Park, Dubai,
© Phantasialand growth 2015–16 U.A.E. attendance
2016
50 51You can also read