Ireland's Stability Programme April 2015 Update - DRAFT Incorporating the Department of Finance's spring forecasts
←
→
Page content transcription
If your browser does not render page correctly, please read the page content below

DRAFT
   Ireland’s Stability Programme
         April 2015 Update
Incorporating the Department of Finance’s spring forecasts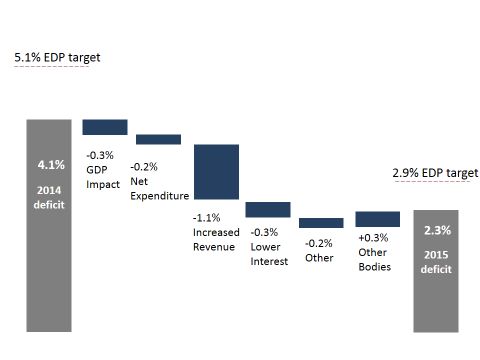
Foreword

This draft Update of Ireland’s Stability Programme takes account of Budget 2015 and other
Government initiatives. It is Ireland’s national medium-term fiscal plan and includes an
update of the economic and fiscal outlook. The finalised document will be submitted to the
European Commission by 30 April in accordance with the requirements under the European
Semester.

The document incorporates horizontal guidance provided by the European Council to
Member States in December 2014 and March 2015 as part of the discussions on the Annual
Growth Survey. It also reflects the December 2010 ECOFIN Council recommendations to
Ireland under the Excessive Deficit Procedure. It has been prepared in line with the
September 2012 guidelines on the format and content of Stability and Convergence
Programmes.

This Update of the Stability Programme should be read in conjunction with the 2015 Update
of Ireland’s National Reform Programme (NRP), which outlines progress to date in achieving
Ireland’s national targets within the context of the Europe 2020 Strategy.

The analysis and forecasts contained in this document are based on data available to late-
March 2015. The macroeconomic forecasts contained herein were endorsed by the Irish
Fiscal Advisory Council on 31 March 2015.

Department of Finance | Ireland’s Stability Programme, April 2015 Update DRAFT     Page | i
Contents
                                                                                             Page
 Foreword                                                                                      i
 List of Tables and Figures                                                                   ii
 1.            Overview and General Policy Strategy                                           1
 1.1.          Policy Strategy                                                                1
 1.2.          Economic and Budgetary Outlook                                                 2
 2.            Economic Outlook                                                               3
 2.1.          Summary                                                                        3
 2.2.          Macroeconomic Outturn 2014                                                     3
 2.3.          Macroeconomic Projections 2015                                                 3
 2.4.          Medium-Term Growth Prospects 2016 to 2020                                      7
 2.5.          The labour market                                                              8
 2.6.          Price developments                                                             9

 3.        T Fiscal Outlook                                                                   11
 3.1.        Budgetary Outturn 2014                                                           11
 3.2.        Budgetary Outlook 2015                                                           11
 3.3.        Transition of the Deficit                                                        14
 3.4.        Fiscal Outlook 2016 to 2020                                                      16
 3.5.        Debt Developments                                                                20
 3.6.        Structural Budget Balance and Medium-Term Budgetary                              25
             Objective (MTO)

 4.            Risk and Sensitivity Analysis                                                  29
 4.1.          Summary                                                                        29
 4.2.          Risks to the Forecasts                                                         29
 4.3.          Fiscal Risks                                                                   30
 4.4.          Sensitivity Analysis                                                           32
 4.5.          Comparison with last year’s Update                                             34

 5.            Quality of the Public Finances                                                 36
 5.1.          Summary                                                                        36
 5.2.          Quality of the Public Finances                                                 36

 6.            The Excessive Deficit Procedure                                                38
 6.1.          Summary                                                                        34
 6.2.          Background                                                                     34
 6.3.          Progress in implementing                the     European          Council’s    38
               recommendations

 7.            Long-Term Sustainability of the Public Finances                                40
 7.1.          Summary                                                                        40
 7.2.          Background                                                                     40
 7.3.          Long-Term Budgetary Prospects                                                  41
 7.4           Policy Strategy                                                                43
 7.5           Conclusion                                                                     44

 Annex 1       Supplementary data                                                             45

Department of Finance | Ireland’s Stability Programme, April 2015 Update DRAFT                 Page | ii
Annex 2 Ireland’s National Reform Programme – Summary of Progress 54
Annex 3 Irish Fiscal Advisory Council’s Endorsement of the 55
Macroeconomic Forecasts
Tables, Figures and Boxes Page
Tables
Table 1 Economic growth, general government balance and debt ratio 2
Table 2 External assumptions 4
Table 3 Macroeconomic prospects 5
Table 4 External balance 7
Table 5 Labour market developments 9
Table 6 Price developments 9
Table 7 Analysis of taxation receipts – cumulative performance against 12
profile
Table 8 Analysis of taxation receipts – cumulative year-on-year 12
performance
Table 9 Impact of Irish Water on general government balance and 15
debt 2014-2020
Table 10 Budgetary projections 2015-2020 18
Table 11 General government debt 2014-2020 21
Table 12 General government debt and net general government debt 22
2014 and 2015
Table 13 General government debt developments 24
Table 14 Requirements and path for the general government balance 25
Table 15 Cyclical developments 26
Table 16 Contingent liabilities 31
Table 17 Impact on main aggregates 33
Table 18 Range of forecasts 34
Table 19 Comparison with previous Update 35
Table 20 Requirements and path for the general government balance 39
Table 21 Long-term spending projections 42
Table A1 Explanation of net differences between the Exchequer 45
borrowing requirement and general government balance,
2014-2020
Table A2.1 General government budgetary forecasts 2014-2020 47
Table A2.2 General government budgetary forecasts 2014-2020 49
Table A2.3 Comparison of vintages of Receipts and Expenditures 50
Table A3 General government interest expenditure 2014-2020 51
Table A4 Projected movement in general government debt 2014-2020 51
Table A5 Breakdown of revenue 51
Table A6 Expenditure developments 52
Table A7 Contingent liabilities 52
Table A8 Budgetary plans 52
Table A9 Macroeconomic assumptions 53
Table A10 Application of the expenditure benchmark
Table B1 Macroeconomic developments 56
Table B2 Price developments 56
Table B3 Labour market developments 56
Figures
Figure 1 Economic trends 6
Department of Finance | Ireland’s Stability Programme, April 2015 Update DRAFT Page | iiiFigure 2 Transition from 2014 to 2015 of general government deficit 14
Figure 3 Fiscal trends 19
Figure 4 Composition of general government debt at end-2014 20
Figure 5 Maturity profile of long-term marketable and official debt as 23
at end-March 2015
Figure 6 Contribution to general government debt 25
Figure 7 Sensitivity analysis: Public pension expenditure as a share of 43
GDP
Boxes
Box 1 Irish Water 15
Box 2 Illustrative application of the expenditure benchmark 26
Department of Finance | Ireland’s Stability Programme, April 2015 Update DRAFT Page | ivChapter 1
Overview and General Policy Strategy
1.1 Policy Strategy
Since taking office in 2011, this Government has implemented a range of policies designed to
boost growth while maintaining prudent public finances. The accompanying Spring Economic
Statement sets out the Government’s structural reform efforts in this regard. Tax policy has been
used to support specific sectoral initiatives which have the aim of boosting employment, while
taxes on labour were reduced in the last Budget. The Government has prioritised labour market
activation and re-skilling so that those who became unemployed during the crisis are best
equipped to find work. Significant capital has been invested in the banks, and the share of that
capital that has been recovered is growing. Ensuring credit flow to viable SMEs is also a key
priority given the importance of these enterprises to employment.
It is clear that the Government’s strategy is working. Unemployment is falling and economic
activity is rising. Domestic demand contributed positively to growth last year for the first time
since the crisis. Credit advanced to the SME sector has started to rise and private investment is
growing. The cost of sovereign borrowing has fallen dramatically since July 2011, on the back of
the reductions secured in interest rates as well as increased market confidence. Fiscal
performance has been solid, with overachievement against targets in all years.
This Stability Programme sets out the Government’s macroeconomic and fiscal projections for
the next number of years. The excessive deficit will be corrected this year. Thereafter, policy will
be set in line with the requirement to move towards Ireland’s medium-term budgetary objective
which is a balanced budget in structural terms.
The accompanying National Reform Programme (NRP) sets out Ireland’s progress on Country-
Specific Recommendation (CSR) implementation, as well as progress toward the EU 2020 targets
across a range of policy measures. It also reports on other areas of reform and reports on the
use of structural funds.
1.2 Economic and Budgetary Outlook
First estimates suggest that the Irish economy grew by 4.8 per cent in GDP terms last year, with
broadly equal contributions from net exports and domestic demand, the latter expanding for the
first time since the crisis began. The economic recovery is yielding positive dividends in the labour
market where employment growth has resumed and unemployment has fallen 5 percentage
points from its peak.
The short-term outlook remains positive. Trading partner growth is picking up, while the decline
in the euro’s exchange rate and the fall in oil prices since the mid-part of last year represent
important tailwinds. With the recovery in domestic demand likely to continue, GDP growth of
Department of Finance | Ireland’s Stability Programme, April 2015 Update DRAFT Page | 14.0 per cent is forecast for this year; this would bring the level of GDP above its pre-crisis peak
with, importantly, economic activity more balanced between domestic demand and exports. For
next year, the current projection is for GDP growth of 3.8 per cent. Over the medium term,
growth is expected to move in line with the economy’s potential growth rate, estimated to be in
the region of 3 per cent per annum.
Table 1: Economic growth, general government balance and debt ratio
2014 2015 2016 2017 2018 2019 2020
Real GDP (% change) 4.8 4.0 3.8 3.2 3.2 3.0 3.0
Employment (% change) 1.7 2.2 2.2 1.9 1.9 1.8 1.7
Total Employment (‘000) 1,915 1,960 2,000 2,040 2,080 2,115 2,155
Unemployment (rate) 11.3 9.6 8.8 8.4 7.8 7.3 6.9
General government balance
-4.1 -2.3 -1.7 -0.9 -0.1 0.7 1.7
(% of GDP)
EDP target* (% of GDP) -5.1 -2.9 — — — — —
Debt ratio (year-end, % of GDP) 109.7 105.0 100.3 97.8 93.6 89.4 84.7
Net debt position (% of GDP)* 89.9 86.6
* EDP targets and net debt position are for 2014 and 2015 only
Source: 2014 - CSO; 2015 to 2020 - Department of Finance
Tax receipts have been very strong in the opening quarter of this year and as a result, the full-
year tax revenue forecast has been revised upwards by €1 billion (around 0.5 per cent of GDP).
With expenditure evolving broadly in line with expectations, and taking into account one-off
factors, a general government deficit of 2.3 per cent of GDP in 2015 is now expected, consistent
with the requirement to correct the excessive deficit this year. Further improvements in the
headline balance are foreseen post-2016 (see table 1). These projections are carried out on a
no-policy-change basis and do not preclude specific policy measures to be announced at Budget
time.
It should also be stressed that, from 2016 onwards, the requirements of the preventive arm of
the Stability and Growth Pact mean rapid progress towards our medium term budgetary
objective is needed. Progress will be assessed on the basis of two pillars: the change in the
structural balance and expenditure growth relative to the expenditure benchmark.
The debt-to-GDP ratio is now on a firm downward path, having peaked in 2013. This year, the
debt ratio should fall to 105.0 per cent of GDP. Net debt, which excludes liquid and semi-liquid
assets, is much lower at an estimated 86.6 per cent of GDP.
Department of Finance | Ireland’s Stability Programme, April 2015 Update DRAFT Page | 2Chapter 2
Economic Outlook
2.1 Summary
High-frequency data point to another year of strong output growth in Ireland. Demand in key
export markets continues to improve, while the depreciation of the euro exchange rate and the
decline in energy prices constitute important tailwinds for the economy. Business and consumer
confidence continue to improve and domestic demand should contribute positively to output
growth once again this year. GDP is projected to increase by 4.0 per cent, yielding a positive
dividend in the labour market, where unemployment should dip below 9 per cent by end-year.
2.2 Macroeconomic Outturn 2014
First estimates of full-year economic activity for 2014 were published by the Central Statistics
Office (CSO) in mid-March. These show GDP growth of 4.8 per cent (GNP growth of 5.2 per cent)
last year. Overall, the contribution to growth was more broadly balanced than in recent years,
with domestic demand growing on a full-year basis for the first time since 2007. The level of GDP
in real terms has returned to just over 2008 levels (see figure 1).
Private consumption grew by just over 1 per cent, although relatively weak consumption of
services partially offset strong consumer expenditure on goods. The recovery in investment
spending continued to gain momentum, albeit off a relatively low base. Export performance was
very strong in 2014 growing by 12.6 per cent, with the level of exports now at an all-time high.
Double-digit import growth was recorded, reflecting the high import content of final demand in
Ireland. Net exports contributed just over 2 percentage points to growth last year, with the CSO
noting that the expansion in contract manufacturing last year had a negligible impact on full-year
growth in value added.
2.3 Macroeconomic Projections 2015
Trading partner growth should be reasonably solid this year (see table 2). Incoming data suggest
continued momentum in the UK, and despite an expected weak first quarter, a strong
performance is expected once again for the US economy. Importantly, high frequency data
relating to the euro area have been somewhat better than initial expectations: lower oil prices,
the stance of monetary policy and the (partly-related) depreciation of the exchange rate all seem
to be contributing to a more positive assessment of short-term prospects for the region. Having
said that, the recovery in the euro area is at an early stage and remains fragile.
Department of Finance | Ireland’s Stability Programme, April 2015 Update DRAFT Page | 3On foot of relatively strong external demand, as well as competitiveness improvements, export
growth of 7.6 per cent is projected for this year (the slowdown relative to last year reflects the
assumption of an unwinding of contract manufacturing).
Table 2: External assumptions
2014 2015 2016 2017 2018 2019 2020
External GDP growth % change
United States 2.4 3.5 3.2 3.0 2.7 2.6 2.6
Euro area 0.9 1.3 1.9 1.7 1.6 1.6 1.6
United Kingdom 2.6 2.6 2.4 2.4 2.4 2.4 2.4
Technical assumptions
Euro-sterling exchange rate 0.81 0.72 0.72 0.72 0.72 0.72 0.72
Euro-dollar exchange rate 1.33 1.09 1.08 1.08 1.08 1.08 1.08
Brent crude (dollars per barrel) 100 61 68 71 73 73 73
Source: European Commission Winter Forecasts; projections for beyond 2016 are taken from the IMF World Economic
Outlook October 2014
Note: Exchange rates and oil prices (spot and futures) calculated on the basis of a ten-day moving average to 13 March 2015
and unchanged thereafter.
Domestic demand should contribute positively to growth once again this year. Private
consumption is forecast to grow by 2.4 per cent, on the back of increases in household incomes
as well as the assumption of a modest decline in the savings rate. Strong retail sales growth in
the opening months of this year support this assessment. Investment spending is set to increase
at a double-digit rate once again this year,
with strong contributions from all the sub-components of investment1. Government
consumption is set to grow modestly in line with fiscal objectives. Finally, imports are projected
to increase by 8.7 per cent this year.
Taking all of these factors into account, GDP growth of 4.0 per cent is forecast for this year; such
a growth rate would bring the level of GDP above its pre-crisis peak. The recovery in domestic
demand as well as the assumption of a strong performance from indigenous exporting sectors
mean that GNP should also grow strongly this year – a growth rate of 3.9 per cent is projected.
1
However any increase in purchases of aircraft from the very low levels recorded in 2014 (see chart) could boost the overall
investment growth rate considerably in 2015. The net effect on GDP would be neutral given the import content.
Department of Finance | Ireland’s Stability Programme, April 2015 Update DRAFT Page | 4Table 3: Macroeconomic prospects
2014* 2014 2015 2016 2017 2018 2019 2020
€m year-on-year per cent change
Real GDP 181,330 4.8 4.0 3.8 3.2 3.2 3.0 3.0
Nominal GDP 185,412 6.1 6.9 5.4 4.2 4.4 4.2 4.2
Real GNP 153,485 5.2 3.9 3.5 2.7 2.6 2.5 2.5
Components of GDP €m year-on-year per cent change (real)
Private
1.1 2.4 2.5 1.4 1.3 1.3 1.3
consumption 82,732
Government
0.1 1.1 1.6 1.0 1.0 1.0 1.0
consumption 26,309
Investment 29,251 11.3 15.3 12.1 8.1 4.7 3.9 4.0
Stock changes (% of
1,733 1.0 0.6 0.4 0.2 0.2 0.2 0.2
GDP)**
Exports 207,846 12.6 7.6 4.8 4.3 4.3 4.3 4.3
Imports -167,527 13.2 8.7 5.4 4.2 3.7 3.8 3.9
Contributions to real GDP growth annual percentage point contribution
Domestic demand 2.3 3.7 3.5 2.3 1.7 1.5 1.5
Stock changes 0.5 -0.3 -0.2 -0.1 0.0 0.0 0.0
Net exports 2.2 0.6 0.5 1.0 1.5 1.5 1.4
Current prices (nearest €25m) € millions
GDP 185,400 198,275 208,900 217,775 227,325 236,900 246,775
GNP 158,450 168,950 176,850 182,375 188,250 193,950 199,875
Source: 2014 - CSO; 2015 to 2020 - Department of Finance.
Notes: Rounding can affect totals.
*Expenditure components are shown in constant 2012 prices except for nominal GDP which is in current prices
**Stock changes are assumed unchanged 2017-2020 in nominal terms but fall as a share of GDP by the end of the forecast
horizon.
Department of Finance | Ireland’s Stability Programme, April 2015 Update DRAFT Page | 5Figure 1: Economic Trends
Real GDP level 2007-2014 Goods and services exports
Source: CSO Source: CSO
Retail Sales Contributions to Investment Growth
Source: CSO Source: CSO, Department of Finance
HICP Inflation Labour Market Developments
Source: CSO, Department Finance Source: CSO
Department of Finance | Ireland’s Stability Programme, April 2015 Update DRAFT Page | 62.4 Medium-Term Growth Prospects 2016 to 2020
Turning to next year where the current indications are for continued economic recovery.
Forecasts from the IMF and others point to further solid growth in key trading partners which, in
turn, should support a further expansion of exports, with a renewed shift in the balance of
exports towards services. Further growth in household income should support consumer
spending, although the need to repair household balance sheets will continue to restrain
expenditure at least to some extent. The investment-to-GDP ratio is assumed to increase further,
given that current investment levels (relative to economic activity) remain below historical
norms.
On the basis of estimated potential output based on the harmonised methodology, the output
gap is assumed to turn positive this year before turning negative towards the end of the forecast
horizon; growth is assumed to evolve broadly in line with the potential growth rate of the
economy which, according to the harmonised methodology applied at an EU level, is in the region
of 3 per cent per annum over the second half of this decade.
Current account
The current account recorded a surplus of 6.2 per cent of GDP in 2014, up from 4.4 per cent in
2013. Last year saw strong growth in the trade balance which was not matched by growth in the
income balance2. Income inflows last year grew particularly strongly and this effect is likely to
carry over into 2015 somewhat, pushing up the current account balance this year. Over the
medium term, the current account surplus is likely to fall slowly, as higher levels of investment
lead to a narrowing of the domestic saving-investment gap.
2The CSO has indicated that the impact of ‘re-domiciled plcs’ on the year-on-year growth in the income balance fell out in 2014,
with the effect essentially the same as in 2013. This effect is estimate to add about 4 percentage points to the level of the current
account balance. For more see FitzGerald (2013) “The Effect of Re-domiciled Plcs on Irish Output Measures and the Balance of
Payments”: “https://www.esri.ie/UserFiles/publications/RN20130102.pdf
Department of Finance | Ireland’s Stability Programme, April 2015 Update DRAFT Page | 7Table 4: External balance
2014 2015 2016 2017 2018 2019 2020
Current account (% of GDP) 6.2 7.2 6.4 5.5 5.0 4.5 4.0
Current account (% of GNP) 7.2 8.5 7.5 6.6 6.1 5.5 4.9
Of which: (% of GDP)
- Balance on goods and services 21.4 22.6 22.3 22.3 22.7 23.1 23.4
- Income Balance -15.2 -15.4 -15.9 -16.7 -17.7 -18.6 -19.4
Source: 2014 - CSO; 2015 to 2020 - Department of Finance. All data on a BPM6 basis.
The CSO has indicated that a change to how aircraft leasing activity is recorded in the national
accounts and balance of payments will be outlined in the coming months. As such, the risk of
revision to the current account forecasts from changes to statistical methodology is high.
2.5 The Labour Market
Labour market dynamics show continued evidence of strengthening. Latest available data
indicate nine successive quarters of annual employment growth with employment levels some
95,000 (or about 5 per cent) above the trough seen in 2012. Since the low point in early 2012, a
third of all jobs lost during the crisis have now been regained.
The composition of employment growth is also showing signs of strengthening with growth
exclusively driven by gains in full-time employment. Although part-time employment has begun
to fall (and indicators of part-time underemployment prevalent during the crisis are beginning to
abate), the response of participation rates has remained muted. Despite a positive contribution
from participation to labour force movements in 2013, this trend then reversed in 2014, which is
somewhat unusual at this stage of the economic cycle in Ireland.
The outlook for employment remains relatively strong, with growth of 2.2 per cent projected for
this year. The seasonally-adjusted unemployment rate has fallen consistently since the second
quarter of 2012, reaching 10.4 per cent in the final quarter of 2014. More up-to-date evidence
from the Live Register suggests the standardised unemployment rate fell to 10.0 per cent in
March.
Over the second half of this decade, employment growth averaging around 40,000 (about 2 per
cent) jobs per annum is anticipated. Alongside employment growth, aggregate labour supply is
expected to respond positively with the dominant contribution coming through the demographic
channel, including net inward migration over the medium term.
Earnings data point towards a recovery in wages across a number of sectors, most notably within
the private sector. Pay bill developments will be driven by a combination of trends in hourly pay
Department of Finance | Ireland’s Stability Programme, April 2015 Update DRAFT Page | 8and growth in hours worked. A projected uplift in hours worked, reflecting in part the
consolidation towards full-time employment growth, alongside modest growth in wages per
employee suggest stable pay bill developments over the forecast horizon.
Table 5: Labour market developments
2014 2014 2015 2016 2017 2018 2019 2020
('000s) year-on-year % change (unless otherwise stated)
Employment 1,915 1.7 2.2 2.2 1.9 1.9 1.8 1.7
Unemployment rate (QNHS basis) 243 11.3 9.6 8.8 8.4 7.8 7.3 6.9
Labour productivity (GDP per person
3.0 1.7 1.5 1.2 1.2 1.2 1.2
employed)
Compensation of employees* 3.2 4.6 5.2 4.6 4.6 4.5 4.6
Compensation per employee* 1.4 2.3 2.9 2.6 2.6 2.7 2.8
*Non-agriculture sector.
Source: 2014 - CSO; 2015 to 2020 - Department of Finance.
2.6 Price Developments
As measured by the Harmonised Index of Consumer Prices (HICP), inflation averaged 0.3 per cent
last year. This moderate rate of inflation can be attributed to falling oil prices which more than
halved during the second half of last year.
Inflationary pressures are expected to remain relatively muted again this year, with headline
inflation averaging -0.4 per cent in the first quarter. Futures prices for oil suggest that the drag
from energy prices will continue until the second half of the year. Core inflation (i.e., excluding
energy and unprocessed food), which gives a better indication of underlying developments in the
economy, averaged 1.0 per cent in the first quarter. Inflation is being driven by increases in
services prices, reflecting both administered price increases as well as the general pick-up in
domestic demand. Taking all of these factors into account, HICP inflation is expected to average
0.2 per cent this year before accelerating next year as the impact of falling energy prices wanes
and domestic demand strengthens further.
Department of Finance | Ireland’s Stability Programme, April 2015 Update DRAFT Page | 9Table 6: Price developments
% change 2014 2015 2016 2017 2018 2019 2020
GDP deflator 1.2 2.8 1.5 1.0 1.2 1.2 1.2
Private consumption deflator 1.6 0.6 1.3 1.6 1.9 1.9 1.9
Harmonised index of consumer prices (HICP) 0.3 0.2 1.1 1.5 1.7 1.9 1.9
Export price deflator (goods and services) 0.3 3.1 0.9 0.8 0.8 0.8 0.8
Import price deflator (goods and services) 0.6 1.6 0.7 1.2 1.2 1.2 1.2
Source: 2014 - CSO; 2015 to 2020 - Department of Finance.
In terms of the GDP deflator – which accounts for prices changes in all components of demand
and, as such, is the broadest measure of price developments in the economy – an increase of 2.8
per cent is forecast for this year. This reflects a large positive terms-of-trade effect, mainly due
to recent exchange rate developments. This is expected to moderate next year before turning
negative in the outer years. The private consumption deflator will continue to record higher
growth than the HICP in the near term due to the impact of rising private and imputed rents and
their weight in the private consumption deflator basket.
Department of Finance | Ireland’s Stability Programme, April 2015 Update DRAFT Page | 10Chapter 3
Fiscal Outlook
3.1 Fiscal Outturn 2014
Budget 2015 projected a deficit of 3.7 per cent of GDP for last year. The actual outturn is now
estimated at 4.1 per cent of GDP (see figure 3 for recent performance against EDP targets). There
are a number of reasons for the changes since Budget day but a significant portion reflects policy
decisions on the part of the Government which impacted the timing of certain receipts and
expenditures.
The tax revenue end-year outturn for 2014 was higher than expected at Budget time. For the
full-year 2014, tax revenue grew by 9.2 per cent with significant increases across all the major
tax heads. Tax revenues finished the year €242 million above the forecast set out on Budget day
2015.
Over the course of the year, the strongest performing tax heads against profile were capital gains
tax and stamp duties. At the same time, income tax, VAT and corporation tax receipts recorded
significant growth in year-on-year terms.
Overall, net voted expenditure for the year, at €42.2 billion, was €841 million (2 per cent) above
profile. In comparison to 2013, net voted expenditure was down €848 million (2 per cent). Gross
voted expenditure of €54 billion was €1,017 million (1.9 per cent) above profile. In year-on-year
terms, gross voted expenditure was down €507 million (0.9 per cent).
3.2 Fiscal Outlook 2015
Budget 2015 targeted a deficit of 2.7 per cent of GDP in 2015, well inside the 3 per cent of GDP
deficit limit. Developments in the intervening period have been primarily positive and the deficit
is now forecast to be in the region of 2.3 per cent of GDP.
Tax performance
Taking account of the cuts in taxation announced in Budget 2015, tax revenue was forecast to
increase by around 4.5 per cent year-on-year in 2015 (excluding the impact of the levy on pension
funds3). The performance through the first quarter of 2015 has been positive (see recent
performance in figure 3) and has exceeded expectations with taxes ahead of profile by €545
million or 5.5 per cent, which represents a year-on-year increase of €1,238 million (13.4 per cent).
3€740 million was collected in 2014 in respect of the levies on pension fund assets. In 2015, these levies are being reduced from
a combined level of 0.75 per cent in 2014 to a rate of 0.15 per cent and is legislated to end thereafter. This results in a distorted
picture when comparing headline year-on-year growth rates.
Department of Finance | Ireland’s Stability Programme, April 2015 Update DRAFT Page | 11Of particular note is the strong performances across of all of the major tax heads (see table 7
below). Income tax, the largest tax head, is up 7.7 per cent in year-on-year terms and €136
million or 3.3 per cent above profile. The year-on-year performance is primarily due to strong
PAYE tax receipts and is consistent with the recovering labour market, despite income tax
reductions designed to cost €490 million introduced in Budget 2015.
Table 7: Analysis of taxation receipts – cumulative performance against profile
end-March end-March excess/ excess/
Exchequer Tax Receipts 2015 outturn 2015 target shortfall shortfall
€m €m €m %
Income Tax (including USC) 4,241 4,105 136 3.3
VAT 3,797 3,774 23 0.6
Corporation Tax 555 298 257 86.3
Excise 1,177 1,150 27 2.3
Stamps 236 179 57 31.8
Capital Gains Tax 68 71 -4 -5.0
Capital Acquisitions Tax 30 30 0 0.4
Customs 75 59 16 26.2
Levies 0 0 0 n/a
Local Property Tax 244 257 -14 -5.3
Unallocated Tax Deposits 46 0 46 n/a
Total 10,469 9,924 545 5.5
Source: Department of Finance.
Table 8: Analysis of taxation receipts – cumulative year-on-year performance
end-March end-March year-on-year year-on-year
Exchequer Tax Receipts 2015 2014 change change
€m €m €m %
Income Tax (including USC) 4,241 3,939 302 7.7
VAT 3,797 3,366 431 12.8
Corporation Tax 555 256 299 116.7
Excise 1,177 1,104 73 6.6
Stamps 236 151 85 56.2
Capital Gains Tax 68 98 -30 -31.0
Capital Acquisitions Tax 30 30 0 0.3
Customs 75 47 28 60.1
Levies 0 0 0 40.9
Local Property Tax 244 215 29 13.5
Unallocated Tax Deposits 46 26 20 79.9
Total 10,469 9,232 1,238 13.4
Source: Department of Finance.
As expected, the increase in personal consumption has boosted VAT and excise duties
performance, with receipts up €23 million (0.6 per cent) and €27 million (2.3 per cent)
Department of Finance | Ireland’s Stability Programme, April 2015 Update DRAFT Page | 12respectively above profile. In year-on-year terms, VAT receipts are up €431 million or 12.8 per cent and excise duties are up 6.6 per cent. Strong car sales in the first quarter (up approximately 30 per cent year-on-year) are a significant contributory factor. In addition, corporation tax receipts of €555 million were recorded to end-March, some €257 million more than had been profiled. However, some of the over-performance can be attributed to a series of unexpected payments. The other contributing factor is improved corporate profitability. While the performance in the first three months of the year is very encouraging, a number of risks remain, both specific and more general, to the tax forecast. Nevertheless, the strong performance gives confidence that the Budget 2015 forecast for tax revenues for 2015 of €42.3 billion will be exceeded and the new forecast is for an additional €1.0 billion i.e. €43.3 billion. However, in line with historical practice, monthly reporting of the Exchequer performance will continue to be against the original Budget 2015 profiles. Non-tax revenue performance Turning to estimates of non-tax revenue for 2015, this has increased by almost €0.4 billion from the Budget 2015 estimate. This is primarily driven by increased surplus income from the activities of the Central Bank of Ireland (€0.3 billion). In terms of capital resources, the estimate for 2015 has increased by €1.1 billion. Just over €1.6 billion, relating to the proceeds from the sale of Bank of Ireland preference shares in 2013, was transferred from the National Pension Reserve Fund (NPRF) to the Exchequer in March of this year to part-finance the early repayment of the IMF loan facility. Offsetting this to some extent, the sinking fund payment was eliminated in Finance Bill 2014 (€0.6 billion). The annual sinking fund payment, while appropriate to the era of its introduction, had in more recent times proved to be a circuitous procedure with a significant administrative burden and this is why it was removed. It was also Exchequer and general government neutral. Expenditure The current estimate for central fund expenditure for 2015 has been reduced by €1.2 billion. Reduced interest expenditure accounts for almost €0.5 billion of the reduction on foot of an improved interest rate environment and earlier-than-profiled repayment of the IMF loan facility. Effectively, this involves the replacement of relatively costly IMF loans with cheaper market based financing. The remainder of the reduction is due to the removal of the annual sinking fund payment. The Revised Estimates for Public Services 2015 (REV) sets out the detailed allocations for all Government Departments. Total gross voted expenditure for 2015 is €53.2 billion with net voted expenditure projected to be €41.7 billion. The gross amount allocated for 2015 reflects the disestablishment of the Health Service Executive (HSE) Vote in line with the provisions of the Health Service Executive (Financial Matters) Act 2014. The expenditure of the HSE is now being met through a grant from the Minister for Health and the technical changes arising from its disestablishment are reflected in the Revised Estimates Volume (REV). Department of Finance | Ireland’s Stability Programme, April 2015 Update DRAFT Page | 13
Gross voted expenditure up to the end of March 2015 was €62 million (0.5 per cent) lower than
profiled. Net voted expenditure was €146 million (1.4 per cent) below profile driven by PRSI
receipts to the Social Insurance Fund being 6.4 per cent ahead of profile in the first quarter.

3.3 Transition of the Deficit

 Figure 2: Transition from 2014 to 2015 of general government deficit

 Source: Department of Finance;
 Diagram not drawn to scale; all variables as a percentage of GDP

Transition from 2014 to 2015 deficit
Figure 2 begins with the 2014 general government deficit of 4.1 per cent of GDP. All further
adjustments display the difference between the 2014 and 2015 items in order to arrive at the
projected 2015 deficit figure. A negative adjustment improves the deficit while a positive
adjustment has the opposite effect. Changes are shown on a general government basis.
      - With year-on-year nominal GDP growth of 6.9 per cent there is a denominator-effect
         improvement to the deficit ratio of about 0.3 percentage points.
      - Net-voted expenditure is expected to be roughly €340 million lower in 2015 than 2014.
         The primary reason for the difference is increased PRSI receipts due to higher
         employment figures.
      - General government taxes are expected to be €2.1 billion higher than those collected
         in 2014. This increase is predominantly as a result of higher economic activity and
         consequent higher employment figures. However, this figure also encompasses the

 Department of Finance | Ireland’s Stability Programme, April 2015 Update DRAFT      Page | 14
effect of some Budget 2015 measures which included reductions to some taxes,
particularly certain aspects of income tax.
- Projected interest expenditure for 2015 is approximately €640 million lower than 2014
due to the early repayment of IMF lending and subsequent re-financing (including of
other debt) at lower rates, as well as the lower interest rate environment.
- Other items include dividend payments received from commercial-state bodies and the
Central Bank of Ireland.
- Other bodies comprise the non-market public corporations, extra-budgetary funds,
Irish Water, IBRC and the NPRF.
Box 1: Irish Water
As a result of the approach agreed between the CSO and Eurostat during the 2014 EDP dialogue visit,
Irish Water has provisionally been classified within general government for the March EDP results,
pending a final classification decision by Eurostat. As such, for consistency, Irish Water has also been
included within general government in this publication. However, it should be noted that a CSO
classification proposal on Irish Water is currently with Eurostat. This is a closed process and CSO now
will await the final adjudication of Eurostat. The final decision will be reflected in the October 2015 EDP
results and the Budget 2016 publication.
Pending this final adjudication, it is prudent for forecasting purposes to treat all of Irish Water’s forecast
expenditure as general government expenditure on a provisional basis. Revenues generated by Irish
Water are also included in general government revenue with all transactions between government
bodies and Irish Water being consolidated.
Similarly, borrowing required for Irish Water expenditure is included in general government debt on a
provisional basis.
Table 9: Impact of Irish Water on general government balance and debt 2014-2020
2014 2015 2016 2017 2018 2019 2020
Net impact on GGB (€ billion) -0.34 -0.58 -0.39 -0.26 -0.29 -0.45 -0.37
Net impact on GGB (pp of GDP) -0.18 -0.29 -0.19 -0.12 -0.13 -0.19 -0.15
Net impact on GG debt (pp of GDP)1 0.08 0.29 0.47 0.57 0.67 0.83 0.95
Source: Department of Finance, CSO, the Department of Environment, Community and Local Government (forecasts for 2017-
2020 provided subject to future budgetary and regulatory review).
1Two-year bridging facility provided by National Pensions Reserve Fund (NPRF) in 2013 and extended in 2014 had no impact
on general government debt.
Table 9 highlights the impact on the deficit and debt of including Irish water in general
government. The profile of the impact on the deficit is heavily influenced by the capital
investment plans of Irish Water.
Department of Finance | Ireland’s Stability Programme, April 2015 Update DRAFT Page | 153.4 Fiscal Outlook 2016 to 2020
In terms of the outlook for 2016, assuming a budgetary package of €1.2 billion, evenly split
between taxation and expenditure, the forecast deficit is 1.7 per cent of GDP. This represents a
continued improvement on the estimated 2015 deficit of 2.3 per cent. Most of this improvement
is attributable to buoyant tax receipts on the back of a growing economy.
The post 2016 projections revert to a no-policy-change scenario other than a provision for
demographic pressures and indexation of the income tax system4. On this basis, the forecast is
a broadly balanced budget in headline terms by around 2018. Notwithstanding the limitations
associated with a no-policy-change scenario, projections suggest an average annual
improvement in the structural balance of over 1 percentage point per annum over the period
2015 to 2020.
Tax performance
The tax forecast for 2016 takes account of the taxation package outlined above and the impact
of previous budgetary measures. As the SPU is setting the broad parameters of the fiscal space
for 2016, specific budgetary measures have not been reflected in the document. Rather, an
assumption is made that the €0.6 billion in tax measures are reductions in income tax. There is
also positive buoyancy of approximately €0.3 billion as a result of the budgetary package of €1.2
billion and this primarily manifests itself in the consumption taxes.
Beyond 2016, taxation is estimated to continue to grow broadly in line with nominal GDP growth
when the costs of indexation are excluded. Nominal GDP growth is expected to average 4.3 per
cent over the period. It is worth pointing out that there is a significant decline in the revenue
growth rate in 2017 and a corresponding increase in 2018. However, this is primarily due to a
Single Euro Payment Area (SEPA) and the available number of banking days at the end of 2017.
As a result approximately €1.0 billion of taxes will be delayed from 2017 into 2018. While this
does impact on the Exchequer tax revenue forecast, it does not impact on the general
government balance as these taxes will be accrued back to 2017.
In relation to some of the specific tax heads, income tax will continue to become more important
as a proportion of the total tax take on the assumption of continued recovery in the labour
market and wage developments (see figure 3). In addition, the consumption taxes - VAT and
excise - are expected to grow in line with growth in domestic demand over the period on the
back of increased household incomes and personal consumption.
The traditional estimated relationship between nominal GDP growth and tax revenue was a
unitary elasticity. This means that every one percentage point change in nominal GDP gave an
additional one percentage point of tax. In recent years, the growth in tax revenue has been
4
There is a technical assumption of indexation of the income tax system of around 2 per cent, the medium-term
increase in non-agricultural wages
Department of Finance | Ireland’s Stability Programme, April 2015 Update DRAFT Page | 16greater than the growth in nominal GDP, implying an elasticity of greater than one. While it is
expected that the elasticity will return to historical norms, this could continue in the short run
and provide some upside to the forecasts.
Non-tax revenues
Annual non-tax revenue receipts are expected to decline significantly, by €1.0 billion to €2.0
billion, over the 2016 to 2020 period. One-off dividends as a result of the current asset disposal
programme, mainly from the commercial semi-states, are expected to cease while the surplus
income received from the Central Bank will return to more normal levels after the peak forecast
for 2015. This reduction in non-tax revenues is one of the key reasons why the ratio of revenue
to GDP declines over time.
Capital resources will benefit from the redemption of €2 billion of contingent convertible capital
notes (CoCos) in AIB and PTSB in 20165 before returning to an annual amount of just under €1
billion. As the CoCos were considered financial transactions, there is no benefit to the general
government balance as a result of the payback, although the transactions are debt-reducing.
More generally, it should be noted that the vast bulk of capital resources do not impact the
general government balance.
Expenditure
Central Fund expenditure is forecast to decline over the forecast horizon from €9.9 billion to €9.7
billion, driven by a decrease in assumed interest rates over the coming years, somewhat offset
by an increase in the contribution to the EU budget. The contribution to the EU Budget is largely
determined on the basis of Ireland’s gross national income (GNI) - Irish GNI is set to grow at a
quicker pace than the EU average, and as such, Ireland will be making an increasing contribution.
Total gross voted expenditure in 2016 is estimated at €53.7 billion with gross voted current
expenditure amounting to €50.0 billion. Relative to 2015, gross voted current expenditure
increases by €0.6 billion, after account is taken of the crystallisation of an accrual relating to
Exchequer pay and pensions in 2015.
Post-2016, the expenditure projections on a no-policy-change basis include an additional amount
of €0.3 billion in voted current expenditure each year to accommodate demographic pressures,
primarily in Social Protection, Health and Education. The capital expenditure ceilings post 2017
are left unchanged in nominal terms. This is a technical assumption pending publication of the
capital review.
5
The fiscal forecasts do not reflect the expected early redemption of the PTSB CoCos signalled in the SES.
Department of Finance | Ireland’s Stability Programme, April 2015 Update DRAFT Page | 17Table 10: Budgetary projections 2015-2020
€ million 2014 2015 2016 2017 2018 2019 2020
CURRENT BUDGET
Expenditure
Gross Voted Current
50,455 49,715 50,045 50,345 50,645 50,945 51,245
Expenditure
Non-Voted (Central Fund)
10,730 9,770 9,895 9,595 9,795 9,810 9,690
Expenditure
Gross Current Expenditure 61,185 59,485 59,940 59,940 60,440 60,755 60,935
less Expenditure Receipts and
11,435 11,205 11,135 11,450 11,760 12,150 12,560
Balances
Net Current Expenditure 49,750 48,280 48,805 48,490 48,680 48,605 48,375
Receipts
Tax Revenue 41,280 43,300 45,290 45,865 49,925 50,835 52,875
Non-Tax Revenue 2,965 3,350 3,090 2,280 2,080 2,035 2,050
Net Current Revenue 44,245 46,650 48,380 48,145 52,005 52,870 54,925
CURRENT BUDGET BALANCE -5,505 -1,630 -425 -345 3,325 4,265 6,550
CAPITAL BUDGET
Expenditure
Gross Voted Capital 3,550 3,670 3,690 3,785 3,785 3,785 3,785
Non-Voted Expenditure 1,635 1,215 900 890 900 885 885
Gross Capital Expenditure 5,185 4,885 4,590 4,675 4,685 4,670 4,670
less Capital Receipts 350 300 300 300 300 300 300
Net Capital Expenditure 4,835 4,585 4,290 4,375 4,385 4,370 4,370
Capital Resources 2,155 2,750 2,930 980 990 990 980
CAPITAL BUDGET BALANCE -2,680 -1,835 -1,360 -3,395 -3,395 -3,380 -3,390
EXCHEQUER BALANCE -8,185 -3,465 -1,785 -3,740 -70 885 3,160
GENERAL GOVERNMENT
BALANCE -7,630 -4,610 -3,580 -2,055 -290 1,645 4,075
% of GDP -4.1 -2.3 -1.7 -0.9 -0.1 0. 7 1.7
Source: Department of Finance
Notes:
- Figures may not sum due to rounding
- This table is prepared on a cash basis. The comparison between 2015 and 2016 is impacted by an amount of €270m that
represents the crystallisation of a pay and pensions accrual. Excluding this amount the year on year increase in voted
current expenditure is €600m.
- The voted expenditure amounts do not include a provision to cover inflationary pressures. Each 1% on the Exchequer pay
& pensions bill costs €175m and 1% on Social Protection payments amounts to €185m.
- It is assumed that capital expenditure increases in line with published figures into 2017. Post 2017, the allocation is left
unchanged in nominal terms. This is a technical assumption and these allocations will be revised upwards when the Capital
Review is published in due course.
Department of Finance | Ireland’s Stability Programme, April 2015 Update DRAFT Page | 18Figure 3: Fiscal trends
Exchequer Receipts General Government Balance and Ceilings
Source: Department of Finance Source: Department of Finance
Revenue, Primary Expenditure and Balance Revenue Composition
Source: Department of Finance Source: Department of Finance
Department of Finance | Ireland’s Stability Programme, April 2015 Update DRAFT Page | 193.5 Debt Developments
Debt position and outlook
The general government debt-to-GDP ratio has increased significantly since 2007, peaking at
123.2 per cent of GDP in 2013. It is now on a firm downward trajectory. The CSO’s current
estimate of general government debt at the end of 2014 is €203.3 billion or 109.7 per cent of
GDP. This is consistent with the estimate of €203.2 billion projected in the Budget 2015 last
October.
Figure 4 shows the compositional breakdown of the end-2014 stock of debt. The diagram shows
that 57 per cent of government debt was held in the form of government bonds. Of the total
stock of debt 12 percentage points relates to the floating rate bonds issued in 2013 to replace
the IBRC promissory notes held by the Central Bank of Ireland. Funding sourced under the EU-
IMF Programme – which consists of loans from the IMF; the European Financial Stabilisation
Mechanism (EFSM); the European Financial Stability Facility (EFSF); as well as bilateral loans from
the UK, Sweden and Denmark - comprised a further 30 per cent of the stock of government debt
at end-2014. This figure reflects the early repayment to the IMF – in December 2014 – of SDR
7.64 billion6 (approximately €9 billion). State savings, short term paper and other debt make up
the remaining 13 per cent of general government debt.
Figure 4: Composition of general government debt at end-2014
Programme Assistance,
€60.2 bn Other Government
Bonds, €91.8 bn
Other, €3.6 bn
Exchequer Bills /
Notes & Other Short
Term Debt held by
the NTMA, €4.1 bn
State Savings, €19.1 bn Floating Rate Bonds,
€24.5 bn
Source: Department of Finance, NTMA and CSO
6IMF loans are denominated in Special Drawing Rights (SDRs), an international reserve asset created by the IMF, the value of
which is based on a basket of four key international currencies; €, ¥, £STG and US$. A further SDR 8.05 billion was repaid in Q1
2015.
Department of Finance | Ireland’s Stability Programme, April 2015 Update DRAFT Page | 20General government debt is projected at €208.2 billion or 105.0 per cent of GDP at end-2015.
The improvement in the debt ratio in 2015 is 4.7 percentage points. In terms of debt dynamics,
there was very little change in the nominal stock of debt between 2014 and 2015 however
nominal growth is set to exceed the average interest rate by over 3 percentage points this year
which reduces the debt ratio. A primary balance is set to be recorded this year, with the balance
set to further improve over the forecast horizon. Government debt is forecast to fall towards
100 per cent of GDP by end 2016. Government debt would fall below 100 per cent of GDP in
2016 as a result of any asset disposals, most likely the sale of Government stakes in the banking
sector.
The projected evolution of general government debt for Ireland over the period 2014-2020 is
shown in table 11. The table shows that that the debt-to-GDP ratio is improving at a rate greater
than the minimum reduction of five per cent of the gap to 60 per cent per year (averaged over
three years) which is required under the debt criterion of the Stability and Growth Pact (SGP).
Table 11: General government debt 2014-2020
2014 2015 2016 2017 2018 2019 2020
General government debt (€ bn) 203.3 208.2 209.5 213.0 212.7 211.7 208.9
Debt-to-GDP ratio (%) 109.7 105.0 100.3 97.8 93.6 89.4 84.7
Annual improvement in debt-to- -13.5 -4.7 -4.7 -2.5 -4.2 -4.2 -4.7
GDP ratio (%)
Source: Department of Finance, NTMA (National Debt data provider) and CSO
Based on a set of prudent macroeconomic and fiscal assumptions, general government debt is
likely to reach 60 per cent of GDP around the middle of the next decade. Debt interest costs are
set to fall to approximately 10 per cent of general government revenues in 2015, down from 13
per cent in as recently as 2013. The early repayment of the portion of IMF loans which were
subject to the highest rate of interest is a key factor aiding this reduction. Over the medium term
the ratio of debt interest to general government revenue is expected to decline further to around
9 per cent.
Gross debt and net debt
General government debt, as defined under the Excessive Deficit Procedure (EDP) regulation, is
a gross measure of government liabilities. Net general government debt (obtained by deducting
the value of the financial assets corresponding to the categories of financial liabilities which
comprise general government gross debt) is reported in table 12. The assets deducted include:
Exchequer cash and liquid assets, NPRF cash and investments, IBRC cash and loan assets and
other cash and assets held by central government.
Department of Finance | Ireland’s Stability Programme, April 2015 Update DRAFT Page | 21Table 12: General government debt and net general government debt 2014 and 2015
End-year 2014 2015
% of GDP
General government debt 109.7 105.0
EDP debt instrument assets 19.8 18.4
Net debt position 89.9 86.6
Source: Department of Finance, NTMA , and CSO
Credit ratings
During 2014, Ireland enjoyed a number of credit rating upgrades. Ireland now has an investment
grade credit rating with all of the main rating agencies:
Moody’s restored Ireland to investment grade status with a rating of Baa3 and a positive
outlook in January 2014. This was followed in May 2014 by a further two-notch upgrade
to Baa1.
Standard & Poor’s upgraded Ireland’s sovereign credit rating to A- in June 2014 and then
subsequently upgraded the rating again, to A in December.
Fitch also upgraded Ireland’s rating to A- in August 2014.
-
Funding Developments
The NTMA announced in December 2014 that it planned to raise €12 - €15 billion in long-term
Government bonds over the course of 2015. In the first quarter of the year, a total of €9.5 billion
was raised:
In January, the NTMA sold €4 billion of a new 7-year benchmark bond maturing in 2022
through syndication. The funds were raised at a yield of 0.867 per cent.
In February, the NTMA raised a further €4 billion, at a yield of 2.088 per cent through the
syndicated sale of a new 30-year euro benchmark bond, the first such bond issued by
Ireland.
February also saw the first bond auction of the year with €500 million of the benchmark
15-year bond7 issued at a yield of 1.563 per cent.
The bond auction in March saw another €1 billion of the 30-year benchmark bond sold.
The yield was 1.307 per cent.
Figure 5 shows the maturity profile of Ireland’s long-term marketable and official debt –
Government bonds and EU-IMF Programme loans – at end-March 2015.
The chart reflects the early repayment, between December 2014 and March 2015, of the portion
of the IMF loan (SDR 15.7 billion or just over €18 billion) which was subject to the highest rate of
interest. The residual balance on the IMF loan now stands at SDR 3.8 billion (approximately €4.8
7 A new 15-year benchmark bond, maturing in 2030, was issued in November 2014.
Department of Finance | Ireland’s Stability Programme, April 2015 Update DRAFT Page | 22billion) and is subject to interest at the SDR interest rate plus a margin of 1 per cent. The balance
of the IMF loan is due to amortise over the period 2021-2023.
Following the maturity extensions on the European portion of the loans granted in 2013, the first
of the EFSF maturities is not until 2029 while it is not expected that Ireland will have to refinance
any EFSM loans before 20278. However, the bilateral loans from the UK, Sweden and Denmark
which formed part of the EU-IMF Programme do begin to mature over the current forecast
horizon. In total €4.6 billion of bilateral loans are due to mature over the course of 2019 and
2020.
The Exchequer Borrowing Requirement (EBR) is narrowing and is projected to drop to below €2
billion in 2016. However, the current outstanding balance of the April 2016 Treasury Bond
maturity is €8.1 billion. Given the front-loaded nature of the EBR, the NTMA is targeting cash
and other short-term investment balances of €11-12 billion at end-2015, similar to the end-2014
level.
Looking further ahead, there are significant bond redemptions over the medium term which must
be adequately and prudently funded. The current outstanding balance on the five benchmark
bonds maturing over the period 2018 to 2020 is €50 billion.
Figure 5: Maturity profile of long-term marketable and official debt as at end-March 2015
25
20
15
10
€ billion
5
0
-5
Fixed Rate/Amortising Bonds Floating Rate Bonds IMF Bilateral* EFSF ** EFSM ***
Source: NTMA
Notes: The figures underpinning the chart are unaudited and include the effect of currency hedging transactions.
* Bilateral loans were provided from the UK, Sweden and Denmark.
** EFSF loans reflect the maturity extensions agreed in June 2013.
*** EFSM loans are subject to a seven-year extension. It is not expected that Ireland will have to refinance any of its EFSM
loans before 2027. However, the revised maturity dates of individual EFSM loans will only be determined as they approach
their original maturity dates. The original EFSM maturities are reflected in the chart above.
8 The revised maturity dates of individual EFSM loans will only be determined as they approach their original maturity dates, the
first of which is in December 2015 (€5 billion).
Department of Finance | Ireland’s Stability Programme, April 2015 Update DRAFT Page | 23Debt dynamics and the stock-flow adjustment
In analysing debt developments, it is helpful to consider the components of the stock-flow
adjustment. These are effects that change the debt ratio which are not due to the deficit of the
given year. The main component of the stock-flow adjustment, in nominal terms, is the change
in cash and other financial assets. An increase, for instance, indicates borrowing beyond the need
to fund the deficit. Operations in financial instruments such as loans, investments and other
equity transactions do not affect the general government deficit but impact on funding
requirements. These operations are also part of the stock-flow adjustment. Table 13 sets out
the stock-flow adjustment over the forecast horizon.
Table 13: General government debt developments
% of GDP 2014 2015 2016 2017 2018 2019 2020
Gross debt 109.7 105.0 100.3 97.8 93.6 89.4 84.7
Change in gross debt (=1+2+3) -13.5 -4.6 -4.7 -2.5 -4.2 -4.2 -4.7
Contributions to change in gross debt ratio:
1. General Government Balance 4.1 2.3 1.7 0.9 0.1 -0.7 -1.7
2. Stock-flow adjustment -10.6 0.1 -1.1 0.7 -0.2 0.3 0.5
3. Nominal GDP contribution to Δ in
-7.1 -7.1 -5.3 -4.1 -4.1 -3.8 -3.6
debt ratio
Composition of GGB
4. General Government Balance -4.1 -2.3 -1.7 -0.9 -0.1 0.7 1.7
5. Interest expenditure -4.0 -3.5 -3.2 -3.2 -3.1 -2.9 -2.7
6. Primary balance ( = 4 - 5 ) -0.1 1.1 1.5 2.2 2.9 3.6 4.3
Composition of stock-flow adjustment
7. Change in liquid assets -4.8 0.3 -0.1 -0.2 -0.2 -0.2 0.0
8. Interest adjustments 0.1 0.2 0.2 0.1 0.1 0.1 0.1
9. Equity transactions 0.2 -0.1 -1.3 0.0 0.0 0.0 0.0
10. Accrual adjustments -0.1 0.3 0.2 0.6 -0.3 0.2 0.1
11. Impact of NPRF 0.2 -0.6 0.2 0.2 0.2 0.2 0.2
12. Impact of IBRC -6.2 -0.4 0.0 0.0 0.0 0.0 0.0
13. Collateral held 0.0 0.0 -0.1 -0.1 0.0 0.0 0.0
14. Net discounts 0.1 0.2 0.1 0.1 0.1 0.1 0.1
15. Other -0.1 0.2 -0.2 0.0 0.0 0.0 0.0
Memorandum item:
Average interest rate (per cent) 3.7 3.3 3.2 3.2 3.3 3.2 3.2
Source: 2014 CSO, 2015-2020 Department of Finance
Department of Finance | Ireland’s Stability Programme, April 2015 Update DRAFT Page | 24You can also read