The fall and rise of Ghana's debt - How a new debt trap has been set October 2016 - Jubilee Debt Campaign
←
→
Page content transcription
If your browser does not render page correctly, please read the page content below
October 2016

The fall and rise of
Ghana’s debt
How a new debt trap has been set
The fall and rise of
    Ghana’s debt
                                              Contents
    How a new debt trap has been set
                                                Glossary                                            3
    By Tim Jones
    This report is jointly published by         Executive summary                                   4
    the Integrated Social Development
    Centre Ghana, Jubilee Debt Campaign
    UK, SEND Ghana, VAZOBA Ghana,             1. Debt cancellation but continued
    All-Afrikan Networking Community             commodity dependence                               8
    Link for International Development,
                                                The history of commodity dependence                 8
    Kilombo Ghana and Abibimman
    Foundation Ghana.                           Debt cancellation under the Heavily Indebted Poor
                                                Countries initiative                                8
    We would like to thank the following
    individuals for their assistance:           Commodity boom and manufacturing decline            9
    Bernard Anaba, Mawuse Yao Agorkor,          Slowing progress in reducing poverty and
    Kofi Mawuli Klu, Clara Osei-Boateng,        increased inequality                                12
    Maatyo Dedo Azu, Isaac Webadua,
    Richard Ananga, Eric Addae,
    Rowland Danku, Opanin Kwame               2. The lending and borrowing boom                     13
    Dede Akuamoah, Happy Nani, Davi
                                                The growth in Ghana’s external debt                 13
    Xolanyo Bridget Gbafa, Kenneth Nana
    Amoateng, Prof. Jan Toporowski,             Domestic debt                                       14
    Dr. Kojo Opoku Aidoo, Dr Annalisa           Who the lenders are                                 15
    Prizzon, Dr Daniel Ozarow, Sarah-
    Jayne Clifton, Jürgen Kaiser, Jonathan      What were the loans for?                            16
    Stevenson and Tom Marshall.                 Public-Private Partnerships                         18
    We would like to thank the Tudor Trust
    and All We Can: Methodist Relief and      3. The new debt trap                                  21
    Development for helping to fund the
    research and production of this report.     Projections for 2016 and 2017                       21

    Cover image by Joe Ronzio/Flickr            Projections beyond 2017                             23
                                                The IMF structural adjustment programme             24
    Designed by: Wingfinger
    October 2016                                The oil funds and other reserves                    24

                                              4. Escapes from the debt trap                         26
                                                Conduct a debt audit                                26
                                                Make lending and borrowing more productive
                                                and accountable                                     26
                                                Make adjustment fair                                27
                                                Hold a debt conference                              27
                                                Default or threaten to default on some of
                                                the debt                                            27
                                                Cancel unjust debts                                 29

                                                Appendix: Who Ghana’s debt is owed to               30

2
Glossary
Bond International Monetary Fund (IMF)
A ‘bond’ is one of the means by which governments The International Monetary Fund is an international
borrow. A government can borrow money in return for organisation which was created by the US and UK at
issuing a contract saying that it will repay the money in the end of the Second World War. Its original purpose
full in a certain number of years (eg, 10 years) as well as was to give loans to countries suffering from short-term
interest every year until then (eg, 3%). This contract is economic crisis, in the expectation that they would
known as a ‘bond’. The bond is then tradable. Whoever quickly recover, and the loans would be able to be repaid.
initially lent the money usually sells the bond on. Such
Overtime, and particularly since the Third World Debt
bonds are bought and sold every day on financial markets.
Crisis began in the 1980s, the IMF has shifted to
The current owner of a bond is called a ‘bondholder’.
lending to countries in longer-term economic crisis
Bonds attract the most attention from the media because that are unable to pay their debts. These IMF loans
they are traded on financial markets so they are the most repay the original lenders, whilst the debt remains with
visible (though it can be very difficult to know who owns the country. In return for such loans, the IMF usually
bonds at a particular time). However, they are only part insists on changes to government policy such as cuts
of the debt of most governments. in government spending, increases in regressive taxes
such as VAT, privatisation of state owned companies and
Debt service removal of regulations on businesses.
Debt service is the amount spent on paying debt The IMF is run by its member governments according to
principal and the interest over a particular period of time, a voting formula designed to ensure the US and Europe
usually one year. control the institution. The US has 17% of votes at the
IMF, therefore having an effective veto on major changes,
Default as these require an 85% majority. European countries
Default is missing a debt payment when it is due. Often have 32% of the votes. Ghana has 0.18% of the votes.
contracts allow for a ‘grace period’ after a payment is The head of the IMF has always been a European,
missed before a default is officially declared – often following a deal agreed between the US and Europe, and
around one month. A default can be a full default – on the head of the World Bank has always been American.
all payments coming due – or a partial default – on
just some of the debts, usually depending on who the
Principal
creditor is. Debt principal is the amount that was originally lent,
minus any of it which has been repaid.
Financing gap
The financing gap for a government is the difference
Reserves or foreign exchange reserves
between how much money it plans to spend, including Reserves, or foreign exchange reserves, are money held
on debt principal and interest payments, and how by a government (usually through its central bank) in
much income it expects to receive from tax and grants. foreign currencies which can be used to buy imports and
It is therefore the amount of money which needs to be pay debts. Foreign exchange reserves are most often
borrowed to cover any difference. dollars but can also include other currencies such as
euros, yen, yuan and pounds. If these reserves were held
Government deficit as physical cash they would not earn any interest. They
The deficit is the difference between the amount a are therefore held by owning secure but easily sellable
government receives in tax and grant income and how assets denominated in the currency concerned, usually
much it spends, including on debt interest payments government debt of the country whose currency it is (eg,
(but not debt principal payments). If a government has US government debt for dollars, German government
a deficit it normally means it has to borrow to fund the debt for euros).
difference, which means its total debt increases.
World Bank
A government’s primary surplus / deficit is the difference
The World Bank is an international organisation, setup
between how much it receives in tax and grant income,
by the US and UK at the end of World War Two, to lend
and how much it spends, not including interest
money to governments for investment projects. It has
payments. Therefore, a government can have a primary
subsequently become five separate institutions. One
surplus but an overall deficit where it is earning more
branch, the International Development Association (IDA)
than it is spending, not including debt and interest, but
gives grants or lends to the governments of a set of low-
has to borrow more to cover interest payments.
and lower-middle income countries, including Ghana.
3Summary
Executive summary
Ghana is in a debt crisis. Despite having had further inland, seeking direct control of gold and other
significant amounts of debt cancelled a decade ago, resources.
the country is losing around 30% of government Whilst Ghana was the first colonised country to achieve
revenue in external debt payments each year.1 Such independence in 1957, almost 60 years on, the country’s
huge payments are only possible because Ghana has economy remains dependent on the export of just three
been able to take on more loans from institutions primary commodities – gold, cocoa and now oil, which
such as the International Monetary Fund (IMF), which together make up over 80% of Ghana’s exports.2
are used to pay the interest on debts to previous
lenders, whilst the overall size of the debt increases. Debt crisis and debt cancellation
Ghana’s crisis is the result of a gradual increase in This dependence on commodities was the central factor
lending and borrowing off the back of the discovery of underlying a debt crisis which was common to much
oil and high commodity prices. More money was then of the global South in the 1980s and 1990s. Global
borrowed following the fall in the price of oil and other commodity prices fell at the start of the 1980s, rapidly
commodities since 2013, to try to deal with the impact increasing the size of foreign debt payments which could
of the commodity price crash, whilst the relative size of only be paid out of foreign earnings such as exports.
the debt also grew because of the fall in the value of the As commodity producers across the world expanded
Ghanaian currency, the cedi (GH¢), against the dollar ($). production in order to pay debts, on the advice of the
The underlying causes of the return to a debt crisis are IMF and World Bank, commodity prices stayed low for
therefore the continued dependence on commodity over 20 years.
exports, as well as borrowing and lending not being From the mid-1990s the global Jubilee movement called
responsible enough, meaning that new debts do not for debt cancellation, which led to the creation and
generate sufficient revenue to enable them to be repaid. enhancement of two debt relief schemes run by the IMF
At the moment, all the costs of the crisis are being and World Bank, the Heavily Indebted Poor Countries
born by the people of Ghana, and none by the lenders. initiative and Multilateral Debt Relief Initiative.
This is unfair. Lenders should carry their share of the As a result of this debt cancellation, Ghana’s government
cost of any irresponsible lending, and of the change in external debt fell from $6.6 billion in 2003 to $2.3
circumstance caused by the fall in commodity prices. billion in 2006.3 Significant improvements in education
Additional action is also needed in order to prevent a and healthcare followed, due to money being saved
repeat of Ghana’s crisis, including changes on the part and invested, alongside good government policies,
of the government and lenders to ensure that loans enhancing basic service provision. The proportion of
are well used, and that more of the revenue generated children completing primary school was static at around
by the economy is turned into government revenue by 60–70% from 1980 to 2006, since when it has increased
taxation. to almost 100%.4 The proportion of births attended by a
skilled health professional only increased from 44% to
47% between 1998 and 2006, but in the following eight
Commodity dependence years it increased to 74%.5
Ghana’s dependence on commodities dates back to
colonialism. The borders of the country now known Commodity and lending boom, and
as Ghana were established by the British colonists in
the late-19th century. The Europeans had first started
manufacturing decline
coming to the ‘Gold Coast’ in the late-15th century However, Ghana’s dependence on commodities
to open up alternative trade routes to the Sahara in continued, and as prices rose, this created more
order to access the region’s gold. The Portuguese, willingness for lenders to give loans off the back of a
Dutch, British, Germans, Swedes and Danes all built or growing economy.
occupied castles and forts which were used as prisons
for the slave trade. Gold and cocoa prices began to increase from the mid-
2000s, as part of a global boom in primary commodity
The ending of the slave trade coincided with the prices heavily influenced by Chinese growth and
industrial revolution, when European powers once demand, on top of continued high consumption in
again became more interested in Africa’s physical rich North American, European and Asian economies.
commodities – raw materials such as fossil fuels, metals Furthermore, Ghana discovered oil, and began to
and cash crops – rather than in forcibly shipping its produce and export it from 2011.
people across the Atlantic. With the ‘scramble for Africa’
in the 19th century, the British extended their influence
4 References for Executive summary are on page 7The fall and rise of Ghana’s debt: How a new debt trap has been set
Collectively these changes led to a booming economy. In early 2013 the price of gold fell significantly, as did
Between 2006 and 2013 Ghana’s GDP per person grew the price of oil from the start of 2014. Since the start of
by 44%.6 However, over the same time period the 2013 the value of the cedi against the dollar has fallen
number of people living below the national poverty line by 50%. This has caused the dollar-denominated size
only fell by 10%, a slower rate than in the previous seven of Ghana’s economy to fall from $47.8 billion in 2013
years when growth had been far lower.7 The reason was to $36 billion in 2015.10 Because external debts are
that much of the proceeds of growth went to those with owed in dollars or other foreign currencies, this has in
the highest incomes. For every GH¢1 increase in income turn increased the relative size of the debt and debt
for the poorest 10%, the incomes of the richest 10% payments. External debt has grown from $14.7 billion in
increased by more than GH¢9. 2013 to $21.1 billion in 2016 (an increase of 44%), yet
because of the depreciation external debt has gone up
This rapid economic growth led to an increased
from 30% of GDP in 2013 to an expected 56% in 2016
willingness and desire of various institutions to lend to
(an increase of 87%).11
Ghana, with a corresponding willingness to borrow. Loans
increased steadily from 2008 to 2011. In total, between One response to these economic shocks has been for
2007 and 2015 there were $18.2 billion of external loans the government to borrow more money, most visibly
and $8.7 billion of debt payments, leaving $9.5 billion of through $1 billion of bond issues each in 2013, 2014 and
the additional borrowing to be spent within Ghana. 2015, all under English law. This money has mainly been
used to make external and domestic debt interest and
There is little transparency on what the loans were used
principal payments, and to fund ongoing government
for, from both the government and lenders. The IMF
costs, plugging the gap created by dollar revenue being
figures on public capital formation show no relationship
lower than expected. Less visibly, there has also been
with the increase in lending, suggesting that whilst some
significant borrowing directly from external financial
loans could have been used for investment, the increase
institutions.
in lending did not lead to an increase in investment.
The interest rates on the new debts are high, rising from
One of the more transparent lenders is the World Bank.
7.9% for the 2013 bond issue to 10.75% for the October
Whilst they provide little information before loans are
2015 one. For the October 2015 bond issue, the World
agreed – preventing civil society, media and politicians
Bank once again broke its own rules by guaranteeing
from holding the government and the World Bank to
$400 million of payments if the Ghanaian government
account – they do publish details during and after
fails to make them. The World Bank is not meant to
projects. Our analysis of these reports shows that 25%
give such guarantees for governments assessed as at
of outstanding debt from Ghana to the World Bank
high risk of debt distress, which Ghana had been for
is for projects where the World Bank judged its own
the previous seven months. The high interest rate and
performance to be less than satisfactory.
guarantee mean that if the Ghanaian government were
Moreover, between May 2007 and February 2015 to pay the interest every year until 2024, then default on
Ghana was assessed by the IMF and World Bank to all other payments from 2025, including the principal,
be at moderate risk of debt distress, and since March the bond speculators would still have made $90 million
2015 of high risk. The World Bank is only meant to give more than if they had lent to the US government. This
half its support to moderate-risk countries as loans, means that the speculators lent to Ghana believing that
and the other half as grants; to high-risk countries it is there was a high chance they would not be fully repaid.
only meant to make grants. Yet between May 2007 and
However, for the moment those speculators are being
February 2015, 93% of World Bank funding to Ghana
paid, in part because since April 2015 the IMF has been
was in the form of loans. And since March 2015 when the
lending more money which is being used to meet debt
World Bank was meant to stop giving Ghana loans, it has
payments, effectively bailing out previous lenders. In
agreed $1.16 billion of new loans or loan guarantees.8
return, the Ghanaian government has to cut government
With high commodity prices and the beginning of oil spending and increase taxes, a process which is
production, export revenues increased rapidly from expected to intensify further after the December 2016
2008 to 2012. Yet there is evidence that manufacturing elections. Under current plans, government spending per
was crowded out. As a share of GDP, manufacturing person (adjusted to account for inflation) will fall by 20%
production halved from over 10% in 2006 to 5% by between 2012 and 2017.12
2014.9
The IMF estimates the Ghanaian government’s external
debt payments in 2016 will be 29% of revenue, well
Commodity price crash and the new above the 18–22% it normally regards as the upper
limit of sustainability. Payments are expected to stay
debt trap well above 20% of revenue until at least 2035.13 This
A combination of the recent fall in the price of is only considered possible due to a combination of
commodities and the loans not being used well enough very optimistic expectations and requirements for large
to ensure they could be repaid has now pushed Ghana spending cuts and tax increases, the very things the IMF
back into debt crisis. has been criticising the European Union for in the case of
Greece.14
References for Executive summary are on page 7 5The fall and rise of Ghana’s debt: How a new debt trap has been set
The IMF predicts: n Establish an independent debt audit commission
n Dollar GDP growth averaging 8.2% a year from now made up of domestic and international experts and
until 2035. Yet, from 2008 to 2015 Ghana’s economy give it access to all the information needed. As well
grew at less than half this rate despite the discovery as analysing all the terms of loans and their costs
of oil.15 and benefits, a debt audit commission could propose
new accountability mechanisms on government and
n Growth in government revenue in line with GDP,
lenders to ensure that where loans are given they are
collecting 19–21% a year. Yet, Ghana has only once
well used.
collected 19% of GDP in government revenue in a
year (in 2011) since IMF records began in 1980. Of Lenders should:
low- and middle-income countries that grew at 8.2% n Publicly reveal all the loans they have given, what
a year or more between 2008 and 2014, only one in they were for and on what terms.
five managed to increase government revenue as a
n Commit to working with an independent debt audit
proportion of GDP over the same period.16
commission should one be established.
n A fall in the average interest rate paid on external
debt from 5.1% to 4.1%. Yet, interest rates on 2) Make lending and borrowing more productive
external private and multilateral debt have been and accountable
increasing, and dollar interest rates are expected
to increase as and when the US Federal Reserve The Ghanaian government should:
continues to raise rates. n Fully implement the Public Financial Management Act
n A large primary budget surplus by 2017, and 2016.
continuing surpluses from then on. Yet, this will n Publicly release all documents concerning new loans
mean continuing government spending cuts and tax and any projects they are funding before contracts are
increases, and will take demand out of the economy, signed so that they can be scrutinised by the media,
thereby reducing growth and risking a classic debt parliamentarians and civil society organisations.
trap where austerity leads to less growth, which in n Ensure parliament has scrutinised and approved new
turn increases the relative size of the debt, which loans and/or projects before contracts are signed.
leads to more austerity and less growth, and so on.
n Ensure projects are independently evaluated before,
during and after their duration.
Escapes from the trap n Consult on and publish a debt strategy which fits with
the national development plan.
Debt is already placing a significant burden on Ghana’s
economy and society, and the country is at risk of falling Lenders should:
back into an extended debt trap, with an economic n Require all of the points above to be implemented
stagnation and possible increases in poverty rates and before agreeing a loan.
failure to implement the Sustainable Development
Goals. Today’s crisis has resulted from a multitude of The UK and other major jurisdictions under which debt
factors: failure to diversify away from commodities, the is issued should:
government and lenders failing to ensure loans were n Pass a law that requires all loans issued under their
used productively enough, falling global commodity jurisdiction to governments or with government
prices, particularly gold and oil, and the opportunism of guarantees to be publicly disclosed at the time
speculators lending at high interest rates seeking large the loan is given, otherwise the debt will be
profits. unenforceable under that jurisdiction’s law.
The people of Ghana should not have to bear all the
3) Make adjustment fair
suffering of a crisis caused by government policy,
irresponsible lenders, and global economic shocks, The Ghanaian government should:
especially when speculators continue to extract large n Protect all vital public spending, such as on
profits from the country. healthcare and education, social services and welfare
Below are a range of measures we believe would help protections, and key economic infrastructure.
Ghana avoid a protracted and damaging debt crisis, n Increase tax revenues from large companies and rich
whilst also helping to prevent a repeat of the cycle of individuals, including by ceasing to grant tax waivers,
debt and crisis. including for public-private partnership projects, and
increasing the capacity of tax collection authorities
1) Conduct a debt audit to ensure existing laws relating to issues such as
transfer mispricing are implemented.
The Ghanaian government should:
n Publicly reveal how much debt there is, who loans were Other governments should:
given by, what they were for (including whether for n Agree to the creation of a UN tax body to coordinate
projects or general budget support) and on what terms. global tax rules, as proposed by developing countries
6 References for Executive summary are on page 7The fall and rise of Ghana’s debt: How a new debt trap has been set
at the UN, in order to ensure such rules reflect the n For any external debt which is issued in the future, try
needs of developing countries. to denominate it in cedis to prevent exchange rate risk.
n Agree to renegotiate bilateral tax treaties with Ghana n Consider defaulting on the private debt which
to ensure the Ghanaian government is receiving a fair speculators lent irresponsibly and are not expecting
level of tax. to be repaid, and on which significant interest has
already been paid. Or at the very least threaten
4) Hold a debt conference to default on these private external debts so as to
motivate creditors to come to the table and agree to
The Ghanaian government should:
better terms or to take part in a debt conference to
n Request support from UNCTAD with the organisation
negotiate a comprehensive debt restructuring.
of a debt conference.
n Call a debt conference with all creditors with the aim
The IMF should:
of agreeing burden sharing to get debt payments n Accept that its expectations of Ghana’s economy are
down to a sustainable level. over-optimistic and place all the burden on the people
n Discuss with other governments in similar situations
of Ghana and none on the lenders.
whether a joint conference or coordinated actions n State that it will continue to lend if Ghana defaults on
would be useful. the private external debt.
n Require a restructuring of all of Ghana’s external
Lenders should:
debt before a certain date, ideally through a
n Commit to taking part in a debt conference to agree
comprehensive debt conference, in order to
debt restructuring to get debts down to a level incentivise private and other creditors to negotiate.
assessed as consistent with meeting the Sustainable
Development Goals by an independent expert such as The UK government should:
UNCTAD. n Pass legislation to make it easier for debts owed
under English law to be restructured. This could
Some private creditors may refuse to abide by the
include introducing a collective action clause across
outcome of any conference. All the dollar denominated
all private external debt owed under English law (both
bonds are owed under English law, and we suspect
bonds and non-bonds) and/or, restricting how much
other private commercial debt is too. Therefore the UK
can be claimed in a UK court to the amount a creditor
government should:
paid for the debt (as the Belgian Vulture Fund law of
n Commit to passing legislation to ensure that the
2015 does).17
agreed outcomes of any conference are enforced on
private creditors who refuse to comply. 6) Cancel unjust debts
5) Default or threaten to default on some The World Bank should:
of the debt n Cancel at least 46% ($1.4 billion) of the debt it is owed
by Ghana on the basis that these loans should never
The Ghanaian government should:
have been made under its own rules,18 and that 25%
n Make a clear commitment to paying domestic debt, of the debt is owed on projects where the World Bank
including ahead of other debts. rated its own performance as less than satisfactory.
n Investigate whether it can reintroduce the rule n Comply with its own policy and only give grants to
preventing cedi-denominated domestic debt being Ghana whilst it is at high risk of debt distress.
bought by external actors, thereby maintaining a clear
n Review whether it is complying with its own policy for
distinction between domestic and external debt.
all other countries with a Debt Sustainability Analysis.
References – Executive summary
1 IMF and World Bank Debt Sustainability Analysis, December 2015. http:// 13 IMF and World Bank Debt Sustainability Analysis, December 2015. http://
www.imf.org/external/pubs/ft/dsa/pdf/2016/dsacr1616.pdf www.imf.org/external/pubs/ft/dsa/pdf/2016/dsacr1616.pdf
2 Government of Ghana, various bond issue prospectuses. 14 Since the summer of 2015, unlike European institutions, the IMF has refused
3 World Bank. World Development Indicators database. to lend more money to Greece because it does not regard the debt as
4 World Bank. World Development Indicators database. payable. The IMF has argued that the EU’s projections for the Greek economy
are overoptimistic, and that the debt cannot be sustainable unless there is
5 World Bank. World Development Indicators database.
significant debt relief.
6 All figures for growth in this report take account of the rebasing of GDP figures
15 IMF. World Economic Outlook Database.
in 2010. Source for this statistic is IMF. World Economic Outlook Database.
16 Calculated from IMF. World Economic Outlook Database.
7 Cooke, E., Hague, S., and McKay, A. (2016). The Ghana poverty and inequality
report using the 6th Ghana Living Standards Survey. March 2016. 17 http://www.eurodad.org/Entries/view/1546406/2015/05/12/New-anti-
vulture-fund-legislation-in-Belgium-an-example-for-Europe-and-rest-of-the-
8 Calculated from IDA statement of credits and grants
world
9 World Bank. World Development Indicators database.
18 As set out above, 50% of the World Bank’s finance for Ghana should have
10 IMF. World Economic Outlook Database. been grants, 50% loans, but it gave 93% as loans. So 43% of the finance that
11 IMF and World Bank Debt Sustainability Analysis, December 2015. was loans should not have been given, which is 46% of the loans (43 / 93 =
http://www.imf.org/external/pubs/ft/dsa/pdf/2016/dsacr1616.pdf 0.46).
12 Calculated using data from IMF and World Bank Debt Sustainability Analysis,
December 2015. http://www.imf.org/external/pubs/ft/dsa/pdf/2016/
dsacr1616.pdf
7Section one
Debt cancellation but continued
commodity dependence
“Schools were rehabilitated This dependence on commodities was the central factor
underlying a debt crisis which was common to much
over the last decade, more of the global South in the 1980s and 1990s. Globally
classrooms were added. commodity prices fell at the start of the 1980s, rapidly
Other than that, there have increasing the size of foreign debt payments which could
only be paid out of foreign earnings such as exports.
been no other developments
As commodity producers across the world expanded
in the area. The sugar factory production in order to pay debts, on the advice of the
shut down more than 20 years ago, and the IMF and World Bank, commodity prices stayed low for
over 20 years.
textiles factory 15 years ago. Since then they’ve
not been replaced by any other industry. Most
people are reliant on farming, whilst the youth all Debt cancellation under the Heavily
move to Accra to do donkey work.” Indebted Poor Countries initiative
MADAM MAATYO DEDO AZU, SOMANYA, EASTERN REGION The debt crisis of the 1980s and 1990s finally came
to an end a decade ago after significant amounts of
Ghana’s debt were cancelled. This debt cancellation
Throughout this report there are quotes from community helped improve social outcomes, particularly in health
members from Somanya, Peki and Accra who participated and education.
in meetings on Ghana’s economy in May 2016.
From the mid-1990s the global Jubilee movement called
for debt cancellation in response to the Third World Debt
crisis, which led to the creation and enhancement of two
debt relief schemes run by the IMF and World Bank: the
The history of commodity dependence Heavily Indebted Poor Countries (HIPC) initiative and
Ghana’s dependence on commodities is a major Multilateral Debt Relief Initiative (MDRI).
vulnerability for the Ghanaian economy and contributor HIPC was created by the IMF and World Bank in 1996.
to the current debt crisis. This dependence dates back to Initially the aim was to cancel enough of an indebted
colonialism. country’s multilateral and bilateral debts so that the
The borders of the country now known as Ghana were total debt would fall to an arbitrary level viewed by the
established by the British colonists in the late-19th IMF and World Bank as ‘sustainable’. In 2005 the MDRI
century. The Europeans had first started coming to was added to it. This scheme cancelled all debts from
the ‘Gold Coast’ in the late-15th century to open up loans made before the end of 2004 by the IMF, and
alternative trade routes than the Sahara to access the before the end of 2003 by the World Bank and African
region’s gold. The Portuguese, Dutch, British, Germans, Development Bank. In addition, many governments
Swedes and Danes all built or occupied castles and forts went beyond the amount of debt they needed to cancel
which were used as prisons for the slave trade. based on HIPC calculations. Private-sector creditors
were asked to take part in HIPC cancellation, but it was
The end of the slave trade coincided with the industrial voluntary.
revolution, when European powers once again became
more interested in the physical commodities of Africa
rather than in forcibly shipping its people across the “The World Bank and the
Atlantic. With the ‘scramble for Africa’ in the 19th other donor countries make
Century, the British extended their influence further
economic prescriptions which
inland, seeking direct control of the gold and other
resources. we religiously adhere to but
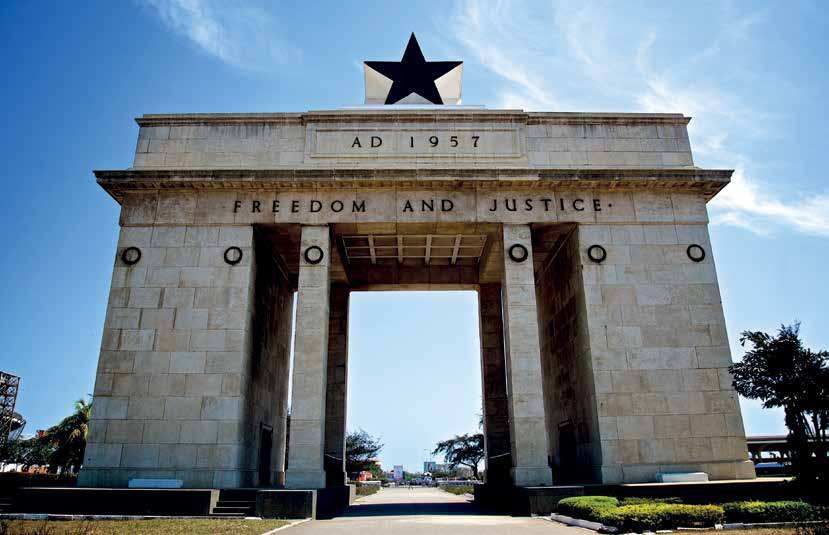
Whilst Ghana was the first colonised country to achieve
yet when they fail, we are
independence in 1957, almost 60 years on, the country’s blamed. They take advantage
income from the rest of the world remains dependent of us simply because we are poor.”
on just three primary commodities – gold, cocoa and
MR OPANIN KWAME DEDE AKUAMOAH, GREATER ACCRA REGION
now oil, which together make up over 80% of Ghana’s
exports.19
8 References for section one are on page 12The fall and rise of Ghana’s debt: How a new debt trap has been set
Graph 1: School completion rates, 1980–201420
100
80 Primary school
Proportion of children %
completion rate,
both sexes
60 Lower secondary
school completion
rate, boys
40
Lower secondary
school completion
20 rate, girls
0
1980
1982
1984
1986
1988
1990
1992
1994
1996
1998
2000
2002
2004
2006
2008
2010
2012
2014
Ghana entered the HIPC initiative in February 2002, seems to have stalled, and the completion rate for girls
completed HIPC in May 2004, and then qualified for is 5 percentage points lower than for boys (See Graph 1
MDRI after it was created in 2005. Through HIPC and above).22
MDRI, Ghana’s external government debt fell from $6.6
Under-5s mortality has continued to fall (see Graph
billion in 2003 to $2.3 billion in 2006. The main falls
2 below), though is still high at 62 deaths per 1,000
were due to cancellation of debt owed to multilateral
children (compared to 4 in the UK).23 One indicator
institutions and other governments.
which shows an expansion in health coverage since
External government debt payments as a proportion of debt cancellation is the number of births attended by a
revenue fell from over 20% in the late-1990s to under skilled health professional. In the eight years from 1998
10% after HIPC began, and around 5% after MDRI. The to 2006 this only increased from 44% of births to 47%.
money saved contributed to significant improvements In the eight years since, up to 2014, it increased to 74%.
in education and healthcare, which was accompanied
by good governance policies to enhance basic service
provision.21 For example, the proportion of children
Commodity boom and manufacturing
completing primary school was static at around 60–70% decline
from 1980 to 2006. Since debt cancellation it has
From the mid-2000s the prices of commodity exports
increased to almost 100%.
increased, contributing to high economic growth in
For lower secondary schooling, the completion rate Ghana until 2013. However, this has been followed by
was lower in the early 2000s than it had been in the a slowdown since prices began to fall, particularly that
early 1990s, at less than 60%. Immediately after 2006 of oil in 2014. Moreover, the share of manufacturing in
it increased to a high of 71%. However, progress now
Graph 2: Under 5 mortality rate (per 1,000) 1960–201524
250
200
Number of children
150
100
50
0
1960
1962
1964
1966
1968
1970
1972
1974
1976
1978
1980
1982
1984
1986
1988
1990
1992
1994
1996
1998
2000
2002
2004
2006
2008
2010
2012
2014
References for section one are on page 12 9The fall and rise of Ghana’s debt: How a new debt trap has been set
Graph 3: Size of Ghana’s economy, constant Ghanaian cedis per person26
1,400
1,200
1,000
GH¢ constant prices
800
600
Start of oil
production
400
200
0
2000
2001
2002
2003
2004
2005
2006
2007
2008
2009
2010
2011
2012
2013
2014
2015
Ghana’s GDP has been declining, increasing dependence impacted on demand for, and therefore the price of,
on commodities. other commodities. For Ghana this means exports fell
in value in 2014, and the latest IMF data is that they fell
The increase in price for Ghana’s two main commodity
more dramatically to $10.6 billion in 2015, and will only
exports – gold and cocoa – was accompanied by
increase to $11.3 billion in 2016.27
the discovery of oil. Ghana’s GDP per person grew
at an average rate of 4.3% between 2005 and 2015, The discovery of oil means Ghana’s export income is
measured in constant GH¢s.25 However, this was mainly now dependent on three commodities rather than two
due to a boom between 2010 and 2013, with growth – gold, oil and cocoa. In 2014, these three commodities
slowing down since (see Graph 3 above). made up 81% of Ghana’s exports. Other exports include
other commodities such as timber, tourism and other
The significant growth in Ghana’s economy from 2011–
services, and manufacturing.
2013 is correlated with the beginning of oil production.
Ghana discovered significant oil fields in 2007, with Commodity dependence tends to make economies more
production beginning in 2011. This led to total exports vulnerable and unequal because they are subject to wild
(oil and non-oil) increasing from $8 billion in 2010 to swings in price, but create few jobs, allowing proceeds
$12.8 billion in 2011 and $13.5 billion in 2012 (see to be captured by elites and multinational companies,
Graph 4 below). for example through tax avoidance and evasion.
Since the middle of 2014, the price of oil has fallen Manufacturing’s share of the economy, whether for
significantly due to increased supply in the US, Saudi exports or domestic use, has been falling since 2006 (see
Arabia maintaining production, and demand being Graph 6 below). Even just in per-person terms, rather
lower than expected with a slowdown in industrial than as a percentage of GDP, Ghana’s manufacturing
production in China. This Chinese slowdown has also production has been falling (see Graph 7 below). From
Graph 4: Ghana’s exports, US$ billion, 2002–201428
16
14
other
12
Cocoa
10
OIl
$ billion
8
Gold
6
4
2
No data
0
2002
2003
2004
2005
2006
2007
2008
2009
2010
2011
2012
2013
2014
10 References for section one are on page 12The fall and rise of Ghana’s debt: How a new debt trap has been set
Graph 5: Index of prices for cocoa, gold and oil (2005 = 100)29
500
400 Cocoa
OIl
Index (2005 = 100)
300 Gold
200
100
0
2005
2006
2007
2008
2009
2010
2011
2012
2013
2014
2015
2016
Graph 6: Ghana manufacturing, % GDP, 1965–201430
18
16
14
12
% of GDP
10
8
6
4
2
0
1965
1967
1969
1971
1973
1975
1977
1979
1981
1983
1985
1987
1989
1991
1993
1995
1997
1999
2001
2003
2005
2007
2009
2011
2013
Graph 7: Manufacturing production per person, constant Ghanaian cedis, 1980–201431
100
90
Constant Ghanaian cedis per person
80
70
60
50
40
30
20
10
0
1980
1982
1984
1986
1988
1990
1992
1994
1996
1998
2000
2002
2004
2006
2008
2010
2012
2014
References for section one are on page 12 11The fall and rise of Ghana’s debt: How a new debt trap has been set
the mid-1980s, the value of manufacturing production same time period GDP per person grew by 44%. In the
rose from GH¢60 per person to over GH¢90 by 2006, but previous seven-year period from 1999 to 2006, the
has now fallen back to GH¢66, a lower level than in the number of people living in poverty fell by 14% whilst
early 1990s. the economy only grew by 18%. There has been an
increasing divergence between the pace of economic
growth and the pace of poverty reduction.
Slowing progress in reducing poverty
This divergence is because more of the financial benefits
and increased inequality of growth have been going to richer people. Average
During the ‘boom’ up until 2013, progress in reducing adult consumption for Ghana’s richest 10% increased
poverty slowed down, and inequality increased. by GH¢1,246 between 2006 and 2013, almost ten times
more than the increase of GH¢135 for the poorest 10%.
The most recent data on poverty and inequality in Ghana
The ‘richest’ 10% is still a relative term however – the
comes from the Ghana Living Standards Survey in 2013.
average income of the richest 10% in 2013 of GH¢5,789
This shows that the number of people living in poverty
a year was equivalent to $6,500 in Purchasing Power
fell from 7 million in 2006 to 6.3 million in 2013. The
Parity terms. Within the richest 10% there are still huge
proportion of people living in poverty fell from 31.9%
disparities in income and wealth. Overall, inequality has
to 24.2%. Poverty is defined as not having enough
been increasing on almost all measures35 (see Table 1
income to meet all basic food and non-food needs,
below).
and was set at GH¢1,314 per adult per year for 2013
($1,460 a year in Purchasing Power Parity terms,32 or $4 There are also huge disparities between regions. In
a day). According to a report for Unicef, this means the Greater Accra, 6% of the population were surveyed as
average annual rate of poverty reduction slowed to 1.1 living in poverty in 2013, in Ashanti the proportion was
percentage points a year from 2006 to 2013, down from 15%. In Brong-Ahafo the rate rises to 28%, and in Volta
1.8 percentage points in the 1990s.33 34%, with the highest levels in Northern (50%) and
Upper West (71%) provinces.
In total, the number of people living in poverty fell by
10% between 2006 and 2013.34 In contrast, over the
Table 1: Average adult annual consumption36
Poorest 10% Poorest 20% Median Richest 20% Richest 10%
Average adult annual consumption
715 1,002 1,846 3,337 4,543
2006 (GH¢ 2013 prices)
Average adult annual consumption
850 1,182 2,167 4,124 5,789
2013 (GH¢ 2013 prices)
Increase in GH¢ 135 180 321 787 1,246
Percentage increase 19% 18% 17% 24% 27%
References – Section one
19 Government of Ghana, various bond issue prospectuses. 29 IMF. Commodity Price Index database.
20 World Bank. World Development Indicators database. 30 World Bank. World Development Indicators database.
21 See http://www.developmentprogress.org/sites/developmentprogress.org/ 31 Calculated from World Bank. World Development Indicators database. And
files/case-study-report/ghana_full_report_final_web.pdf IMF. World Economic Outlook database.
22 World Bank. World Development Indicators database. 32 Purchasing Power Parity is a way of changing income figures to account for
23 World Bank. World Development Indicators database. the fact the same goods and services can cost different amounts in different
24 World Bank. World Development Indicators database. countries, in order to make income figures across countries more comparable.
25 ‘Constant’ figures for a currency takes account of inflation, so show the real 33 Cooke, E., Hague, S., and McKay, A. (2016). The Ghana poverty and inequality
change which has occurred, not just that GDP has increased because prices report using the 6th Ghana Living Standards Survey. March 2016.
have increased. 34 Cooke, E., Hague, S., and McKay, A. (2016). The Ghana poverty and inequality
26 IMF. World Economic Outlook database. The IMF database does not say in report using the 6th Ghana Living Standards Survey. March 2016.
what year the constant prices are priced in, but the relative changes remain 35 Cooke, E., Hague, S., and McKay, A. (2016). The Ghana poverty and inequality
the same regardless. report using the 6th Ghana Living Standards Survey. March 2016.
27 http://www.imf.org/external/pubs/ft/scr/2016/cr1616.pdf 36 Cooke, E., Hague, S., and McKay, A. (2016). The Ghana poverty and inequality
28 Government of Ghana, various bond issue prospectuses. None of these gave report using the 6th Ghana Living Standards Survey. March 2016.
data for 2007 so this year is missing, but presumably values were in between
those of 2006 and 2008.
12Section two
The lending and borrowing
boom
“We just hear on the media Loans from multilateral institutions increased to $745
million in 2011. After falling back in 2012 and 2013,
that the government has multilateral lending reached a new high of $1.3 billion in
borrowed the money, but we 2015.
don’t know what for.” Not all these loans will have been used for spending
MR ROWLAND DANKU, PEKI, in Ghana as some will have effectively been spent on
VOLTA REGION making debt principal and interest payments. In total
between 2007 and 2015, there were $18.2 billion of
The growth in Ghana’s external debt external loans, and $8.7 billion of external debt service,
a difference of $9.5 billion. This means that external
Debt cancellation under the Heavily Indebted Poor loans between 2007 and 2015 were a net source of $9.5
Countries initiative increased the willingness of lenders billion for the Ghanaian government to spend in Ghana.
to lend to the government, because the government’s
debt payments were now lower. The discovery of oil
and high commodity prices increased this willingness “Servicing debts with a
further, as Ghana was seen as one of Africa’s, and the 10% interest rate is very
world’s, booming economies. expensive. Most borrowing
From 2008 to 2011 there was a gradual increase in is for recurrent expenditure
lending each year, followed by big increases in 2013, rather than investment.
2014 and 2015 with $1 billion of bonds denominated in
dollars being issued each year. As well as these bonds, Debts fell through HIPC then
there was also significant direct lending by external increased gradually from 2008 and rapidly since
commercial and other external private lenders (see 2013.”
Graph 8 below).
MR ISAAC WEBADUA, GREATER ACCRA REGION
One significant bilateral loan was an agreement in
2012 for China to lend up-to $3 billion in two tranches, These figures also suggest that of the $8.7 billion of
with an interest rate of around 3.4%.37 By 2014 only external debt service, only $1.7 billion was spent on
$600 million had been lent, and the second tranche of repaying principal amounts, with the remainder, $7.3
$1.5 billion was cancelled. However, from the signing of billion, spent on interest (see Table 2 on page 14).
the agreement Ghana had been paying a commitment Therefore, of debt payments from 2004 to 2015, 80%
fee of 1% on the undrawn balance, costing more than were interest, while only 20% repaid original loans.
$50 million.
Graph 8: External loans to Ghanaian government, 2004–2015, $ billion38
4.5
4.0 Other private
sector
3.5
Bonds
3.0
Other
$ billion
2.5
governments
2.0
Other multilateral
1.5 institutions
1.0 IMF
0.5
World Bank
0
2004
2005
2006
2007
2008
2009
2010
2011
2012
2013
2014
2015
References for section two are on page 20 13The fall and rise of Ghana’s debt: How a new debt trap has been set
Table 2: Calculation of interest and principal Between 2006 and 2013, the external debt grew at
payments, 2007–2015 a faster rate than the economy, growing from 10% of
GDP in 2006 to 30% by 2013. If this rate of increase
Amount had continued, it would have taken until 2020 for
the external debt to reach 50% of GDP. However, the
Debt owed at end-2006 $2.3 billion39 collapse in the value of the cedi against the dollar
from 2014, following the fall in the prices of gold and
Loans from 2007–2015 $18.2 billion40 then oil, caused the situation to worsen quickly and
dramatically. External debt is owed in dollars and other
$20.5 billion ($2.3 foreign currencies, so the fall in the value of the cedi
Debt + loans
billion + $18.2 billion) has dramatically increased the real size of the debt.
Government external debt is now expected to reach 56%
Debt at end-2015 $18.8 billion41
of GDP in 2016 (see Graph 9 below).
Debt principal paid $1.7 billion ($20.5
2007–2015 billion – $18.8 billion)
Domestic debt
Debt service (principal and 42
$8.7 billion Domestic debt is debt owed to people and institutions
interest) 2007–2015
within Ghana rather than externally. It tends to be owed
$7 billion ($8.7 billion in cedis rather than foreign currencies, which means
Debt interest paid
– $1.7 billion)
its relative size does not increase when the cedi falls in
Proportion of debt service 80% ($7 billion / $8.7 value.
which was interest billion)
According to IMF and World Bank Debt Sustainability
Analyses (DSAs),43 domestic debt has fluctuated either
Graph 9: Ghana’s GDP and external debt, 2004–2016 ($ billion and percentage of GDP)44
60 60
External debt
50 50 as percentage
of GDP
40 40 Government
external debt,
% of GDP
$ billion
30 30 $ billion
GDP, $ billion
20 20
10 10
0 0
2004
2005
2006
2007
2008
2009
2010
2011
2012
2013
2014
2015
2016
Graph 10: Ghanaian government domestic debt (percentage of GDP and cedi billions), 2006–201645
40 40
Government
35 35
domestic debt
as percentage
30 30
of GDP
25 25
GH¢ billion
Government
% of GDP
domestic debt
20 20
GH¢ billion
15 15
10 10
5 5
0 0
2006
2007
2008
2009
2010
2011
2012
2013
2014
2015
2016
14 References for section two are on page 20The fall and rise of Ghana’s debt: How a new debt trap has been set
side of 20% of GDP, with no clear trend. As of end bought by international speculators,47 but the lack
2015, domestic debt stood at 24.1% of GDP, GH¢37.2 of transparency around government bond ownership
billion ($8.9 billion as at April 2016 exchange rates). In means we do not know who they are.
absolute terms the debt has been rising every year, but
The domestic debt figures above are from the IMF
this is offset by inflation and economic growth, which
and World Bank DSA, so do not include this cedi-
means domestic debt as a percentage of GDP has not
denominated debt owed externally (instead it is included
been increasing (see Graph 10 on page 14).
as an external debt). If, as stated by the IMF and World
Nominal interest rates on domestic debt currently Bank, 20% of local-currency debt is owed externally,
average around 17%. However, this high rate is primarily then this amounts to GH¢9.3 billion ($2.2 billion at April
due to high inflation, though the real interest rate after 2016 exchange rates).
inflation has been increasing. The IMF and World Bank
DSAs say the average real interest rate was less than 5%
until 2014, since when it has increased, to a predicted
Who the lenders are
7% in 2016 and is expected to be 9% in 2017. There are various sources of data on the size of the
Since the start of 2015, the IMF and World Bank DSAs Ghanaian government’s debt and who it is owed to.
have been classifying debt owed in cedis to non- Below we use these to estimate the amounts currently
residents as external debt. This is an overdue change. owed by type of creditor. A full list of these estimates is
The definition of external debt is debt owed by people in the Appendix.
and institutions not resident in the country, regardless The IMF and World Bank December 2015 DSA says that
of the currency. Although local-currency debt owned by as of the end of 2015, Ghana’s government owed 52% of
non-residents does not have the same risk of its relative GDP in external debt, which equates to $18.8 billion.48
value rapidly changing as the cedi falls against foreign In addition to this is GH¢37.2 billion in domestic debt
currencies, it still leads to outflows of resources from ($8.9 billion at April 2016 exchange rates). This makes
the country, which ultimately have to be paid for out of the total debt around $27.7 billion at April 2016
earnings or loans from abroad. As the IMF and World exchange rates, 78% of GDP.
Bank March 2015 DSA says: “Holdings of domestic
debt instruments by non-residents present roll-over and Based on various sources of information (see the
foreign exchange risks caused by accompanying capital detailed list in the Appendix), we have been able to
outflows.”46 estimate who this debt is owed to (see Graph 11 below).
Around 32% is owed domestically and in cedis. A further
Ghana allowed non-residents to begin owning domestic 30% is owed to the external private sector, which will
debt of more than three years maturity in 2006. The IMF have the highest interest rates of the external debt. 20%
and World Bank now say that around 20% of such local is owed to multilateral institutions, over half of which
currency debt is held by non-residents. This percentage is owed to the World Bank. Most of this is paying very
could be increasing. Over 60% of a GH¢811 million low interest rates, but its relative size has still increased
bond issued in June 2016 was reported to have been
Graph 11: Who Ghana’s government debt is owed to, end-201549
Domestic
32%
World Bank
12%
Private sector external local currency
8%
3% IMF
4%
10% Other multilateral
Private sector: commercial banks and other
8%
13% 10% Paris Club governments
Private sector bonds
Non-Paris Club governments (primarily China)
References for section two are on page 20 15The fall and rise of Ghana’s debt: How a new debt trap has been set
due to the depreciation of the cedi. For example, Jubilee What were the loans for?
Debt Campaign has calculated that the depreciation of
the cedi against the dollar means the effective interest Lenders are jointly responsible with borrowers for
rate being paid by Ghana on loans given by the World ensuring loans are well used. Investigating how loans
Bank between 2004 and 2013 is now 9% (whereas the have been used is vital in evaluating whether or not they
effective interest rate would be 0.5% if there had not have been successful, and to ensure they are used well
been any devaluation).50 in the future.
The final 18% of debt is owed to other governments, the However, many lenders and governments around the
largest being China ($2.3 billion, 8%), US ($560 million, world are very opaque about what loans are used for
2%), Belgium ($373 million, 1%), and the Netherlands and even the terms on which they are made, and this
($333 million, 1%). (A full list is in the Appendix). Whilst is true of Ghana. Of the main external debts owed by
we do not know the specific interest rates for many of Ghana, we have not been able to find the interest rates
these debts, based on the interest rates on other debts, or terms of the non-bond private sector loans, nor for
and the stated average interest rate on foreign currency many of the loans from other governments. The dollar-
debt, we can estimate that the average interest rate denominated bond loans are public so the interest
on debts to other governments is around 4.5%. Again, rates and dates of disbursements and payments are
this average interest rate does not take account of the known, but the money went into general government
effective rate now being paid following cedi devaluation funds, so there is no way of knowing ultimately what it
against the dollar. was spent on.
Multilateral institutions are more transparent, though
only after loans have been agreed, which means there is
The World Bank and the 2015 bond issue
The World Bank broke its own rules to enable a high- points between lending to the US government and
interest private loan to the Ghanaian government, lending to the Ghanaian. If the Ghanaian government
which speculators can make profit from even if the paid the interest every year until 2024, then defaulted
government never repays any of the principal. on all other payments from 2025, including all the
principal repayments (which only come due from 2028–
In October 2015 the Ghanaian government borrowed
2030), the bond speculators would still have made $90
$1 billion through a 15-year dollar-denominated bond,
million more than if they’d lent to the US government.56
at an interest rate of 10.75%. The World Bank has
The effective expectation of ‘the market’ was that Ghana
guaranteed $400 million of the repayments, so if Ghana
would on average default in full on the bonds in 2025
misses any principal or interest payments, the World
and never pay a penny more. The deal facilitated by the
Bank will make them instead, up-to $400 million. This
World Bank is outrageously bad for Ghana, unless it
is the World Bank’s first such guarantee for 15 years.51
defaults before 2025.
Total interest payments over the course of the bond
are $1.504 billion, so payments total $2.504 billion The World Bank guarantee was given under the Policy
between 2015 and 2030.52 Based Guarantee programme. Under this, guarantees
are supposedly only available to countries rated as
The IMF, in its January 2016 review, said that the
at low or moderate risk of debt distress.57 In April
terms of the bond “were worse than expected under
2014 Ghana was assessed as at moderate risk of
the programme”.53 An interest rate of 10.75% with a
debt distress but “approaching high-risk levels”. At
guarantee by the World Bank does seem exceptionally
the next review in March 2015 this changed to being
high.
confirmed as at “high risk of debt distress”.58 Yet, seven
For example, $400 million of the bond effectively has months later in October 2015 the World Bank broke
the same risk as lending to the World Bank as it is its own rules based on its own assessment by giving a
guaranteed by them. The World Bank can currently guarantee for (high-cost) bonds for a country rated as at
borrow in dollars for ten-years at a 2.5% interest rate.54 high risk of debt distress.
This means that the $600 million that is not guaranteed
Whilst 10.75% is the interest rate paid to speculators,
by the World Bank effectively pays an interest rate of
the World Bank is also charging Ghana a fee of 0.75%
16.25%.55 The implication of this is that the Ghanaian
on the $400 million guarantee,59 so $3 million a year.
government would have been charged 16.25% interest
This means the actual annual cost is $110.5 million, and
without the World Bank guarantee.
so the actual interest cost to Ghana 11.05%.
The interest rate on US government 15-year bonds is
around 2%, so there is a difference of 14.25 percentage
16 References for section two are on page 20The fall and rise of Ghana’s debt: How a new debt trap has been set
Graph 12: Public investment and external loan disbursements ($ billion)60
3.0
Public gross
2.5 capital formation
Net external loans
2.0
Gross external
$ billion
1.5 loans
1.0
0.5
0
2005
2006
2007
2008
2009
2010
2011
2012
2013
2014
2015
often not the scrutiny of such loans by parliamentarians, ongoing costs and other measures such as defending
civil society and the media in the borrowing countries the value of the currency (eg, using external borrowing
before contracts are signed. to make domestic debt payments, thereby effectively
buying cedis with dollars) and trying to increase foreign
There does not appear to be any relationship between
currency reserves (see page 27 for more on foreign
the volume of external loans and overall amount of
currency reserves).
public investment. The IMF have figures for government
investment61 varying between $1.5 billion and $2.5 The World Bank does publish detailed information on
billion from 2005 to 2015, with it showing a fall since loans once they have been agreed. By analysing this
2013, and generally following a downward trend from data,62 we have found that of the $3.45 billion of debt
2005. The amounts are unrelated to both gross external owed to the World Bank as of June 2016, 35% is from
loans (the green bars in Graph 12 above) and net loans for direct budget support which are not tied to
external loans (loans minus debt payments, the red lines particular projects. These loans, currently called Poverty
above). This suggests that whilst some external loans Reduction Support Credits were first invented during
could have been used for investment, the increase in the structural adjustment of the 1980s and 1990s when
lending, in particular the boom from 2013, was to meet the money was used to pay off previous lenders. They
Graph 13: Debt outstanding to World Bank by sector loan was given for63
35%
Budget support
Transport
Social services 1% 19%
ICT 3%
Health 4%
5%
Water and sanitation
10%
7% Agriculture
Education
7% 9%
Energy Administration
References for section two are on page 20 17You can also read