THE NETHERLANDS STABILITY PROGRAMME - European Commission
←
→
Page content transcription
If your browser does not render page correctly, please read the page content below
STABILITY PROGRAMME

THE NETHERLANDS

APRIL 2021
FOREWORD

Programme status
A draft of the Stability Programme has been submitted to both houses of parliament. In
addition, a draft of the Stability Programme was presented to the Council of State, the institution in
the Netherlands charged with the fiscal monitoring of compliance with European budgetary rules.
This role ensues from Article 5 of the Treaty on Stability, Coordination and Governance (TSCG) and
Council Regulation (EU) 473/2013 and has been codified in the Sustainable Public Finances Act
(Wet houdbare overheidsfinanciën, 'Wet Hof').

Relationship to ‘two-pack’
The Stability Programme also serves as a national medium-term budget plan. The
Netherlands hereby complies with the obligation as defined in Article 4 of Council Regulation (EU)
473/2013.

Figures used
Unless indicated otherwise, the figures used in this report are based on the most recent
projections of CPB Netherlands Bureau for Policy Analysis (CPB), as published in the
Central Economic Plan (CEP) of 31 March 2021 and Update of the 2022-2025 Medium-
term Forecast of March 2021. The figures for 2020 in respect of public finances which are also
reported in the April Notification to the European Commission (EC), have been adjusted as a result
of actual figures by Statistics Netherlands. This is shown in the relevant tables in the Annex. The
figures do not contain data on the Recovery and Resilience Facility (RRF), as the Netherlands has
not yet submitted its application for the fund.

Page 2 of 41 2021 Stability Programme
TABLE OF CONTENTS
Foreword ............................................................................................................................ 2
Summary ........................................................................................................................... 4
Chapter 1: Overall policy framework and objectives ................................................................ 6
Chapter 2: economic outlook and epidemiological scenarios ..................................................... 7
Chapter 3: Budget balance and government debt .................................................................. 11
Chapter 4: Comparison with previous Stability Programme and sensitivity analysis .................... 15
Chapter 5: Sustainability of public finances ........................................................................... 18
Chapter 6: Quality of public finances.................................................................................... 23
Chapter 7: Institutional features of public finances ................................................................ 27
Annex 1: Stability Programme tables ................................................................................... 30
 Table 1a. Macroeconomic prospects ................................................................................... 30

 Table 1b. Price developments ........................................................................................... 30

 Table 1c. Labour market developments .............................................................................. 31

 Table 1d. Sectoral balances .............................................................................................. 31

 Table 2a General government budgetary targets broken down by subsector ........................... 31

 Table 2b. Breakdown of revenue ....................................................................................... 32

 Table 2c. Amounts to be excluded from the expenditure benchmark ...................................... 33

 Table 3. General government expenditure by function (based on unchanged policy) ................ 33

 Table 4. General government debt developments ................................................................ 33

 Table 5. Cyclical developments ......................................................................................... 34

 Table 6. Divergence from 2020 Stability Programme............................................................ 35

 Table 7. Sustainability of public finances ............................................................................ 35

 Table 7a. Contingent liabilities .......................................................................................... 36

 Table 8. External assumptions .......................................................................................... 36

 Additional table 1a. Stock of guarantees adopted/announced ................................................ 36

 Additional table 1b. Total Dutch guarantees. ....................................................................... 37

 Additional table 2. Discretionary measures adopted/announced according to the Programme .... 39

Annex 2: Simulation analysis .............................................................................................. 40

Page 3 of 41 2021 Stability Programme
SUMMARY

The Dutch economy shows resilience and will recover after the corona crisis. In the most
recent actual figures, the Dutch economy has shrunk by 3.7% as a result of the crisis in 2020. In
the forecast, which is the basis for this Stability Programme, the economy will recover by 2.2% in
the course of 2021 and by 3.5% in 2022. In 2021, the Dutch government continues to pursue an
expansive budgetary policy to mitigate the negative consequences of the corona crisis. It is for this
reason that the forecast provides for a general government balance of -5.9% in 2021. The forecast
assumes that the financial support packages under current policy plans will expire on 1 July, which
will result in the general government balance being -1.7% of gross domestic product (GDP) by
2022. In 2021, general government debt is expected to rise to 58.6% and due to the economic
recovery, it is expected to drop to 56.9% of GDP by 2022. According to the forecast, the
Netherlands will remain below the European reference value of 60%.

Development of the COVID-19 virus remains uncertain, which leads to uncertainty about
economic recovery. Due to this uncertainty, a forecast of an optimistic and pessimistic scenario
by the CPB has been included. In the optimistic scenario, the economy recovers rapidly after
discontinuation of contact-restricting measures. Consumer and producer confidence will increase
sharply and lead to increased consumption and investments. Economic growth is higher than in the
basic scenario and the government deficit and general government debt are developing favourably.
In the pessimistic scenario, a new COVID-19 outbreak leads to a new recession. Contact-restricting
measures will reduce household consumption, which, according to the forecast, will shrink the
economy slightly and then show very little growth. The government will pursue a broad budgetary
policy to mitigate the negative effects of the recession, resulting in a deterioration of the general
government balance and general government debt.

Dutch public finances have deteriorated due to the budgetary and economic impact of
the corona crisis. In 2019 there was still a budget surplus of 1.7% of GDP, and in 2020 we had a
budget deficit of 4.3% of GDP. The economic consequences of the corona measures were so
significant that the government decided to introduce additional emergency and support measures
and to have this negatively influence the budget balance. Expenditures on corona measures
amounted to a total of EUR 28 billion in 2020. Almost half of this (EUR 13.2 billion) went to the
Temporary Emergency Bridging Measure to Preserve Employment (NOW). For 2021, the CPB also
expects a budget deficit due to corona measures. Yet, the forecasts for future general government
balances and general government debts for the years 2022-2025 are more positive than was
previously expected. This difference is explained by the more favourable economic developments
according to the Central Economic Plan (CEP) 2021.

Sustainability of public finances is not in danger in the medium-term, but development of
the debt is surrounded by uncertainties. Compared with the Stability Programme of April 2020,
projections as a result of the corona crisis impact have been substantially adjusted. Nevertheless,
the risk of a sharply rising government debt appears to be limited in the medium-term. In an
estimate of scenarios based on historical data, in 90% of cases government debt remains between
35% and 70% of GDP in 2030. An impact test shows that more extreme scenarios, such as a
financial crisis, can have significant consequences for public finances.

Expenditures on corona measures have negatively impacted the sustainability balances
projected by the European Commission and the CPB. The EC projects a sustainability gap of
3.3% of GDP and the CPB expects a deficit of 1.8% of GDP according to the 2021 CEP. The corona
crisis has caused the sustainability balance, among other things, to deteriorate due to a higher
government debt and therefore greater interest expenses. Yet, according to both institutions, the
deficit is mainly caused by increasing healthcare expenditure as a result of the ageing population.
Other factors that may have future budgetary implications are public guarantees. The present risk
of government guarantees has increased by around EUR 60 billion in the past crisis year.

Page 4 of 41 2021 Stability Programme
The Netherlands is temporarily derogating from national budgetary agreements due to
the impact of the corona crisis. European budgetary rules currently provide scope for
stabilisation. The government has decided that the measures related to the corona crisis will
negatively influence the budget balance. This means a temporary derogation of the Dutch
budgetary rules for expenditures on corona measures. Under normal policy, the government
continues to adhere as much as possible to normally applicable budgetary rules. There are also
exceptions on a European level because of the corona crisis. The general escape clause of the
European budgetary rules, as laid down in the Stability and Growth Pact (SGP), has entered into
force. This means that Member States now do not need to be compliant with (the path towards)
their medium-term budgetary objective (MTO), according to the preventive arm of the SGP. At this
point in time, the Netherlands does not comply with the MTO. In a formal sense, the reference
values of the corrective arm of the SGP are still applicable. According to CEP forecasts, the
Netherlands exceeds the 3% reference value for the general government balance in 2020 and
2021. However, last year the European Commission concluded that starting excessive deficit
procedures was not justified because of the macroeconomic and budgetary impact of the corona
crisis. Thus, exceedance of a European reference value does not affect the Netherlands.

Page 5 of 41 2021 Stability Programme
CHAPTER 1:
OVERALL POLICY FRAMEWORK AND OBJECTIVES

This Stability Programme (SP) presents an update of the Dutch budgetary prospects, in conformity
with provisions of the Stability and Growth Pact (SGP).

The SGP’s general escape clause as a response to the COVID-19 pandemic, gives
European Member States the leeway to pursue budgetary policies beyond the scope of
the SGP budgetary frameworks. The general escape clause allows Member States in the
preventive arm (such as the Netherlands) to derogate from the path towards the medium-term
objective (MTO), if this does not jeopardize sustainability in the medium-term. Activation of the
clause does not suspend SGP procedures. This Stability Programme follows the guidelines for the
format and content of Stability and Convergence Programmes.1

The preventive arm requires that Member States comply with the medium-term
budgetary objective, the MTO. For the Netherlands, an MTO of -0.5% of GDP applies. Member
States who do not comply with this balance yet, must show sufficient improvement annually in
their structural balance towards the MTO. Member States with a structural balance that is more
negative than the MTO must adhere to the expenditure benchmark. This rule prescribes that non-
cyclical expenditure growth, insofar as this is not compensated by a policy-related increase in
revenues, lags behind (if the MTO has not been reached yet) or is equal (if the MTO is reached) to
the potential growth of the economy. However, activation of the general escape clause provides an
exception to these requirements. In formal terms, the Netherlands, like all other Member States,
also has an obligation to comply with the reference values of the corrective arm of the SGP. Yet,
last year, the European Commission (EC) concluded that starting excessive deficit procedures was
not justified because of the macroeconomic and budgetary impact of the corona crisis.

The Dutch national budgetary framework is based on pursuing a trend-based fiscal
policy. The model of trend-based budgeting, which has been used by cabinets since 1994, was
designed to absorb economic fluctuations. In order to manage public finances properly, expenditure
benchmarks are used which are agreed to at the beginning of the government term. On the
revenue side of the budget and with regard to unemployment expenditure, the principle of
automatic stabilisation applies: cyclical windfalls are used to benefit the balance and cyclical
setbacks to burden the balance. However, the coronacrisis is not a normal cyclical wave, as the
government was obliged to intervene directly in the economy by shutting down certain activities. It
is for this reason that the government has made a choice to have temporary measures that are
directly related to the corona crisis, negatively influence the budget balance. This means that there
is no need for expenditure cuts, to provide manoeuvrability within the expenditure benchmarks.
For normal policy, the government maintains the current budgetary rules to maintain as much calm
and predictability as possible.

Within the boundaries of the SGP, the government takes measures that reduce the
burden for households and strengthens the structural economic position of the
Netherlands. For an overview of progress made in the government's reform programme,
reference is made to the National Reform Programme. This contains a detailed description of the
manner in which the government fulfils the country-specific recommendations for the Netherlands
consistent with the European Semester.

1European Commission, Specifications on the implementation of the Stability and Growth Pact and Guidelines
on the format and content of Stability and Convergence Programmes, 5 July 2016.

Page 6 of 41 2021 Stability Programme
CHAPTER 2:
ECONOMIC OUTLOOK AND EPIDEMIOLOGICAL SCENARIOS

The CPB Netherlands Bureau for Economic Policy Analysis (CPB) predicts that the Dutch economy
will recover quickly after the corona crisis. According to the latest CPB forecast, the Dutch economy
will grow by 2.2% in 2021 and by 3.5% in 2022. Private consumption will rise sharply in 2022,
while consumption expenditure rises sharply in 2021. Increased investments, exports and imports
also show recovery. However, as a result of the crisis, unemployment is forecast to rise to 4.4%
and 4.7% respectively in 2021 and 2022. In the following years, unemployment will stabilize at
4.5%.

Economic outlook
The Dutch economy is growing in 2021 and 2022 and is recovering after the sharp
downturn of 2020. In 2020, real gross domestic product (GDP) decreased by 3.7%; an
historically major downturn due to the corona crisis. The forecast predicts a recovery in 2021, in
which economic growth will be 2.2% higher than potential growth. In 2022, further recovery
growth is expected with an economic growth of 3.5%. Private consumption remains low in 2021
and will only rise 0.6% after a sharp 6.4% downturn in 2020. However, in 2022, private
consumption will rise sharply and will recover towards the level prior to the corona crisis, partly
due to high savings by households previously and a substantial rise in collective labour agreement
wages in the years 2020 and 2021. Government consumption expenditure is rising sharply in 2021,
basically by 5.7%. This increase, to a considerable extent, is due to the financial support packages,
which the forecast assumes will expire on 1 July. In 2022, government spending will increase
slightly by an expected growth of 0.2%.

Table 2.1 Macroeconomic prospects
in % of GDP ESA Code 2020 (in billions of euro) 2020 2021 2022
1. Real GDP B1*g 798.9 -3.7 2.2 3.5
2. Nominal GDP B1*g -1.4 3.7 5.2
Components of real GDP
3. Private consumption
 P.3 336.5 -6.4 0.6 6.1
expenditure
4. Government final
 P.3 206.6 1.4 5.7 0.2
consumption expenditure
5. Gross fixed capital
 P.51 27.4 -3.6 2.4 2.8
formation
6. Changes in inventories
 P.52 + P.53 2.0 -0.1 0.0 0.0
(∆)
7. Exports of goods and
 P.6 630.0 -4.3 2.6 5.2
services
8. Imports of goods and
 P.7 545.2 -4.3 3.0 5.4
services
Contributions to real
GDP growth
9. Final domestic demand 711.9 -3.3 2.1 3.0
10. Changes in inventories
 P.52 + P.53 2.0 -0.1 0.0 0.0
(∆)
11. External balance of
 B.11 84.8 -0.4 0.0 0.4
goods and services

Business investments will grow in 2021 and 2022 as a result of rising confidence.
Investments respond positively to increasing revenue and better revenue expectations, supported

Page 7 of 41 2021 Stability Programme
by low financing costs. However, investment growth will be hampered by disproportionate
bankruptcies in some sectors when the support policy ends and balance sheet losses suffered by
companies during the pandemic.

This year, exports will increase by 2.6% and imports by 3.0%, as restrictions are also
lifted elsewhere in the world. However, the imports and exports of goods from the United
Kingdom will decline in 2021, partly due to the consequences of the corona crisis in the UK and
adjustment issues during the Brexit transition period. In January 2021, British exports of goods to
the EU decreased by 41%, and British imports of goods from the EU decreased by 29% compared
to December 2020. The CPB expects that these adjustment issues will also put constraints on trade
in the course of 2021 and 2022. The Netherlands compensates part of this loss by trading more
with other countries. The US support programme of USD 1,900 billion also has a positive impact on
exports.

After a decrease in 2021, employment will recover as from 2022, due to an upswing in
the economy. According to a higher population prognosis by Statistics Netherlands (CBS), the
supply of labour is also higher. The unemployment forecast was substantially revised downwards
by 1.7 percentage points to 4.4% in 2021. Unemployment will increase to 5% by the end of 2021
and will then decrease in the course of 2022. As usual, the economic recovery will only be reflected
in the unemployment rate after some delay. A recovering economy is initially reflected in the
number of hours worked, later in the number of employed people and only then in the
unemployment rate itself.

The dynamism in the labour market will increase after the support measures have ended.
On the basis of current policy proposals, the substantial current support measures end on 1 July.
This will be accompanied, in the short term, by reorganisations and bankruptcies. This brings
productivity-enhancing dynamism back to businesses, which benefits the economy in the long-
term. As a result, labour productivity increases.

Table 2.2 Labour market developments
 ESA
 Code 2020 (Level) 2020 2021 2022 2023 2024
 1. Employment (x 1000
 persons) 9511.2 -0.7 -0.2 0.8 1.2 0.8
 2. Employment, no.
 hours worked (in
 millions) 13310.6 -3.5 2.0 1.5 0.8 0.8
 3. Unemployment (% of
 the working population)2 357.3 3.8 4.4 4.7 4.5 4.5
 4. Labour productivity,
 persons 84.0 -3.1 2.4 2.7 0.6 0.6
 5. Labour productivity,
 no. hours worked 60.0 0.0 0.3 1.9 0.8 0.5
 6. Payroll of employees
 (in billions) D.1 398.9 2.7 2.8 1.8 3.2 3.0
 7. Compensation per
 employee (€) 41.9 6.2 0.7 0.4 2.3 2.2

As an open economy, the Netherlands is largely dependent on financial and economic
developments abroad. In 2020 and in early 2021, there was a severe downturn in global and
European production due to the corona crisis. In the forecast, global and European production will
recover in the course of 2021 as a result of vaccinations and more generous monetary and
budgetary policies. Global production will continue to increase in the years 2022 and 2023. This

2
 357.5 shows the number of unemployed of the working population x1000

Page 8 of 41 2021 Stability Programme
expected growth in production is surrounded by a number of uncertainties, such as the EU’s trade
policy with China and the US, among others, and development of the COVID-19 virus across the
globe. However, the expected GDP growth in markets relevant to the Netherlands is higher than
the global average, partly due to relatively positive expectations about the vaccination rate in these
economies. In addition, it is forecast that the oil price will increase significantly in 2021 to
USD 62.64 per barrel, and will then decrease slightly. The USD/EUR exchange rate is expected to
increase in 2021 and will remain stable in subsequent years.

Table 2.3 External assumptions
 2020 2021 2022 2023
Short-term interest rate (annual average) -0.4 -0.5 -0.5 -0.4
Long-term interest rate (annual average) -0.4 -0.3 -0.2 0.0
USD/EUR exchange rate (annual average) 1.1 1.2 1.2 1.2
Nominal effective exchange rate* 2.0 1.2 0.2 0.8
GDP growth, World excluding EU -4.0 4.8 4.2 3.9
GDP growth, EU -6.8 4.0 4.0 1.7
Growth of relevant foreign markets -9.0 6.0 6.0 4.1
World import volume, excluding EU -11.1 5.7 7.8 4.5
Oil price (Brent, USD per barrel) 41.8 62.6 59.2 56.8
* percentage changes in respect of a basket of trading partners

Epidemiological scenarios
The economic outlook is highly dependent on the evolution of the epidemiological
picture. Because of this major uncertainty, the CPB has projected a pessimistic and optimistic
scenario in addition to the basic projection. Scenario analysis helps to uncover uncertainty about
economic development and to gauge the order of magnitude of effects. Every scenario offers an
internally consistent economic picture; given assumptions about the duration and depth of the
economic shock. Policy can then take into account not only the most likely scenario in the basic
projection, but also possible alternatives.

In the optimistic scenario, lifting measures against the spread of the coronavirus will
allow the economy to recover quickly. In this scenario, consumer and producer confidence will
increase significantly and households will use previous savings for additional consumer spending.
Businesses will invest more, partly because of the low funding costs. In the optimistic scenario,
other European countries will also recover quickly and exports will increase significantly.
Employment will increase, which will tighten the labour market and wages will also increase. The
rising wages will increase consumption and thus boost economic growth. In this scenario, GDP will
grow by 2.6% in 2021 and by 5.1% in 2022. Unemployment will rise to 4.4% in 2021, but will drop
to 4.2% in 2022. As a result of higher tax revenues and lower unemployment compensation
benefits, the government debt and deficit are lower in this scenario.

In the pessimistic scenario, the coronavirus will continue to mutate and make
vaccinations ineffective. A new outbreak of the virus leads to a new economic recession in this
scenario. Households and businesses will become more cautious and uncertain, reducing
consumption and investments. The government continues to take far-reaching measures to
prevent the spread of the virus, further reducing consumption. In the pessimistic scenario, trading
partners will also be faced with new outbreaks of the coronavirus which will lead to a decline in
exports. New support packages mitigate the negative impact on production and unemployment,
but lead to a deterioration in the government deficit and government debt. GDP development will
be -0.8% in 2021 and 0.8% in 2022. Unemployment will rise sharply to 6.1% in 2022. As a result
of lower tax revenues and higher benefit payments, government debt will increase further.

Page 9 of 41 2021 Stability Programme
Table 2.4 Economic scenarios
 2020 2021 2022 2020 2021 2022 2020 2021 2022
 basic projection optimistic scenario pessimistic scenario

Gross domestic product (GDP, -3.7 2.2 3.5 -3.7 2.6 5.1 -3.7 -0.8 0.8
economic growth, %)
Household consumption (volume -6.4 0.6 6.1 -6.4 1.2 8.9 -6.4 -3.3 1.6
in %)
Capital formation (including -4.0 2.3 2.8 -4.0 3.1 5.8 -4.0 -3.0 -2.0
inventories, volume in %)
Exports of goods and services -4.3 2.6 5.2 -4.3 2.9 6.9 -4.3 -1.0 0.8
(volume in %)

Unemployed working population 3.8 4.4 4.7 3.8 4.4 4.2 3.8 4.6 6.1
(level in % of workforce)
Employment (in hours, change in -3.5 2.0 1.5 -3.5 2.1 2.2 -3.5 0.1 -1.8
%)

General government balance -4.3 -5.9 -1.7 -4.3 -5.7 -0.9 -4.3 -7.8 -5.7
(level in % of GDP)
General government debt (year- 54.4 58.6 56.9 54.4 58.2 54.7 54.4 62.2 66.7
end, level in % of GDP)

Page 10 of 41 2021 Stability Programme
CHAPTER 3:
BUDGET BALANCE AND GOVERNMENT DEBT

Dutch public finances have deteriorated due to the budgetary and economic impact of the corona
crisis. In 2019, there was still a budget surplus of 1.7% of GDP, and in 2020 we had a budget
deficit of 4.3% of GDP, according to CPB. We expect a budget deficit for the years ahead. Yet, the
forecasts for future general government balances and general government debts are more positive
than previously expected. This chapter contains both an explanation of budget balances and the
debt ratio as a breakdown of expenditures on corona measures.

Budget balance and government debt
Higher expenditures and lower revenues due to the corona crisis have led to an historic
budget balance of -4.3% of GDP in 2020, according to the 2021 Central Economic Plan
(CEP). A deficit is also expected for the years ahead as shown in Figure 3.1. Compared to the
CPB’s November forecast, the budget deficit will increase in 2021. This difference is mainly due to
substantial expansions of the support measures at the end of 2020 and the beginning of 2021. In
2022, the budget balance will improve due to the end of the support measures and the economic
recovery. For the years 2022-2025, the government deficit will be lower than in the previous
forecast due to improved economic development. This development will be reflected in various
ways in the general government balance. On the one hand, more economic growth leads to more
tax revenue and lower expenditure on unemployment benefits and social assistance benefits. On
the other hand, a growing economy ensures a reduction of the balance, expressed as a percentage
of GDP (denominator effect).

With the general government balances of 2020 and 2021, the Netherlands exceeds the
European reference value of -3%; as from 2022 onwards, the general government
balance will be below the European reference value of -3%. Strictly speaking, the reference
values of the corrective arm of the Stability and Growth Pact (SGP) are still in force, despite
activation of the general escape clause. However, last year the European Commission concluded
that starting excessive deficit procedures was not justified because of the exceptional uncertainty
relating to the macroeconomic and budgetary impact of the corona crisis. Thus exceedance of a
European reference value does not affect the Netherlands.

Figure 3.1 Development and projection of general government balance (in % of GDP)

At present, the Netherlands neither complies with the objective of the preventive arm of
the Stability and Growth Pact (SGP), being the medium-term objective (MTO). This can be
seen in figure 3.2. In the Netherlands, an MTO of -0.5% of GDP (pink line) applies, whereas the
structural balance was -1.9% in 2020. It is expected that this balance will deteriorate to -4.1% of

Page 11 of 41 2021 Stability Programme
GDP in 2021. In the following years, the structural balance will improve but will remain below the
MTO. Activation of the escape clause of the SGP means that Member States in the preventive arm
may provisionally derogate from their structural budgetary efforts. For the time being, Member
States do not have to comply with the expenditure benchmark, which normally enters into force on
non-compliance of the MTO. This expenditure benchmark is geared to sustain public finances in the
medium-term and requires that the percentual increase of corrected public expenditure does not
exceed the potential growth of the economy, corrected for a set budgetary effort.

Figure 3.2 Development and projection of structural balance (in % of GDP)

At the end of 2020, general government debt was 54.4% of GDP, according to the 2021
CEP, and thus remained below the European reference value of 60%. In 2021, the debt
ratio will increase to 58.6% due to budget deficits, tax deferrals granted and additional government
loans to businesses. In the following years, government debt will decrease slowly. Debt ratios for
the years 2020-2025 are lower in the CEP than in the CPB projection of last November. This
difference, just like the budget balance, is due to improved economic development resulting in
fewer expenditures, more revenue and a larger economy (denominator effect).

Figure 3.3 Development and projection of general government debt (in % of GDP)

Corona crisis expenditure
The automatic stabilisers were inadequate to limit the economic effects of the corona
crisis. The government’s coronavirus rules have halted both the services and economic activities in
many sectors. It has therefore been decided to introduce additional emergency and support
measures to minimise the impact on citizens and businesses. These support packages prevent

Page 12 of 41 2021 Stability Programme
businesses and their related employment from going bankrupt due to the sudden restrictions on
services. This will confine the detrimental economic effects caused by this exceptional crisis. The
government has also determined that expenditures on corona measures are to negatively influence
the budget balance in order to avoid cuts in other expenditure. This means that corona measures
fall outside the expenditure benchmark.

In total, discretionary expenditure on corona-related measures amounted to EUR 28
billion in 2020. This amount is more than the budgets of the ministries of Justice & Security and
Defence, together. In comparison with other countries too, the Netherlands has supported the
economy extensively, according to the IMF’s 2021 World Economic Outlook. Table 3.1 shows
expenditures on corona measures per budget chapter. More than half of the total amount has been
spent by the Ministry of Social Affairs and Employment, partly because of the Temporary
Emergency Bridging Measure to Preserve Employment (NOW). In the past year, the NOW spent
EUR 13.2 billion. Other major expenditures on corona measures are the Temporary Support
Scheme for Self-Employed Persons (TOZO) and the Reimbursement Fixed Costs
(TVL)/Compensation for Entrepreneurs in Affected Sectors (TOGS). Expenditures for these
measures amounted to EUR 2.7 billion and EUR 2 billion respectively in 2020.

The government’s support package also consists of tax measures to cushion the impact
on entrepreneurs during the corona crisis. These tax measures reduce current tax revenues.
Figure 3.3 shows that tax deferral for entrepreneurs as at 31 December 2020 amounted to
EUR 12.9 billion.

In addition, the government has attempted to partially dispel uncertainties in the
economy through various risk arrangements. At the European level too, risk arrangements
have been harnessed following the corona crisis, which the Netherlands partly guarantees. The
total amount of present risk related to the corona crisis is EUR 52.7 billion, as shown in figure 3.4.
Chapter 5 explains the policy on risk arrangements.

Due to the March 2021 elections, the Netherlands has not yet submitted a plan for use of
the Recovery and Resilience Facility (RRF) as part of the European recovery plan Next
Generation EU (NGEU). This means there have been no RRF expenditures in the Netherlands.

Table 3.1 Expenditures on corona measures per budget chapter
In millions of euros 2020
Total 27,751
Home Affairs 46
Foreign Affairs 7
Defence 43
Economic Affairs and Climate 2,507
Finance and National Debt 298
Municipalities Fund 848
Infrastructure and Water Management 803
Justice and Security 137
Kingdom Relations and BES Fund 50
Agriculture, Nature and Food Quality 245
Education, Culture and Science 715
Social Affairs and Employment 16,497
Public Health, Welfare and Sport 5,557

Figure 3.3 Corona-related revenue measures

Page 13 of 41 2021 Stability Programme
Figure 3.4 Corona-related risk arrangements

Page 14 of 41 2021 Stability Programme
CHAPTER 4:
COMPARISON WITH PREVIOUS STABILITY PROGRAMME
AND SENSITIVITY ANALYSIS

In comparison with the Stability Programme of April 2020, projections as a result of the impact of
the COVID-19 crisis have been extensively adjusted. This resulted in a substantial budget deficit in
2020, and as a result, a higher general government debt. Relative general government debt is
expected to decrease again after 2022, but actual development is clearly susceptible to shocks. To
clearly set out its impact on public finances, this chapter will look at the medium-term debt
developments and the uncertainties surrounding it.

Comparison with the 2020 Stability Programme
The Dutch economy is in a weaker position than was predicted at the time of the 2020
Stability Programme. The basis of projections in the 2020 Stability Programme had not yet
envisaged the impact of the COVID-19 crisis. In the meanwhile, it is clear that the crisis has had a
profound impact on the economy. The comparison of this 2021 Stability Programme with the 2020
Stability Programme therefore shows considerable differences.

The Dutch economy shrank in 2020 but will grow more rapidly in 2021 and 2022 than
expected at the time of the Stability Programme in April 2020. Table 4.1 shows how current
forecasts for GDP growth, general government balance and general government debt have been
adjusted in respect of projections in the previous Stability Programme. The GDP growth rate in
2020 has a negative difference of 5.1 percentage points as a result of the corona crisis. In 2021,
however, there is a positive difference of 0.6 percentage points and 2022 shows that recovery
growth is expected with a positive difference of 2.0 percentage points.

The general government balance is significantly lower than was expected at the time of
the previous Stability Programme. The Dutch government has pursued expansive budgetary
policy to mitigate the negative consequences of the corona crisis. This has negative consequences
for the general government balance. In 2020, 2021 and 2022, the general government balance is
respectively 5.3, 6.0 and 1.7 percentage points lower than was projected at the time of the
previous projection in April 2020. The difference in the projected general government balance will
improve in 2022 when the coronavirus comes under control and the economy bounces back. Fewer
support policies will be required in this phase.

General government debt has increased significantly compared to the expectations in the
previous Stability Programme, because the impact of the corona crisis was not
envisaged. In 2020, general government debt rose to 54.4% instead of 46.3% in the March 2020
projection. In 2021, general government debt will rise further as a result of the crisis and this
results in 13.4 percentage points higher than previously expected. However, in 2022, the projected
debt will decrease as the economy recovers from the COVID-19 crisis. The difference in the
expected general government debt in this Stability Programme compared with the previous
Stability Programme therefore also reduces.

Page 15 of 41 2021 Stability Programme
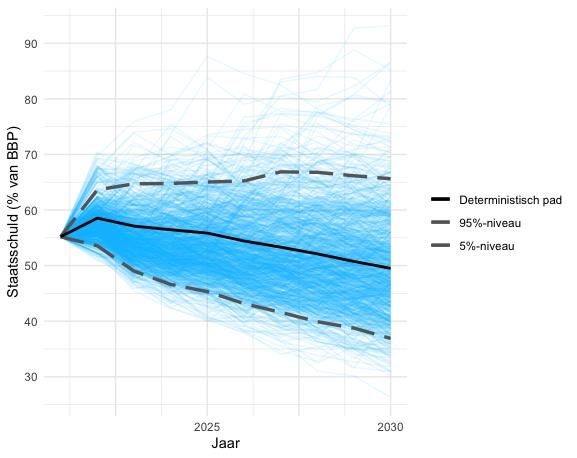
Table 4.1 Divergence from 2020 Stability Programme
in % of GDP ESA Code 2020 2021 2022
Real GDP growth
Update April ‘20 1.4 1.6 1.5
Current update -3.7 2.2 3.5
Difference -5.1 0.6 2.0
General government
 EDP B.9
balance
Update April ‘20 1.1 0.1 0.1
Current update -4.3 -5.9 -1.7
Difference -5.3 -6.0 -1.7
General government
debt
Update April ‘20 46.3 45.2 44.0
Current update 54.4 58.6 56.9
Difference 8.1 13.4 12.9

Debt development in the medium-term
The projection shows that government debt will decrease after 2021. As from 2022, the
general government balance deficit is expected to drop below 3%. Economic growth in that year
and the following years will lead to a steady reduction in the debt ratio, to below 55% of GDP in
2025.

Table 4.2 Key data on debt development
 2020 2021 2022 2023 2024 2025
 Economic growth -3.7% 2.2% 3.5% 1.8% 1.4% 1.3%

 General government balance -4.3% -5.9% -1.7% -1.4% -1.1% -1.0%

 General government debt 54.4% 58.6% 56.9% 56.0% 55.3% 54.9%

A simulation analysis shows that development of government debt is surrounded by
considerable uncertainties, but in the medium-term the risks are manageable. The graph
in Figure 4.1 shows simulated scenarios for debt development. Growth and primary balance are
based on CPB assumptions. The uncertainty about growth, changes in interest rates, and the
primary balance are simulated on the basis of historical data. The methodology is described in
more detail in Annex 2. In more than 90% of cases, debt remains between 35% and 70% of GDP
up to and including 2030.

Page 16 of 41 2021 Stability Programme
Figure 4.1 Key data on debt development

New shocks may be ongoing in the future. Although the risk of extreme shock is low, it is
interesting to analyse the impact of such a major shock on public finances. To get a picture of the
impact of a number of major shocks on public finances, CPB has carried out a so-called Impact
Test.3 In doing so, three extreme scenarios have been identified using the CRASH model developed
by the CPB: a financial crisis, a European debt crisis, and a global economic crisis. The Impact Test
shows that an economic shock can lead to a significantly increasing government debt. For example,
the financial crisis scenario leads to an increase in the debt ratio by almost 40% of GDP in 2025,
partly because implicit government guarantees are called upon. In the most recent financial crisis,
government debt increased by 25% of GDP. The scope and timing of new shocks remains difficult
to project. If an extreme shock occurs, it may possibly have consequences for the sustainability of
public finances.

3
 See Westerhout, E., A. Trommelen and S. van Veldhuizen 2020, Schokproef overheidsfinanciën 2020 [2020
public finance impact test], CPB Background document.

Page 17 of 41 2021 Stability Programme
CHAPTER 5:
SUSTAINABILITY OF PUBLIC FINANCES

In addition to short-term development of the general government balance and general government
debt, the government attaches importance to sustainability of Dutch public finances in the
medium- to long-term. Both the CPB and the European Commission (EC) regularly calculate this
sustainability. This chapter discusses the potential determinants of the sustainability balance and
compares the results of the various analyses. An overview is also presented of the National
government's contingent liabilities. These liabilities could have budgetary consequences in the
future.

Sustainability factors
The CPB assesses the sustainability of public finances based on the sustainability
balance. This balance indicates whether current government arrangements are sustainable in
future, without expenses needing to be reduced or taxes needing to be raised. Assumptions must
be made for quantification of the sustainability of public finances. In calculating the sustainability
balance, the assumption of ‘consistent arrangements’ plays an important role. Consistent
arrangements are based on the principle that interrelationships between various age groups in
society remain the same in terms of income, tax burden and the benefits of public services such as
care and education. As part of lifetime earnings, every future generation will benefit equally from
the government. Equal benefit from public services also means that healthcare expenditure
automatically increases as a percentage of GDP when society ages and thus becomes more in need
of care. Consistent arrangements, for that matter, are quite different from unchanged policy.
Unchanged policy would mean that, assuming incomes continue to rise, in the long-term everyone
would end up in the highest tax bracket and this means the tax burden would increase. For
example, when there are new technologies that improve care, they are also categorised under the
consistent (care) arrangements.

Development of public expenditure and revenue depends to a large extent on
demographic developments. Table 5.1, for example, shows that the proportion of over-65s in
our total population will increase to more than a quarter by 2040. This is why collective pension
expenditure (AOW) and healthcare expenditure will increase for the upcoming decades. Although
reforms already undertaken in the area of healthcare and pensions cause an easing of the increase,
these collective expenditures will continue to rise in future. While concurrently, government
revenues increase, particularly through policies implemented with effects after 2025, such as the
scale down in the rate of mortgage interest tax relief and the limited indexation of the second tax
bracket for pensioners4.

Another factor affecting the sustainability balance is expenditures on corona measures,
albeit to a lesser extent than demographic developments. To finance expenditures on corona
measures, additional funds have been borrowed, resulting in higher government debt and more
burdensome interest expenses in future. Table 5.1 lists the expected interest expenditure for
decades to come.

4
 For an overview, see section 3.5, Zorgen om Morgen [Caring about Tomorrow], CPB 2019

Page 18 of 41 2021 Stability Programme
Table 5.1 Sustainability of public finances
in % of GDP 2010 2021 2030 2040 2050 2060
Total expenditure 48.2 48.7 44.9 48.2 49.3 49.8
of which:
Age-related expenditure 20.8 22.2 23.3 25.4 25.8 25.5
Pension expenditure 6.2 7.2 7.5 8.1 7.8 7.6
Social security expenditure 11.7 12.1 12.3 12.9 12.6 12.4
Old-age and early retirement pension 4.5 5.2 5.6 6.2 5.9 5.7
Other pension provisions
 1.7 2.0 2.0 1.9 1.9 2.0
(occupational disability, survivors’ benefits)
Healthcare (cure) 5.9 6.5 6.7 7.1 7.2 7.0
Long-term care 3.5 3.7 4.4 5.3 5.9 6.1
Education expenditure 5.1 4.8 4.7 4.8 4.9 4.7
Interest expenditure 1.8 0.6 1.2 2.5 3.2 4.0
Total revenue 43.2 44.5 44.1 45.1 45.3 45.2
of which: property income 2.7 0.8 0.7 0.7 0.7 0.7
of which: pension contributions (or national insurance
 3.3 3.3 3.3 3.3 3.3 3.3
contributions)
Pension reserve fund assets 138.8 224.6 208.5 203.0 189.8 179.4
Pension expenditure paid by mandatory private system 4.8 5.4 6.3 8.2 7.7 7.0
Assumptions
Labour productivity growth 1.5 -0.5 1.5 0.8 0.9 1.1
Real GDP growth 1.0 -3.9 1.6 1.0 1.3 1.3
Participation rate (males) (15–64) 83.4 84.2 86.3 86.7 86.2 86.3
Participation rate (females) (15–64) 72.4 77.2 81.0 82.6 83.2 84.0
Total participation rate (15–64) 77.9 80.7 83.7 84.7 84.8 85.1
Unemployment rate (20–64) 4.5 3.8 4.3 4.3 4.3 4.3
Population aged 65+ as % of total population 16.2 20.5 24.1 26.1 25.7 26.1
Source: CPB

Analyses of comparison
CPB projects the sustainability balance at -1.8% of GDP according to the 2021 CEP. The
coronavirus outbreak has clearly increased the financial burden for the next generations. The CPB,
in fact, projected the sustainability balance at -0.8% in the 2020 CEP. However, the sustainability
balance is better than that in the November projection: when the deficit was 2.4%. The difference
is due to the fact that economic developments are more favourable according to the 2021 CEP,
which will lead to structural improvement in public finances. Although expenditures on corona
measures have a clear impact on the sustainability balance, the deficit is mainly caused by
increasing healthcare expenditure as a result of the ageing population.

The EC also forecasts the sustainability of EU Member States, including that of the
Netherlands. In the long-term, the EC assumes a larger sustainability gap than the CPB.
The EC forecasts two different sustainability balances. On the one hand, there is the S1 indicator,
which shows how much budgetary manoeuvre a Member State needs over the next five years to
reach a debt ratio of below 60% in 15 years' time. In this respect, the Netherlands has a deficit of
0.1% of GDP. On the other hand, there is the S2 indicator, which is similar to the sustainability
balance calculated by CPB and indicates the long-term sustainability. According to this indicator,
the Netherlands has a sustainability gap of 3.3% of GDP. The EC rates both sustainability balances
as an average risk. The EC, just like the CPB, concludes that the medium- to long-term

Page 19 of 41 2021 Stability Programme
sustainability deficits are caused by higher expenditure on pension incomes and (prolonged) care due to ageing of the population. The first explanation for the difference between the sustainability balances of the CPB and EC, is that the EC does not take current policy for general old-age pension into account. The EC takes a sustainability deterioration into account for the increasing General Old Age Pension costs after deducting taxes on pension incomes (statutory and supplementary pensions). The CPB does not do this, because the increase in pension incomes combined with the limited indexing of the extent of the second tax bracket for pensioners born after 1945, fully compensates the rising statutory retirement age. The CPB also takes into account a future increase in the degree of labour force participation, which tempers the increase in expenditure as part of the GDP. The difference is mitigated because the EC did not take into account the pension agreement: due to interlinking the statutory retirement age to life expectancy, it means that the EC's expenditure increase is lower. Secondly, healthcare expenditure in the CPB study has a greater negative effect than in the EC analysis. This difference is a consequence of a downward review by the EC of the future cost increase for care (prolonged care). The number of persons who initially make use of nursing- and care homes has been reduced, which means that the ageing of the population will have a smaller impact on future cost increases. Another (minor) factor is also the differences in projection methods. The third explanation is that the EC does not take policy on the revenue side of the budget into account after 2025. This particularly concerns the burden of households excluding taxes on pension incomes. The EC leaves this as constant and the CPB increases it, resulting in an improvement in the sustainability balance. The reason for this increase is that initiated policy is also taken into account in the CPB projections. This includes the increase in health insurance premiums in the period up to 2025, the scale down in the mortgage interest tax relief, and the restriction of transferability of tax credits. Contingent liabilities Policy in respect of contingent liabilities under risk arrangements is set out in the government's budgetary rules. A guarantee is an example of a conditional financial government liability to a third party outside the government. This liability is only payable if a certain circumstance (outcome of a risk) arises for the counterparty. Although new risk arrangements are sometimes necessary, the government acts in the most cautious manner possible when concluding the new risk arrangements. After all, risk arrangements involve a conditional financial liability that entails risks for the budget. Hence, a ‘no, unless’ policy applies in respect of risk arrangements. In doing so, the government not only looks at new arrangements, but is also cautious (in the relaxation of) existing arrangements. In principle, all arrangements will have a sunset clause. In addition, a government guarantee scheme almost always has a maximum, what is known as a ceiling. This ceiling may be an annual ceiling (maximum number of guarantees to be granted per year) or a total ceiling (no more guarantees to be granted than the ceiling). To arrive at a thorough weighing up of the risks involved in a risk arrangement, an assessment framework has been developed5. Three key elements of the assessment framework are: Reasons for government intervention and choice of instrument (effectiveness and necessity); 5 Government Assessment Framework Risk Arrangementshttp://wettenpocket.overheid.nl/portal/0ff0f42b- 2a70-45b7-a9c9- 3b4253b292e7/document/TOETSINGSKADER%20RISICOREGELINGEN%20RIJKSOVERHEID.pdf Page 20 of 41 2021 Stability Programme
Governance of risks, both ex-ante and ex-post; Pricing of the risk including both implementation costs and costs of losses. The Assessment Framework for Risk Arrangements is always sent to parliament when assessing a new risk. A second opinion will be requested from an independent, specialist party with regard to risk governance and the setting of premiums for large and complicated risks. During times of crisis, risk arrangements, such as guarantees and indirect guarantees, could be an efficient way to temporarily dispel increased risks in the market. In view of the exceptional nature of the corona crisis, in addition to the existing arrangements, fourteen risk arrangements were launched in 2020, plus four expansions of existing risk arrangements. Considering the urgency and severity of the crisis, the Dutch government has decided to temporarily derogate from three common principles within the risk arrangements policy. For example, in the first instance, the extent to which premiums for risk arrangements matches market requirements has been examined less strictly. In the second instance, the corona risk arrangements are covered by general government and not by a specific ministry. And thirdly, decisions regarding risk arrangements have been taken much faster than usual because of the urgency of the corona crisis. The present risk on government guarantees has increased significantly in this past year of crisis, from EUR 181 billion in 2019 to more than EUR 240 billion in 2020. It is important to actively reduce the present risk in economically good times, as these government guarantees pose a risk to the Government and to public finances. This creates a kind of buffer to be able to bear more risks in bad times. After the previous crisis, the introduction of the ‘no, unless’ policy made a significant contribution to this. Table 5.2 Government guarantees in % of GDP 2019 2020 2021 Public guarantees 22.3 30.5 29.1 of which: associated with the financial sector 17.9 22.7 21.9 Asian Infrastructure Investment Bank (AIIB) 0.1 0.1 0.1 DNB - participation in IMF capital 5.4 5.4 5.1 European Bank for Reconstruction and Development (EBRD) 0.1 0.1 0.1 European Financial Stabilisation Mechanism (EFSM) 0.4 0.3 0.3 European Financial Stability Facility (EFSF) 4.2 4.3 4.1 European Investment Bank (EIB) 1.2 1.6 1.4 European Stability Mechanism (ESM) 4.4 4.4 4.3 Development Finance Company (FMO) 0.7 0.7 0.7 EU Balance-of-payments (BoP) assistance 0.3 0.5 0.4 Next Generation EU (NGEU) 3.4 3.3 Single Resolution Fund 0.5 0.5 0.5 Support to mitigate Unemployment Risks in an Emergency (SURE) 0.8 0.7 World Bank 0.7 0.6 0.7 Source: Budget Memorandum 2021 The upward trend in the present risk on public guarantees is also shown in Table 5.2. In 2019, total liabilities was the equivalent of 22.3% of GDP versus 30.5% in 2020. The present risk is expected to decline to 29.1% of GDP in 2021. The guarantees specifically mentioned all have a present risk that is greater than half a billion euro and are associated with the financial sector. Through the financial sector, these guarantees assist the real economy abroad and stem from international agreements, such as the European recovery plan Next Generation EU (NGEU), the International Monetary Fund (IMF) and international development banks. Page 21 of 41 2021 Stability Programme
Aside from guarantees, the Netherlands also has other conditional liabilities, namely
indirect guarantees. An overview of this is shown in Table 5.3. This concerns a total rounded off
sum of EUR 290 billion in 2017. This figure will rise to EUR 307 billion in 2021. The main reason for
this rise is that 70% of the total number of indirect guarantees is part of the Homeownership
Guarantee Fund (Waarborgfonds Eigen Woning, WEW), covering the National Mortgage Guarantee
(NHG). Due to the upward trend in house prices and thus the value of the mortgages, the present
risk in the NHG scheme increases.

The risk of indirect guarantees essentially differs from risk that the government runs for
guarantees. There are a number of reasons for this. Firstly, in the case of an indirect guarantee,
the guarantee obligation is not issued directly by the government but by a specially designated
indirect guarantee fund, so that the government merely acts as an indirect guarantor. Secondly,
the financial security of indirect guarantees have multiple layers, which limit risks for the
government. For example, participants in the Guarantee Fund for the Healthcare Sector (Stichting
Waarborgfonds voor de Zorgsector, WFZ) and the Social Housing Guarantee Fund (Waarborgfonds
Sociale Woningbouw, WSW), have an obligation to support the fund financially if the fund’s equity
drops to below a certain level, known as the liability. Only in an extreme case can the fund rely on
the government. A fund then gets an interest-free loan from central government, sometimes
together with local and regional authorities. This loan must be repaid.

Table 5.3 Indirect guarantees
In millions of euros 2020 2021

Total 289,745 307,731
Guarantee Fund for the Healthcare Sector 6,390 6,130
Social Housing Guarantee Fund (WSW) 81,355 87,100
 Homeownership Guarantee Fund (WEW) 202,000 214,501
Source: Budget Memorandum 2021

Page 22 of 41 2021 Stability Programme
CHAPTER 6:
QUALITY OF PUBLIC FINANCES

Securing the quality of public finances is essential for an effective and efficient deployment of
public funds. Evaluations and other impact studies are not only necessary for accountability of
policy, but also for gaining an insight into the functioning of policy. Based on the 2017–2021
coalition agreement ‘Vertrouwen in de toekomst’ [’Trust in the future’], the government has
worked on the ‘Inzicht in Kwaliteit’ [‘Insight into Quality’] operation to further broaden its insights
into effectiveness and efficiency of government policy, and to apply such insights in shaping new
policy and the ongoing improvement of existing policy.

Introduction
In the Netherlands, we have a government-wide evaluation system to gain insight into the quality
of public finances. This government-wide evaluation system focuses on the system of laws, actors
and instruments aimed at gaining insight into the quality of policy choices, the implementation of
these choices, and the results achieved. Ministers are responsible for regularly evaluating their
policy areas. In addition, there are Interdepartmental Policy Reviews (IBOs) and Broad-based
Social Reconsiderations (BMHs) that map out a broad spectrum of alternative policy areas. Another
instrument in the evaluation system is the Social Cost Benefit Analyses (MKBAs) which are carried
out before the start of certain major projects. This chapter describes the preliminary results of the
‘Insight into Quality’ operation and highlights a number of instruments in the evaluation system,
namely the Strategic Evaluation Agenda, IBOs and MKBA.

‘Insight into Quality’ operation
In the coalition agreement, the government decided to set up the ‘Insight into Quality’ operation.
This was started in 2018. During the cabinet period, the Dutch House of Representatives was
informed on progress semi-annually. The following is a brief summary of the operation. Further
information is available in the progress reports6.

The objective of the ‘Insight into Quality’ operation is to gain a better understanding of policy
results and to use these insights better to enhance the socially added-value of policies. This
objective has been elaborated in three change assignments in the progress reports: strategic
evaluation to gain more insight than ever during the entire policy cycle; continuous improvement
to make full use of insights for redirecting or improving; and learning together to gain more insight
and leverage in collaboration than ever before. For this purpose, three tracks have been started:

 1. Ministerial initiatives: Efforts are being undertaken to set up concrete initiatives focused on
 increasing the impact of policy. Nineteen initiatives have been started since October 2018.
 Most of them have been completed, some are still being run by the ministries who are
 responsible. The initiatives provide various types of lessons on what is needed to carry out
 good evaluations and monitoring, given the often imperfect research environments. The
 initiatives also show that more is often possible than initially seemed to be the case.
 2. Strengthening the evaluation system: Aside from specific ministerial initiatives, efforts have
 also been made to strengthen the government-wide evaluation system. Among them were
 more strategic evaluations for a specified date, improving the substantiation in policy
 preparation, and focusing more on public value. As a result, the Strategic Assessment
 Agenda (SEA) was launched, a pilot was carried out with a separate annex for
 substantiation of policy proposals according to Section 3.1 of the Government Accounts Act
 2016 (Comptabiliteitswet), and a new evaluation instrument was introduced using the
 Public Value Scan. Section 3.1 of the Government Accounts Act states that policy
 proposals, policy intentions and policy commitments submitted to the Dutch House of

6
 Fourth progress report on ‘Insight into Quality’ operation, 10 March 2021 Kamerbrief over vierde
voortgangsrapportage operatie Inzicht in Kwaliteit | Kamerstuk | Rijksoverheid.nl [Letter to Parliament on
Fourth Progress Report Insight into Quality operation | Parliamentary Paper | Rijksoverheid.nl]

Page 23 of 41 2021 Stability Programme
You can also read