A Study of Political Economy in the Age of Austerity: How Incumbent Partisanship Affects Anti-Government Movements
←
→
Page content transcription
If your browser does not render page correctly, please read the page content below
A Study of Political Economy in the Age of Austerity:
 How Incumbent Partisanship Affects Anti-Government
                       Movements
                                          Junpei Suzuki∗1,2
                                      1
                                   Waseda University †
                     2
                       Japan Society for the Promotion of Science‡

                                          January 26, 2021

                                               Abstract
          In the conventional literature of comparative political economy, fiscal austerity has
      been considered as a policy pursued typically by governments that adhere to conser-
      vative economic ideologies. In recent decades, however, especially after the Eurozone
      Crisis in 2009, not only right-wing governments but leftist and left-center coalition
      governments have also carried out austerity policies. While it is generally documented
      that fiscal austerity spurs citizens’ grievances and leads to anti-government movements,
      whether and how the varying partisanship of the incumbent government affects the
      pattern of such movements is yet to be known. In this paper, I argue that austerity,
      when adopted by left-dominant governments, adds a “premium” to public grievances
      because, as the classic partisan theory posits (Hibbs 1977; Alesina 1987; Garrett and
      Lange 1989), citizens’ prior beliefs about policy consequences are asymmetrical such
      that they have fewer expectations of austerity when the left-wing parties are in power.
      Accordingly, I hypothesize that austerity led by the leftist governments results in a
      higher likelihood of anti-government movements than that led by the right-dominant
      government. I support this hypothesis by analyzing panel data covering up to 37
      developed countries between 1973 and 2015.

   ∗
      A previous version of this paper was presented at the 2020 APSA Annual Meeting Exhibition, which was
held virtually on. I thank Susumu Annaka, Antonio Benasaglio Berlucchi, Kentaro Hirose, Fumi Ikeda, Ikuo
Kume, Masaru Kohno, Anna Luehrmann, Hideko Magara, Sofia Perez, Kohei Tabei, and Yukino Watanabe
for helpful comments. This work is financially supported by JSPS KAKENHI Grant-in-Aid No. 19J14502.
(ibn-la-ahad@asagi.waseda.jp)
    †
      1-6-1 Nishiwaseda, Shinjuku-ku, Tokyo, Japan.
    ‡
      5-3-1 Kohjimachi, Chiyoda-ku, Tokyo, Japan.

                                                    1
Introduction
Fiscal austerity yields harsh impacts on the economic and social well-being of citizens by
worsening their employment opportunities, welfare benefits, and financial situations gener-
ally, even damaging their physical and mental health conditions (Cummins 2018; Karanikolos
et al. 2013; Stuckler and Basu 2013). Fiscal austerity is also said to undermine social capitals
of communities (Jones et al. 2016) and to alter culture and practice in workplace (Walker,
Annison, and Beckett 2019). Because of such manifold adverse consequences, austerity mea-
sures have often fueled furious responses from citizens in many countries, especially after the
Eurozone Crises in 2009. In Greece, for example, citizens initiated a large-scale anti-austerity
movement, called the “Indignant Citizens Movement,” by starting nationwide demonstra-
tions and strikes started on May 5, 20101 . Portuguese youth launched a movement called
the “Geração à Rasca” (“desperate generation,” in English), asking for improved working
conditions2 . Inspired by this movement in the neighboring country, people in Spain also
started the “15-M Movement” on May 15, 2011, as a protest against the labor market re-
forms. In the United Kingdom as well, a group of college students, called ”UK Uncut,” took
the initiative of direct actions against public expenditure cuts and corporate practices of tax
avoidance3 .
In the literature of comparative political economy, the recognition that fiscal austerity can
be a major source of large-scale anti-government movements is hardly new (e.g., Haggard,
Lafay, and Morrison 1995; Paldam 1993). What is noteworthy, however, is the fact that the
frequency of such movements has been dramatically increasing in recent years, as shown in
Figure 14 . According to this figure, which tracks the annual mean number of anti-government
1. BBC (2010) “Three dead as Greece protest turns violent”. Retrieved from
http://news.bbc.co.uk/2/hi/8661385.stm on September 12, 2020.
2. Schott, Ben (2011). ”Geração à Rasca - NYTimes.com”. The New York Times. Retrieved from
https://schott.blogs.nytimes.com/2011/05/05/geracao-a-rasca/ on September 12, 2020.
3. The Guardian (2010) “High street stores hit in day of action over corporate tax avoidance” Re-
trieved from https://www.theguardian.com/uk/2010/dec/19/uk-uncut-tax-avoidance-protests on September
12, 2020.
4. The definition of anti-government movements and country coverage is described in the fourth section.
2Note: For the definition of anti-government movements, please see the
”Data, Variables, and Estimation” section.
Source: Banks and Wilson (2020)
Figure 1: Time-Series Trend of Mean Number of Anti-government Movements between
1972 and 2015
movements in 37 developed countries, the trend reveals a steady decline in the frequency of
such movements during the 1990s and the early 2000s, but, after 2010, the trend seems to
have reversed drastically.
Given the long, sustained interest in the role of political parties in comparative political
economy, it is surprising that very little is known about whether and how the varying parti-
sanship of incumbent government affects the pattern of these anti-austerity movements. The
present paper seeks to fill this vacuum in the literature, by extending the classic partisan
theory (Hibbs 1977; Alesina 1987; Garrett and Lange 1989) and conducting original empiri-
cal analysis. I begin by accepting the notion of the “convergence thesis” advanced by a group
of economists and political scientists (Cusack 1999; Kurzer 1993; Scharpf 2000), observing
3that, in recent years, not only right-wing governments but leftist and left-center coalition
governments have also carried out austerity policies. I argue, however, that the behavioral
consequences of adopting austerity measures are not uniform, depending on the partisanship
of the incumbent government. More specifically, I argue that austerity adds a “premium” to
public grievances when adopted by left-dominant governments because, as the partisan the-
ory posits, citizens’ prior beliefs about policy consequences are asymmetrical such that they
have less expectations of austerity when the leftist parties are in power. Especially those core
supporters of left-wing parties are likely to feel disappointed and even betrayed, when they
face their own favored government implementing austerity. Furthermore, because of such
dismay, austerity adopted by left-dominant governments may have an effect of undermining
the perceived utility of election as an opportunity for expressing interests, thus encourag-
ing these supporters to retreat from electoral process (cf., Schäfer and Streeck 2013) and
to opt for other forms of political participation, including anti-government movements(cf.,
Flesher Fominaya 2017). Accordingly, I hypothesize that austerity led by the left-dominant
governments results in a higher likelihood of anti-government movements than that led by
the government of the rightist parties. I test this hypothesis by analyzing panel data for 37
developed countries between 1973 and 2015, and present evidence in its support.
The remainder of this paper proceeds as follows. The next section reviews the extant
literature and points out its problems in examining the mechanism of anti-austerity move-
ments. The third section extends the conventional partisan theory and introduces a testable
hypothesis. The fourth section describes the data and methodology for empirical analysis
and present the result. The final section concludes with a summary of findings and discussion
for further research.
Previous Literature
The “partisanship theory” in comparative political economy posits that political parties with
different support base and ideological orientations have different preferences on economic
4policies. The seminal work in this tradition is Hibbs 1977, which argued and demonstrated
that right-wing parties, supported by middle-income groups and businesses, put a higher
priority on price stability and try to balance the government budget, while left-wing par-
ties, supported by lower-income groups and ordinary employees, put a higher priority on
employment by expanding government expenditure. A wide variety of empirical studies has
since highlighted such left-right differences in economic policies and their consequence (e.g.,
Beckmann et al. 2017; Belke and Potrafke 2012; Boix 1998, 2000; Bräuninger 2005; Franzese
2002; Garrett 1995, 1998; Hibbs 1977; Korpi and Palme 1998, 2003; Potrafke 2009, 2017).
More recently, this well-established theoretical perspective has been challenged by the
so-called “convergence thesis” advanced by some economists and political scientists, who
point out that the left-right divide in economic policies has been fading away (e.g., Armin-
geon and Guthmann 2014; Boix 2000; Cusack 1999; Hines and Summers 2009; Hübscher
2015; Milner and Judkins 2004; Osterloh and Debus 2012; Persson and Tabellini 1992, 1994;
Sakamoto 2008; Schäfer and Streeck 2013). Proponents of this thesis generally attribute the
disappearance of left-right differences to the following three causes. First, they emphasize
the impact of economic globalization, particularly that of capital flight. Taxation on capi-
tal should otherwise provide welfare states with a sufficient financial basis. Globalization,
however, may undermine this revenue as it encourages capital to move beyond state borders
(Schäfer and Streeck 2013; Scharpf 2000). Globalization also has an effect of deepening fiscal
reliance on international financial market where actors prefer and often try to impose aus-
terity measures upon national governments (e.g., Cusack 1999). Second, the proponents of
the convergence thesis highlight changes in the labor market structure entailed by deindus-
trialization, a process defined as “the massive shift in employment from relatively dynamic
manufacturing activities to generally less dynamic service provision” (Pierson 1998, 542).
In a traditional industrial society, the labor market structure is said to be characterized by
the existence of powerful trade unions as well as the practice of life-time and highly-paid
employment, all of which once contributed to political fortune of left-wing parties. Dein-
5dustrialization has changed this structure into the unorganized, temporarily-employed, and
low-wage model (Hemerijck 2018) , which may in turn have eroded the electoral basis of
left-wing parties (Kessler-Harris 2018; Kurzer 1991, 1993; Rueda 2005, 2006). Third, the
convergence thesis underlines the impact of population aging, especially among advanced
economies (Pierson 1996, 1998). Population aging may benefit left-wing parties electorally
as it increases their supporters, i.e., the elderly who rely on broad range of welfare services.
The increase of welfare recipients, however, imposes heavy burden on the governments’ fiscal
balance, which may prevent left-dominant governments to expand welfare expenditure. The
aging therefore functions as an inhibitor, not a driver, of partisan politics.
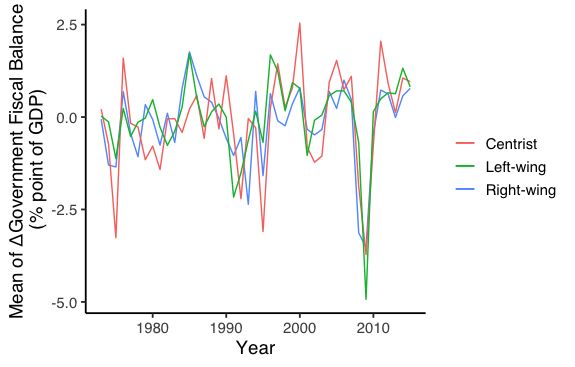
Due to these difficulties, it is often pointed out that leftist governments have had no choice
but to abandon their traditional policies and to opt for economic measures that were once
typically pursued by right-wing parties in office. Indeed, the partisanship of the incumbent
government seems to have lost its predictive power as determinant of economic policies, as
illustrated by Figure 2. In this figure, a set of time-series trends of government fiscal balance
are depicted for 37 developed countries between 1972 and 2015 based on the partisanship of
the incumbent government. According to the figure, the national fiscal policy does not differ
according to the partisanship of the incumbent government from the 1970s onward.
What are the socio-political consequences that such a partisan convergence brings about?
To this question, in my view, the extant literature has not yet reached a scholarly consensus5 .
Indeed, the arguments and predictions thus far offered vary considerably.
As noted earlier, the previous generation of studies had investigated and indeed confirmed
correlations between austerity adoption and anti-government movements (e.g., Haggard,
Lafay, and Morrison 1995; Paldam 1993; Ponticelli and Voth 2019; Voth 2011), but their
analyses did not pay attention to the question of partisanship per se6 . Some recent studies
5. Arguably, the convergence thesis itself is not a consensus, as some scholars contend that left-right
partisan politics remain salient. For such a view, see Garrett 1995, 1998 and Korpi and Palme 2003.
6. In this early literature, scholars used different words, other than austerity, to describe government
policies. Paldam 1993, for example, used the term “adjustment measures,” to denote not only fiscal austerity
but also exchange rate control, anti-inflation programs, and domestic demand management.
6Note: For the definition of government fiscal balance and government
partisanship, please see the ”Data, Variables, and Estimation” section.
Source: World Bank (2020)
Figure 2: Time-Series Trend of Mean of Annual Difference in Government Fiscal Balance
by Government Partisanship between 1972 and 2015
have updated these earlier studies, based on the dataset that covers a longer period and larger
number of countries, (e.g., Ponticelli and Voth 2019; Voth 2011), but they too generally fail
to consider the partisan effect, nor do they elaborate on the impact that the disappearance
of the left-right differences might incur.
In another strand of research, which does take the partisan convergence more seriously,
claims and analyses have been offered that highlight a declining trend of voter turnout
especially among Western countries. Schäfer and Streeck 2013, for example, posit that “many
citizens now feel that electoral choices are limited and that turning out to vote is futile” (p.10)
because whichever party is in office austerity is likely to be adopted as part of economic
policy. Their prediction echoes with the argument offered in Armingeon and Guthmann
2014, which contend that austerity measures, often forcefully imposed upon by external
actors like the IMF-EU-ECB Troika and the international financial market, led to decreased
trust in national democracy. These recent studies thus suggest that the convergence has an
7effect of reducing citizens’ perceived utility of election as a means of expressing their interests.
However, while this line of studies shed light on some aspects of the convergence effect, in
my view, their narrow focus on the electoral process fails to capture the significance of the
dramatically increased anti-government movements. They fail, in particular, to address the
possibility that the rise of such movements has been fostered precisely because of the reduced
utility of elections.
In this context, Flesher Fominaya 2017 offers a novel perspective. In this detailed case
study on southern Europe after the Global Crisis in 2007/2008, she explicitly cautions that
austerity alone is insufficient for explaining the occurrence of anti-government movements.
Like Schäfer and Streeck 2013, she acknowledges that convergence hinders citizens from
voting, but she also emphasizes that retreating from electoral participation does not mean
retreating from political participation entirely. Besides participating in elections, citizens
have other options to convey their interests to the incumbent government, and these options
are all the more attractive for those citizens who percieve the ordinary electional process
is too ineffective to stop austerity. Now that left-wing parties adopt austerity, the emerged
situation makes electoral participation unattractive for a larger subset of citizens. Here lies
the seed for the recent growth of anti-government movements.
The discussion in Flesher Fominaya’s case study can and should be generalized, because
its insight is pointing to the need to reformulate the partisan theory in the age of austerity.
It is true, and I am prepared to accept, that the convergence thesis seriously challenges the
explanatory power of incumbent partisanship on economic policies. However, partisanship
matters, not only as far as policy choices are concerned, but in the ultimate behavioral
consequences in terms of voters’ political participation. While the partisan convergence
(in policy) may have caused the dramatic rise of anti-government movements, the pattern
of such movements may not be uniform, depending on the partisanship of the incumbent
government responsible for austerity. In the next section, I shall articulate this logic further
and more formally, and intend to draw a testable hypothesis.
8Partisan Theory in the Age of Austerity: “Leftist Premium” Hypoth-
esis
To understand whether and how the varying partisanship of the incumbent government af-
fect the pattern of anti-government movements, let us revisit why citizens are motivated to
participate in such movements when they face governments adopt policies of austerity. As
noted earlier, austerity severely affect citizens’ well-being, yielding negative impact on their
employment opportunities, welfare benefits, and overall economic conditions. The worsened
financial status of citizens feeds back to macroeconomic performances by, for example, reduc-
ing general consumptions and making firms and factories reluctant to expand investments.
The deteriorated macroeconomic performance, in turn, worsens the financial status of citi-
zens even further. As austerity causes such a vicious cycle, citizens start to nurse grievances
against the incumbent government that has initiated austerity, thus taking to the street to
express their grievances. This is a summary of the causal mechanism which links austerity
and anti-government movements.
Though building upon this mechanism, I insist on the importance of taking into account
the partisanship of the incumbent government responsible for austerity measures. More
specifically, I propose the “leftist premium hypothesis” which suggests that the level of public
grievances is relatively higher (with the added “premium”) when austerity policy is adopted
by left-dominant governments. The grounds for this hypothesis are embedded in the original
argument of the partisanship theory (Hibbs 1977; Alesina 1987; Garrett and Lange 1989),
namely its basic tenet that citizens have asymmetrical prior briefs about the government
behavior depending on whether the parties in power are left-wing or right-wing. Thus, for
citizens, the austerity measures taken by the rightist government remains something in the
realm of their expectations, though they certainly cause grievances. On the other hand,
austerity policies adopted by leftist parties are likely to lead to a different scenario, as such
a situation is in conflict with citizens’ prior briefs about the behavior of these parties. This
cognitive dissonance may be sensed most strongly by the traditional supporters of the leftist
9parties. Especially for those who are less-well-to-do and thus depend more heavily on public
services, the prospect of retrenchment of these services is likely to feed disappointments and
even the feeling of betrayal. It is for this reason I hypothesize that a “leftist premium” is
added to the level of grievances, leading to a higher likelihood of anti-government movements,
when the leftist governments adopt austerity policies.
This “premium,” furthermore, is enhanced because, as noted by the previous studies
like Schäfer and Streeck 2013, the convergence has the effect of decreasing the perceived
utility of election as a process of expressing interests. Certainly, in the situation of right-
wing austerity, angered citizens can still aim to vote the right-wing parties out of office, in
accordance with their prior briefs that the left-wing parties, if elected, will retract austerity.
When they face austerity initiated by left-wing austerity, however, citizens may no longer
have confidence in the electoral process because there is no alternative party for which to
vote in their hope of reversing austerity. Some of these citizens, as a result, may choose
another route of voicing their interests, namely through anti-government movements7 .
By extending this logic to the case where austerity is implemented by centrist govern-
ments, it is reasonable to predict that the likelihood of anti-government movements in such
a situation is still higher than the case of rightist austerity. Generally, citizens do not expect
centrist parties to adopt austerity. For that reason, it is possible to hypothesize that similar
premium may be added to the level of public grievances against the centrist governments
as well. However, the centrist premium is unlikely to be as sizable as the leftist premium,
because the core supporters of the centrist parties still have an alternative, i.e. the leftist
parties, to vote for in their hope of reversing austerity. Their sense of efficacy in relying on
the electoral process is not entirely shattered and, at least in comparison with the case of
leftist austerity, they are less motivated to take their grievances directly to the streets.
In sum, the partisanship of the incumbent government responsible for austerity affects
7. This mechanism can be paraphrased by the exit-voice framework of Hirschman 1970. The decreased
utility of electoral participation means the disappearance of an exit option, which constitutes a solution to
a collective action problem in expressing voices, namely initiating anti-government movements.
10the level of public grievances and the citizens’ perceived utility of electoral participation,
which in turn determine the likelihood of anti-government movements. My main hypothesis,
and its corollary, can thus be stated:
Hypothesis: The likelihood that anti-government movements occur in the case
where austerity is implemented by leftist governments is higher than that in
the case where it is implemented by the rightist governments.
Corollary Hypothesis: The likelihood that anti-government movements occur
in the case where austerity is implemented by centrist governments is higher
than that in the case where it is implemented by the rightist governments, but
not as high as in the case where it is implemented by the leftist governments.
Data, Variables, and Estimation
In this section, I test the above hypothesis based on unbalanced panel data, assembled from
various sources, of 37 developed countries for the period between 1973 and 20158 . I first
introduce main variables and then elaborate on the model and methods for estimation.
Dependent Variables
For my key dependent variable on the anti-government movements, I rely on Cross-National
Time-Series data constructed by Banks and Wilson 2020, a dataset used in many previous
studies on social unrest (e.g., Broz, Zhang, and Wang 2020; Ponticelli and Voth 2019; Voth
2011). This dataset records, based on articles published in the New York Times, a wide
variety of domestic conflict events in a given country-year, which are categorize into eight
episodes as defined by Tanter 1966: assassinations, general strikes, guerrilla warfare, major
government crises, purges, riots, revolutions, and anti-government demonstrations. For the
8. The data covers Australia, Austria, Belgium, Bulgaria, Canada, Croatia, Cyprus, Czech Republic,
Denmark, Estonia, Finland, France, Germany, Greece, Hungary, Iceland, Ireland, Israel, Italy, Japan, Latvia,
Lithuania, Luxembourg, Malta, Netherlands, New Zealand, Norway, Poland, Portugal, Romania, Slovakia,
Slovenia, Spain, Sweden, Switzerland, Turkey, and the United Kingdom.
11Source: Banks and Wilson (2020)
Figure 3: Distribution of Anti-government Movements
analysis below, I measure the frequency of anti-government movements by summing the
frequency of anti-government demonstrations, riots and general strikes, disregarding others
(guerilla warfare, major government crises, assassination, revolution, and purges) deemed
irrelevant for the analysis of the developed countries. The total number of anti-government
movements thus constructed is 2072.
Of the three episodes included, the most frequent is anti-government demonstrations
(54.5%), and riots (32.1%) and general strikes (13.4%) follow in that order. Table A.1
reports summary statistics, and Figure 3 illustrates the variable distribution. On average,
anti-government movements are rare events in the context of modern developed countries.
Such rarity offers all the more reasons, in my view, to regard that the recent rise of anti-
government movements as representing a dramatic development worthy for a systematic
investigation.
Independent and Control Variables
Fiscal Policy
12To measure tendency toward austerity requires a patent assessment of fiscal policy under-
taken by different governments over time. In the previous studies, two different approaches
have been used to measure government fiscal policy. The so-called narrative approach,
taken by earlier studies like Paldam 1993 as well as more recent and sophisticated works like
Muñoz, Anduiza, and Guillem 2014, determines the duration of austerity measures by citing
historical documents. While this approach can exclude changes in non-political factors “cor-
related with other developments affecting output” (Guajardo, Leigh, and Pescatori 2014),
the critical disadvantage is its dependence on the observer’s arbitrary decisions on what
events and incidents can be regarded as changes in the government’s fiscal policy position.
In what follows, I opt for the other established approach which utilizes standard economic
indicators, as this approach is widely accepted in the literature as well (e.g., Alesina and
Ardagna 2010; Alesina et al. 2002; Alesina and Perotti 1996; Giavazzi and Pagano 1990;
Ponticelli and Voth 2019; Voth 2011).
More specifically, I use two variables to measure government fiscal policy. First, ΔBalance
is the annual difference in government fiscal balance calculated as government revenue minus
government expense, as a percentage of GDP. The data on government revenue and expense
is from World Bank Open Data (World Bank 2020), and the detailed description is provided
in Table A.1. The higher value of ΔBalance indicates the improvement of government fiscal
balance and thus captures a tendency toward austerity. Second, I use annual difference
of cyclically adjusted primary balance, ΔCAPB. Since this indicator excludes government
borrowing, interest payments and cyclical variation in fiscal balance, it may be more suitable
in measuring government fiscal policy without the influence of non-policy factors9 . Its data
source is the OECD Economic Outlook (OECD 2019). Like ΔBalance, the higher value of
ΔCAPB captures a stronger tendency toward austerity. The description of this variable is
provided in Table A.1 as well.
Figure 4 depicts the distributions of these two variables. As shown, the values are clus-
9. CAPB is widely used by economists. See, among others, e.g., Alesina and Ardagna 2010; Alesina and
Perotti 1996; Giavazzi and Pagano 1990.
13Source: World Bank (2020) and OECD (2019)
Figure 4: Distribution of Fiscal Variables
tered around zero, and over 10-percentage-point changes in the government fiscal policy
rarely occur. However, the drastic deterioration of the government budget is observed in
2009, which reflects the explosion of the government deficit caused by the global financial
crisis. The subsequent increase implies that many governments responded to the crisis by
austerity measures.
Partisanship
For measuring partisanship, I use data on the orientation of incumbent governing parties in
a given country-year from the ParlGov database (Döring and Manow 2019). This dataset
records elections, political parties, and cabinets in established democracies, namely all EU
14and most OECD member countries, covering political parties that have one or more seats
in the country’s parliaments. Each party’s position is rated, based on expert surveys, on a
continuous scale between 1 and 10, in accordance with the left-right criteria suggested by
several studies like Castles and Mair 1984. If this variable is close to 1, the party orientation
is judged to be left, while if10 the orientation is judged to be right. I extract data only for
those parties to which the prime ministers belong in a given country-year, assuming that
prime ministers are the ultimate decision makers responsible for austerity measures, thus
disregarding other informational details of each government, such as its majority-minority
status or the precise composition of other parties in coalition if any.
For the analysis below, I use two variants of the partisanship measurement. First, I use
the continuous 10 point-scale variable, as originally obtained from the dataset. This variable
is made by negating the original variable from the ParlGov database, since my analysis
focuses on the added effect of austerity when undertaken by left-dominant governments.
Second, for the ease of interpreting the results, especially for the interaction terms, I also use
the 3-point-scale partisan variable, converted from the continuous partisan variable. This is
coded 0 if the government is recognized right-wing, 1 if centrist, or 2 if left-wing. The cutting
points are set so that the sample is evenly broken down into three subsets. The mean of the
“partisan” variable is close to 1, as shown in Table A.1, indicating that the conversion works
appropriately.
Further adjustments are in order with regard to the timing of government change and
policy initiation. Note in most countries under investigation, the government fiscal schedule is
such that its budget plan is decided before an actual fiscal year starts. This might potentially
create a troublesome measurement error. Suppose a positive change in budget balance is
recorded in a given country-year and the government (prime minister’s) partisanship in that
country-year is coded based on its orientation as of April. If the actual inauguration of this
government took place after April, the fiscal improvement should be attributed to the policy
of, not this current government, but the previous government. In order to deal with this
15potential problem most effectively, I define partisanship based on ideological position of the
government that holds office as of January 1st in a given year.
Control Variables
Here I consider and list some covariates that may affect the frequency of anti-government
movements (see Table A.1 for the summary statistics and sources for these covariates). First,
I control for the population scale, given that (more) frequent occurrence of anti-government
movements may simply reflect a larg(er) national population. Specifically, I include the
logarithm of the population, and this data is retrieved from Banks and Wilson 2020. Second, I
control for general economic situations since worsening of economic conditions may encourage
anti-government movements (Acemoglu and Robinson 2001; Burke and Leigh 2010; Kim
2014; Nordlinger 1977). Specifically, I take into consideration macroeconomic indicators
including economic growth, unemployment, and inflation. Third, in light of the possibility
that democratic institutions and mature civic culture may constitute necessary conditions
for any social movements, I include Polity 2 variable that measures a given regime’s degree of
democracy (Marshall and Gurr 2020). Finally, because anti-government movements can be
described as collective actions which can be facilitated by the prevalence of communication
technology, I include as a control variable the logarithm of the number of phones as proxy
to measure the diffusion of such technology (Ponticelli and Voth 2019).
Model and Methods for Estimation
As hypothesized in the previous section, I intend to examine whether policies of economic
austerity adopted by left-dominant governments have stronger (positive) effects in facilitating
anti-government movements than those adopted by rightist governments. For this, I estimate
the following model:
M ovementsit = α+β1 Austerityit +β2 P artisanshipit +β3 Austerity×P artisanshipit +β T X+εit
According to the previous literature, austerity increases the likelihood of anti-government
16movements, so β1 should be greater than zero. As for β2 , my hypothesis remains agnostic as
I suppose that the likelihood of citizens initiate anti-government movements does not depend
directly on whether the incumbent government is leftist or rightist. Far more important to
my hypothesis is β3 , namely the estimated coefficient for the interaction between government
fiscal policy and incumbent partisanship. Since the government’s leftist orientation is denoted
with a greater value, β3 is expected to be positive if my hypothesis is true.
Given that the dependent variable is a count variable that takes non-negative values and
is positively skewed, as shown in Figure 3, OLS estimation is not appropriate. Thus, I use
two sets of estimation methods, negative binomial and Poisson regression models, both of
which are used widely in the analysis of count data in political science. As Poisson regression
assumes that the mean of the dependent variables equals the variance, it is often pointed
out that this method may not be suitable for analyzing over-dispersed data. In fact, the
standard deviation of the dependent variable is 4.1, which is greater than the mean, 1.5.
For this reason, I use negative binomial as the main estimation model and employ Poisson
estimation for robustness check.
Empirical Findings
Table 1 provides the result based on the negative binomial regression analyses with the
3-point-scale categorical partisan variable. The first three models (Models 1-3) include an
annual difference in government fiscal balance (ΔBalance) as a measurement of government
fiscal policy measurement. As shown, ΔBalance is estimated consistently to have negative
impacts on the dependent variable. Somewhat contrary to the previous scholarship this result
suggests, that governments’ efforts to improve their fiscal balance rather inhibit citizens from
initiating anti-government movements. However, the estimated effects are not significant at
conventional levels, and it is thus difficult to draw any conclusive inference on this point.
Turning to the (categorical) partisan variables, they have consistently negative and significant
effects. As the higher value indicates that the government is leftist, this result shows that
17anti-government movements are less likely to occur under left-dominant governments than
under centrist and rightist governments.
The most important and novel finding of my empirical analysis concerns with the inter-
action between government fiscal balance and partisanship (ΔBalance*Partisanship [Cate-
gorical]). The interaction is estimated consistently to have positive effects on the dependent
variable, and the effect is significant in Models 2 and 3 which include a set of control vari-
ables. This result provides support for the hypothesis that left-dominant governments’ aus-
terity increases the likelihood of anti-government movements more than austerity initiated
by centrist and rightist governments.
The next three models, Models 4-6, include an annual difference in cyclically-adjusted
primary balance (ΔCAPB) to measure government fiscal policy. In contrast to ΔBalance,
ΔCAPB has consistently positive effects on the dependent variable, indicating governments’
efforts to improve its fiscal balance may encourage citizens to initiate anti-government move-
ments. This result is consistent with the previous scholarship. The interaction between
ΔCAPB and government partisanship is estimated to have positive effects on the dependent
variable, and they are significant in Models 5 and 6. This result supports my hypothesis as
well.
For visualization, Figure 5 depicts the marginal effects of the fiscal policy variables on
the dependent variables10 . Note the effects are clearly correlated with the government par-
tisanship (right, center, or left). According to Panel A, the marginal effect of ΔBalance on
the dependent variable is close to zero when right-wing parties control governments. On
the other hand, the marginal effects of the increase in government revenue conducted by
the centrist and leftist governments exceed zero, and their 95% confidence intervals do not
intersect the zero-horizontal line. Panel B also demonstrates the similar result that while
rightist austerity has no effects on the likelihood of anti-government movements, centrist
and leftist austerity has significantly positive effects. These results clearly supports my
10. Each panel in Figure 5 was drawn based on Models 3 and 6 in Table 1, respectively.
18Table 1: Result of Negative Binomial Regressions with Categorical Partisan Variable
Dependent variable:
Anti-government Movements
(1) (2) (3) (4) (5) (6)
∗∗∗ ∗∗∗ ∗∗∗ ∗∗∗ ∗∗∗
Lagged DV 0.075 0.073 0.065 0.070 0.066 0.059∗∗∗
(0.006) (0.006) (0.007) (0.007) (0.007) (0.007)
∆Balance −0.006 −0.020 −0.012
(0.031) (0.033) (0.034)
∆Balance*Partisanship (Categorical) 0.039 0.071∗∗ 0.066∗∗
(0.025) (0.033) (0.033)
∆CAPB 0.042 0.031 0.046
(0.036) (0.039) (0.041)
∆CAPB*Partisanship (Categorical) 0.044 0.065∗ 0.064∗
(0.036) (0.038) (0.039)
Partisanship (Categorical) −0.157∗∗ −0.192∗∗∗ −0.211∗∗∗ −0.141∗ −0.155∗∗ −0.169∗∗
(0.070) (0.072) (0.072) (0.079) (0.077) (0.075)
Log Population 0.233∗∗ 0.205∗∗ 0.329∗∗∗ 0.421∗∗∗
(0.093) (0.103) (0.104) (0.121)
∆Growth −0.007 −0.004 0.013 0.013
(0.019) (0.019) (0.025) (0.024)
∆Unemployment 0.141∗∗∗ 0.150∗∗∗ 0.093∗ 0.083
(0.047) (0.046) (0.053) (0.053)
∆Inflation −0.005 −0.002 −0.066∗ −0.090∗∗∗
(0.008) (0.009) (0.034) (0.035)
Polity 2 −0.104∗ −0.479∗∗∗
(0.061) (0.122)
Log Phone 0.283∗∗∗ 0.359∗∗∗
(0.092) (0.126)
Constant −0.880∗∗∗ −4.796∗∗∗ −6.463∗∗∗ −0.844∗∗∗ −6.439∗∗∗ −7.411∗∗∗
(0.118) (1.592) (2.116) (0.141) (1.780) (2.672)
Country FE Yes Yes Yes Yes Yes Yes
Year FE Yes Yes Yes Yes Yes Yes
Log Likelihood −1101.9 −914.32 −894.61 −768.26 −750.69 −725.77
N 1066 886 848 726 723 693
∗ ∗∗ ∗∗∗
Note: pFigure 5: Marginal Effects of Fiscal Policy by Government Partisanship
main hypothesis.
On the other hand, however, neither Panel A nor B provide a clear support for my
corollary hypothesis. Although the marginal effects for leftist governments seem slightly
larger than those for centrist governments, their confidence intervals overlap each other. It
implies, contrary to the initial prediction, that austerity initiated by centrist governments
gives a ”premium” to the public grievances and that its amount is sizable as the leftist
premium.
Besides the negative binomial regressions with the categorical partisan variable, I run
regressions with the continuous partisan variable. According to the results summarized in
Table 2, coefficients of the original terms of the two fiscal variables (i.e., ΔBalance, and
ΔCAPB) have consistently positive and significant effect on the dependent variable. It
means that government fiscal surplus, or austerity, significantly increases the likelihood of
anti-government movements, which is compatible with the findings in the previous litera-
ture. On the other hand, the interaction terms between each fiscal variable and government
20partisanship yield estimation results similar to Table 1: the interactions between ΔBal-
ance and government partisanship, and between ΔCAPB and government partisanship have
consistently positive effects on the dependent variable. It implies that left-dominant govern-
ments’ attempts to improve fiscal balance have stronger positive effects on the likelihood of
anti-government movements, which supports the hypothesis.
Since the dependent variable used in the above results was constructed by aggregation,
I have decomposed it into the three three episodes of anti-government movements, namely
anti-government demonstrations, riots, and general strikes, and estimated separately based
on negative binomial regression method. The results are shown in Table 3. Models 1-
3 include ΔBalance as the measurement of government fiscal policy, whereas Models 4-6
include ΔCAPB. Across these six models, the interactions between government fiscal policy
and partisanship have significant effects only for the models whose dependent variable are
anti-government demonstrations: the hypothesis is not supported for violent movements
nor strikes. This asymmetry of the disaggregated analysis is hardly surprising. In fact,
the apparent absence of effects of left-wing austerity on violent movements is compatible
with the discussion of Flesher Fominaya 2017, who emphasizes anti-austerity movement as
“pro-democracy.”
For the purpose of robustness check, I have also estimated the model with Poisson re-
gressions. Their results are shown in Tables A.2 and A.3. The overall interpretation remains
the same: austerity conducted by left-dominant governments has stronger effects on the like-
lihood of anti-government movements than austerity conducted by right-wing and centrist
counterparts. In fact, the results of the Poisson regressions provide stronger support for the
hypothesis, as the interactions between the two fiscal variables, and government partisanship
have consistently significant effects on the dependent variable.
For another robustness check, I have also checked whether my argument is valid across
periods. I divide the sample into three periods, 1972-2015 (Overall), 1980-2015, 1990-2015,
and 2000-2015, and then estimated the negative binomial models separately for these periods.
21Table 2: Result of Negative Binomial Regressions with Continuous Partisan Variable
Dependent variable:
Anti-government Movements
(1) (2) (3) (4) (5) (6)
∗∗∗ ∗∗∗ ∗∗∗ ∗∗∗ ∗∗∗
Lagged DV 0.075 0.074 0.066 0.070 0.067 0.060∗∗∗
(0.006) (0.006) (0.007) (0.007) (0.008) (0.008)
∆Balance 0.152∗∗ 0.298∗∗∗ 0.286∗∗
(0.071) (0.115) (0.116)
∆Balance*Partisanship (Continuous) 0.021∗ 0.043∗∗ 0.040∗∗
(0.012) (0.018) (0.018)
∆CAPB 0.275∗∗ 0.318∗∗∗ 0.323∗∗∗
(0.125) (0.123) (0.124)
∆CAPB*Partisanship (Continuous) 0.032 0.039∗∗ 0.037∗
(0.020) (0.020) (0.020)
Partisanship (Continuous) −0.087∗∗∗ −0.109∗∗∗ −0.123∗∗∗ −0.089∗∗ −0.093∗∗ −0.096∗∗
(0.034) (0.036) (0.036) (0.040) (0.039) (0.038)
Log Population 0.222∗∗ 0.190∗ 0.313∗∗∗ 0.397∗∗∗
(0.093) (0.103) (0.105) (0.122)
∆Growth −0.009 −0.007 0.012 0.012
(0.019) (0.019) (0.025) (0.024)
∆Unemployment 0.142∗∗∗ 0.152∗∗∗ 0.093∗ 0.082
(0.047) (0.046) (0.052) (0.052)
∆Inflation −0.006 −0.003 −0.067∗∗ −0.091∗∗∗
(0.008) (0.009) (0.033) (0.034)
Polity 2 −0.099 −0.472∗∗∗
(0.061) (0.124)
Log Phone 0.292∗∗∗ 0.359∗∗∗
(0.092) (0.126)
Constant −1.531∗∗∗ −5.421∗∗∗ −7.264∗∗∗ −1.486∗∗∗ −6.845∗∗∗ −7.781∗∗∗
(0.218) (1.596) (2.122) (0.256) (1.801) (2.678)
Country FE Yes Yes Yes Yes Yes Yes
Year FE Yes Yes Yes Yes Yes Yes
Log Likelihood −1100.87 −913.21 −893.18 −767 −749.71 −725.01
N 1066 886 848 726 723 693
∗ ∗∗ ∗∗∗
Note: pTable 3: Result of Negative Binomial Regression with the Dependent Variable Decomposed
Dependent variable:
Demonstration Riots General Strikes Demonstration Riots General Strikes
(1) (2) (3) (4) (5) (6)
Lagged DV(domestic8) 0.127∗∗∗ 0.111∗∗∗
(0.015) (0.017)
Lagged DV(domestic6) 0.097∗∗∗ 0.093∗∗∗
(0.018) (0.020)
Lagged DV(domestic2) 0.198∗∗∗ 0.181∗∗
(0.065) (0.075)
∆Balance −0.022 0.051 0.049
(0.037) (0.059) (0.068)
∆Balance*Partisanship (Categorical) 0.082∗∗ 0.008 0.075
(0.037) (0.051) (0.070)
∆CAPB 0.034 0.168∗∗ 0.086
(0.045) (0.070) (0.084)
∆CAPB*Partisanship (Categorical) 0.083∗ −0.056 0.071
(0.043) (0.066) (0.082)
Partisanship (Categorical) −0.108 −0.380∗∗∗ −0.511∗∗∗ −0.070 −0.386∗∗∗ −0.452∗∗∗
(0.083) (0.112) (0.151) (0.088) (0.120) (0.166)
Log Population 0.206 0.233 −0.068 0.336∗∗ 0.569∗∗ 0.193
(0.126) (0.194) (0.358) (0.148) (0.240) (0.455)
∆Growth 0.006 −0.028 −0.019 0.020 0.008 −0.018
(0.023) (0.028) (0.038) (0.028) (0.037) (0.051)
∆Unemployment 0.136∗∗ 0.215∗∗∗ 0.344∗∗∗ 0.057 0.149∗ 0.232∗∗
(0.054) (0.068) (0.085) (0.062) (0.080) (0.096)
∆Inflation −0.002 −0.016 0.015 −0.117∗∗∗ −0.059 0.006
(0.010) (0.013) (0.017) (0.040) (0.055) (0.068)
Polity 2 −0.151∗∗ −0.129 −0.009 −0.576∗∗∗ −0.413∗∗ 0.025
(0.066) (0.098) (0.167) (0.162) (0.189) (0.244)
Log Phone 0.297∗∗∗ 0.374∗∗∗ −0.030 0.356∗∗ 0.658∗∗∗ 0.093
(0.106) (0.138) (0.160) (0.146) (0.201) (0.210)
Constant −6.313∗∗ −8.165∗∗ 1.182 −5.151 −14.551∗∗∗ −4.912
(2.533) (3.595) (6.108) (3.254) (4.480) (7.708)
Constant −6.204∗∗ −7.785∗∗ 1.693 −5.082 −14.165∗∗∗ −4.459
(2.539) (3.606) (6.114) (3.259) (4.488) (7.714)
Country FE Yes Yes Yes Yes Yes Yes
Year FE Yes Yes Yes Yes Yes Yes
Log-Likelihood −670.41 −448.59 −242.63 −549.06 −346.94 −190.21
N 848 848 848 693 693 693
∗ ∗∗ ∗∗∗
Note: pThe results are displayed in Table A.4. The models that include ΔBalance (i.e., Models
1-4) show that the coefficients of the interaction between ΔBalance and partisanship are
consistently positive and significant regardless of their period selection. This implies that
the argument that left-wing austerity has stronger effects on the likelihood of anti-government
movements than right-wing and centrist austerity is valid across different time periods. I note
also that Models 5-8, which include ΔCAPB, provide only weaker validity to the argument:
the interaction between ΔCAPB and government partisanship is not significant in the models
which cover more recent periods, i.e., 1990-2015 and 2000-2015. Nevertheless, the interaction
remains significant in the models with longer periods (i.e., Overall and 1980-2015).
In sum, the empirical analysis reveals a set of important insights. First, fiscal austerity
increases the likelihood of anti-government movements, as the previous literature has long
suggested. Second and most importantly, the effect of austerity depends on the govern-
ment’s partisanship responsible for such measures. Austerity conducted by left-dominant
governments has stronger effects on the likelihood of anti-government movements than aus-
terity conducted by right-wing and centrist counterparts. Third, the conditional effects of
austerity by government partisanship are observable across different time periods, at least
after the 1970s—all of these buttresses the hypothesis.
Conclusion
So far I have investigated whether and how the varying partisanship of incumbent government
affects the pattern of these anti-austerity movements. While accepting the notion of the
“convergence thesis” literature, I extended the conventional partisan theory to link partisan
convergence with behavioral consequences of citizens. Based on this expansion, I argued
that partisan convergence on fiscal austerity encourages citizens to initiate anti-government
movements by adding a “premium” to their grievances spurred by austerity and decreasing
the perceived utility of electoral participation as a process of their interest. Then, I induced
the observable hypothesis that anti-government movements are more likely to occur when
24left-dominant governments initiated the austerity than the right-dominant governments. I
tested and supported this hypothesis by analyzing the panel data for 37 developed countries
between 1973 and 2015.
The main contribution of this paper to the scholarship is that it expanded the scope of the
partisanship theory. The previous studies of both the conventional partisanship theory and
the “convergence thesis” has been treating only economic policies (e.g., Cusack 1999, on fiscal
policy) or macroeconomic performances (e.g., Hibbs 1977, on inflation and employment) as
final consequences brought about by partisanship so far. This paper, however, presents
the possibility and necessity that other consequences than policies or performances can and
should be taken seriously in the context of the partisanship theory. Although it assumed
that contents of implemented fiscal policy are not affected by partisanship of the incumbent
government, the findings of this paper imply that partisanship makes difference if we turn
our eyes to consequences coming after fiscal policy: anti-government movement.
This paper, however, relies on a couple of untested assumptions. The framework of this
paper assumes that citizens who are disappointed by the effectiveness of electoral partici-
pation will automatically and immediately move to another form of political participation,
anti-government movement. This assumption is the most doubtful of this paper because
one cannot deny the possibility that citizens retreating from electoral participation retreat
from another form of political participation as well. Besides, it is still unknown whether the
amount of grievances that citizens facing austerity bear differs depending on the partisan-
ship of the incumbent government. What is more, one can question even whether austerity
causes citizens’ grievances. As Paldam 1993 points out, deciding fiscal austerity may improve
reputation of the politician as a reformer.
In order to address these problems, a future study needs to employ a micro-level and
multilevel empirical strategy. Analyzing a micro-level data can assess whether and how
the perceived utility in a respondent affects his/her experience of participating in anti-
government movements. If respondents who bear a higher degree of mistrust of electoral
25effectiveness, the first assumption of this paper is no longer baseless. A multilevel data is
useful for assessing effects of fiscal policy, a macro-level variable, on the amount of grievances,
a micro-level variable. In the multilevel analysis, it should be tested whether respondents
in countries adopting austerity are angrier than those in countries not adopting austerity,
and whether respondents facing left-dominant governments’ austerity are angrier than those
facing right-dominant governments’ austerity.
A future study should improve the macro-level analysis this paper conducted as well.
The empirical analysis of this paper does not consider the effects of coalition governments.
Although both single-left-party governments and left-dominant right-allied governments are
coded “leftist” in the empirical analysis, the assessment of partisanship of the latter case as
a “leftist government” is exaggerated. Thus, a future study needs to code partisanship of
the incumbent government taking into account of compositions of coalition governments.
26References
Acemoglu, Daron, and James Robinson. 2001. “Theory of Political Transitions.” American
Economic Review 91 (4): 938–963.
Alesina, Alberto. 1987. “Macroeconomic Policy in a Two-Party System as a Repeated Game.”
The Quarterly Journal of Economics 102 (3): 651–678. https : / / doi . org / 10 . 2307 /
1884222.
Alesina, Alberto, and Silvia Ardagna. 2010. “Large Changes in Fiscal Policy: Taxes versus
Spending.” Tax Policy and the Economy 24 (1): 35–68. https://doi.org/10.1086/649828.
Alesina, Alberto, Silvia Ardagna, Roberto Perotti, and Fabio Schiantarelli. 2002. “Fiscal
Policy, Profists, and Investment.” American Economic Review 92 (3): 571–589.
Alesina, Alberto, and Roberto Perotti. 1996. “Income distribution, political instability, and
investment.” European Economic Review 40 (6): 1203–1228.
Armingeon, Klaus, and Kai Guthmann. 2014. “Democracy in crisis? The declining support
for national democracy in European countries, 2007-2011.” European Journal of Political
Research 53 (3): 423–442. https://doi.org/10.1111/1475-6765.12046.
Banks, Arthur S., and Kenneth A. Wilson. 2020. Cross-National Time-Series Data Archive.
Dataset. https://www.cntsdata.com/.
Beckmann, Joscha, Esther Ademmer, Ansgar Belke, and Rainer Schweickert. 2017. “The
political economy of the impossible trinity.” European Journal of Political Economy
47:103–123. https://doi.org/10.1016/j.ejpoleco.2016.10.010.
Belke, Ansgar, and Niklas Potrafke. 2012. “Does government ideology matter in monetary
policy? A panel data analysis for OECD countries.” Journal of International Money and
Finance 31 (5): 1126–1139. https://doi.org/10.1016/j.jimonfin.2011.12.014.
27Boix, Carles. 1998. Political parties, growth and equality: Conservative and social democratic
economic strategies in the world economy. New York: Cambridge University Press.
. 2000. “Partisan Governments, the International Economy, and Macroeconomic Poli-
cies in Advanced Nations, 1960–93.” World Politics 53 (1): 38–73. https://doi.org/10.
1017/s0043887100009370.
Bräuninger, Thomas. 2005. “A partisan model of government expenditure.” Public Choice
125 (3-4): 409–429. https://doi.org/10.1007/s11127-005-3055-x.
Broz, J. Lawrence, Zhiwen Zhang, and Gaoyang Wang. 2020. “Explaining Foreign Support
for China’s Global Economic Leadership.” International Organization 74 (3): 417–452.
https://doi.org/10.1017/s0020818320000120.
Burke, Paul J., and Andrew Leigh. 2010. “Do Output Contractions Trigger Democratic
Change?” American Economic Journal: Macroeconomics 2 (4): 124–157. https://doi.
org/10.1257/mac.2.4.124.
Castles, Francis G, and Peter Mair. 1984. “Left–right political scales: Some ‘expert’judgments.”
European Journal of Political Research 12 (1): 73–88.
Cummins, Ian. 2018. “The Impact of Austerity on Mental Health Service Provision: A UK
Perspective.” International Journal of Environmental Research and Public Health 15 (6).
https://doi.org/10.3390/ijerph15061145.
Cusack, Thomas R. 1999. “Partisan Politics and Fiscal Policy.” Comparative Political Studies
32 (4): 464–486.
Döring, Holger, and Philip Manow. 2019. Parliaments and governments database (ParlGov):
Information on parties, elections and cabinets in modern democracies. Development
version. Dataset, January. http://www.parlgov.org/.
28You can also read