Air quality - National Audit Office
←
→
Page content transcription
If your browser does not render page correctly, please read the page content below
A picture of the National Audit Office logo

Report
by the Comptroller
and Auditor General

Environmental Audit Committee,
Environment, Food and Rural Affairs Committee,
Health Committee and Transport Committee

Air quality

HC 529   SESSION 2017–2019   16 NOVEMBER 2017
Our vision is to help the nation spend wisely.
Our public audit perspective helps Parliament hold
government to account and improve public services.

The National Audit Office scrutinises public spending for Parliament and is independent
of government. The Comptroller and Auditor General (C&AG), Sir Amyas Morse KCB,
is an Officer of the House of Commons and leads the NAO. The C&AG certifies the
accounts of all government departments and many other public sector bodies. He has
statutory authority to examine and report to Parliament on whether departments and
the bodies they fund have used their resources efficiently, effectively, and with economy.
Our studies evaluate the value for money of public spending, nationally and locally.
Our recommendations and reports on good practice help government improve public
services, and our work led to audited savings of £734 million in 2016.
Environmental Audit Committee,
Environment, Food and Rural Affairs Committee,
Health Committee and Transport Committee

Air quality

Report by the Comptroller and Auditor General
Ordered by the House of Commons
to be printed on 16 November 2017
This report has been prepared under Section 6 of the
National Audit Act 1983 for presentation to the House of
Commons in accordance with Section 9 of the Act
Sir Amyas Morse KCB
Comptroller and Auditor General
National Audit Office
13 November 2017

HC 529 | £10.00
This briefing gives an overview of government’s approach
to improving air quality in the UK.

© National Audit Office 2017
The material featured in this document is subject to
National Audit Office (NAO) copyright. The material
may be copied or reproduced for non-commercial
purposes only, namely reproduction for research,
private study or for limited internal circulation within
an organisation for the purpose of review.
Copying for non-commercial purposes is subject
to the material being accompanied by a sufficient
acknowledgement, reproduced accurately, and not
being used in a misleading context. To reproduce
NAO copyright material for any other use, you must
contact copyright@nao.gsi.gov.uk. Please tell us who
you are, the organisation you represent (if any) and
how and why you wish to use our material. Please
include your full contact details: name, address,
telephone number and email.
Please note that the material featured in this
document may not be reproduced for commercial
gain without the NAO’s express and direct
permission and that the NAO reserves its right to
pursue copyright infringement proceedings against
individuals or companies who reproduce material for
commercial gain without our permission.
Links to external websites were valid at the time of
publication of this report. The National Audit Office
is not responsible for the future validity of the links.
11639    11/17     NAO
Contents
                                  Key facts 4
                                  Summary 5
                                  Part One
                                  Why air quality matters 11
                                  Part Two
                                  The UK’s plan to improve air quality 23
                                  Part Three
                                  Risks and success factors for delivering
                                  government’s air quality plans 34
                                  Appendix One
                                  Overview of cost and benefits
                                  of the various policy options 42
                                  Appendix Two
                                  Our approach 44
                                  Appendix Three                                                                                The National Audit Office study team
                                                                                                                                consisted of:
                                  Our evidence base 46
                                                                                                                                Caroline Brewer, Tom Glithero,
                                                                                                                                Jenna Gregg, Stanley Kwong,
                                                                                                                                Katy Losse, Shoko Okamura and
                                                                                                                                Fedra Vanhuyse, under the direction
                                                                                                                                of Keith Davis.
                                                                                                                                This report can be found on the
                                                                                                                                National Audit Office website at
                                                                                                                                www.nao.org.uk
                                                                                                                                For further information about the
                                                                                                                                National Audit Office please contact:
                                                                                                                                National Audit Office
                                                                                                                                Press Office
                                                                                                                                157–197 Buckingham Palace Road
                                                                                                                                Victoria
                                                                                                                                London
                                                                                                                                SW1W 9SP
                                                                                                                                Tel: 020 7798 7400
                                                                                                                                Enquiries: www.nao.org.uk/contact-us
                                                                                                                                Website: www.nao.org.uk
                                                                                                                                Twitter: @NAOorguk
If you are reading this document with a screen reader you may wish to use the bookmarks option to navigate through the parts.
4 Key facts Air quality
Key facts
Over 85% 2026 2010
proportion of air quality zones in government’s estimate of original deadline for
the UK (37 of 43) that did not meet when all 43 zones in the compliance with EU
EU nitrogen dioxide limits in 2016 UK will be compliant with nitrogen dioxide limits
EU nitrogen dioxide limits
2021 Year by which government expects to achieve compliance
with EU limits on NO² in 37 of the UK’s 43 air quality zones
31 Dec 2019 Date by which government expects five cities to have
introduced new measures so that local air quality meets
nitrogen dioxide limits in 2020
31 Dec 2018 Date by which government expects a further 23 local
authorities to have completed plans for new measures to
secure compliance with air quality limits as quickly as possible
Under review Estimated mortality impact of nitrogen dioxide pollution
29,000 Estimated equivalent number of deaths caused by
fine particulate matter in the UK in 2008
£20 billion Royal College of Physician's estimate of cost of the
health impacts of air pollution to the UK in 2016
80% Estimated proportion of nitrogen oxides concentrations
at the roadside due to road transport (national average)
13% Proportion of all fine particulate matter emissions in the
UK due to road transport
£2.5 billion Potential spend between 2015 and 2020 on schemes
with intended air quality benefits of which government’s
Joint Air Quality Unit directly oversees £0.3 billion
2018 Year in which government plans to publish a wider
air quality strategyAir quality Summary 5
Summary
Aim and scope
1 This briefing gives an overview of government’s approach to improving air quality
in the UK. It has been prepared in support of a joint inquiry by the Environmental Audit
Committee, the Environment, Food and Rural Affairs Committee, the Health Committee
and the Transport Committee of the House of Commons.
2 Air pollution is the presence or introduction of any chemical, physical or
biological agent that modifies the natural characteristics of the atmosphere, such as
nitrogen dioxide and particulate matter. Improving air quality is a cross-government
responsibility. It is a devolved matter, and the respective administrations are responsible
for developing air quality policy in Northern Ireland, Wales and Scotland. For England,
responsibilities include:
• the Department for Environment Food & Rural Affairs (Defra), for air quality
policy and strategy;
• the Department for Transport (DfT), for policy measures to reduce air pollution
from transport, such as schemes to promote cycling and walking, and to mitigate
the effect of new road‑building;
• the Department for Communities and Local Government (DCLG), for alignment
with its approach to local growth, with its stewardship of the local government
financial system, and with the national planning system;
• the Department for Business, Energy & Industrial Strategy (BEIS) for regulation
of industrial pollution, alignment with government’s industrial strategy and for
alignment with its plans to tackle climate change;
• the Department of Health and Public Health England, for advice on the health
impacts of air pollution;
• local authorities, which have had statutory air quality duties since 1995 including
requirements to designate air quality problem areas as ‘Air Quality Management
Areas’ and to develop action plans to resolve the problem; and
• the Mayor of London, who sets policies and leads on the implementation of air
quality measures in the capital.6 Summary Air quality
3 In this briefing we set out:
• why air quality matters (Part One), covering the causes and consequences of air
pollution, EU air quality limits, and how the UK is performing compared with other
EU member states;
• the UK’s plan for improving air quality (Part Two), covering government’s latest
(July 2017) plan for tackling roadside concentrations of nitrogen dioxide, and the
analysis and modelling that informed the 2017 Plan; and
• risks and success factors for delivery of government’s air quality plans
(Part Three).
4 This briefing is based on publicly available information, supplemented by
interviews with Defra, DfT, DCLG and stakeholders, as well as a review of selected
internal government documents (see Appendix Two).
Key points
Why air quality matters
5 Concentrations of pollutants in the air pose a risk to health and the
environment. An expert Committee to the Department of Health has estimated that
fine particulate matter (PM2.5) increased mortality by the equivalent of 29,000 deaths in
the UK in 2008. It considers that on the balance of evidence nitrogen dioxide presents
an additional health risk, though it cautions that it is not yet possible to make a reliable
quantitative estimate of the size of this effect. Public Health England reports that long‑term
exposure to poor air quality is a contributory factor to around as many deaths in England
as alcohol. The Royal College of Physicians has estimated that the health impacts of air
pollution cost the UK £20 billion in 2016 (paragraphs 1.2 to 1.5 and Figure 1).
6 This is despite emissions of pollutants from transport, industry and other
sources having fallen in recent decades. UK emissions of nitrogen oxides (NOx)1
and fine particulate matter fell by 69% and 76% respectively from 1970 to 2015, with
similar reductions in other pollutants. These reductions have been achieved through
legislative restrictions on industry, European vehicle emission standards, and a shift
in the UK fuel mix away from coal, among other measures (paragraph 1.7).
1 The term nitrogen oxides covers nitrogen di-oxide (NO2) and nitric oxide (NO). The latter can react in the atmosphere
to produce secondary NO2.Air quality Summary 7 7 The UK has not yet met EU concentration limits for one pollutant (NO2) that had a compliance deadline of 2010. For reporting purposes the UK is divided into 43 air quality zones. A zone is deemed to be non-compliant if the UK’s official monitoring and modelling shows that concentrations of pollutants in the air at one or more locations within the zone exceed certain limits. In 2016, 37 of the UK’s 43 air quality zones did not comply with annual limits for nitrogen dioxide concentrations. Meeting these limits has been a problem across Europe, and the European Commission has launched infringement cases against a number of Member States, including the UK, Germany, France and Spain. In February 2017, the European Commission took forward the second phase of its infringement case against the UK by issuing a ‘Reasoned Opinion’. This required the UK to show how it will comply with legal limits as quickly as possible. If the Commission is not satisfied with the UK’s response it could refer the matter to the Court of Justice of the European Union. Government considers that a key cause of non-compliance is the failure of European vehicle regulations (Euro standards) to deliver expected emissions reductions in real‑world driving conditions (see paragraphs 1.10 and 1.11). 8 Road transport is the main contributor to non-compliance with nitrogen dioxide concentration limits, though wider air pollution problems arise from a range of sources. The concentration of air pollutants at any particular location is determined by a combination of regional and local factors. Road transport is the largest single source of nitrogen oxide (NOx) emissions and is responsible for 80% of the NOx concentrations at locations where the UK exceeds legal limits, on average. But it is not the most significant source of emissions of all air pollutants: wood and coal burning by households represents 42% of fine particulate matter emissions, while agriculture contributes 81% of ammonia emissions (paragraph 1.6). 9 The government has said that it remains committed to maintaining environmental protections after the UK exits the European Union. Under the current provisions of the European Union (Withdrawal) Bill, law derived from the EU would continue in domestic law after Exit Day. This includes air quality limits and ceilings. Current arrangements for enforcement of these legal duties will no longer apply if the UK is no longer in the jurisdiction of the Court of Justice of the European Union. UK courts will continue to have a role through the judicial review process, but it is not clear whether or how government will provide for equivalent arrangements for independent, regular review of progress and financial penalties for non-compliance. The Secretary of State for Defra has said that he recognises stakeholders’ concerns about a ‘governance gap’ after EU exit, and that proposals to address this will be considered in the course of the progress of the Withdrawal Bill. On 12 November he announced plans to consult on a new, independent body to hold the government to account for upholding environmental standards in England after the UK leaves the European Union (see paragraphs 1.14 and 1.17).
8 Summary Air quality

                        The UK’s plan for improving air quality
                        10 Government published its latest air quality plan in July 2017 following a series
                        of legal challenges to previous plans. In November 2016, the High Court concluded
                        that the government’s 2015 air quality plan was not compliant with the relevant
                        regulations. It found that the Secretary of State fell into error in fixing on a projected
                        compliance date of 2020 (and 2025 for London) and adopted too optimistic a model
                        for future emissions. It concluded that the Secretary of State should aim to achieve
                        compliance by the soonest date possible, choosing a route which reduces exposure
                        as quickly as possible. Government published a final revised air quality plan focused
                        on roadside nitrogen dioxide concentrations at the end of July 2017 (the 2017 Plan)
                        (paragraphs 1.15 and 2.2).

                        11 A key component of the 2017 Plan is an expectation that 28 local authorities
                        will implement new air quality measures to achieve compliance ‘in the shortest
                        possible time’. As part of the 2017 Plan, government wants to accelerate local authority
                        action on air quality. It has issued a direction to 23 English local authorities to develop
                        new local air quality plans, and is offering associated support, guidance and funding.
                        These local authorities must complete feasibility studies for new air quality measures as
                        soon as possible, with initial plans at the latest by 31 March 2018 and with final plans by
                        31 December 2018 at the latest. Central government will test whether these plans secure
                        compliance in the shortest possible time, including by comparing the plans against its
                        estimate that the introduction of ‘charging clean air zones’ could secure compliance
                        by 2021. A charging clean air zone involves charging certain types of vehicles to enter
                        certain areas in order to discourage use of the most polluting vehicles. The 2017 Plan
                        also expects that a further five cities will continue with their plans to introduce new
                        measures to secure compliance in 2020. Government expects that measures in the
                        2017 plan will secure full compliance in 2026, with 37 of the UK’s 43 air quality zones
                        compliant by 2021 (paragraphs 2.2 to 2.5).

                        12 Government selected these local authorities based on the central scenario of a
                        complex modelling process that is subject to substantial uncertainty. The number of
                        local authorities directed to take additional action under the 2017 Plan is based on a
                        central forecast of the areas that would not comply with NO2 limits in 2021 without
                        additional local action. This is estimated by a complex modelling process that draws on
                        several subsidiary models and numerous datasets. There will be inherent uncertainty in
                        any model of a complex issue like air quality and so it is important for policy makers to
                        consider the range of likely scenarios as well as a central forecast. The complexity of the
                        air quality modelling makes it difficult to quantify the uncertainty involved, but government
                        recognises that it is substantial. In consultation with an expert panel, government analysts
                        concluded that the uncertainty could be +/- 29%. This would mean that while the most
                        likely scenario is that 25 zones would be non-compliant in 2021 without additional local
                        action, the range of possible scenarios without additional local action is between 1 and
                        37 non-compliant zones. Government considers that this represents the extremes of what
                        is possible and is developing analysis to better understand the likelihood within this range
                        (paragraphs 2.8 to 2.12).
Air quality Summary 9
13 Government has committed to publish a wider air quality strategy in 2018,
covering a broader range of pollutants and sources. The 2017 Plan focuses on
transport because vehicles are responsible for most of the NO2 concentrations at
the roadside, where the UK exceeds legal limits. There are, however, other significant
contributors to air pollution such as domestic wood‑burning, agriculture, industry and
fossil fuel power plants. Government will set out its approach to these wider sources of
air pollution in 2018 (paragraphs 1.6 and 1.9).
Risks and success factors
14 The new expectations on local authorities come at a time when they are
facing funding pressures. Since 2010 government has reduced funding for local
authorities as part of its plan to address the fiscal deficit. Our 2014 report on Financial
sustainability of local authorities highlighted that local authorities have worked hard to
manage the reductions in government funding through a mixture of efficiency measures
and service transformation.2 Government needs to assure itself that local authorities
have sufficient capacity and resource to manage the actions needed. To support
local authorities, government has announced a £255 million implementation fund to
2020‑21 for the 28 local authorities that it expects to accelerate action on air quality,
and is offering associated support and guidance. It has also committed to establish
an additional Clean Air Fund to which local authorities will be able to apply, the details
of which have not yet been announced (paragraphs 3.14 to 3.17).
15 Local authorities will need support from a wide range of other organisations
to resolve local air quality problems. Local air quality is a function of national as well
as local factors, such as the tax incentives on drivers to purchase types of vehicles, the
impact of decisions made by Highways England relating to the Strategic Road Network,
and progress in establishing the infrastructure for electric vehicles. Local authority work
on air quality is also complicated by the separation between tiers of local government:
while district or city councils have responsibility for managing local air quality, transport
is managed by county councils (see paragraphs 3.4 and 3.13).
2 Comptroller and Auditor General, Financial sustainability of local authorities, Session 2014-15, HC 783, National Audit
Office, November 2014, available at: www.nao.org.uk/report/financial-sustainability-of-local-authorities-2014/10 Summary Air quality
16 Strong leadership and co-ordination within government is important for
achieving substantial and sustained improvements in air quality across all pollutants.
In February 2016 Defra and DfT took the important step of establishing a joint air quality
unit to oversee delivery of government’s plan for tackling NO2 compliance. This unit has
an oversight Board with representation from across central government, and therefore
provides a valuable forum to improve collaboration and co-ordination. However we
consider that key improvements may be needed. The unit’s Board does not include local
authorities or the Local Government Association, despite the key role that local government
is expected to play in improving air quality. Nor does the unit systematically oversee spend
and progress on schemes run by other parts of government that include intended air quality
benefits. These schemes represent over £2.2 billion of potential spend between 2015 and
2020 across more than 8 sets of initiatives to promote changes such as greater take-up of
electric vehicles, and support for cycling and walking. This means that there is no clear single
responsibility within government for knowing whether the initiatives form a coherent portfolio
that delivers good value for money as a whole in relation to air quality. Defra and DfT told us
that they agree that this is an important objective, but believe that the arrangements which
they currently have in place should secure this (paragraphs 3.5 and 3.9 to 3.11).
Issues the Committees may wish to put to government
Why air quality matters
• How will EU exit affect government’s approach to air quality: are ceilings,
limits and priorities likely to change, how will limits be enforced?
• What will need to be in place before EU exit to secure a smooth transition for air quality
legislation and standards?
• When will we have updated estimates of the adverse impacts of UK air quality?
The UK’s plan for improving air quality
• How does the plan draw on lessons learnt from government’s performance on tackling
air pollution to date?
• What provisions have you made to reflect the significant uncertainty associated with
air quality modelling?
• What are the main issues that you plan to address in the 2018 air quality strategy?
Risks and success factors
• How are you dealing with the risk that local authorities do not have sufficient resources
and expertise to be able to meet air quality requirements effectively? What factors will
determine the size and eligibility criteria for the new Clean Air Fund?
• How will you make sure that local authorities receive the right support and
engagement from other parts of government?
• How can you strengthen arrangements for leadership, oversight and communication
across government on air quality: what additional skills and capacity will the Joint Air Quality
Unit need; should local authorities be better represented at a national strategic level; and
how will you track overall progress on national as well as local air quality measures?Air quality Part One 11
Part One
Why air quality matters
1.1 This part covers:
• the causes and consequences of poor air quality;
• the progress the UK has made in complying with European Union (EU)
regulations on air quality; and
• the impact of leaving the EU.
Consequences and causes of air pollution
1.2 Air pollution is the presence or introduction of any chemical, physical or biological
agent that modifies the natural characteristics of the atmosphere. Emissions of air pollutants
can occur naturally but also arise from human activity, in particular from the combustion of
fossil fuels in generating electricity, heating and transport (see paragraph 1.6 and Figure 2).
1.3 Air pollution has substantial health, economic and environmental impacts in the
UK (Figure 1 on page 13). The Department for Environment, Food & Rural Affairs (Defra)
describes poor air quality as “the largest environmental risk to public health in the UK”.
The effects of exposure to air pollutants include:
• Particulate matter (PM) can cause respiratory effects such as wheezing and
coughing and can worsen asthma and chronic bronchitis. Fine particulate matter,
PM2.5, is of particular health concern due to penetrating deep into lungs and other
tissues, including the brain, with a range of negative health effects from both long‑
and short‑term exposure, such as increased levels of fatal cardiovascular and
respiratory diseases.3
• Nitrogen oxides (NOx) cause inflammation of the airways and are associated with
reductions in lung function. NOx emissions include both primary NO2 and nitric
oxide (NO) with the latter reacting in the atmosphere to produce secondary NO2.
• Carbon monoxide (CO) reduces the blood’s capacity to carry oxygen through the
body and blocks biochemical reactions in cells.
• Sulphur dioxide (SO2) and Ozone (O3) are both respiratory irritants and
exacerbate asthma.
3 Data on PM are often categorised by particle size. PM10 particles are less than 10 microns in diameter – about one
seventh of the thickness of a human hair. PM2.5 particles are less than 2.5 microns in diameter, and are also referred
to as fine particulate matter.12 Part One Air quality
1.4 There are a range of estimates of the scale of these health effects (Figure 1).
An expert Committee of the Department of Health, the Committee on the Medical
Effects of Air Pollutants (COMEAP) has estimated that fine particulate matter (PM2.5)
contributed to a mortality effect equivalent to 29,000 deaths in 2008, reducing life
expectancy by an average of six months.4 It expresses the mortality impact in terms of
equivalent deaths, as air pollution is a contributory factor to a range of health conditions.
Public Health England reports that long‑term exposure to particulate matter contributes
to around as many deaths in England as alcohol.
1.5 COMEAP recently examined evidence on the health impacts of NO2. Its interim
advice to government was that while it is difficult to disaggregate the effects of NO2 from
the effects of other air pollutants, on the balance of probability, NO2 itself is a health risk.
It cautioned that any calculation of attributable deaths from NO2 is likely to include some
overlap with the 29,000 deaths previously calculated for PM2.5, and that it is not possible
to make a reliable assessment of the size of the mortality burden associated solely
with NO2. Instead, COMEAP is considering the effect on mortality from the air pollution
mixture as a whole.
4 COMEAP is an expert committee of the Department of Health. It was established to advise government on the effects
of air pollution by interpreting the wide range of evidence available. The Committee is chaired by Professor Frank Kelly,
Chair in Environmental Health, King’s College London. It includes both academics and air quality practitioners, as well
as a lay member to ensure that the general public can access and understand the Committee’s work.Air quality Part One 13
Figure 1
Effects of poor air quality
Area of risk Effects
Health Fine particulate matter (PM2.5) is estimated by the Committee on the Medical Effects of
Air Pollutants (COMEAP) to have contributed to an equivalent of 29,000 deaths in 2008,
reducing average life expectancy by six months.
The Royal College of Physicians estimates that the total burden of outdoor air pollution
is the equivalent of 40,000 deaths annually.
There is not a consensus among experts on a quantified estimate of the mortality
impact of nitrogen dioxide (NO2) alone. COMEAP advises that the available evidence
and methods do not allow them to make a reliable assessment of the size of the effect
which is attributable to NO2 itself.
Environment Air pollutants alter the chemical composition of the air, which affects plant respiration
and the composition of rainwater. Impacts of this include:
• 44% of UK sensitive habitats affected by acid rain in 2013;
• 66% of UK sensitive habitats affected by eutrophication (excessive richness
of nutrients) in 2013; and
• increases in ground-level ozone, resulting in reductions of yields from sensitive
crops such as wheat.
Economic Several estimates of different aspects of the economic costs of air pollution have
been produced. These include:
• more than £16 billion a year cost to public health of exposure to particulate matter
(estimated by Defra);
• £2.7 billion cost of productivity impacts from pollution levels in 2012,
(estimated by Ricardo-AEA on behalf of Defra); and
• more than £20 billion a year costs to society, business and health services from
the health problems resulting from air pollution (estimated by the Royal College
of Physicians).
Source: National Audit Office analysis
1.6 The concentration of air pollutants at any particular location is determined
by a combination of regional and local factors. Local road transport is responsible
for 60% of the nitrogen oxide concentrations at roadside locations where the
UK exceeds legal limits, on average, with regional road transport emissions
(emissions from other roads in the wider area) responsible for a further 20% of nitrogen
dioxide concentrations in these locations. But it is not the most significant source of
emissions of all air pollutants: wood and coal burning by households represents 42%
of fine particulate matter emissions, while agriculture contributes 81% of ammonia
emissions (Figure 2 overleaf).14 Part One Air quality
Figure 2
Significant sources of UK pollutants in 2015
Ammonia Non-methane volatile Nitrogen Oxides Sulphur Dioxide Fine particulate
organic compounds matter
(NH3) (NMVOCs) (NOx) (SO2) (PM2.5)
(%) (%) (%) (%) (%)
Agriculture 81 12
Energy industries 29 54 4
Fugitive emissions 17
Industrial processes 1 56
Manufacturing industries 16 21 17
and construction
Non-road transport 9
Residential combustion 42
Road Transport 2 3 34 1 13
Small stationary 6 17
combustion
Waste 8
Other sources not 8 6 12 7 24
separately identified
Note
1 Emissions are shown for the most significant sources only. Where a source is not listed against a pollutant it does not indicate that the source
does not contribute towards that pollutant. Any contribution not separately listed is contained within the ‘Other sources not separately identified’
contribution to that pollutant.
Source: National atmospheric emissions inventory
Progress against EU regulations on air quality
1.7 The UK has made significant progress in reducing emissions of air pollutants over
the past few decades (Figure 3). For example, emissions of NOx and PM2.5 fell by 69%
and 76% respectively from 1970 to 2015. This has been achieved through legislation on
industrial emissions, European vehicle emission standards, and a shift in the UK fuel mix
away from coal, among other measures.Figure 3
Indexed UK emission levels 1970 to 2015 (1970 = 100)
The UK has made significant progress in reducing emissions of air pollutants
Indexed emissions
160.00
140.00
120.00
100.00
80.00
60.00
40.00
20.00
0
1970
1971
1972
1973
1974
1975
1976
1977
1978
1979
1980
1981
1982
1983
1984
1985
1986
1987
1988
1989
1990
1991
1992
1993
1994
1995
1996
1997
1998
1999
2000
2001
2002
2003
2004
2005
2006
2007
2008
2009
2010
2011
2012
2013
2014
2015
Carbon monoxide
Sulphur dioxide
Nitrogen oxides as NO2
PM10
PM2.5
Benzene
Lead
Source: National Atmospheric emissions inventory
Air quality Part One 1516 Part One Air quality
1.8 The EU 2001 National Emission Ceilings Directive sets national ‘ceilings’ for air
pollutants and was transposed into UK legislation by the National Emission Ceilings
Regulations 2002. The ceilings cover four pollutants (nitrogen oxides, sulphur dioxide,
non-methane volatile organic chemicals and ammonia) to be met from 2010. The EU
2008 Ambient Air Quality Directive sets limits for concentrations of pollutants in the air
and was transposed into UK legislation through the Air Quality Standards Regulations
2010. It sets limits for ambient concentrations of seven pollutants (nitrogen dioxide,
particulate matter, fine particulate matter, sulphur dioxide, lead, carbon monoxide and
benzene). The Ambient Air Quality Directive also had an original compliance deadline
of 2010.5
1.9 The UK has met emission ceilings continuously since 2010 (Figure 4). In 2016 a
revised Directive set new ceilings for 2020 and 2030 for these pollutants, and for PM2.5,
with the aim of cutting the health impacts of air pollution by half compared with 2005.
Member states must transpose the new Directive into national legislation by 1 July 2018.
For all pollutants except for SO2, the UK will need to make further emissions reductions
to meet the 2020 ceilings. Defra has said it will publish a wider air quality strategy
(a ‘Clean Air Strategy’) in 2018 which will cover its approach to these pollutants.
Figure 4
Absolute emission ceilings and emission levels in the UK
2015 actual 2010 2020 2030
emissions ceiling ceiling ceiling
(ktonnes) (ktonnes) (ktonnes) 3 (ktonnes) 3
Nitrogen oxides (NOx) 918 1,167 724 434
Sulphur dioxide (SO2) 236 585 292 85
Ammonia (NH3) 293 297 283 258
Non-methane volatile organic 835 1,200 N/A N/A
compounds (NMVOC) 20101
NMVOC 2020/2030 2 733 N/A 729 654
Fine particulate matter (PM2.5) 105 N/A 79 61
Notes
1 The 2010 NECD ceilings for NMVOCs included emissions from all sources.
2 The 2020 and 2030 ceilings for NMVOCs have been revised, and now exclude emissions from manure management
and agricultural soils that were included in the 2010 figure.
3 2020 and 2030 ceilings are based on a percentage reduction from the actual emission levels in 2005. These absolute
emission ceilings have been calculated using the 2005 data in the 1970–2015 emissions inventory.
Sources: National Audit Office analysis
5 The government received an extension for 13 of the 43 air quality zones for NO2 emissions. One extension ended on
1 January 2013, three on 1 January 2014, and nine on 1 January 2015.Air quality Part One 17
1.10 The UK is divided into 43 zones for reporting on ambient concentrations
(Figure 5 overleaf). These are deemed non-compliant if central government’s official
monitoring and (for the annual limit) modelling (see paragraphs 2.8 and 2.9) indicates that
ambient air quality at any location within that zone breaches the limits. The UK complies
with the limits for all pollutants except nitrogen dioxide (Figure 6 on page 19), on which
most of the zones have not complied since the regulations came into effect in 2010.
In 2016:
• 37 of the 43 air quality zones exceeded the annual NO2 limit (with one or more
locations where average concentrations of NO2 over the year exceeded 40 µg/m3).
• 2 zones (South Wales and London) also exceeded the hourly NO2 objective (with
one or more locations where hourly concentrations of NO2 exceeded 200 µg/
m3 on more than 18 occasions in the year). In 2017, central government’s official
monitoring indicated that South Wales exceeded this objective in January, with
London exceeding the objective in June. Kings College London has, however,
reported that a local air quality monitoring site in London (Brixton Road) showed
exceedance of the objective by 5 January. Defra told us that this does not
count towards official compliance as the site is not operated for the purpose of
compliance assessment, and is run to London Air Quality Network standards,
rather than the standards necessary to meet EU directive requirements.
While most of the UK’s zones are non-compliant with NO2 limits, most locations across
the UK do comply: government modelling predicts that in 2017 90% of modelled roads
will be compliant with NO2 limits.
1.11 Government considers that a key cause of non-compliance with air quality
standards is the failure of European vehicle regulations (Euro standards) to deliver
expected emissions reductions in real-world driving conditions. The EU has introduced
successively more stringent Euro Standards since 1993 in order to reduce the emissions
of new vehicles. The current standard is Euro 6, introduced in 2014, which applies to
all newly manufactured vehicles. In September 2015 it was reported that Volkswagen
had been using defeat devices in order to comply with emissions standards in the US.
Subsequent testing by DfT found no evidence that defeat devices were widespread,
however it found that there were higher levels of NOx emissions under real world conditions
than had been recorded in the laboratory testing used to enforce Euro standards; average
emissions in real-world driving were over 6 times higher than the legislated laboratory limit.
1.12 The World Health Organisation (WHO) also has guideline limits for air pollutants
which are in some cases more stringent than the EU limit values. Although the UK
met the EU limit values for both PM2.5 and PM10 in 2016, only 10 zones had maximum
recorded concentrations within the WHO guideline annual mean for PM10 and five
for PM2.5. The WHO caution that even at low concentrations particulate pollution has
health impacts, and state that ‘no threshold has been identified below which no damage
to health is observed’.18 Part One Air quality
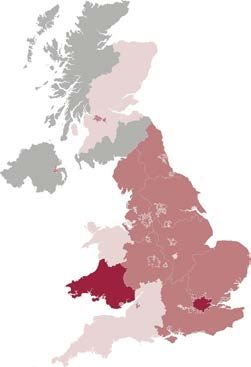
•
Figure 5
The UK’s 43 air quality reporting zones
37 of the UK’s 43 air quality zones include locations that exceed NO2 limits
..,,""?'
'
�·
.... ,
��� .....
Glasgow Urban Area
Belfast Urban Area
Some roads currently
Some roads currently in in breach and expected to
breach and expected to still be in breach in 20215
still be in breach in 20215
Blackpool Urban Area Leicester Urban Area
No roads in breach Some roads currently
in breach
Preston Urban Area
No roads in breach Kingston upon Hull
Some roads currently
in breach
Liverpool Urban Area
Some roads currently
in breach
Reading/Wokingham
Urban Area
Birkenhead Urban Area Some roads currently
in breach
Some roads currently
in breach
Brighton/Worthing/
Swansea Urban Area Littlehampton
Some roads currently No roads in breach
in breach
Cardiff Urban Area Bristol Urban Area
Some roads currently in Some roads currently in
breach and expected to breach and expected to
still be in breach in 20215 still be in breach in 20215
Not compliant: one or more roads currently in breach and Not compliant: one or more roads currently in breach but
expected to still be in breach in 2025 without additional action forecast to comply in 2021 without additional action
Not compliant: one or more roads currently in breach and Compliant
expected to still be in breach in 2021 without additional action
Notes
1 Labels shown for zones that are different to surrounding zones and would not otherwise be distinguishable at this scale.
2 An air quality zone is non-compliant if modelling indicates that ambient air quality at any location within that zone breaches the limits. While most
of the UK’s zones are non-compliant with NO2 limits, most locations across the UK do comply: government modelling predicts that by 2017,
90% of modelled roads will be compliant with NO2 limits.
3 Map is divided into agglomeration zones (major urban areas) and non-agglomeration zones.
4 All expected dates of compliance are as modelled by government in the 2017 Plan, without additional local action.
5 Without additional local action.
Source: National Audit Office analysis of Department for Environment, Food & Rural Affairs dataAir quality Part One 19
Figure 6
UK performance against EU limit values
Pollutant EU limit value Measurement Actual performance against World Health Organization
period EU limits7 recommended limits
Nitrogen 200 µg/m³, not to be 1 hour mean 2 zones exceeded the hourly limit 200 µg/m³ hourly mean
dioxide exceeded more than on more than 18 occasions:
(NO2)4 18 times a calendar year1
London: 106 exceedances
South Wales: 126 exceedances
40 µg/m³ 1 Calendar year mean Average: 54 µg/m³ 40 µg/m³ annual mean
Range: 31–102 µg/m³
Limit exceeded in 37/43 zones.
Particulate 50 μg/m³ not to be 24 hour mean No zones more than 50 μg/m³ 24 hour mean
matter (PM10) exceeded more than 35 exceedances
35 times a calendar year
(by 2005) 2
40 μg/m³ 2 Calendar year mean Average: 21 µg/m³ 20 μg/m³ annual mean
Range 11–29 µg/m³
Fine 25 μg/m³ 3 Calendar year mean Average: 14 µg/m³ 25 μg/m³ 24 hour mean
particulate
Range: 7–18 µg/m³ 10 μg/m³ annual mean
matter
(PM2.5)
Sulphur 350 µg/m³, not to be 1 hour mean No zones more than 500 µg/m³ 10 minute mean
dioxide (SO2) exceeded more than 24 exceedances
24 times a calendar year2
125 µg/m³, not to be 24 hour mean No zones more than 20 µg/m³ 24 hour mean
exceeded more than three exceedances
three times a calendar year2
Lead 5 0.5 μg/m³ 2 Calendar year mean Average: 0.014 μg/m³ 0.5 μg/m³ annual mean
Range: 0.004 – 0.032 μg/m³
Carbon 10 mg/m³ 2 Maximum 8-hour Average: 1.85 μg/m³ 100 mg/m³ for 15 minutes
monoxide daily mean
Range: 0.9 – 4.1μg/m³ 8 60 mg/m³ for 30 minutes
(CO)
30 mg/m³ for 1 hour
10 mg/m³ for 8 hours
Benzene 6 5 μg/m³ 1 Calendar year mean Average 1.38 μg/m³ No specific guideline value
Range: 0.29 – 3.9 μg/m³
Notes
1 To be achieved and maintained by 1 January 2010. 6 Benzene is an example of a non-methane volatile organic
2 To be achieved and maintained by 1 January 2005. compound (NMVOC).
3 To be achieved and maintained by 1 January 2020. 7 The average is the mean concentration across the 43 monitoring zones.
The range represents the lowest and highest actual concentration figures
4 Government received an extension for 13 of the across the 43 zones.
43 air quality zones for NO2 emissions.
8 CO concentrations are measured in 6/43 zones. Defra are confident that
5 Lead is an example of a heavy metal. all zones comply because current concentrations in these zones are
significantly below limits, and are not increasing.
Source: National Audit Office analysis20 Part One Air quality
1.13 In February 2014 the European Commission started an infringement case against
the UK under the Ambient Air Quality Directive. In February 2017, the UK received a
‘Reasoned Opinion’, which is a final written warning before a case is referred to the
Court of Justice of the European Union (CJEU). If the UK cannot show how it would
comply with legal limits within the timeline imposed by the Commission for responding
to the Reasoned Opinion, the Commission could further escalate proceedings. The
UK submitted a response to the Court of Justice of the European Union in April 2017.
It is currently under review. There are infringement procedures against a number of
other European countries under the Ambient Air Quality Directive: including four other
countries (France, Germany, Italy and Spain) which also received Reasoned Opinions
relating to NO2 limits in February 2017 (Figure 7).
1.14 Defra recognises potential fines relating to air quality as unquantified remote
contingent liabilities within its annual accounts.6 This reflects the fact that the
payment of any fines is dependent on a decision by the EU to impose them, which is
only expected to occur if the CJEU issues a judgment and the UK fails to act on its
findings. Government does not have an estimate of what the level of penalties would
be should the UK be fined by the CJEU, as it is unknown how many air quality zone
breaches the court would choose to pursue, nor is it clear whether penalties may be
imposed before EU‑exit.
1.15 Government’s air quality plans have been subject to legal challenge:
• In November 2016, the High Court made a declaration that the government’s
2015 Air Quality Plan was not compliant with the Air Quality Standards Regulations
2010. It found that the Secretary of State fell into error in fixing on a projected
compliance date of 2020 (and 2025 for London) and adopted too optimistic a model
for future emissions (see paragraph 2.10). It concluded that the 2015 Plan was
non‑compliant but should remain in force until the revised plan was published, and
also that the Secretary of State should aim to achieve compliance by the soonest
date possible, choosing a route which reduces exposure as quickly as possible.
• Following publication of the government’s draft revised Air Quality Plan in May 2017,
an environmental law organisation, ClientEarth, launched a legal challenge, stating
that it should be more ambitious in tackling the UK’s air pollution. The High Court
ruled that ministers should be allowed to finalise the plan.
• In October 2017 Client Earth commenced legal proceedings against the
government over the final air quality plan published in July 2017. The case
is in its early stages and no conclusion has been reached.
6 A contingent liability is a possible financial obligation whose existence will be confirmed by uncertain future events
that are not wholly within the control of the entity. Classification of a contingent liability as remote is an accounting
judgement that payment is not probable. This classification is reviewed annually.Figure 7
Overview of EU infringement cases since 2010
There have been several EU infringement cases on the Air Quality Directive
2010 2014 2015
Referrals to European Court of Justice Sent a Reasoned Opinion Sent a Reasoned Opinion
Cyprus, Italy, Portugal, Spain, Slovenia and Sweden Hungary, Latvia, Portugal, Czech Republic, Sweden and France
Greece, Spain, Austria,
Reasoned Opinion Referrals to the European Court of Justice
Slovakia and Germany
Romania Belgium, Bulgaria and Poland
March 2010 2011 2013
Bulgaria is sent Referral to the European Sent a letter of
a Reasoned Court of Justice formal notice
Opinion
France Slovenia and Italy
2010 2011 2012 2013 2014 2015 2016 2017
2010 February 2014 2015 2016 2017
The UK breaches EU limits for NO2 in The European Commission Letter of Letter of formal notice Sent a Reasoned
40 of the 43 zones. In 2011, the UK launches infraction proceedings formal notice Opinion
Czech Republic
requests an extension to the 2010 against the UK by issuing a
Portugal and Austria France, Germany,
compliance for 24 zones to the EU.3 letter of formal notice for failure
Italy and Spain
to cut NO2 levels
Fine particulate matter (PM10) Nitrogen dioxide (NO2) Sulphur dioxide (SO2)
February 2017
Reasoned Opinion issued to the UK over NO2 from European Commission
The UK responds in April 2017 – the response is currently being reviewed
Notes
1 A Reasoned Opinion is a final written warning. This will typically give the member state two months to take action to rectify the breach.
2 The Figure does not show all infringement procedures relating to the Air Quality Directive. Four other countries (Poland, Denmark, Belgium and Hungary), for example,
have been sent Pilot Letters related to NO2 limits (a Pilot Letter is a stage that precedes a Letter of Formal Notice).
3 The UK received an extension for 13 of the 43 air quality zones.
Source: Clean Air Project
Air quality Part One 2122 Part One Air quality
The impact of EU exit
1.16 The Secretary of State for Environment, Food & Rural Affairs, the Rt Hon
Michael Gove MP, has said that the government has “no intention of weakening the
environmental protections that we have put in place while in the European Union”.
Under the current provisions of the European Union (Withdrawal) Bill, law derived from
the EU would continue in domestic law after Exit Day. This includes the ceilings and limit
values currently in place.
1.17 Current arrangements for enforcement of these legal duties will no longer apply if
the UK is no longer in the jurisdiction of the CJEU. UK courts will continue to have a role
through judicial review. The EFRA Select Committee questioned whether enforcement
would include financial penalties, as these would no longer be paid to Europe, and while
the Secretary of State recognised these as part of the potential ‘legal armoury’ he also
pointed to the power of the courts to mandate action without fines. The requirement
to regularly report publicly on air quality is already a part of UK law; however, it is not
clear whether there will be a mechanism to continue the function of an independent
regular review of progress currently provided by the EU. The government will also need
to ensure that the new system meets the requirements of the Aarhus Convention,
including regarding access to environmental justice.7 The Secretary of State has said
that he recognises stakeholders’ concerns about a ‘governance gap’ after EU exit, and
that proposals to address this will be considered in the course of the progress of the
Withdrawal Bill. On 12 November he announced plans to consult on a new, independent
body to hold Government to account for upholding environmental standards in England
after the UK leaves the European Union.
7 The UK is bound by the 1998 Aarhus Convention, which enshrines the citizens’ right of access to environmental
justice, allows them to participate in environmental decision‑making by government, and gives them right of access
to environmental information.Air quality Part Two 23
Part Two
The UK’s plan to improve air quality
2.1 This part covers:
• the 2017 Air Quality Plan (the 2017 Plan) for reducing roadside nitrogen dioxide
(NO2) concentrations; and
• the air quality models that underpin the Plan.
The 2017 Plan for tackling roadside nitrogen dioxide
concentrations
2.2 In response to a legal challenge to its December 2015 air quality plan, (see
paragraph 1.15 in Part One), government published a revised plan for tackling roadside
NO2 concentrations in July 2017 (the 2017 Plan). The stated objective of this Plan is to
bring NO2 pollution within statutory limits in the “shortest possible time”.
2.3 In preparing the 2017 Plan, the government updated its forecasts of air quality
performance (see paragraph 2.10). It concluded that the scale of the challenge was
greater than it had previously anticipated. A key step in its analysis for both the 2015
and 2017 Plans was to develop a ‘baseline scenario’ of the improvements in air quality
that would result from existing measures (see paragraph 2.8). When it developed the
2015 Plan this projected that the UK would not comply in 8 of the 43 air quality zones
by 2020 without additional measures. However by the time of the July 2017 Plan the
equivalent baseline scenario forecast that the UK would not comply in 29 of the 43 air
quality zones by 2020 without additional measures.8
8 Central scenario.24 Part Two Air quality
2.4 In response, a ministerial direction published with the 2017 Plan requires 23 of the
353 local authorities in England to draw up plans for delivering compliance in their local
area in the shortest possible time (Figure 8).9 Government chose these local authorities
based on a central forecast of the areas that would not comply with NO2 limits in 2021
without additional local action (see paragraph 2.12). The 23 local authorities must:
• undertake a feasibility study to identify the option which will deliver compliance with
legal limits for NO2 in the area in the shortest possible time; and
• consider whether to introduce a ‘charging Clean Air Zone’ to discourage the most
polluting vehicles from problem areas. The government has stated that if a local
authority can identify measures other than charging zones that are at least as
effective at reducing NO2, those measures should be preferred as long as the local
authority can demonstrate that this will deliver compliance as quickly.
The 23 local authorities must complete an initial plan for new measures as soon as
possible and by 31 March 2018 at the latest, with final plans by 31 December 2018
at the latest (Figure 9 on pages 26 and 27).
2.5 The 2017 Plan also expects that:
• five cities named in the 2015 Plan continue to develop local plans to achieve
compliance in the shortest possible time.10 They are expected to deliver new
‘Clean Air Zones’ (which may or may not be charging) by the end of 2019, to
achieve compliance with the annual mean NO2 concentration limits in 2020;
and that
• the Mayor of London will continue with plans for air quality, including to introduce
a new ‘Ultra Low Emission Zone’, so as to achieve compliance in 2026.11
2.6 In total, the 2017 Plan identifies £3 billion of potential spend on schemes that
include air quality benefits between 2010-11 and 2020-21. This includes a £255 million
Implementation Fund to support 28 local authorities to prepare and deliver their plans
once approved, £1.2 billion associated with government’s 2017 cycling and walking
strategy, and £1 billion of funding for ultra low emissions vehicles (Figure 10 on page 28).
2.7 Government’s central estimate is that the measures in the 2017 Plan will achieve
compliance with NO2 limits in 37 zones by 2021, and in all 43 zones by 2026.12
The following section explains the complex analysis and modelling that informed
this forecast and the associated uncertainty.
9 Basildon, Bath and North East Somerset, Bolton, Bristol, Bury, Coventry, Fareham, Gateshead, Guildford, Manchester,
Middlesbrough, New Forest, Newcastle, North Tyneside, Rochford, Rotherham, Rushmoor, Salford, Sheffield,
Stockport, Surrey Heath, Tameside and Trafford.
10 Birmingham, Leeds, Nottingham, Derby and Southampton.
11 The Department for Environment, Food & Rural Affairs (Defra’s) central scenario.
12 This scenario includes the implementation of Clean Air Zones, but does not include the implementation
of additional actions.Air quality Part Two 25
Figure 9 Shows Actions expected by air quality plans in England
Figure 8
Local authorities in England expected to introduce new air quality measures
2015 Plan: cities expected to introduce Clean Air Zones, plus London
2017 Plan: additional local authorities required to develop plans to tackle air quality
Notes
1 The 2015 air quality plan required five cities to introduce new Clean Air Zones: Birmingham, Leeds, Nottingham, Derby and Southampton.
It noted that London already had plans to introduce an Ultra Low Emission Zone.
2 The 2017 air quality plan places additional expectations on the following local authorities: Basildon, Bath and North East Somerset,
Bolton, Bristol, Bury, Coventry, Fareham, Gateshead, Guildford, Manchester, Middlesbrough, New Forest, Newcastle, North Tyneside,
Rochford, Rotherham, Rushmoor, Salford, Sheffield, Stockport, Surrey Heath, Tameside and Trafford.
Source: JAQU Air Quality PlansFigure 15 shows Key milestones and timeline of clean air zones in England
Figure 9
Indicative timeline of Clean Air Zones in England
2017 2018 2019 2020
Jan–Mar Apr–Jun Jul–Sep Oct–Dec Jan–Mar Apr–Jun Jul–Sep Oct–Dec Jan–Mar Apr–Jun Jul–Sep Oct–Dec Jan–Mar Apr–Jun Jul–Sep Oct–Dec
26 Part Two Air quality
Group A: The initial five Clean Air Zones
Local authorities carry out local transport and air quality modelling
Communication and engagement
Options assessment
Local consultation
Business case development
Local legislation
Full Business Case
Final Air Quality Plan (31 July 2017) Earliest launch of Clean Air Zones Latest launch of Clean Air Zone Group A
Group B: Additional ‘new’ Clean Air Zones
Local authorities carry out local transport and air quality modelling
Communication and engagement
Options assessment
Local consultation
Business case development
Local legislation
Proposal for a feasibility study Strategic outline Full business case Launch of Clean Air Zone group B
case (initial plans)Air quality Part Two 27
Figure 15 shows Key milestones and timeline of clean air zones in England
Figure 9 continued
Indicative timeline of Clean Air Zones in England
Notes
1 Group A excludes London as the Mayor of London is responsible for air quality in the capital.
2 ‘Local legislation’ refers to the local legislative measures, such as Traffic Regulation Orders, local authorities may need to
put in place to implement their local plans.
Source: National Audit Office analysis of Department for Environment, Food & Rural Affairs internal documents
The analysis and modelling that informed the 2017 Plan
2.8 In developing its 2017 Plan, Defra carried out a range of analysis which informed
the nature and scale of measures in the final Plan. In broad terms, this analysis
comprised four steps, to assess:
• current compliance with NO2 limits;
• forecast compliance given existing or ongoing action (hereafter referred to as
the ‘baseline’ scenario);
• policy options; and
• forecast compliance given the measures in the 2017 Plan (hereafter referred to
as the ‘with measures’ scenarios).
2.9 The analysis drew on a complex modelling and analytical process involving:
• Pollution Climate Mapping (PCM) Model: a series of models run by consultants on
Defra’s behalf which estimates current and forecast concentrations of air pollutants
on a 1 kilometre by 1 kilometre grid and for individual roads across the UK. This
mapping draws on numerous subsidiary datasets from different organisations
(Figure 11 on pages 30 and 31) and takes around three months to complete;
• Streamlined Pollution Climate Mapping Model: a tool that approximates the results
of the PCM, used to assess policy scenarios more quickly; and
• multi-criteria and cost–benefit techniques, to assess the merits of different
policy options, drawing on the results of PCM and SL-PCM modelling as well
as qualitative judgements.
Figure 12 on page 32 gives an overview of the analysis and its conclusions. More detail
on the cost–benefit analysis of different policy options is in Appendix One.You can also read