Town of Oro Valley Parks and Recreation Master Plan - Phase One 2020
←
→
Page content transcription
If your browser does not render page correctly, please read the page content below
Town of Oro Valley
Parks and Recreation
Master Plan – Phase One
2020
Parks and Recreation Master Plan - Phase One

                                                           Table of Contents
CHAPTER ONE – EXECUTIVE SUMMARY ................................................................................................ 1

        PROJECT PURPOSE AND GOAL .................................................................................................. 1
        PROJECT PROCESS....................................................................................................................... 1
        ORO VALLEY MASTER PLAN ORGANIZATION ............................................................................. 2
        SUMMARY OF KEY FINDINGS AND RECOMMENDATIONS ......................................................... 2

CHAPTER TWO – ECONOMIC IMPACT OF PARKS AND RECREATION ................................................ 5

        KEY FINDINGS FROM THE NATIONAL STUDY .................................................................... 6
        WHAT THE RESULTS MEAN ................................................................................................... 6
        ADDITIONAL ECONOMIC BENEFITS ................................................................................. 6
        SUMMARY .................................................................................................................................. 7

CHAPTER THREE - COMMUNITY PROFILE ............................................................................................... 8

        DEMOGRAPHIC ANALYSIS........................................................................................................... 8
        METHODOLOGY ........................................................................................................................... 8
        RACE AND ETHNICITY DEFINITIONS ............................................................................................. 9
        ORO VALLEY POPULACE ........................................................................................................... 10
        TAPESTRY SEGMENTATION ......................................................................................................... 14

CHAPTER FOUR - RECREATION TRENDS ANALYSIS ............................................................................. 18

        NATIONAL AND REGIONAL PROGRAMMING TRENDS ........................................... 29
        LOCAL SPORT AND MARKET POTENTIAL ................................................................................... 32
        SUMMARY ................................................................................................................................ 34

CHAPTER FIVE - COMMUNITY NEEDS ASSESSMENT ............................................................................ 35

        QUALITATIVE INPUT SUMMARY .................................................................................................. 35
        INTECEPT SURVEY FINDINGS ...................................................................................................... 36
        PROJECT WEBSITE INPUT ............................................................................................................ 37
        ON-LINE SURVEY ......................................................................................................................... 38
        STASTICALLY VALID SURVEY ....................................................................................................... 41
        NEEDS ASSESSMENT PRIORITY RANKINGS ................................................................................. 57
        SUMMARY ................................................................................................................................... 58

CHAPTER SIX - PARK AND FACILITY ASSESSMENTS ............................................................................. 59

        PARK CLASSIFICATION AND PARK DESIGN PRINCIPLES .......................................................... 59
        DEVELOPED PARK/FACILITY INVENTORY AND ASSESSMENT ................................................... 66

                                                                                   i
Parks and Recreation Needs Assessment Study – Phase One

CHAPTER ONE – EXECUTIVE SUMMARY
    PROJECT PURPOSE AND GOAL
The purpose of Town of Oro Valley’s Needs Assessment Phase One is to identify the needs of the
community that create the foundation for the development of a roadmap for future development of
recreational facilities and opportunities for the Town over the next 10 years. This plan is based on
recognized park planning principles and standards, and reflects input from residents and stakeholders in
Oro Valley, Town staff, the Parks and Recreation Advisory Board and the Town Council.
The Town of Oro Valley Parks and Recreation Needs Assessment Phase One focuses on identifying the
Town’s current and future recreation needs to aid Town staff and decision-makers in providing and
expanding and equitable distribution of recreational facilities and opportunities to Town of Oro Valley
residents and stakeholders. Primary outcomes of this phase of the Needs Assessment include:
    •   Evaluation of the existing parks, trails and open space system;
    •   Documenting priorities and needs of the current and projected population growth based on data-
        driven input

    PROJECT PROCESS
The foundation of the Master Plan was to incorporate a variety of data and mine local knowledge using
a comprehensive stakeholder participation process and community surveys. The stakeholder input
process incorporated a variety of methods that included interviews, focus group meetings, and public
forums/presentations. The data generated from these critical community interactions helped to define
the true unmet recreation needs of the community, as well as address key operational issues, provide
recommendations for business-related changes, and strategize on how to best position the Town and
Parks and Recreation Department to move forward for optimum results.

1.2.1 PLANNING EFFORTS CONSIDERED
A number of local planning efforts helped guide the development of Phase One of the Master Plan. The
following highlights some of these efforts:
    •   Your Voice, Our Future General Plan 2016
    •   Park Development Guidelines
    •   Department Policies and Procedures

1.2.2 ELEMENTS OF THE PLAN
The planning process for Phase One of the Master Plan was completed with Town staff and included:
    •   The collection of available information;
    •   Data analysis to determine inventory and condition of current facilities;
The data collected from the staff and onsite facility assessments will be utilized to identify key factors,
issues, and concerns regarding the parks and recreation system and how the Town’s Parks and Recreation
Department manages operations.

                                                 1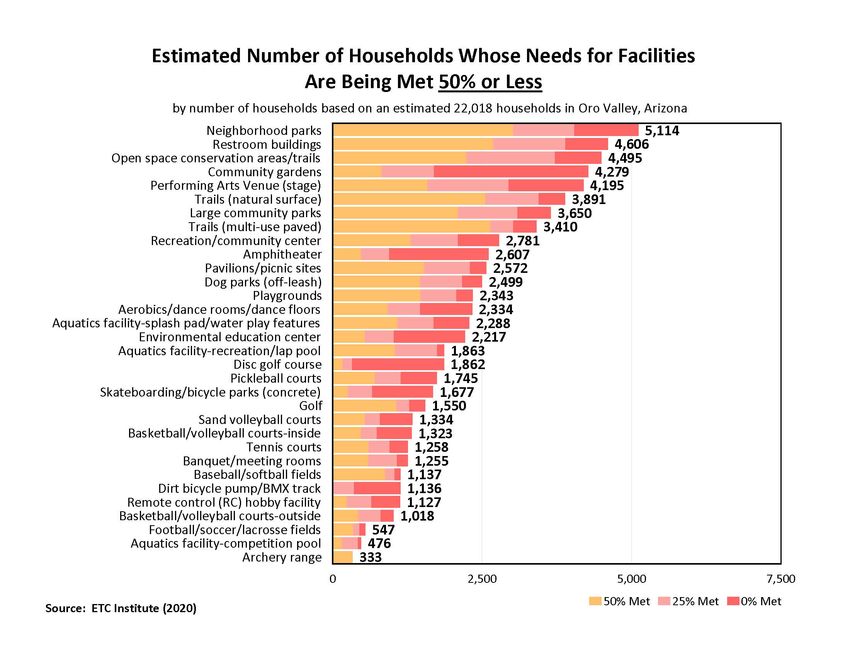
Town of Oro Valley Parks and Recreation

    ORO VALLEY MASTER PLAN ORGANIZATION
Phase One of the Master Plan presents the overall analysis of community input and a current assessment
of the parks and recreation system. This study begins with an Executive Summary that provides an
overview, and the following sections respond to the primary outcomes and determination of needs.
    SUMMARY OF KEY FINDINGS AND RECOMMENDATIONS
Following the assessment of the Town’s parks and recreation system, a variety of key findings were
identified to support the implementation of the Master Plan. These key findings help to guide decision-
making for the next five to ten years.

1.4.1 MARKET ANALYSIS KEY FINDINGS
• POPULATION: The population is increasing and is projected to experience 20% population growth
    over the next 15 years. With a modestly growing population, park and recreation services will need
    to strategically invest, develop, and maintain parks and facilities in relation to current and future
    housing development areas.
•   AGE SEGMENTATION: Oro Valley currently has a very broad and slightly unbalanced age
    segmentation with the largest group being 55+ with the second largest group being 0-17. Over the
    next 15 years, the 55+ age segment, which currently is the largest age segment in Oro Valley, will
    increase by 3.6% while those who are 0-17 are projected to decrease by 2.2%, making up 24.7% of
    the population by 2034. This is assumed to be a consequence of a vast amount of the Baby Boomer
    generation shifting into the senior age segment.
    This is significant as providing access to services and programs will need to be focused on multitude
    of age segments simultaneously as age segmentation is a strong determinant of recreational
    preferences. Equal distribution across all age segments will require the Town to continue to provide
    programs, services, parks and facilities that appeal to all residents of the community.
•   RACE AND ETHNICITY: A homogenous population will likely focus the Town on providing traditional
    programming and service offerings while always seeking to identify emerging activities and sports.
•   HOUSEHOLDS AND INCOME: With median and per capita household income averages well above
    state and national averages, it is important for the Town to prioritize providing offerings that are
    first class with exceptional customer service while seeking opportunities to create revenue
    generation.
•   TAPESTRY SEGMENTATION: Highly unique tapestry segmentation that indicates that Oro Valley is
    comprised primarily of residents that are approaching or in retirement.

1.4.2 COMMUNITY INPUT KEY FINDINGS
Input from the community confirmed that Oro Valley’s parks are loved by many, but there are gaps in
service and amenities and additional Town investment is needed to maintain and develop new parks for
the growing community. Participants see the system as one that is well-maintained with great staff. They
also enjoy the numerous programs and amenities offered. Unmet needs exist as the demand for select
services is currently outweighing the available facilities and/or existing amenities. The following
summarizes the themes of community input:

                                               2
Parks and Recreation Master Plan – Phase One

ECONOMIC DEVELOPMENT THROUGH PARK DEVELOPMENT
Opportunity exists for park development to enhance and/or advance economic development. There is
also an opportunity for economic development to enhance and support park development.
   •   Parks and recreation can play a significant role in business attraction, residential development,
       and the overall quality of life attributes desired by the community.
   •   Investment in parks reflects the community’s value set and the Town’s overall attitude of being
       an active player in the betterment of the community.
   •   The completion of Naranja Park and the reinvestment in Steam Pump Ranch can potentially serve
       as economic catalysts.
   •   Generalized opportunities to enhance the economic impact via tourism were cited through a
       number of existing Town offerings, including, but not limited to golf, pickleball, tennis, athletic
       field sports, competitive swimming and festivals/events.

INVESTING IN THE EXISTING PARKS SYSTEM
   •   Continue to focus on reinvesting in and maintaining existing parks.

   •   Opportunities exist to, in part, help meet the recreational needs of the community, in
       partnership with the development community, the Amphitheater Unified School District.

OPEN SPACE
   •   Desire to preserve defunct the Rancho Vistoso golf course, at least in part, as an open space
       conservation area was consistently expressed through all community input opportunities.

TRAILS AND CONNECTIVITY
   •   Desire for a connected, accessible recreational trail system that also supports active
       transportation and safe routes to school.

ADVOCACY AND AWARENESS
   •   Increased and targeted Communication/Marketing is needed to develop more advocacy for, and
       the awareness of, the parks and recreation system.

FUNDING THE PARKS AND RECREATION SYSTEM
   •   Multiple fiscally sustainable funding strategies, without increasing taxes, may be required to
       meet the needs of the community over the next 10 years.
   •   Continue to secure funding through grant programs will be critical for funding park development
       over the next 10 years.

                                                   3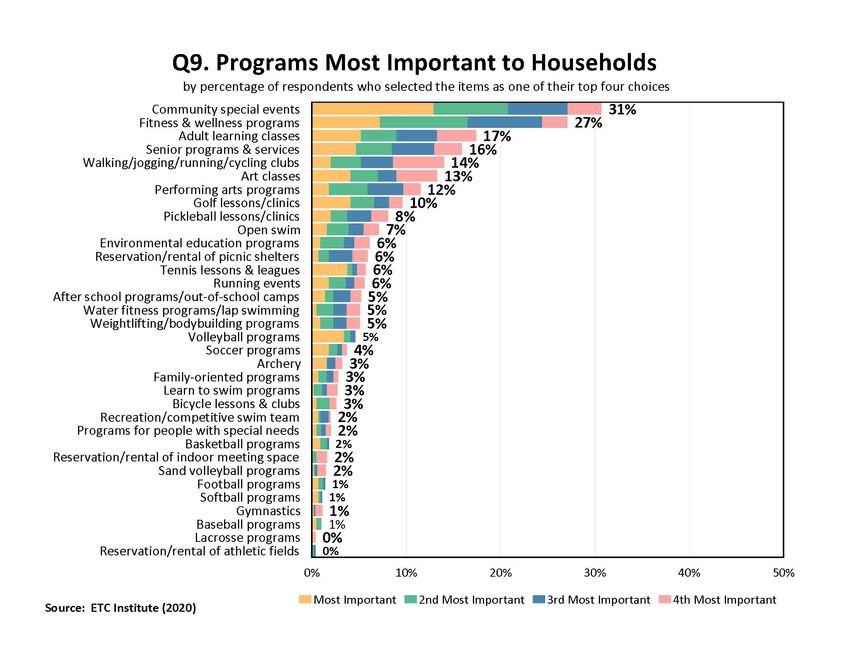
Town of Oro Valley Parks and Recreation
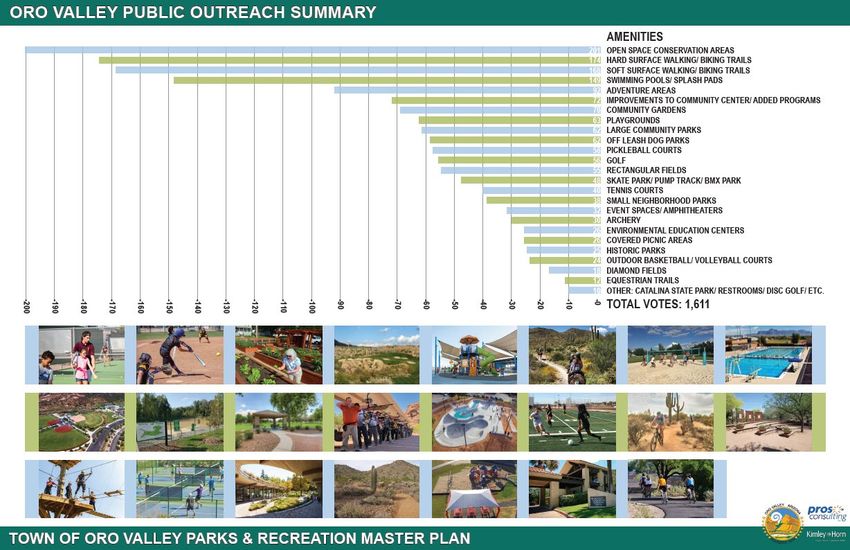
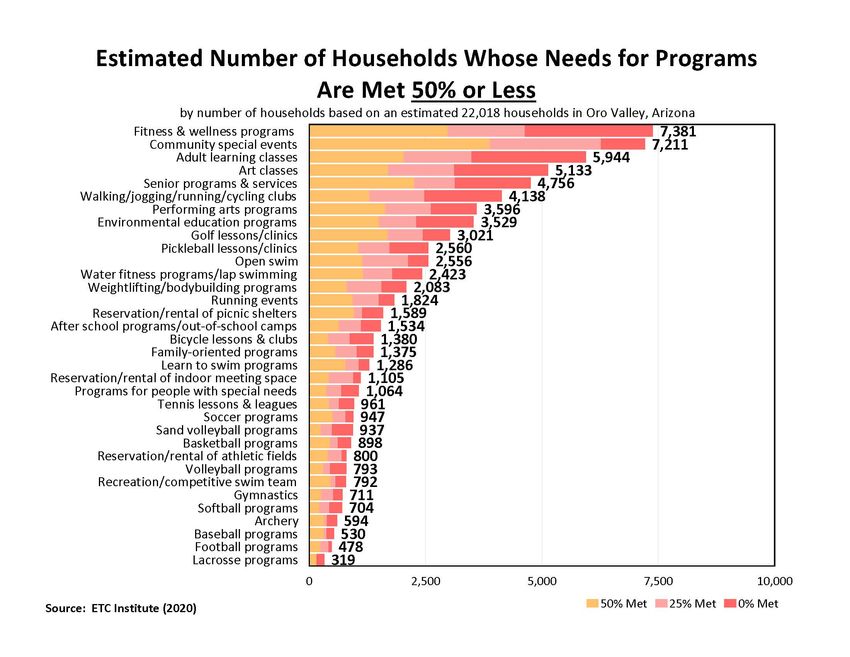
1.4.3 PROGRAM/SERVICE AND PARK/FACILITY PRIORITY RANKINGS
The purpose of the Program/Service and Park/Facility Priority Rankings is to provide a prioritized list of
facility/amenity needs and recreation program and service needs for the community served by the Town.
The analysis completed evaluated both quantitative and qualitative data including the following
community engagement initiatives that occurred January-May 2020:
• Master Plan Project Website January – May, 2020 - www.planyourparksov.com
o 927 comments received
• Focus Group and Stakeholder Meetings – January 23rd and 24th, 2020
o 37 participants
• Town Hall Meeting – January 23rd, 2020
o 130 participants
• Intercept Surveys – Nine dates – February – March, 2020
o 404 participants
• Statistically Valid Survey – February – April, 2020
o 443 completed surveys representing
• On-Line Survey – April – May, 2020
o 372 completed surveys
The results of the priority rankings are tabulated into three categories: High Priority (top third), Medium
third) and are summarized below:
Recreation Program/Service Priority Facility/Amenity
‐ Priority
Community special events Trails (natural surface)
Fitness & wellness programs Trails (multi use paved)
Open space conservation areas/trails
Adult learning classes High Neighborhood parks
Senior programs & services
Restroom buildings High
Art classes
Large community parks
Walking/jogging/running/cycling clubs
Performing Arts Venue (stage)
Performing arts programs
Community gardens
‐
Golf lessons/clinics
Environmental education programs Medium Golf
Dog parks (off leash)
Pickleball lessons/clinics
Recreation/community center
Open swim
Playgrounds
Water fitness programs/lap swimming
Pavilions/picnic ‐sites
Weightlifting/bodybuilding programs
Amphitheater Medium
Running events ‐ ‐ Aquatics facility ‐recreation/lap pool
Reservation/rental of picnic shelters
Aerobics/dance rooms/dance floors
After school
‐ programs/out of school camps
Aquatics facility splash pad/water play features
Tennis lessons & leagues
Pickleball courts
Family oriented programs
Environmental education center
Bicycle lessons & clubs
Disc golf course
Learn to swim programs
Tennis courts
Volleyball programs
Skateboarding/bicycle parks ‐ (concrete)
Soccer programs
Banquet/meeting rooms
Programs for people with special needs Low Basketball/volleyball courts inside
Reservation/rental of indoor meeting space
Baseball/softball fields
Archery
Sand volleyball courts Low
Basketball programs
Remote control (RC) hobby facility
Sand volleyball programs
Football/soccer/lacrosse fields
‐
Recreation/competitive swim team
Dirt bicycle pump/BMX track
Gymnastics
Basketball/volleyball
‐ courts outside
Softball programs
Archery range
Reservation/rental of athletic fields
Aquatics facility competition pool
Football programs
Baseball programs
Lacrosse programs
4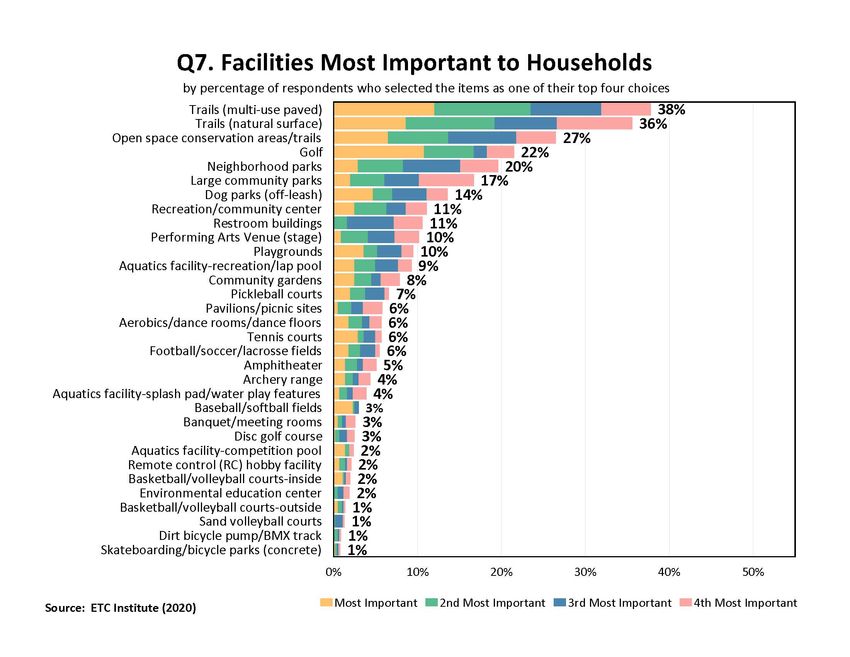
Parks and Recreation Master Plan – Phase One

CHAPTER TWO – ECONOMIC IMPACT OF PARKS AND RECREATION
The following summarizes the research findings from 2015 when the National Recreation and Parks
Association (NRPA) joined forces with the Center for Regional Analysis at George Mason University to
estimate the impact of spending by local park and recreation agencies on the U.S. economy. The research
adds to the growing body of evidence that the benefits of parks extend well beyond their role as a public
amenity and an enhancement to quality of life in their communities.
The analyses covered three areas: a national-level study, state-level assessments, and economic impacts
of selected case study parks. Key characteristics of the research include the following:
    •   The study is focused exclusively on the direct, indirect (business transactions of park agency
        vendors) and induced (employees spending their earnings) effects local and regional park
        agencies’ spending have on economic activity. The research does not measure the effects of
        visitor spending or the benefits local and regional park agencies generate for the environment,
        health and wellness, and property values.
    •   Data for this analysis comes from the U.S. Census Bureau survey of local government employment
        and spending data from 1,169 local and regional park agencies accessed from NRPA’s PRORAGIS
        database and/or park system budget data posted online. Data for the case study park analyses
        were supplied by the relevant park agencies.
    •   The analyses provide estimates of economic activity (output or the value of transactions), value
        added (equivalent to gross domestic product), labor income (salaries, wages and benefits) and
        employment (headcount jobs).

                    America’s local and regional public park
                          agencies generated over

                      $154 BILLION IN
                        ECONOMIC
                         ACTIVITY
                                  and supported almost

                   1.1 MILLION JOBS
        from their operations and capital spending alone in 2015

                                                   5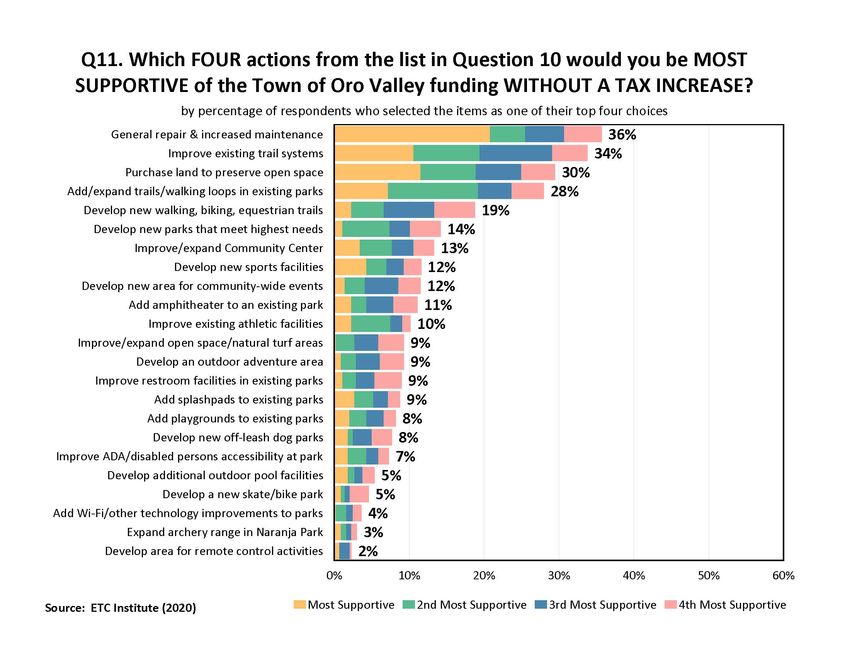
Town of Oro Valley Parks and Recreation

    KEY FINDINGS FROM THE NATIONAL STUDY
The U.S. Census Bureau reports that local park and recreation agencies had nearly 371,000 people on
their payrolls in 2015. That translates into nearly $31 billion of operations spending by these agencies.
That $31 billion ripples through the U.S. economy as park and recreation employees spend their
paychecks, and park and recreation agency vendors hire workers and purchase products and services to
serve their clients.
As a result, $31 billion of local park and recreation agency operations spending expanded to nearly $91
billion in total economic activity during 2015. That activity boosted real gross domestic product (GDP)
by $48.7 billion and supported more than 732,000 jobs that accounted for nearly $34 billion in salaries,
wages and benefits across the nation.
Further, local park and recreation agencies also invested an estimated $23.2 billion on capital programs
in 2015. The capital spending led to an additional $63.6 billion in economic activity, a contribution of
$32.3 billion to GDP, $21.3 billion in labor-related income and nearly 378,000 jobs.
Combining the impact of operations and capital spending finds the nation’s local park and recreation
agencies generated $154.4 billion in economic activity in 2015, nearly $81.1 billion in value added and
more than 1.1 million jobs that boosted labor income by $55.1 billion. Operations and capital spending
by local and regional public park agencies generated over $154 billion in economic activity and supported
almost 1.1 million jobs in 2015.
    WHAT THE RESULTS MEAN
These estimates of the economic impact generated from park and recreation agency spending come from
an input-output model that estimates direct, indirect and induced effects of those expenditures.
    •   Direct Effects are the spending by local park and recreation agencies, whether for operations or
        capital programs, and include spending for equipment, utilities, goods, services and personnel.

    •   Indirect Effects capture the spending associated with local park and recreation agencies’
        vendors. An example is an agency contracting with a local company to spray for mosquitoes.
        The pest control company will need to hire employees, purchase pesticides and contract with a
        bookkeeping service. The bookkeeping service rents office space, hires workers, and purchases
        office supplies, etc.
    •   Induced Effects reflect the impact of consumer spending (from wages) by park and recreation
        agency employees and employees working for an agency’s vendors.
The model estimates the total effects on output, labor income, value added and employment. Output is
essentially a measure of the value of transactions. Labor income includes salaries, wages and benefits.
Value added is the measure most equivalent to GDP and includes property income, dividends, corporate
profits and other measures. Employment is the number of headcount jobs. The databases used to build
the economic input-output model account for fulltime versus part-time employment in the relevant
sectors of the economy.
    ADDITIONAL ECONOMIC BENEFITS
Oro Valley’s Parks and Recreation Department generates additional economic benefits. While the figures
presented in this report are significant, they represent only one aspect of the economic benefits of public
parks, and consequently are conservative estimates of the full economic benefits of local parks and
recreation.

                                                6
Parks and Recreation Master Plan – Phase One
Beyond the impact of local park and recreation agency spending, other critical economic contributions
from public parks include:
• Economic Development: Parks and recreation improves the quality of life in communities and
benefits the local economic development of a region. A recent survey notes that three-quarters
of corporate executives’ rate quality-of-life features as important factors when choosing a
location for a headquarters, factory or other company facility.
• Visitor Spending: Many local park and recreation agency amenities spur tourism to their
respective locales, generating significant economic activity, including (but not limited to)
increased sales at local restaurants/bars and hotels. The August 2017 NRPA Park Pulse poll found
that park and recreation amenities—such as beaches, parks, trails and secluded and relaxing
places—are important to people when choosing a vacation destination.
• Health and Wellness: Parks and recreation promotes improved physical and mental health. This
not only helps people feel better but can also help lower medical and insurance costs for those
people taking advantage of those facilities and activities. Three in five respondents to the
November 2017 NRPA Park Pulse poll indicate they would take up walking or jogging in local
parks, trails or around their neighborhoods if advised by their doctors to be more physically
active.
• Conservation and Resiliency: Park and recreation agencies’ protection of land, water, trees,
open spaces and wildlife improves air and water quality in communities. Through effective land
management methods and green infrastructure investments, parks and recreation services make
communities more resilient to natural disasters, reducing disaster recovery and insurance costs,
Eighty-seven percent of respondents to the 2017 NRPA Americans’ Engagement with Parks Survey
agree that their local government and local park and recreation agency should make the needed
investments to ensure their communities are more resilient to natural disasters.
• Property Values: Economic research has demonstrated consistently that homes and properties
located near parklands have higher values than those farther away. Higher home values not only
benefit the owners of these properties but, in many communities across the United States, add
to the tax base of local governments. Eighty-five percent of respondents to the 2017 NRPA
Americans’ Engagement with Parks Survey seek high-quality park and recreation amenities when
they are choosing a place to live.
SUMMARY
Park and recreation agencies advance our nation’s communities in many ways. Not only are parks leading
the way in terms of conservation, health and wellness and social equity, they are also engines of
significant economic activity.
The powerful impact parks and recreation has on economic activity, when combined with the ability to
deliver healthier and happier communities, highlights the fact that these offerings are not merely a
“nice-to-have,” luxury government service. Rather, parks and recreation facilities, programs and services
are a critical aspect of what makes a Town, City or County a vibrant and prosperous community.
7Town of Oro Valley Parks and Recreation
CHAPTER THREE - COMMUNITY PROFILE
DEMOGRAPHIC ANALYSIS
The Demographic Analysis provides an understanding of the population of the Town of Oro Valley,
Arizona. This analysis reflects the total population, and its key characteristics such as age segments,
income levels, race, and ethnicity.
Future projections are all based on historical patterns. Unforeseen circumstances during or after the
time of the projections could have a significant bearing on the validity of the final projections.
METHODOLOGY
Demographic data used for the analysis was obtained from U.S. Census Bureau and from ESRI, the largest
research and development organization dedicated to Geographical Information Systems (GIS) and
specializing in population projections and market trends. All data was acquired in November 2019 and
reflects actual numbers as reported in the 2010 Censuses, and estimates for 2019 and 2024 as obtained
by ESRI. Straight line linear regression was utilized for projected 2029 and 2034 demographics. This
information will help support the development of the Town’s Comprehensive Parks and Recreation
System Plan.
8Parks and Recreation Master Plan – Phase One
RACE AND ETHNICITY DEFINITIONS
The Census 2010 data on race are not directly comparable with data from the 2000 Census and earlier
censuses; caution must be used when interpreting changes in the racial composition of the US population
over time. The latest (Census 2010) definitions and nomenclature are used within this analysis as follows:
• American Indian – This includes a person having origins in any of the original peoples of North
and South America (including Central America), and who maintains tribal affiliation or community
attachment
• Asian – This includes a person having origins in any of the original peoples of the Far East,
Southeast Asia, or the Indian subcontinent including, for example, Cambodia, China, India,
Japan, Korea, Malaysia, Pakistan, the Philippine Islands, Thailand, and Vietnam
• Black – This includes a person having origins in any of the black racial groups of Africa
• Native Hawaiian or Other Pacific Islander – This includes a person having origins in any of the
original peoples of Hawaii, Guam, Samoa, or other Pacific Islands
• White – This includes a person having origins in any of the original peoples of Europe, the Middle
East, or North Africa
• Some Other Race - Includes all other responses not included in the "White", "Black or African
American", "American Indian and Alaska Native", "Asian" and "Native Hawaiian and Other Pacific
Islander" race categories described above.
• Two or more races - People may have chosen to provide two or more races either by checking
two or more race responses
• Hispanic or Latino – This is an ethnic distinction, a subset of a race as defined by the Federal
Government; this includes a person of Mexican, Puerto Rican, Cuban, South or Central American,
or other Spanish culture or origin, regardless of race
9Town of Oro Valley Parks and Recreation
ORO VALLEY POPULACE
3.4.1 POPULATION
The Town’s population has experienced a growing trend in recent years and is estimated at 45,726
individuals in 2019. Projecting ahead, the total population is expected to continue to grow over the next
15 years. Based on predictions through 2034, the Town is expected to have 54,986 residents living within
24,051 households – this equates to a household size of 2.29.
P OP U L AT ION AN D H OU SE H OL DS
60,000 30,000
24,051
50,000 22,593 25,000
21,000
19,927
40,000 17,816 20,000
30,000 15,000
51,722 54,986
45,726 48,169
20,000 41,037 10,000
10,000 5,000
0 0
2010 2019 2024 2029 2034
Census Estimate Projection Projection Projection
Population Households
10Parks and Recreation Master Plan – Phase One
3.4.2 AGE SEGMENT
Evaluating the population by age segments, the Town exhibits an unbalanced distribution among the
major age segments. Currently, the largest grouping of age segments is the 55+ segment, making up
48.7% of the population.
Looking forward, the overall age composition of the population within the Town is projected to age
significantly. Over the next 15 years, the 55+ age segment, which currently is the largest age segment
in Oro Valley, will increase by 9.4% while all other major age segments are projected to decrease. This
is assumed to be a consequence of a vast amount of the Baby Boomer generation shifting into the senior
age segment and the overall attraction of Oro Valley to retirees.
Given the differences in how the active adults (55 and older) participate in recreation programs, the
trend is moving toward having at least three different program age segments for older adults. When
updating the park and recreation system, the Town should evaluate recreation experiences that would
cater to active adults who are 55-64, 65–74, and 75+ age segments.
P OP U L AT ION BY AGE SE GMEN T
0-12 13-17 18-34 35-54 55-64 65-74 75+
100%
12.5% 14.7% 17.0%
90% 18.5% 19.9%
80% 13.6%
17.1%
18.4% 20.4%
70%
21.9%
15.7%
60% 16.9%
15.8%
16.3%
50% 16.3%
25.9%
40% 21.5% 20.5%
18.1% 16.3%
30%
13.0%
13.5% 12.9%
20% 13.1% 13.1%
6.8% 5.5%
10%
5.0% 4.3% 3.8%
12.5% 10.8% 10.3% 9.4% 8.7%
0%
2010 2019 2024 2029 2034
Census Estimate Projection Projection Projection
11Town of Oro Valley Parks and Recreation
3.4.3 RACE AND ETHNICTY
In analyzing race, the Town’s current population is not highly diverse. The 2018 estimates show that
87% of the Town’s population falls into the White Alone category, while the Asian category (4%)
represents the largest minority. The predictions for 2034 expect that the Town’s population by race will
diversity slightly with a decrease in the White Alone population by approximately 4% while the Asian and
Some Other Race categories will increase by 2% each.
POPULATION BY RACE
White Alone Black Alone American Indian Asian Pacific Islander Some Other Race Two or More Races
3% 3% 4% 4%
3% 5%
4% 5% 5% 6%
90% 87% 86% 84% 83%
2010 2019 2024 2029 2034
CENSU S ESTIMATE P ROJ EC TION P ROJ EC TION P ROJ EC TION
Based on the 2019 estimate, those of Hispanic/Latino origin represented 14% of the Town’s total
population. The Hispanic/Latino population is expected to experience a slight increase to 19% by 2034.
H ISPAN IC P OP U L AT ION
Hispanic / Latino Origin (any race) All Others
100%
90%
80%
70%
60%
86% 81%
50%
40%
30%
20%
10%
14% 19%
0%
2019 Estimate 2034 Projection
12Parks and Recreation Master Plan – Phase One
3.4.4 HOUSEHOLDS AND INCOME
The Town’s per capita and median household income levels are well above that of state and national
averages.
COMPARATIVE INCOME
CHARACTERISTICS
Per Capita Income Median Household Income
$85,173
$58,100
$54,974
$49,475
$31,950
$28,634
Oro Valley Arizona U.S.A.
13Town of Oro Valley Parks and Recreation
TAPESTRY SEGMENTATION
Tapestry segmentation provides an accurate, detailed description of Oro Valley’s residents in which
distinctive lifestyle segments are identified based on their socioeconomic and demographic composition.
Many jurisdictions have 10+ tapestry segments that make up the majority (50%+) of its population. Oro
Valley has five segments that comprise 78.4% of its population. The five tapestry segments that make-
up a majority of the Town’s population are illustrated in the chart below as well as how they compare
to the United States.
Percent of Percent of
Median
Household Town US
Tapestry Segment Descriptor Median Age Household
Size Households Households
Income
(2018) (2018)
Active in their communities, generous in their
donations, and seasoned travelers. Expansive home
Exurbanites 2.5 51.0 $103,400 32.9% 1.9%
style in less crowded neighborhoods. Lifestyle is both
affluent and urbane.
Independent, active seniors nearing the end of their
careers or already in retirement. Actively pursuing
Golden Years 2.06 52.3 $71,700 15.7% 1.3%
travel, sports, dining out, museums, and concerts.
Focused on physical fitness, and enjoying their lives.
Favor communities designed for senior or assisted
living. Housing varies from mobile homes to single-
The Elders 1.68 72.3 $42,800 11.2% 0.7%
family residences to high-rise apartments. These
seniors are informed, independent, and involved.
Most affluent senior market and growing. Affluence
provides the opportunity to retire to sunnier climates
Silver & Gold 2.03 63.2 $72,100 9.9% 0.8%
that feature exclusive communities. Possess free
time, stamina, and resources to enjoy the good life.
Well educated, well read, and well capitalized.
Suburban lifestyle includes home remodeling and
Savvy Suburbanites 2.85 45.1 $108,700 8.7% 3.0%
gardening plus sports and exercise. Enjoy good food
and wine, plus cultural events.
Subtotal 78.4% 7.7%
Simply, the make-up of the Oro Valley is very unique. The tapestry segmentation data is useful
information that can assist the department in better understanding the community that they serve.
The following provides a brief description of the five largest tapestry segments in Oro Valley.
3.5.1 EXURBANITES
Exurbanites residents are now approaching retirement but showing few signs of slowing down. They are
active in their communities, generous in their donations, and seasoned travelers. They take advantage
of their proximity to large metropolitan centers to support the arts, but prefer a more expansive home
style in less crowded neighborhoods. They have cultivated a lifestyle that is both affluent and urbane.
MEDIAN AGE: 51
MEDIAN HOUSEHOLD INCOME: $103,400
MARKET PROFILE:
• Prefer vehicles are late model luxury cars or SUVs.
• They are active supporters of the arts and public television/radio.
• Attentive to ingredients, they prefer natural or organic products.
• Gardening and home improvement are priorities.
14Parks and Recreation Master Plan – Phase One
• Financially active with wide-ranging investments.
3.5.2 GOLDEN YEARS
Independent, active seniors nearing the end of their careers or already in retirement best describes
Golden Years residents. This market is primarily singles living alone or empty nesters. Those still active
in the labor force are employed in professional occupations; however, these consumers are actively
pursuing a variety of leisure interests—travel, sports, dining out, museums, and concerts. They are
involved, focused on physical fitness, and enjoying their lives. This market is smaller, but growing, and
financially secure.
MEDIAN AGE: 52
MEDIAN HOUSEHOLD INCOME: $71,700
MARKET PROFILE:
• Avid readers, they regularly read daily newspapers, particularly the Sunday edition.
• Subscribe to cable TV; news and sports programs are popular.
• Use professional services to maintain their homes inside and out and minimize their chores.
• Leisure time is spent on sports (tennis, golf) or simple exercise like walking.
• Good health is a priority; Healthy eating, coupled with vitamins and dietary supplements.
• Active social lives include travel, especially abroad, plus going to concerts and museums.
• Residents maintain actively managed financial portfolios
3.5.3 THE ELDERS
With a median age of 72.3 years, this is Tapestry Segmentation’s oldest market. The Elders residents
favor communities designed for senior or assisted living, primarily in warmer climates with seasonal
populations. Most of these householders are homeowners, although their housing varies from mobile
homes to single-family residences to high-rise apartments. These seniors are informed, independent, and
involved.
MEDIAN AGE: 72
MEDIAN HOUSEHOLD INCOME: $42,800
MARKET PROFILE:
• Vehicles are just a means of transportation, but their first choice is luxury sedans.
• Banking is commonly done in person; shopping is by phone or in person.
• Shopping includes apparel and exercise equipment.
• Avid readers, with audio books and e-readers. Newspapers and magazines are staples for news
and entertainment. Cable TV is also a must, primarily watching news or movie channels, but also
golf, weather, and history channels.
• Sociable seniors, partial to a variety of clubs and organizations and generous with their time and
support.
15Town of Oro Valley Parks and Recreation
3.5.4 SILVER & GOLD
This is the most affluent senior market and is still growing. The affluence of Silver and Gold has afforded
the opportunity to retire to sunnier climates that feature exclusive communities and vacation homes.
These consumers have the free time, stamina, and resources to enjoy the good life.
MEDIAN AGE: 63
MEDIAN HOUSEHOLD INCOME: $72,100
MARKET PROFILE:
• Partial to luxury cars or SUVs; highest demand market for convertibles.
• Maintain a regular exercise regimen and pay attention to healthier eating habits.
• Pursue the luxuries that well-funded retirement affords: an active social life, travel, hobbies,
and sports (especially golf) and liberal use of home maintenance services to minimize chores.
• Avid readers of newspapers, magazines, and books.
• Generous supporters of charitable organizations.
3.5.5 FRESH AMBITIONS
Residents are well educated, well read, and well capitalized. Families include empty nesters and empty
nester wannabes, who still have adult children at home. Located in older neighborhoods outside the
urban core, their suburban lifestyle includes home remodeling and gardening plus the active pursuit of
sports and exercise. They enjoy good food and wine, plus the amenities of the Town’s cultural events.
MEDIAN AGE: 45
MEDIAN HOUSEHOLD INCOME: $108,700
MARKET PROFILE:
• Residents prefer late model, family-oriented vehicles: SUVs, minivans, and station wagons.
• Gardening and home remodeling are priorities, usually Do It Yourself.
• There is extensive use of housekeeping and personal care services.
• Foodies: They like to cook and prefer natural or organic products.
• These investors are financially active; not afraid of debt.
• Physically fit, residents actively pursue a number of sports, from skiing to golf, and invest heavily
in sports gear and exercise equipment.
16Parks and Recreation Master Plan – Phase One
ORO VALLEY DEMOGRAPHIC IMPLICATIONS
The following implications are derived from the analyses provided above.
POPULATION
• The population is increasing and is projected to experience 20% population growth over the next
15 years.
• With a modestly growing population, park and recreation services will need to strategically
invest, develop, and maintain parks and facilities in relation to current and future housing
development areas.
AGE SEGMENTATION
• Oro Valley currently has a very broad and slightly unbalanced age segmentation with the largest
group being 55+ with the second largest group being 0-17.
• Over the next 15 years, the 55+ age segment, which currently is the largest age segment in Oro
Valley, will increase by 3.6% while those who are 0-17 are projected to decrease by 2.2%, making
up 24.7% of the population by 2033.
• This is assumed to be a consequence of a vast amount of the Baby Boomer generation shifting
into the senior age segment.
• This is significant as providing access to services and programs will need to be focused on
multitude of age segments simultaneously as age segmentation is a strong determinant of
recreational preferences.
• Equal distribution across all age segments will require the Town to continue to provide programs,
services, parks and facilities that appeal to all residents of the community.
RACE AND ETHNICITY
• A homogenous population will likely focus the Town on providing traditional programming and
service offerings while always seeking to identify emerging activities and sports.
HOUSEHOLDS AND INCOME
• With median and per capita household income averages well above state and national averages,
it is important for the Town to prioritize providing offerings that are first class with exceptional
customer service while seeking opportunities to create revenue generation.
TAPESTRY SEGMENTATION
• Highly unique tapestry segmentation that indicates that Oro Valley is comprised primarily of
residents that are approaching or in retirement.
17Town of Oro Valley Parks and Recreation
CHAPTER FOUR - RECREATION TRENDS ANALYSIS
The Trends Analysis provides an understanding of national, regional, and local recreational trends as well
as recreational interest by age segments. Trends data used for this analysis was obtained from Sports &
Fitness Industry Association’s (SFIA), National Recreation and Park Association (NRPA), and Environmental
Systems Research Institute, Inc. (ESRI). All trends data is based on current and/or historical participation
rates, statistically valid survey results, or NRPA Park Metrics.
4.1.1 METHODOLOGY
The Sports & Fitness Industry Association’s (SFIA) Sports, Fitness & Recreational Activities Topline
Participation Report 2020 was utilized in evaluating the following trends:
• National Recreation Participatory Trends.
• Core vs. Casual Participation Trends.
• Non-Participant Interest by Age Segment.
The study is based on findings from surveys carried out in 2019 by the Physical Activity Council (PAC),
resulting in a total of 18,000 online interviews. Surveys were administered to all genders, ages, income
levels, regions, and ethnicities to allow for statistical accuracy of the national population. A sample size
of 18,000 completed interviews is considered by SFIA to result in a high degree of statistical accuracy.
A sport with a participation rate of five percent has a confidence interval of plus or minus 0.32 percentage
points at a 95 percent confidence level. Using a weighting technique, survey results are applied to the
total U.S. population figure of 302,756,603 people (ages six and older).
The purpose of the report is to establish levels of activity and identify key participatory trends in
recreation across the U.S. This study looked at 122 different sports/activities and subdivided them into
various categories including: sports, fitness, outdoor activities, aquatics, etc.
CORE VS. CASUAL PARTICIPATION
In addition to overall participation rates, SFIA further categorizes active participants as either core or
casual participants based on frequency of participation. Core participants have higher participatory
frequency than casual participants. The thresholds that define casual versus core participation may vary
based on the nature of each individual activity. For instance, core participants engage in most fitness
activities more than 50-times per year, while for sports, the threshold for core participation is typically
13-times per year.
In a given activity, core participants are more committed and tend to be less likely to switch to other
activities or become inactive (engage in no physical activity) than casual participants. This may also
explain why activities with more core participants tend to experience less pattern shifts in participation
rates than those with larger groups of casual participants.
18Parks and Recreation Master Plan – Phase One
4.1.2 NATIONAL SPORT AND FITNESS PARTICIPATORY TRENDS
NATIONAL TRENDS IN GENERAL SPORTS
PARTICIPATION LEVELS
The sports most heavily participated in the United States were Basketball (24.9 million) and Golf (24.3
million), which have participation figures well in excess of the other activities within the general sports
category. Followed by Tennis (17.7 million), Baseball (15.8 million), and Outdoor Soccer (11.9 million).
The popularity of Basketball, Golf, and Tennis can be attributed to the ability to compete with relatively
small number of participants. Basketball’s success can also be attributed to the limited amount of
equipment needed to participate and the limited space requirements necessary, which make basketball
the only traditional sport that can be played at the majority of American dwellings as a drive-way pickup
game. Even though Golf has experienced a recent decrease in participation in the last 5-years, it still
continues to benefit from its wide age segment appeal and is considered a life-long sport. In Addition,
target type game venues or Golf Entertainment Venues have increased drastically (84.7%) as a 5-year
trend. Using Golf Entertainment has a new alternative to breathe life back into the game of golf.
Basketball Golf Tennis Baseball Soccer
24.9 Million 24.3 Million 17.7 Million 15.8 Million 11.9 Million
FIVE-YEAR TREND
Since 2014, Golf- Entertainment Venues (84.7%), Pickleball (40.5%), and Flag Football (23.1%) have
emerged as the overall fastest growing sports. During the last five-years, Baseball (20.2%) and Indoor
Soccer (17.8%) have also experienced significant growth. Based on the trend from 2014-2019, the sports
that are most rapidly declining include Ultimate Frisbee (-49.4%), Squash (-23.4%), Touch Football (-
21.5%), Badminton (-15.1%), and Tackle Football (-14.6%).
ONE-YEAR TREND
In general, the most recent year shares a similar pattern with the five-year trends; with Boxing for
Competition (8.2%), Golf-Entertainment Venues (6.7%), and Pickleball (4.8%) experiencing the greatest
increases in participation this past year. However, some sports that increased rapidly over the past five
years have experienced recent decreases in participation, such as Rugby (-10.8%) and Gymnastics (-1.5%).
Other sports including Ultimate Frisbee (-15.5%), Sand Volleyball (-7.8%), Roller Hockey (-6.8%), and
Touch Football (-6.3) have also seen a significant decrease in participation over the last year.
CORE VS. CASUAL TRENDS IN GENERAL SPORTS
Highly participated in sports, such as Basketball, Baseball, and Slow Pitch Softball, have a larger core
participant base (participate 13+ times per year) than casual participant base (participate 1-12 times per
year). In the past year, Ice Hockey and Softball -Fast Pitch have increased core participation. While less
mainstream sports, such as Boxing for Competition, Roller Hockey, Badminton, and Racquetball have
larger casual participation base. These participants may be more inclined to switch to other sports or
fitness activities.
19Town of Oro Valley Parks and Recreation
National Participatory Trends - General Sports
Participation Levels % Change
Activity
2014 2018 2019 5-Year Trend 1-Year Trend
Basketball 23,067 24,225 24,917 8.0% 2.9%
Golf (9 or 18-Hole Course) 24,700 24,240 24,271 -1.7% 0.1%
Tennis 17,904 17,841 17,684 -1.2% -0.9%
Baseball 13,152 15,877 15,804 20.2% -0.5%
Soccer (Outdoor) 12,592 11,405 11,913 -5.4% 4.5%
Golf (Entertainment Venue) 5,362 9,279 9,905 84.7% 6.7%
Softball (Slow Pitch) 7,077 7,386 7,071 -0.1% -4.3%
Football, (Flag) 5,508 6,572 6,783 23.1% 3.2%
Volleyball (Court) 6,304 6,317 6,487 2.9% 2.7%
Badminton 7,176 6,337 6,095 -15.1% -3.8%
Soccer (Indoor) 4,530 5,233 5,336 17.8% 2.0%
Football, (Touch) 6,586 5,517 5,171 -21.5% -6.3%
Football, (Tackle) 5,978 5,157 5,107 -14.6% -1.0%
Gymnastics 4,621 4,770 4,699 1.7% -1.5%
Volleyball (Sand/Beach) 4,651 4,770 4,400 -5.4% -7.8%
Track and Field 4,105 4,143 4,139 0.8% -0.1%
Cheerleading 3,456 3,841 3,752 8.6% -2.3%
Pickleball 2,462 3,301 3,460 40.5% 4.8%
Racquetball 3,594 3,480 3,453 -3.9% -0.8%
Ice Hockey 2,421 2,447 2,357 -2.6% -3.7%
Ultimate Frisbee 4,530 2,710 2,290 -49.4% -15.5%
Softball (Fast Pitch) 2,424 2,303 2,242 -7.5% -2.6%
Lacrosse 2,011 2,098 2,115 5.2% 0.8%
Wrestling 1,891 1,908 1,944 2.8% 1.9%
Roller Hockey 1,736 1,734 1,616 -6.9% -6.8%
Boxing for Competition 1,278 1,310 1,417 10.9% 8.2%
Rugby 1,276 1,560 1,392 9.1% -10.8%
Squash 1,596 1,285 1,222 -23.4% -4.9%
NOTE: Participation figures are in 000's for the US population ages 6 and over
Modera te Modera te
La rge Increa s e La rge Decrea s e
Legend: (grea ter tha n 25%)
Increa s e Decrea s e
(l es s tha n -25%)
(0% to 25%) (0% to -25%)
20Parks and Recreation Master Plan – Phase One
NATIONAL TRENDS IN GENERAL FITNESS
PARTICIPATION LEVELS
Overall, national participatory trends in fitness have experienced strong growth in recent years. Many
of these activities have become popular due to an increased interest among Americans to improve their
health and enhance quality of life by engaging in an active lifestyle. These activities also have very few
barriers to entry, which provides a variety of options that are relatively inexpensive to participate in and
can be performed by most individuals. The most popular general fitness activities amongst the U.S.
population include: Fitness Walking (111.4 million), Treadmill (56.8 million), Free Weights (51.4 million),
Running/Jogging (49.5 million), and Stationary Cycling (37.1 million).
Fitness Treadmill Dumbbell Running/ Stationary
Walking Free Weights Jogging Cycling
56.8 Million
111.4 Million 51.4 Million 49.5 Million 37.1 Million
FIVE-YEAR TREND
Over the last five years (2014-2019), the activities growing most rapidly are Trail Running (46.0%), Yoga
(20.6%), Cross Training Style Workout (20.2%), and Stationary Group Cycling (17.5%). Over the same time
frame, the activities that have undergone the biggest decline include: Traditional Triathlon (-9.2%),
Running/Jogging (-8.7%), Free Weights (-8.3%), and Fitness Walking (-1.0%)
ONE-YEAR TREND
In the last year, activities with the largest gains in participation were Trail Running (9.9%), Dance, Step,
& Choreographed Exercise (7.0%), and Yoga (6.0%). From 2018-2019, the activities that had the largest
decline in participation were Traditional Triathlons (-7.7%), Non-Traditional Triathlon (-7.4%),
Bodyweight Exercise (-2.8%), and Running/Jogging (-2.6%).
CORE VS. CASUAL TRENDS IN GENERAL FITNESS
The most participated in fitness activities all have a strong core users base (participating 50+ times per
year). These fitness activities include: Fitness Walking, Treadmill, Free Weights, Running/Jogging,
Stationary Cycling, Weight/Resistant Machines, and Elliptical Motion/Cross Training, all having 48% or
greater core users.
21Town of Oro Valley Parks and Recreation
National Participatory Trends - General Fitness
Participation Levels % Change
Activity
2014 2018 2019 5-Year Trend 1-Year Trend
Fitness Walking 112,583 111,001 111,439 -1.0% 0.4%
Treadmill 50,241 53,737 56,823 13.1% 5.7%
Free Weights (Dumbbells/Hand Weights) 56,124 51,291 51,450 -8.3% 0.3%
Running/Jogging 54,188 50,770 49,459 -8.7% -2.6%
Stationary Cycling (Recumbent/Upright) 35,693 36,668 37,085 3.9% 1.1%
Weight/Resistant Machines 35,841 36,372 36,181 0.9% -0.5%
Elliptical Motion Trainer 31,826 33,238 33,056 3.9% -0.5%
Yoga 25,262 28,745 30,456 20.6% 6.0%
Free Weights (Barbells) 25,623 27,834 28,379 10.8% 2.0%
Dance, Step, & Choreographed Exercise 21,455 22,391 23,957 11.7% 7.0%
Bodyweight Exercise 22,390 24,183 23,504 5.0% -2.8%
Aerobics (High Impact/Intensity Training HIIT) 19,746 21,611 22,044 11.6% 2.0%
Stair Climbing Machine 13,216 15,025 15,359 16.2% 2.2%
Cross-Training Style Workout 11,265 13,338 13,542 20.2% 1.5%
Trail Running 7,531 10,010 10,997 46.0% 9.9%
Stationary Cycling (Group) 8,449 9,434 9,930 17.5% 5.3%
Pilates Training 8,504 9,084 9,243 8.7% 1.8%
Cardio Kickboxing 6,747 6,838 7,026 4.1% 2.7%
Boot Camp Style Cross-Training 6,774 6,695 6,830 0.8% 2.0%
Martial Arts 5,364 5,821 6,068 13.1% 4.2%
Boxing for Fitness 5,113 5,166 5,198 1.7% 0.6%
Tai Chi 3,446 3,761 3,793 10.1% 0.9%
Barre 3,200 3,532 3,665 14.5% 3.8%
Triathlon (Traditional/Road) 2,203 2,168 2,001 -9.2% -7.7%
Triathlon (Non-Traditional/Off Road) 1,411 1,589 1,472 4.3% -7.4%
NOTE: Participation figures are in 000's for the US population ages 6 and over
Modera te Modera te
La rge Increa s e La rge Decrea s e
Legend: (grea ter tha n 25%)
Increa s e Decrea s e
(l es s tha n -25%)
(0% to 25%) (0% to -25%)
22Parks and Recreation Master Plan – Phase One
NATIONAL TRENDS IN OUTDOOR RECREATION
PARTICIPATION LEVELS
Results from the SFIA report demonstrate a contrast of growth and decline in participation regarding
outdoor/adventure recreation activities. Much like the general fitness activities, these activities
encourage an active lifestyle, can be performed individually or within a group, and are not as limited by
time constraints. In 2019, the most popular activities, in terms of total participants, from the
outdoor/adventure recreation category include: Day Hiking (49.7 million), Road Bicycling (39.4 million),
Freshwater Fishing (39.2 million), and Camping within ¼ mile of Vehicle/Home (28.2 million), and
Recreational Vehicle Camping (15.4 million).
Hiking Bicycling Fishing Camping Camping
(Day) (Road) (Freshwater) (Town of Oro Valley Parks and Recreation
National Participatory Trends - Outdoor / Adventure Recreation
Participation Levels % Change
Activity
2014 2018 2019 5-Year Trend 1-Year Trend
Hiking (Day) 36,222 47,860 49,697 37.2% 3.8%
Bicycling (Road) 39,725 39,041 39,388 -0.8% 0.9%
Fishing (Freshwater) 37,821 38,998 39,185 3.6% 0.5%
Camping (< 1/4 Mile of Vehicle/Home) 28,660 27,416 28,183 -1.7% 2.8%
Camping (Recreational Vehicle) 14,633 15,980 15,426 5.4% -3.5%
Fishing (Saltwater) 11,817 12,830 13,193 11.6% 2.8%
Birdwatching (>1/4 mile of Vehicle/Home) 13,179 12,344 12,817 -2.7% 3.8%
Backpacking Overnight 10,101 10,540 10,660 5.5% 1.1%
Bicycling (Mountain) 8,044 8,690 8,622 7.2% -0.8%
Archery 8,435 7,654 7,449 -11.7% -2.7%
Fishing (Fly) 5,842 6,939 7,014 20.1% 1.1%
Skateboarding 6,582 6,500 6,610 0.4% 1.7%
Roller Skating, In-Line 6,061 5,040 4,816 -20.5% -4.4%
Bicycling (BMX) 2,350 3,439 3,648 55.2% 6.1%
Climbing (Traditional/Ice/Mountaineering) 2,457 2,541 2,400 -2.3% -5.5%
Adventure Racing 2,368 2,215 2,143 -9.5% -3.3%
NOTE: Participation figures are in 000's for the US population ages 6 and over
Modera te Modera te
La rge Increa s e La rge Decrea s e
Legend: (grea ter tha n 25%)
Increa s e Decrea s e
(l es s tha n -25%)
(0% to 25%) (0% to -25%)
24Parks and Recreation Master Plan – Phase One
NATIONAL TRENDS IN AQUATICS
PARTICIPATION LEVELS
Swimming is deemed as a lifetime activity, which is most likely why it continues to have such strong
participation. In 2019, Fitness Swimming was the absolute leader in overall participation (28.2 million)
amongst aquatic activities, largely due to its broad, multigenerational appeal.
Swimming Aquatic Swimming
(Fitness) Exercise (Competition)
28.2 Million 11.2 Million 2.8 Million
FIVE-YEAR TREND
Assessing the five-year trend, all aquatic activities have experienced growth. Aquatic Exercise stands
out having increased (22.7%) from 2014-2019, most likely due to the ongoing research that demonstrates
the activity’s great therapeutic benefit, followed by Fitness Swimming (11.5%) and Competition
Swimming (4.1%).
ONE-YEAR TREND
From 2018-2019, Competition Swimming (-7.3%) was the only aquatic activity that declined in
participation. While both Aquatic Exercise (6.4%) and Fitness swimming (2.3%) experienced increases
when assessing their one-year trend.
CORE VS. CASUAL TRENDS IN AQUATICS
All aquatic activities have undergone increases in participation over the last five years, primarily due to
large increases in casual participation (1-49 times per year). From 2014 to 2019, casual participants for
Aquatic Exercise (35.7%), Competition Swimming (22.7%), and Fitness Swimming (18.4%) have all grown
significantly. However, all core participation (50+ times per year) for aquatic activities have decreased
over the last five-years.
National Participatory Trends - Aquatics
Participation Levels % Change
Activity
2014 2018 2019 5-Year Trend 1-Year Trend
Swimming (Fitness) 25,304 27,575 28,219 11.5% 2.3%
Aquatic Exercise 9,122 10,518 11,189 22.7% 6.4%
Swimming (Competition) 2,710 3,045 2,822 4.1% -7.3%
NOTE: Participation figures are in 000's for the US population ages 6 and over
Modera te Modera te
La rge Increa s e La rge Decrea s e
Legend: (grea ter tha n 25%)
Increa s e Decrea s e
(l es s tha n -25%)
(0% to 25%) (0% to -25%)
25Town of Oro Valley Parks and Recreation
NATIONAL TRENDS IN WATER SPORTS / ACTIVITIES
PARTICIPATION LEVELS
The most popular water sports / activities based on total participants in 2019 were Recreational Kayaking
(11.4 million), Canoeing (8.9 million), and Snorkeling (7.7 million). It should be noted that water activity
participation tends to vary based on regional, seasonal, and environmental factors. A region with more
water access and a warmer climate is more likely to have a higher participation rate in water activities
than a region that has a long winter season or limited water access. Therefore, when assessing trends
in water sports and activities, it is important to understand that fluctuations may be the result of
environmental barriers which can greatly influence water activity participation.
Kayaking Canoeing Snorkeling Jet Skiing Sailing
11.4 Million 9.0 Million 7.7 Million 5.1 Million 3.6 Million
FIVE-YEAR TREND
Over the last five years, Stand-Up Paddling (29.5%) and Recreational Kayaking (28.5%) were the fastest
growing water activity, followed by White Water Kayaking (9.9%) and Surfing (8.9%). From 2014-2019,
activities declining in participation most rapidly were Water Skiing (-20.1%), Jet Skiing (-19.6%), Scuba
Diving (-13.7%), Wakeboarding (-12.7%), and Snorkeling (-12.5%).
ONE-YEAR TREND
Similarly, to the five-year trend, Recreational Kayaking (3.3%) and Stand-Up Paddling (3.2%) also had the
greatest one-year growth in participation, from 2018-2019. Activities which experienced the largest
decreases in participation in the most recent year include: Boardsailing/Windsurfing (-9.7%), Sea
Kayaking (-5.5), and Water Skiing (-4.8%)
CORE VS. CASUAL TRENDS IN WATER SPORTS/ACTIVITIES
As mentioned previously, regional, seasonal, and environmental limiting factors may influence the
participation rate of water sport and activities. These factors may also explain why all water-based
activities have drastically more casual participants than core participants, since frequencies of activities
may be constrained by uncontrollable factors. These high casual user numbers are likely why a majority
of water sports/activities have experienced decreases in participation in recent years.
26You can also read